5196106429
The relationship between the temperaturę differcntial of the two junc-tions of a thermocouple and the result-ing output voltage is not linear. In fact it’s close to a parabohc curve. This tends to complicate matters a little, as we*ll see shortly.
To make it easier to use thermocou-ples madę from each combination of metals, the manufacturers provide cali-bration tables showing the Seebeck output voltage against junction temperaturę. Table 2 shows the calibration table for a type K thermocouple, which is one using Nickel-Chromium alloy (“Chromel”) and Nickel-Aluminium alloy (“Alumel”) as the two metals.
To use a thermocouple for measuring temperaturę, one of the two junctions is arranged to be held at a known “refer-ence” temperaturę while the other junction is used as the measuring or “ac-tive” junction. The differential Seebeck voltage produced (Vm) is then mea-sured.
For rcally accurate measurements, the reference junction should be held at an accurately controlled temperaturę, say by placing it in a Container of melting ice (()°C). However for many purposes it is sufficient to have the reference junction at room temperaturę, provided that this can be measured fairly accu-rately using a normal thermometer.
Now if the relationship between temperaturę and Seebeck voltage were linear, we could work out the true temperaturę of the active junction by look-ing up the temperaturę difference corre-sponding to Vm, and then simply add the temperaturę of the reference junction to this. However because the relationship is parabolic rather than linear, this method is not accurate (see Fig.2). So instead we have to use:
Va = Vm + Vr
where Va is the Seebeck voltage which corresponds to the true temperaturę of the active junction, Vm is the measured differential voltage Vm, and Vr is the reference junction Seebeck soltage — looked up from the table after measuring the temperaturę of the reference junction using a thermometer.
In other words, we have to mcasure Vm, and add this to the reference junction voltage Vr looked up from the table. This gives the Va actually being produced by the active junction. Then we go back to the table with Va, to find the actual temperaturę Ta of the active junction.
Therc’s another smali complication. In practice, it*s not really feasible to have the thermocouple mcasurement

Fig.2: The relationship between temperaturę and the Seebeck voltage generated is not linear, but parabolic. This causes a few complications, as explained in the text.
Circuit wired entirely using the two metals used in the thermocouple itself. So the reference junction tends to get “split in two” by the extemal Circuit — see Fig.3. The two resulting halves of the junction are where each of the two active junction metals are joined to the external wiring (Jrl and Jr2). This causes nó problems, provided that the two reference half-junctions are held at the same temperaturę, and the leads used to connect them to the extemal Circuit are madę from the same metal.
Over the years, thermocouples have been used for various things — mainly for measuring high temperatures, but not exclusively. Fig.4 shows a smali non-inductive resistor/thermocouple combination housed in a glass vacuum envelope, and used for measuring the power produced by RF oscillators. The power is fed into the resistor, whose temperaturę naturally rises proportional to the RMS power level. The thermocouple output can thus be calibrated in teims of RF power level, knowing its Seebeck voltage characteristic. This kind of RF power measurement tech-nique can be quite accurate and was fairly widely used before other methods were developed.
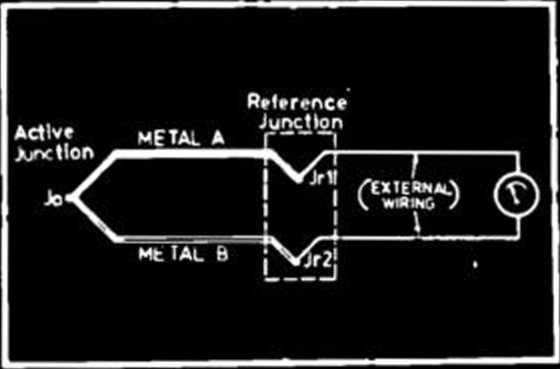
Fig.3: In practice, the reference junction is split into two half junctions Jr1 and Jr2t where the thermoelectric metals are joined to the external Circuit.
Practical thermocouples for measuring high temperatures directly tend to takc a variety of forms. In the simplest case, they may be little morę than a thin wire of each metal, fed through beads of ceramic insulator and spot-welded to-gether to form the active junction (Fig.5). This kind of thermocouple can be used to measurc the temperaturę in a smali pottery kiln, for example.
For measurements in very corrosive or rcactive environmcnts, such as Chemical vapours, molten metals or flamcs, it becomes necessary to encase the basie thermocouple with a protec-tive sheath. As this must generally be madę of metal, the thermocouple wires thcmseUes must be encased in an insu-lating materiał insidc the-sheath.-
There are three normal ways of doing this, shown in Fig.6. The first method (a) lcaves the active junction itself ex-posed, in order to get a fast response time for measurements. However this cannot be used in highly corrosive or reactive environments.
The second method (b) encases the junction itself in insulation and sheath, as weII as the leads. This gives good protection, but slows down the response to temperaturę changes because of the thermal resistance of the sheath and (morę importantly) the insulation.
This shorteoming is overcome in the third method (c), where the junction is bonded to the inside of the sheath. This gises fast response, along with fuli protection.
A smali low-cost type K thermocouple with a stainless Steel sheath is shown in Fig.7. This measures 4mm in diame-ter and is 150mm long, with leads 520mm long. Designed for measurements to about 9(X)°C, it was madę by local firm Richard Foot of 26-30 Tepko Road, Terrey Hills, NSW 2084.
Typically and until very recently the

Fig.4: A smali vacuum-enclosed thermocouple and load resistor combination, of the type used to measure RF power.
*
ELECTRONICS Australia. September 1987 91
Wyszukiwarka
Podobne podstrony:
POSTER SESSION. H28 LOW TEMPERATURĘ MEASUREMENTS OF SHIFT AND BROAD-ENING OF CO AND C02 LINES WITH N
202 Seebacher, F. (2009). "Responses to temperaturę variation: integration of thermoregulation
Comparison of theory and test result 9 " Israeli Syn Jet Engines Turbi Jet temperaturę alo
Slajd69 Bielactwo - odbarwianie Fig. 3.11 -2Resłdualpatches of pigmentation(a)and (b) finał results
17770 Slajd69 Bielactwo - odbarwianie Fig. 3.11 -2Resłdualpatches of pigmentation(a)and (b) finał re
Battle of Thermopylae and movements to Salamis,H0? Houlo GULF OF MALIS £phetae Artemiaum ThermoplaiE
surface relief, subsoil relief (with isohypses every decimeter) give an exact picture of the relatio
Effect Of Dividends On Stock Prices 17 relationship between the Earnings per Share and Stock Market
Effect Of Dividends On Stock Prices 18 The objective of this study is to analysis the relationship b
SERVICE BLUEPRINT 101 A diagram that visualizes the relationships between different service componen
61 Figurę 2.2 Relationship between mass and sex independent BMR and the natural rangę of minimal&nbs
1Toksyczność Me od?wki THE TOXICITY OF HEAVY ELEMENTS TO HUMAŃ BEINGS (b) Toxic element* Fig. 15.1 T
Ryc. 21. Zależność pomiędzy NDVI i wysokością trawy (h) Relationship between NDVI and height of the
więcej podobnych podstron