6585844982
Israei
190

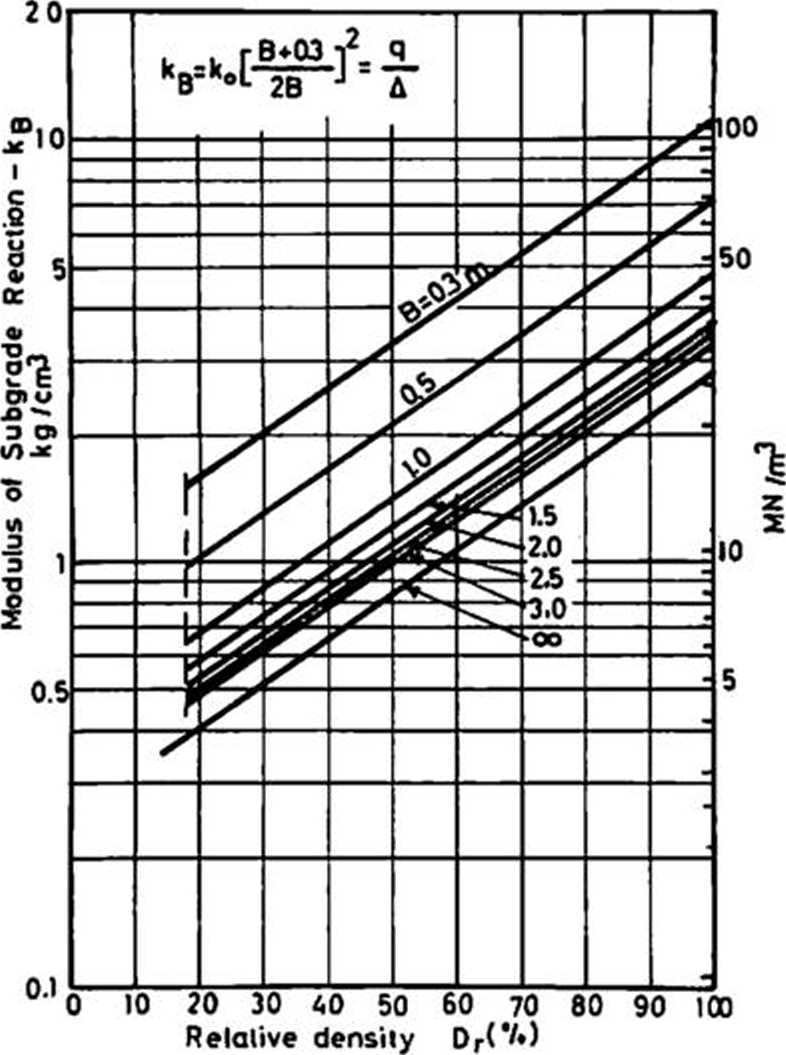
Fig. 8 - Modulus of Subgrade Reaction
versus Relative Density
times discontinuous and the sampler fell freely after receiving a number of blows. These "free falls", of up to 60 era, were found especially where a hard thin layer was encountered. This behaviour indica-ted piąte formations with an einpty space or very loose sand layers in between. It is obvious that in such a case the SPT number by itself is meaningless.
In another site, both pressuremeter tests and SPT were performed and large varia-tions occurred in the blow counts from two adjacent borings only two meters apart. In one boring the N values ranged from 10 to 20 and in the other from 10 to 100 throughout a depth of 20 meters. Menard pressuremeter results in the boring with high blow counts showed Iow Es valuesr ranging from 0 to 120 kg/cm2.
It is thought that the SPT results were influenced markedly by the presence of thin layers of sandstone and gravel, and did not properly measure the relative density of the sand and gravel.
The use of the standard penetration test as a tool for both the design and con-struction stages of fills under water may be illustrated by the following example.
At one of the Israeli ports an area was reclaimed by dumping a sand and gravel fili behind a sheet pile retaining wali.
The fili was a well-graded materiał ran*-ging from 100 percent finer than 6.3 cm to less than 10 per cent passing the 200-mesh sieve. Maximum dry density was 2130 kg/ra3 and minimum density was 1850 kg/m . The thickness of the fili varied from zero to eight meters. Design loa-dings on shallow foundations were expec-ted to be at least 1 kg/cm2 and settle-ments could be critical. Existing dum-ped fili was tested by SPT methods to determine the original density, as placed and the changes after trying out several methods of improving the fili, such as:
a) placing a surcharge of about 10 ton/ m2 on the existing sand and gravel;
b) compacting the surface of the sand and gravel with 20 passes of a heavy BOMAG vibratory roller, and
c) using vibroflotation.
The original dumped fili, by interpre-tation of SPT values, had a relative density of about 45 per cent, except near the surface where construction traf-fic had produced dense conditions with a Dr indicated to be morę than 100 per cent
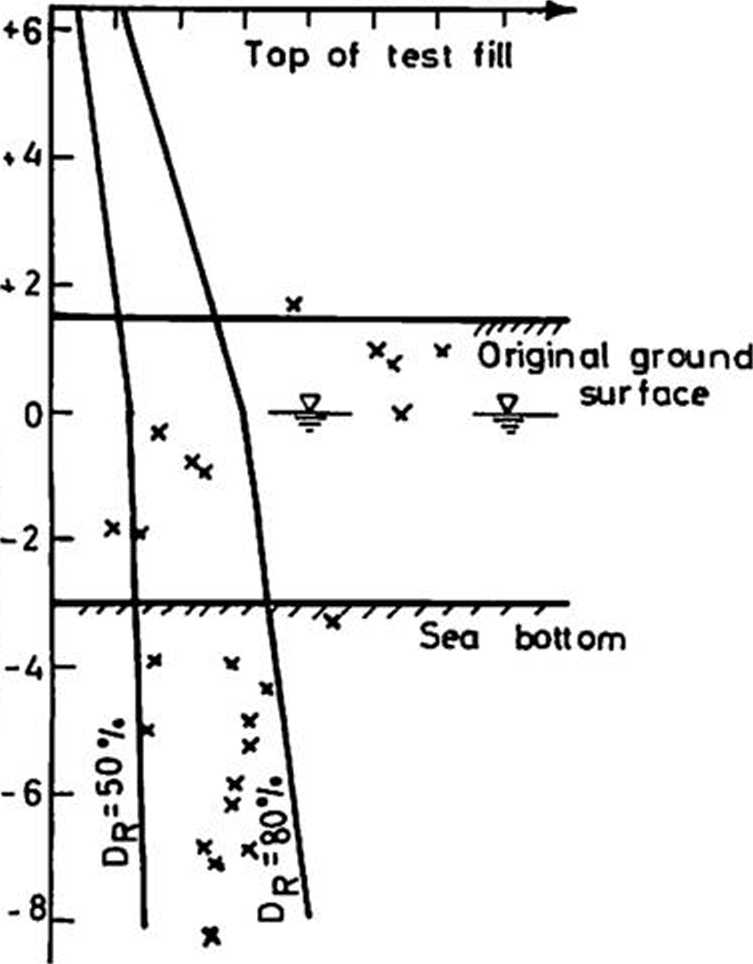
After placeroent of a test fili surcharge SPT results were obtained, as shown in Fig. 9.
No oł Blows S.P. T Ń 0 10 20 30 40 50 60 70

Fig. 9 - SPT Results as Influenced
by Test Fili
They are higher than original values be-cause of.the extra vertical pressure but did not indicate a large increase in the relative density of the deeper fili ma-terials. Measured settlement under the surcharge fili was found to average 6.6 cm of which 3.8 cm'occurred after
Wyszukiwarka
Podobne podstrony:
measurement and the valuation of stocks: FIFO, LIFO, HIFO, AVCO; Profit measurement and the problem
tion of thc shell. Thesc questions are revisited here and the elastic re-sponsc of the shell in term
Slajd39 (6) Fig. 10 An allergic reaction to red tattoo pigment is evident (A,B) by the raised scaly
Slajd68 Bielactwo - kamuflaż Fig. 3.9.2 (a-d)Camouflaging of facia I vrtiligo in Iwo dark skinned pa
564 UN DfiBAT : LES MENTALITfiS COLLECTIYES 8 Fig. 2. Holders of publlc offices, men of busines
AMP ATP- sulfurylaza Fig. 3. Reakcje II fazy (reakcje sprzęgania) (29). Fig. 3. II chase (coupling)
S5002321 260 MSeckć Żehrovicc in Bohemia Fig. 2. Interpretation of the ground plan ofbuilding 0/87-1
9. Chemical kinetics - calculating the ratę constant of the reactions and the progress of elementary
Fig. 3. Behavior of CO and C02 conceniration in the stack gases as a function of stoichiometric raii
Slajd68 Bielactwo - kamuflaż Fig. 3.9.2 (a-d)Camouflaging of facia I vrtiligo in Iwo dark skinned pa
16 TRIBOLOGIA 4-2003 Rys. 3. Widok nalepienia Al na powierzchni narzędzia Fig. 3. View of the a
więcej podobnych podstron