7884079601
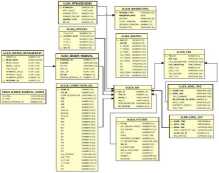
Figurę 5. Alignment corrections tables structure.
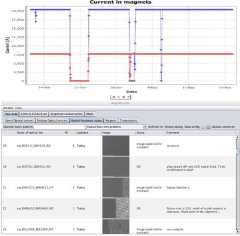
Figurę 6. AłignGUI example functionalities.
6. Summary
The alignment monitoring system has been running smoothly over the whole ATLAS data taking period from 2009 to 2013. The tools developed and the data model implemented in Oracle were very effective in spotting problems during the installation of the optical system, and for the daily follow up by the alignment experts.
References
[1] Van Der GRAAF H, Groenstege H, Linde F and Rewiersma P 2000 NIKHEF/ET38110
[2] Hashemi K S and Bensinger J 2000 The bcam camera Tech. Rep. ATL-MUON-2000-024 CERN Geneva
[3] Barriere J C, Bauer F, Fontaine M, Formica A, Gautard V, Giraud P F, Graaf H, Guyot C, Hart R, Horvat
S, Kortner O, Kotov S, Kroha H, Linde F, Ponsot I, Potrap I and Schune P 2008 The alignment system of the barrel part of the ATLAS muon spectrometer Tech. Rep. ATL-MUON-PUB-2008-007. ATL-COM-MUON-2008-002 CERN URL http://cdsweb.cern.ch/record/1081769
[4] Oracle (Jan 2014) URL http://www.oracle.com/technetwork/database/features/data-integration
[5] Valassi A, Basset R, Clemencic M, Pucciani G, Schmidt S A and Wachę M 2008 Nuclear Science Symposium
Conference Record, 2008. NSS ’08. IEEE pp 3021-3028 ISSN 1095-7863
[6] Wikipedia (Jan 2014) Javaplatformenterprise edition. URLhttp://en.wikipedia.org/wiki/JavaPlatform,
Enterpri seEdit ion
[7] Roe S et al. 2010 Journal of Physics: Conference Series vol 219 (IOP Publishing) p 042021
[8] Brun R and Rademakers F 1997 Nuclear Instruments and Methods in Physics Research Section A: Accelerators,
Spectrometers, Detectors and Associated Eąuipment 389 81-86
[9] Fleury M and Reverbel F 2003 Proceedings of the ACM/IFIP/USENIX 2003 International Conference on
Middleware (Springer-Yerlag New York, Inc.) pp 344-373
Wyszukiwarka
Podobne podstrony:
49240 scan0015 (8) 344 HANDBOOK OF ECOTOXICOLOGY Naphthalene Figurę 14.2 Examples of PAH compounds w
26062 The example P T net N Figurę ł; The example P/T net N
00079 ?4addfcc1ad8f7adb124bf9726a6931 78 Hembree & Zimmer Figurę 13. Weighting Function. model
5) Oracle Database for the alignment monitoring tables, optical sensors data and conditions data, ma
78 (94) 78ALTITUDE CORRECTION TABLES 0°-35°—MOON i AE: 0 -4’ j*-V io°-i4* *5*“ł9c 20
79 (94) 79ALTITUDE CORRECTION TABLES 35° 90°—MOON A
5) Oracle Database for the alignment monitoring tables, optical sensors data and conditions data, ma
371 (7) Załącznik 8STRONA A4 ROCZNIKA ASTRONOMICZNEGO i A4 ALTITUDE CORRECTION TABLES—ADDITIONAL
372 (8) Załącznik 9Strona XXXIV ROCZNIKA ASTRONOMICZNEGOALTITUDE CORRECTION TABLES
rulespage10 STRATEGYI Figurę 5. The player in this example will need to reorganize his Power Structu
rulespage10 STRATEGYI Figurę 5. The player in this example will need to reorganize his Power Structu
rulespage10 STRATEGYI Figurę 5. The player in this example will need to reorganize his Power Structu
00062 888f2413ab42be73c0b3da9157e2d3 61 Adaptive Hierarchical Bayesian Kalman Filtering Figurę 3.
00142 4a32d94087a89c1d3df436ea34de80 143Optimization and Sensitiyity Analysis $311.96 $310.88 $310
00228 c833f71b9f2a382663c8b3b0c1f1814 230 Baxley Figurę 9. Example of Manuał Implementation of EWMA
więcej podobnych podstron