
Bringing sexy back – stochastics by Boxingislife
Introduction
I, Forexpiet, made this summary from a thread on Forex Factory. I needed it to get a clear picture of the
method. Now, by means of this document, I want to thank Boxingislife and all who contributed in the thread.
Before posting this document I asked the main contributor Boxingislife for permission by PM. The others I
asked for permission on the forum of FF.
Most of the times “I” is equal to Boxingislife, although not relevant for understanding he is the one who gets
most of the credits.
Note for the reader:
You should be aware of the fact that what I summarized was important for me. Maybe when you read the
whole thread you pick up points which are important for you!
The setup of the system
1 st Stochastics called the 20:
k:20
d:10
slowing:20
Format: royal blue thickness is 4 , signal line dotted thickness is 1
2nd stochastics, called the 50, in the same window.
k:50
d:10
slowing:20
Format: orange red same thickness and everything as 20
3rd stochastics, called the 5, in the same window. this one is for entry.
k:5
d:3
slowing:3
Format: lime green and the thickness is 2 for both lines
4th stochastics, called the 100, in the same window. This if for 1H+.
k: 100
d: 10
slowing: 30
Format: yellow same as 20 and 50 with thickness and style
for all stochastics: MA method is simple and price field is low/high
Indication:
Look at the 20 and the 50 and see what they are doing.

Downtrend: you want the 20 to be crossed down with its signal line and the 50 to be doing the
same.
Extra hindsigth: this is not necessary but when the 20 is below the 50 then that’s the first hint
the trend is down
Uptrend: you want the 20 to be crossed up with its signal line and the 50 to be doing the same.
Extra hindsigth: this is not necessary but when the 20 is above the 50 then that’s the first hint
the trend is up
Attention: sometimes the 20 and 50 are really close to each other which should make you
cautious about taking trades.
Taking trades
Downtrend:
We want the 5 to go into overbought, basically we are looking for a pullback. As soon as the 5
cross back down we enter. if a nice tiny little consolidation formed and 20 and 50 are trending
down and nicely then enter at that even if the 5 did not make it to overbought we enter when it
crosses back down.
Uptrend:
We want the 5 to go into oversold, basically we are looking for a pullback. As soon as the 5
cross back up we enter. If a nice tiny little consolidation formed and 20 and 50 are trending up
and nicely then enter at that even if the 5 did not make it to oversold we enter when it crosses
back up.
Remarks:
- the cross of the 20 and 50 is not so reliable. like an MA cross it can be tricky. but its good to
look at because it can keep u away from bad trades.
- when the 20 cross its signal line, look at how steep its going up or down and also look at the
space between the main line and the signal. The bigger the space the better the trade will be.
Same with the slope the steeper it is the better. This is stuff that after a few examples you will
learn to see for yourself and you will know when its nice and trendy and when its being
naughty.
- the 5 does not have to pull back all the way into oversold or overbought area. wait for a
consolidation of price or for stochs to cross then enter. in a strong trend u can easily see when
price stalls before continuing.
-I wait for the 5 to cross and the candle to close when its not the perfect setup. for example if
20 and 50 are above 80 means its an uptrend but if they crossed their signals down means its
starting to trend down so in that case to be more on the safe side I wait for the bar to close
and the 5 to cross.
otherwise if everything is pointing for a good trade then I enter once price has consolidated or
when I see a reversal bar
the 100 stochastics is mainly for timeframes of 1h or longer. its just extra confirmation

perfect long trade:
20 cross the 50 up.
20 and 50 both crossed their signal line up and are sloped nicely
5 pulls back all the way into oversold while price is stalling and consolidating.
Advices:
For anyone trying this system I suggest sticking to 2-3 pairs with 5 and 15 min chart each. u
dont need to look at more or else you will go nuts. I mainly watch gbpusd and usdchf on 5 and
15 but I glance at other pairs and timeframes and take trades. But I strongly suggest to stick
to 5 and 15 min on 2-3 pairs
I think the main thing is to enter GOOD trades and MINIMIZE your losses! Get that under
control and the rest will fall into place
Stops and Exits:
A nice and easy way to get out is when the 5 stochastics goes oversold or overbought.
You can exit and wait to see if another signal is happening.
I also take in consideration the time frame I am using if it is 5 or 15 then I aim for 15-20 pips
mostly 15. Stop is usually 10-15, but since I only look for the best setups then my hit rate is
pretty high.
A typical stop on gbpjpy would be 20-25 pips with a target of around the same or a bit higher
around 30 pips. But trading gbpjpy on 15 min chart is a bit scary.
You should add the spreads or at least part of it to an already decent stop or target.
As with exit strategies. During the Asian session or towards the end of the US session I'm only
looking for 10-15 pip gains because there isn't much action.
During the London Open through London Close you get much more action so I try to get
anywhere from 25-50 pips. It all depends on what I see setting up on the charts and the candle
formations. If I see hammers, doji's, railroad track, etc. Then I go ahead and take my profits
then usually because a reversal could be coming up.
I think the main thing is to enter GOOD trades and MINIMIZE your losses! Get that under
control and the rest will fall into place.
Look for a few things:
time of day
pair's daily range
how good of a setup it is
consolidation
for 5 to get to an extreme number
Which pairs
I mainly focus on gbpusd usdchf gbpjpy, eurjpy, while checking some others every now and
then like eurusd, usdjpy, audusd. But I try to stick to 2-3 pairs. No more otherwise I wil go
insane.
I have been trading this for several month using only the best setups and sticking to the rules.

Overbought and Oversold
As for the pull backs when the 20 and 50 are oversold or overbought thats the slingshot system
by buffy. Its a high percentage trend trade. I also look for those but my main setup and perfect
trade is the examples i have posted in here.
Multiple time frames
Generally the longer time frame is the one with the better results but that is not always the
case.
Two things off the top of my head:
1. If the 1h is not up or down and the 15 is down then you are gonna look to short and
vice versa.
2. If theres opposite signals then look for how price is behaving: is price trending up
strongly? is there any divergence? things like that but an even easier way to avoid all
this mess is do not trade that pair
simple as that. And that is what I do sometimes.
The more confirmation the better but sometimes looking into it too much, well to me it
makes me wanna not trade anymore.
There is plenty of pairs with at least 1 perfect setup everyday that agrees with a higher time
frame. No need to take a trade and be nervous the whole time.
(Problem: My main problem is trying to figure out the best time frame to take the signal,
because not only is there at least 1 perfect set up in most pairs per day, but there also seems
to be at least more than 1 perfect setup in different timeframes for the same pair, e.g. going
short on a 4H chart, and going long on a 15M chart!!)
There is no ideal timeframe. Each has its own characteristics and what not. Each timeframe has
its own stops and targets and all this stuff. It can depend on your availability. If you are
available around volatile times for a while then trade off the 15 min unless there is a nice 1h
signal. If you can periodically check then the 1h chart should give nice trades pretty often.
It also depends on the pair. Do not trade a pair with a 15 pip spread off the 5 min chart. That is
just asking to lose money. And do not trade the euro for example off the 5 or 15 min during
the asian session. Your chances of that trade making pips is very low.
So it really depends on all this stuff and I cant actually tell u what to do and when and what to
trade because one thing might work for me but not for you. But in the end you can make all
timeframes work and any pair.
I suggest you start with 15 min and 1h and if you do not have a lot of time study the 1h and 4h
charts.
As for contradicting signals on different time frames, do not confuse yourself with too many
timeframes. If you are unsure just do not trade! Simple as that! Its what I do.
Just because the 15 is pointing down but the 1h is pointing up does not mean one is gonna
win. The price could go down according to 15 then go up. Remember different time frames are
different timeframes and they will contradict each other sometimes.
Also try not to look at a 5 min chart then a 4h chart for confirmation, thats just silly! For 15
min try confirming with 1h and for 1h try confirming with 4h. Also trading the 5 min chart can
be rewarding. I consider it advanced and do not look at it too much. Too many false signals.
People keep it simple. Trust me do not look into it too much
there is nothing perfect! If the
trade fails it fails even the best traders will have bad trades, it happens.

The daily time frame
The daily is a completely different story. I will be honest: taking trades off the daily is hard and
confusing and tricky. Even if I am gone non stop I would rather take trades off the 4h. Trust
me the 4h is great and it gives you plenty of time to enter a trade and exit a trade and it
moves in big amounts. But if you have to trade the daily then yea I guess you can just trade
off the 5 stochastic with confirmation from 20 and 50. But I mean the settings are fine but
what I see is the really good setups are very rare and you usually need to look for reversal
bars, pin bars, hidden divergence and things like that and either way you’re gonna have a big
stop. Sorry I really do not trade the daily often. I just look at it sometimes for trend direction.
Another thing you can do is wait only for the perfect setups and trade like 10 different pairs. I
am sure the perfect setup will happen on a pair fairly often.
The thought sequence
I glance at the 4h to see what its doing. If the trend is up then I am biased to go long when its
the right time on the other time frames. Lets say trend is up. I then look at the 1h and 15 min.
Lets say 1h is trending down. To me this is a retracement and the move down will be small and
short lived and then price will consolidate. If everything is as planned the 15 would have turned
up and the 1h would be trending down slightly but with more signs of being flat or the 50 is flat
for example. Then I’ll start taking trades off the 15 min if its an active time of day and when
the first signal works the 1h should be turning up. Then I’ll look for more signals on the 15 min
and 1h. This will get easier with practice and experience. Bad trades will happen and there is
no way to avoid them 100%. I have had a bad trade last night. It was not a system trade but I
was just bored to be honest and lost 30 pips. I am over it because I know they will happen
even though I could have avoided it. I can say with lots of proud ness that when taking the
best setups you will have at least 80% trades to be winners.
I like to keep things simple and prefer taking trades off higher timeframes rather than the
smaller ones but I will go to smaller timeframes when the higher ones are not showing any
signals.
(Moonchild: As long as I (Moonchild) have at least 2 charts which agree (I prefer adjacent time
frames) then I almost never fail. If I have 3 time frames agreeing, then I increase the lots.)
So the procedure:
4h: main trend
1h: watch for retracements from a 4h move or for price consolidation that are saying 4h trend
is good and the 1h has just retraced and it is not moving against the 4h any further
15 min: following the trend of the 4h. look for first trade during active time. If things go
smooth, the 1h will follow then things should be smooth sailing from there.
Bundling of Stochastic
I notice in the chart of post #8 that you have a structure which I call a "bundling" of stochastic.
While I do not use these structures in my system I have noticed these while I was working on
the combination of indicators for my system. What I had observed is that these are high
probability reversal trades. I was wondering whether you use these as entries.
I realize that in your system the 20 and 50 would have to be heading up at the time for you to
take the trade, and when these structures happen they would not be heading either up or
down, since by definition they would have to be neutral since they are at the point of turning.
You might consider using these structures as triggers for your entries. Anyway, you might want
to watch them and see whether this type of entry would suit your system.
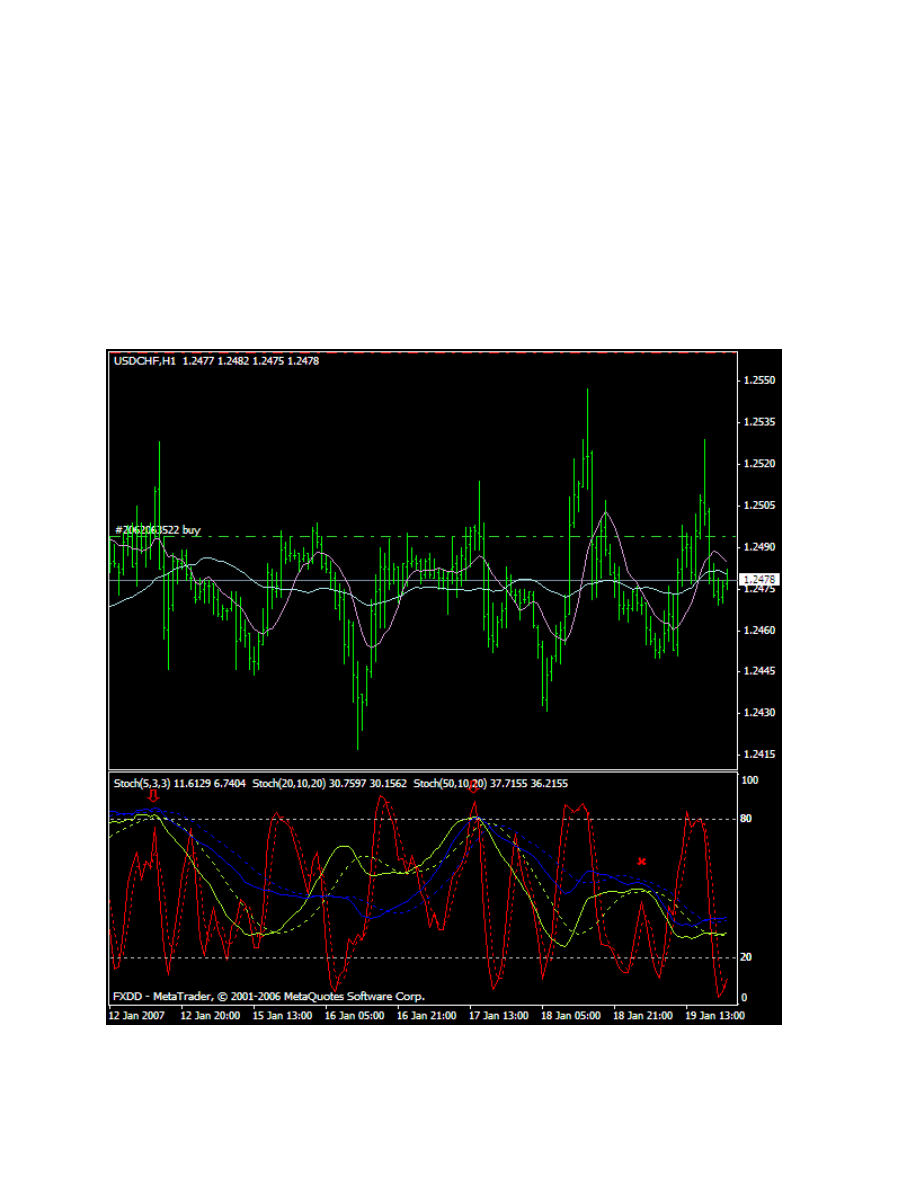
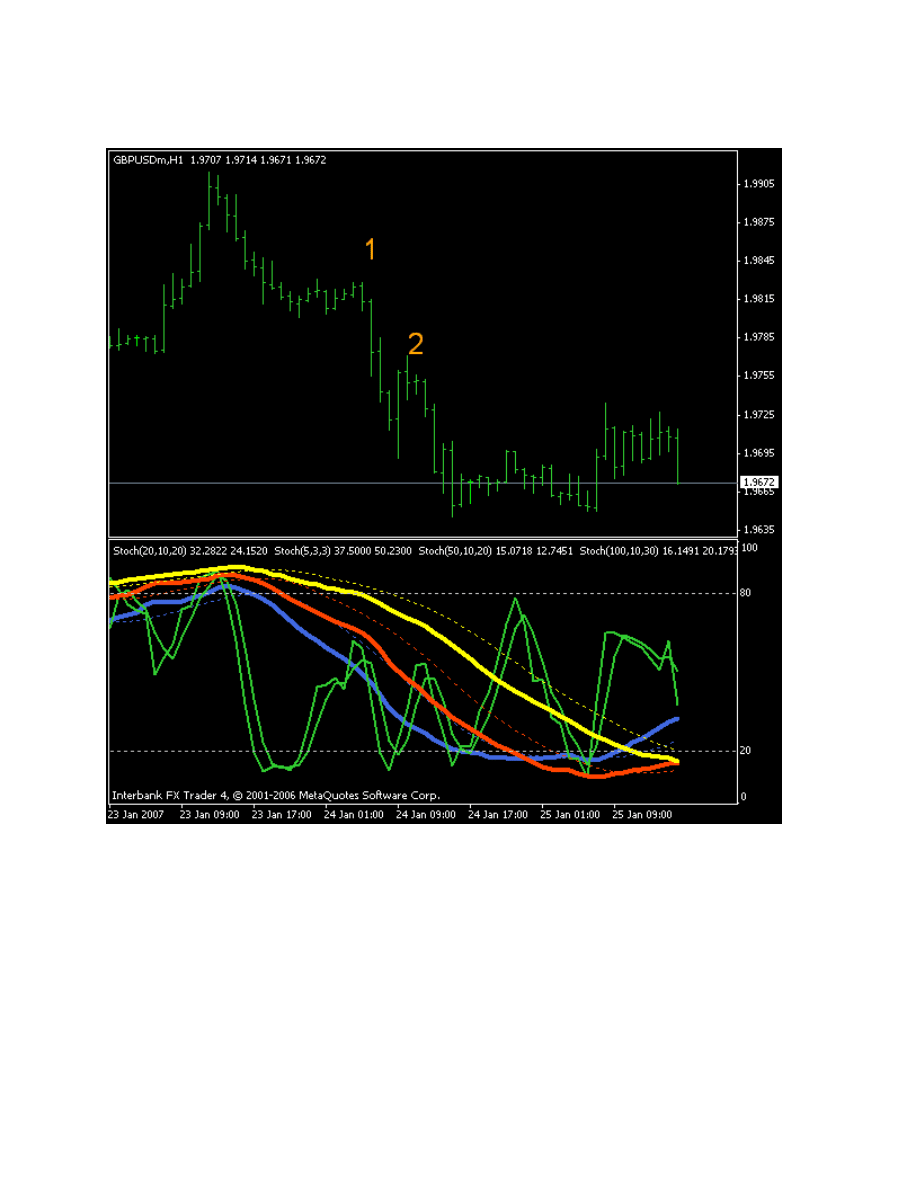
I am enclosing a chart of a particularly good set of 3 examples of what I am talking about. It is
the 1H Swissie chart. The first 2 bundles are in overbought territory, the third is not. Look
carefully for the second bundle because the arrow is in the printing at the top of the chart.
I would have taken the first 2 trades in overbought territory and not the third which was
midrange. You will also see that the first 2 would have succeeded and the third not.
This formation seem to work better when the 20 and 50 flatten out in neutral territory.
between 20 and 80 then taking that type of trade should work plus its psychologically better
when it comes to watching it.
Example of bundling of Stochastics:
As for the stochastic bundling I was checking out some stuff and noticed they are al ot better
when there is no trend and its just a range.
But when there iss a trend the stochastic bundling could happen and price will continue up.
That is a slingshot when the 20 and 50 are over 80 or under 20 and the 5 pulls back and then
follows the 20 and 50. Maybe you have looked into it more but a quick glance and I have
noticed its better to trade this when the pair has been ranging which is the case of usdchf.
Nonetheless its a perfect way to catch reversals and very efficient but I would rather take a
trade with the trend and since there is a trend in even as small as a 1 or 5 min chart then I
look for those. To me they are high percentage
Examples of good entries
the 4h consolidated and i entered the trade because its a nice setup.
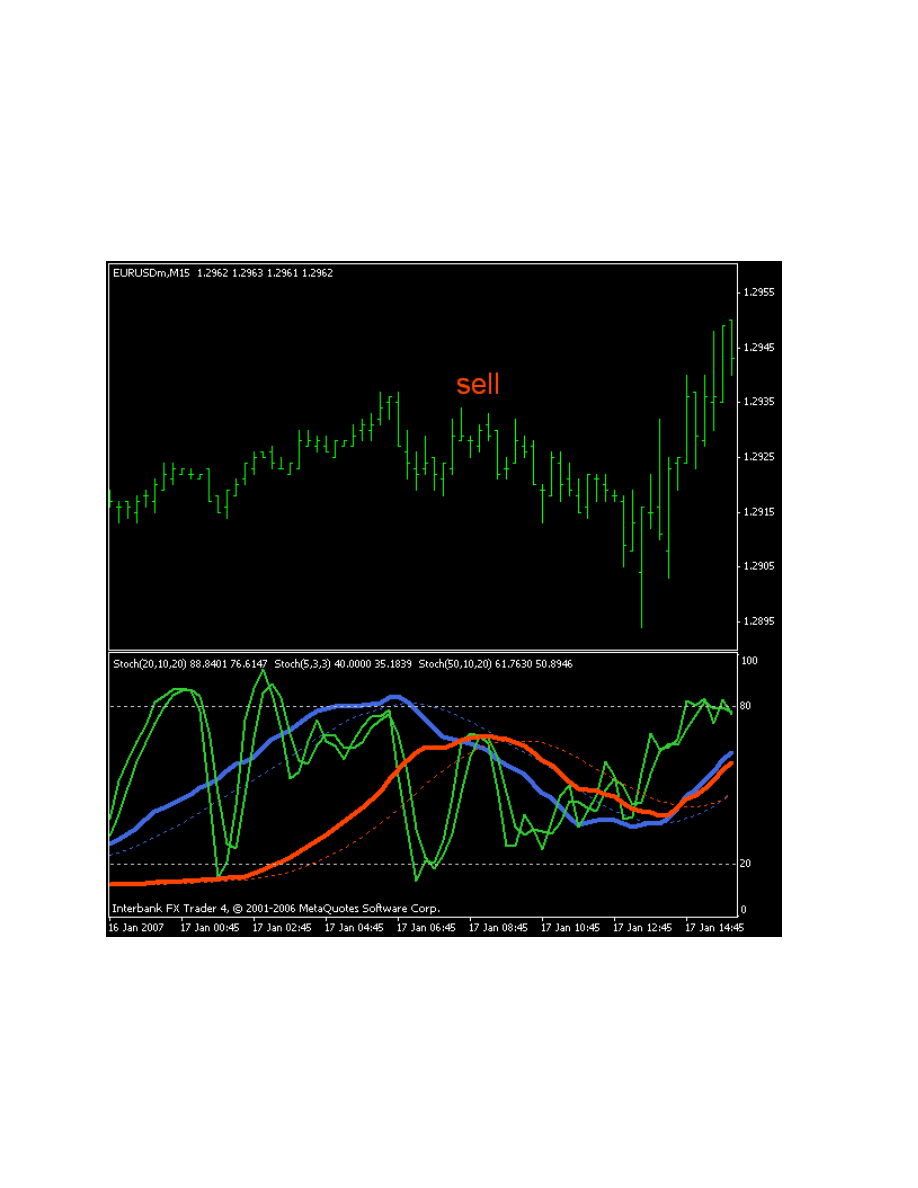
now this is the 15 min chart showing a very nice setup.
20 and 50 trending down nicely. the 5 almost into overbought and price consolidated and we
have a reversal bar. and its in the direction of the 4h. so should work out nicely.
PvO: see the 100 is trending up, but the 100 is for 1H+ time frames
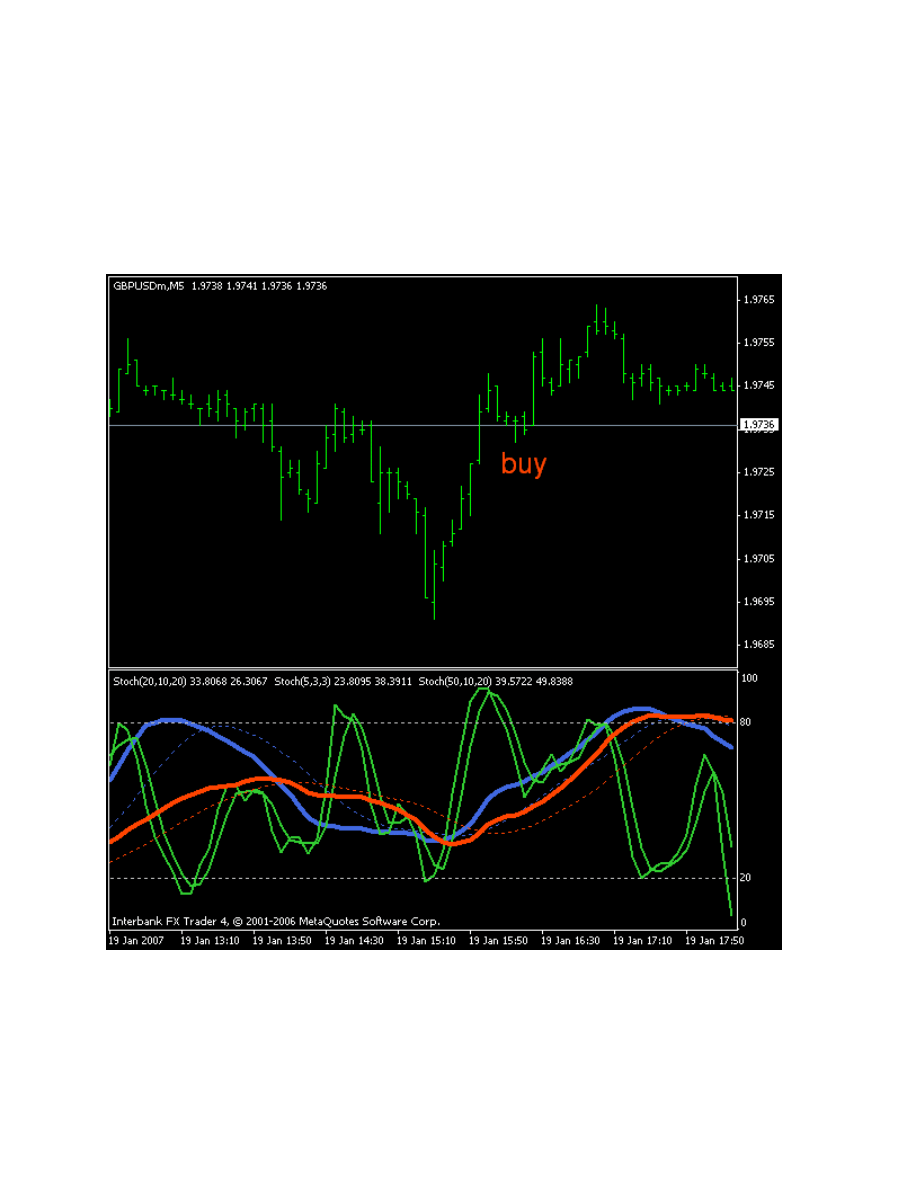
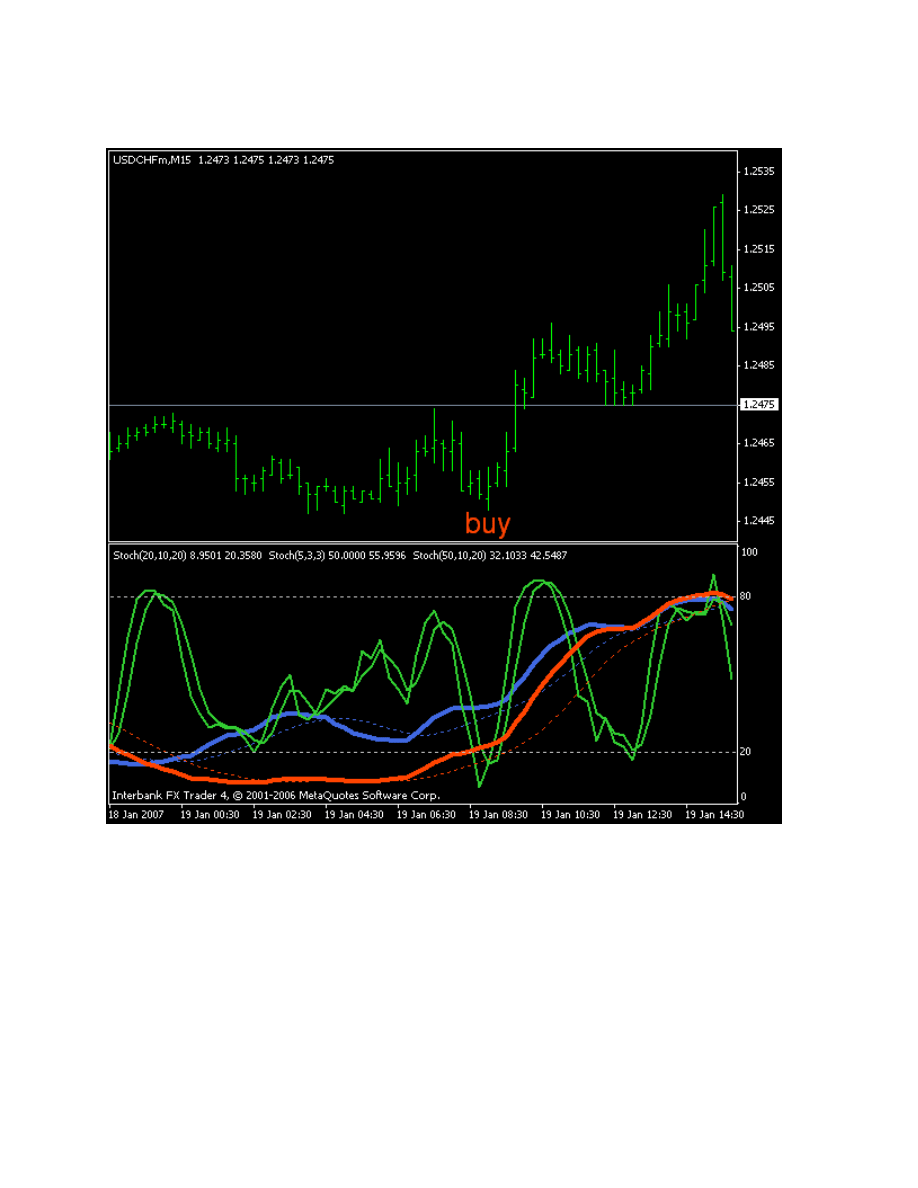
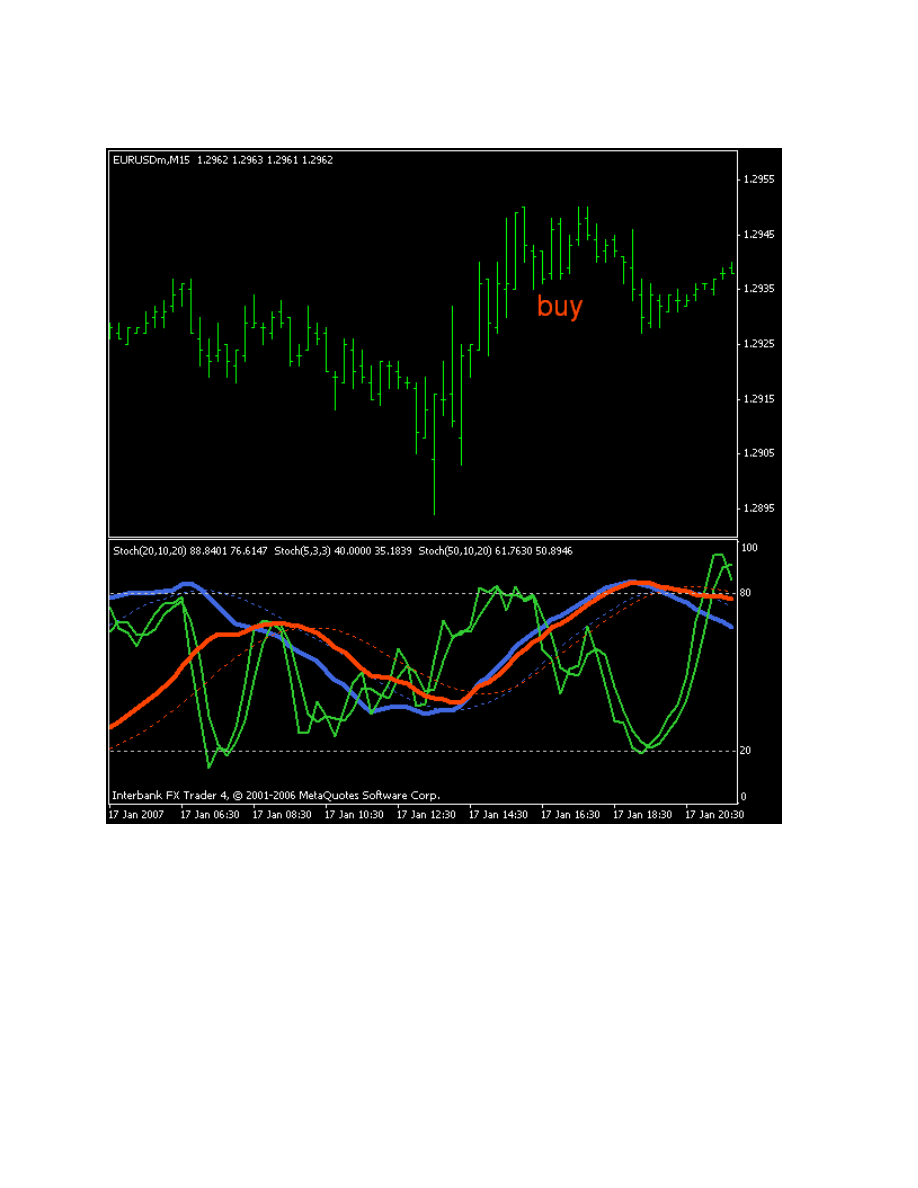
Examples of bad entries
A buy signal? It would have been a breakeven or small loss maybe even a small win.
2 things would have kept me away. the time of day. it was pretty late and the fact that 20 and
50 are really close together even tho they are trending up nicely. no reason to take half assed
trades. no reason to dig for trades either. only the best setups.
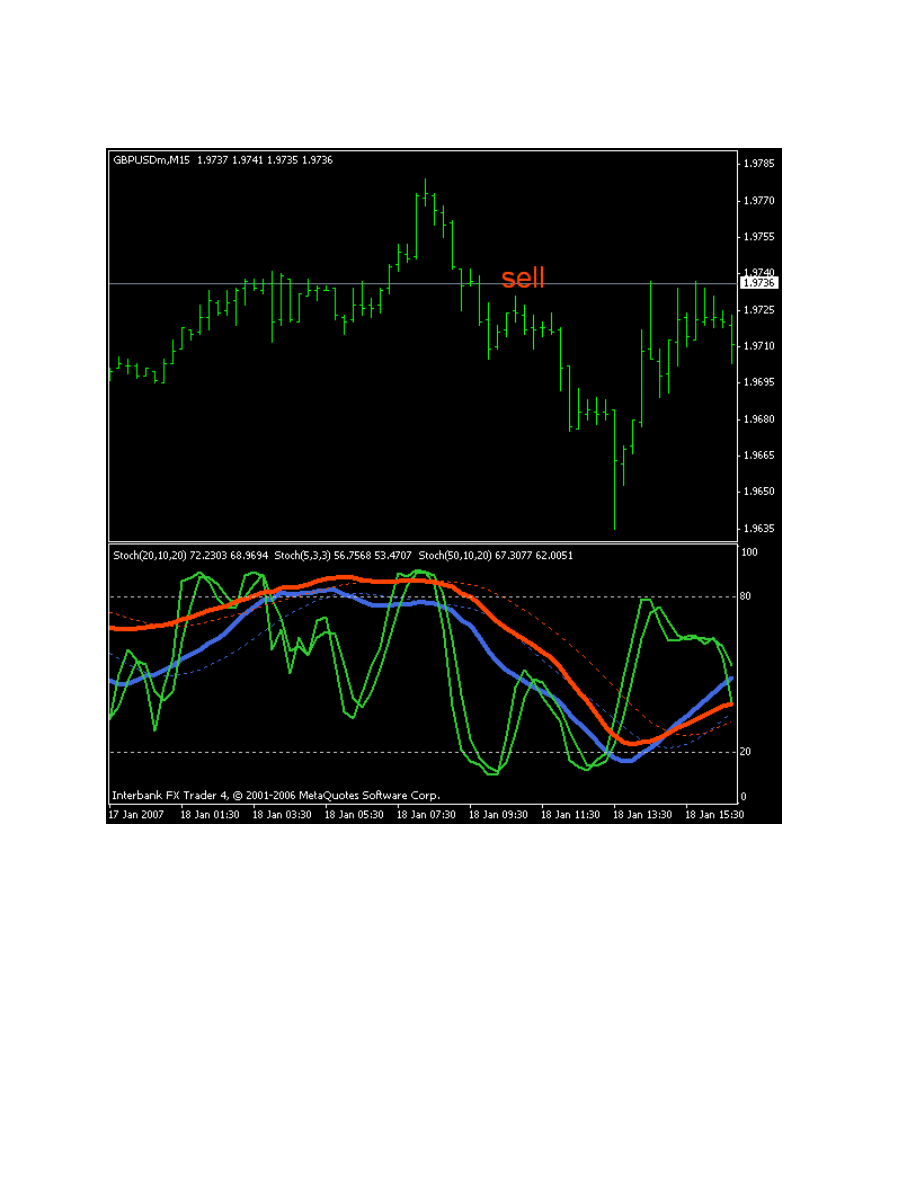
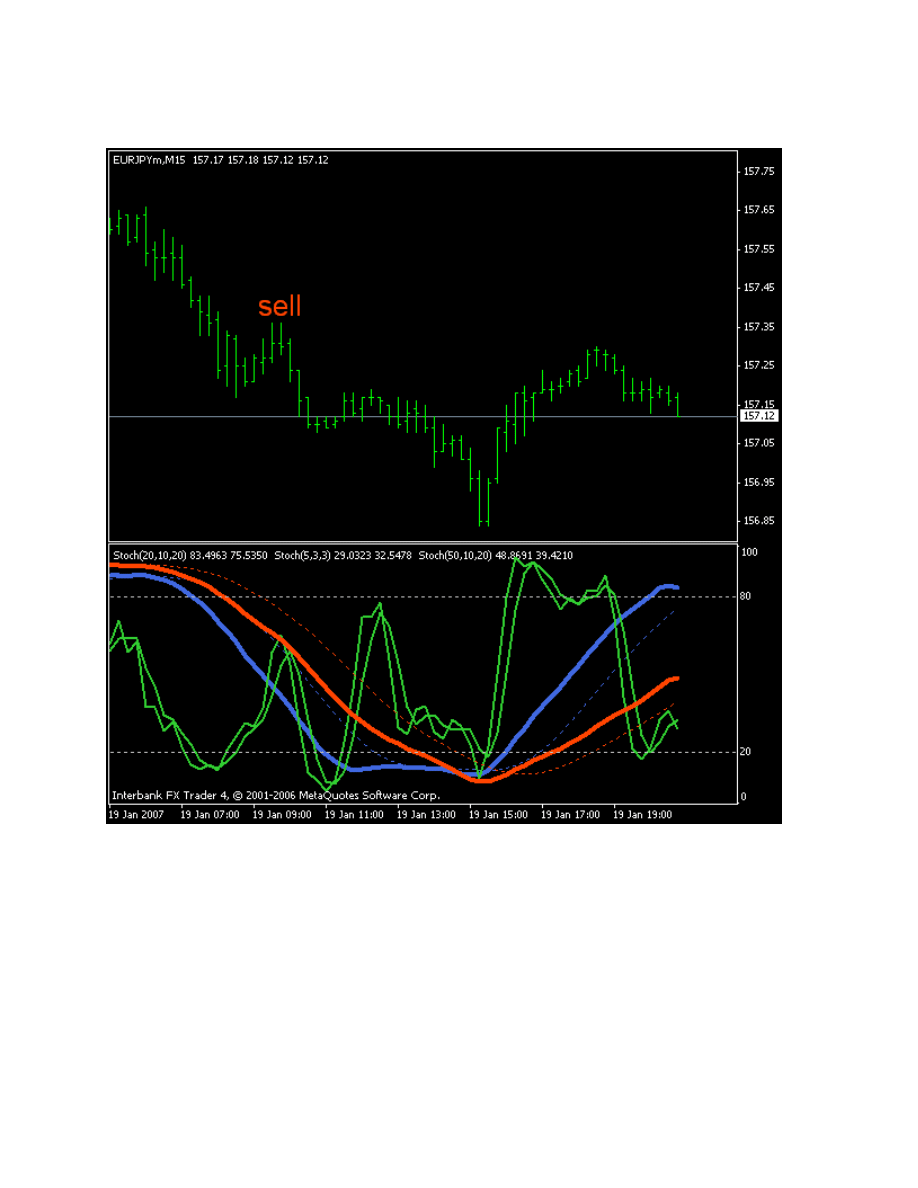
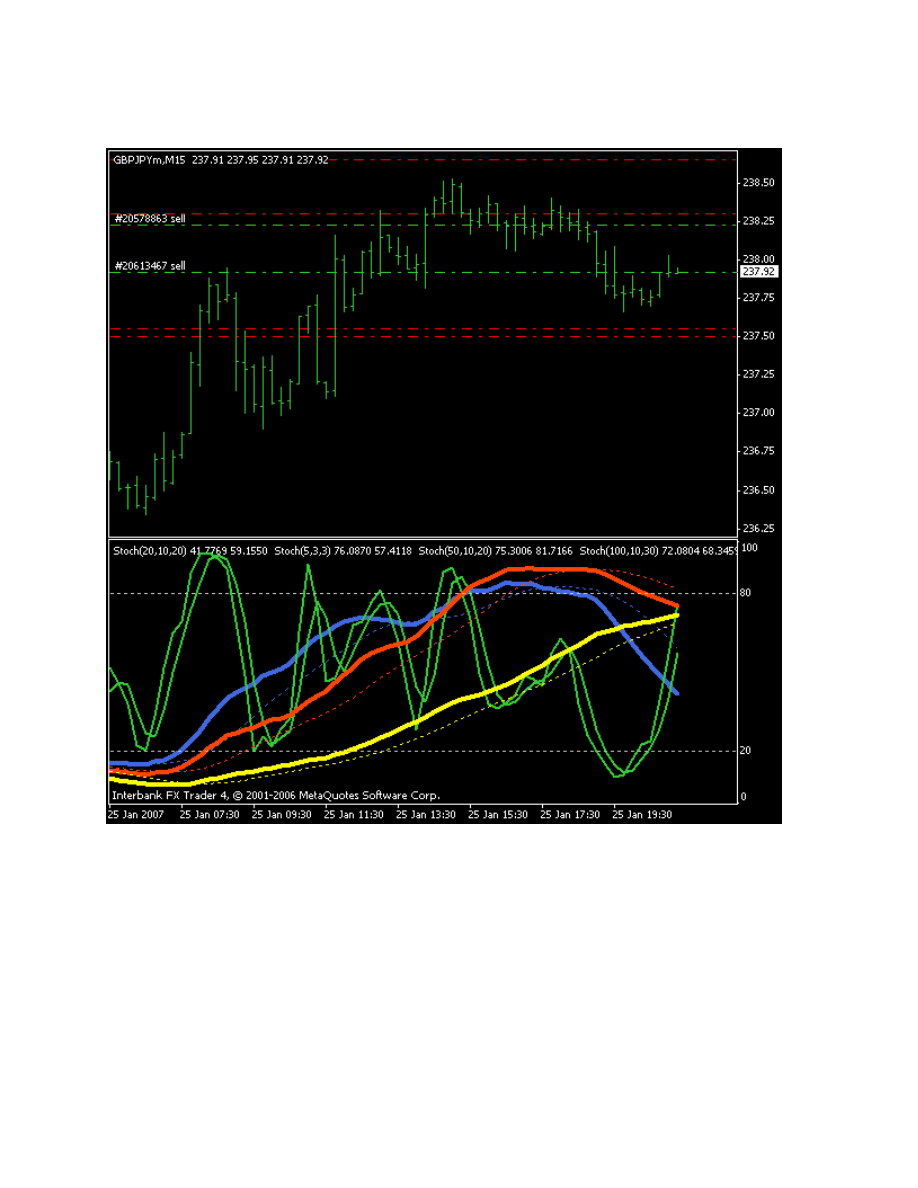
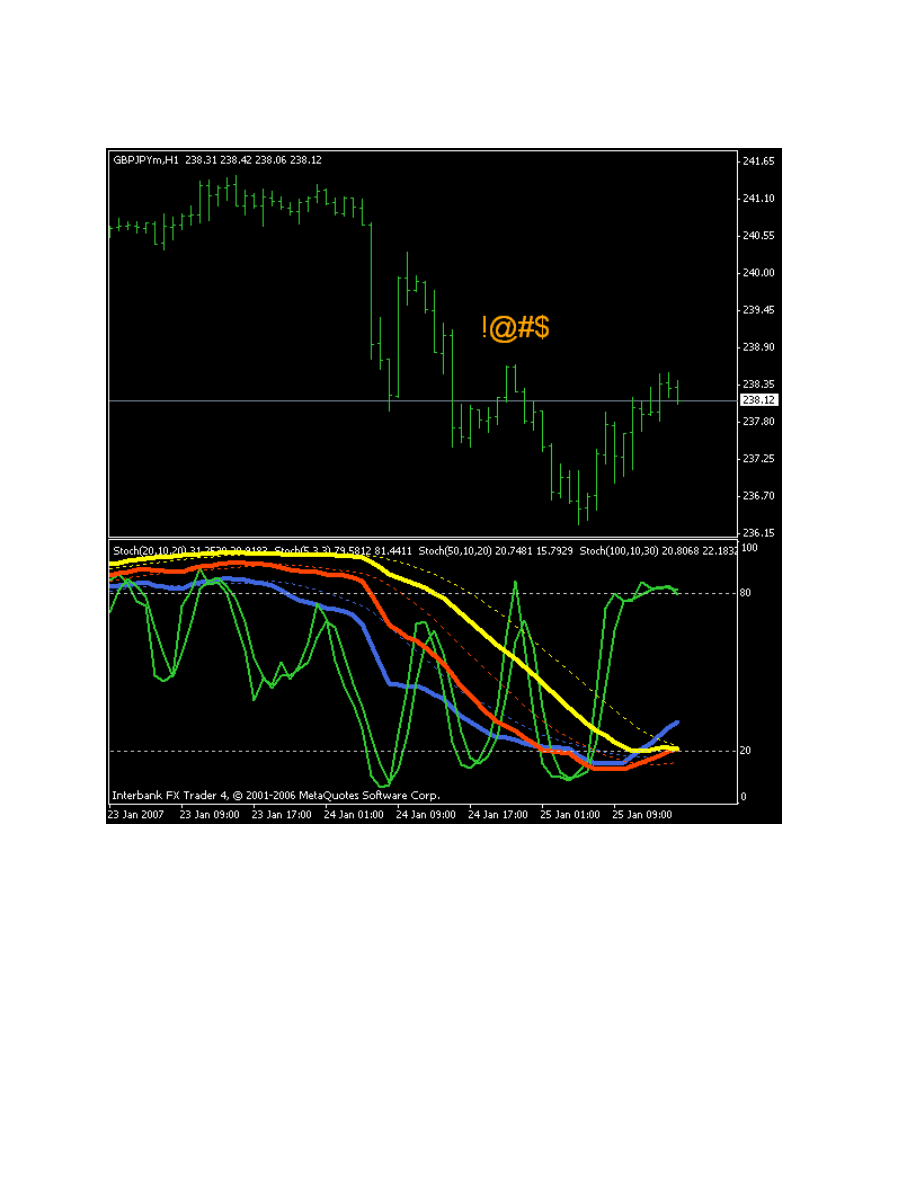
I am not the biggest fan of taking a trade when the 20 and 50 are very close together but a
few things convinced me into taking this one
-1h chart so I was expecting some action.
-also asian session was about to open which means action
-the setup was really good with 5 pulling back all the way into overbought or at least above the
80 line which is what triggered my entry
-price has been trending down on the 1h. lower highs and lower lows
even if i was doubting for a second id wait for the 5 to cross down and the bar to close and
price starts drifting down then u can enter.
Wyszukiwarka
Podobne podstrony:
Matrix Multiple Stochastics
multip
Goshman Multiplying Sponge Balls
Multiplekser demultiplekser
funkcja na multiplekserze
Evans L C Introduction To Stochastic Differential Equations
Multiple Intelligences in the Elementary Classroom
multiply0 12
multiply0 3
fiat multipla Nawigator connect nav 60360855 09 2004
multiplication table
How To Multiply Your Baby vol 1D a4
Verb Forms Multiple2
Weryfikacja własności stochastycznych modelu
multiplekser przebieg dośw
fiat multipla nieszczelne przylacze osuszacza
circle multiplication12s
więcej podobnych podstron