
Basic Principles of Microscope
Objectives
Mortimer Abramowitz, Kenneth R. Spring
1
,
H. Ernst Keller
2
, and Michael W. Davidson
3
Olympus America, Melville, NY,
1
National Heart,
Lung, and Blood Institute, National Institutes of
Health, Bethesda, MD,
2
Carl Zeiss, Thornwood,
NY, and
3
Florida State University, Tallahassee,
FL, USA
Microscope objectives are perhaps the most important
components of an optical microscope because they are re-
sponsible for primary image formation and play a central role
in determining the quality of images that the microscope is
capable of producing. Objectives are also instrumental in de-
termining the magnification of a particular specimen and the
resolution under which fine specimen detail can be observed
in the microscope. The objective is the most difficult compo-
nent of an optical microscope to design and assemble and is
the first component that light encounters as it proceeds from
the specimen to the image plane. Objectives derive their name
from the fact that they are, by proximity, the closest compo-
nent to the object (specimen) being imaged.
Modern objectives, composed of numerous internal glass
lens elements, have reached a high state of quality and perfor-
mance, with the extent of correction for aberrations and flat-
ness of field determining the usefulness and cost of an objec-
tive (see Figure 1). Construction techniques and materials
used to manufacture objectives have greatly improved over
the course of the past 100 years. Today, objectives are de-
signed with the assistance of computer-aided-design systems
using advanced rare-element glass formulations of uniform
composition and quality having highly specific refractive in-
dices. The enhanced performance that is demonstrated using
these advanced techniques has allowed manufacturers to pro-
duce objectives that are very low in dispersion and corrected
for most of the common optical artifacts such as coma, astig-
matism, geometrical distortion, field curvature, and spherical
and chromatic aberration (1). Not only are microscope objec-
tives now corrected for more aberrations over wider fields but
also image flare has been dramatically reduced with a sub-
stantial increase in light transmission, yielding images that
are remarkably bright, sharp, and crisp.
Three critical design characteristics of the objective set the
ultimate resolution limit of the microscope (4). These include
the wavelength of light used to illuminate the specimen, the an-
gular aperture of the light cone captured by the objective, and
the refractive index in the object space between the objective
front lens and the specimen. Resolution for a diffraction-limit-
ed optical microscope can be described as the minimum de-
tectable distance between two closely spaced specimen points:
R =
λ/2n(sin(θ))
where R is the separation distance,
λ is the illumination wave-
length, n is the imaging medium refractive index, and
θ is
one-half of the objective angular aperture. In examining the
equation, it becomes apparent that resolution is directly pro-
portional to the illumination wavelength. The human eye re-
sponds to the wavelength region between 400 and 700 nm,
which represents the visible light spectrum that is utilized for
a majority of microscope observations. Resolution is also de-
pendent on the refractive index of the imaging medium and
the objective angular aperture. Objectives are designed to im-
age specimens either with air or a medium of higher refractive
index between the front lens and the specimen. The field of
view is often quite limited, and the front lens element of the
objective is placed close to the specimen with which it must
lie in optical contact. A gain in resolution by a factor of ap-
proximately 1.5 is attained when immersion oil is substituted
for air as the imaging medium.
The last but perhaps most important factor in determining
the resolution of an objective is the angular aperture, which
has a practical upper limit of about 72° (with a sine value of
0.95). When combined with refractive index, the product
n(sin(
θ))
is known as the numerical aperture (NA) and provides a conve-
nient indicator of the resolution for any particular objective. NA
is generally the most important design criteria (other than opti-
cal correction) to consider when selecting a microscope objec-
tive. Values range from 0.1 for very low magnification objec-
tives (1–4×) to as much as 1.6 for high-performance objectives
utilizing specialized immersion oils. As NA values increase for
a series of objectives of the same magnification, we generally
observe a greater light-gathering ability and an increase in reso-
lution. The microscopist should carefully choose the objective
magnification so that, under the best circumstances, detail that
is just resolved should be enlarged sufficiently to be viewed
with comfort, but not to the point that empty magnification
hampers observation of fine specimen detail (6).
Just as the brightness of illumination in a microscope is
governed by the square of the working NA of the condenser,
the brightness of an image produced by the objective is deter-
mined by the square of its NA. In addition, objective magnifi-
cation also plays a role in determining image brightness,
which is inversely proportional to the square of the lateral
magnification. The square of the NA:magnification ratio ex-
presses the light-gathering power of the objective when uti-
lized with transmitted illumination. Because high-NA objec-
tives are often better corrected for aberration, they also collect
more light and produce a brighter, more corrected image that
is highly resolved. It should be noted that image brightness de-
creases rapidly as the magnification increases. In cases where
the light level is a limiting factor, choose an objective with the
highest NA but having the lowest magnification factor capable
of producing adequate resolution.
The least expensive (and most common) objectives, em-
ployed on a majority of laboratory microscopes, are the
achromatic objectives. These objectives are corrected for axi-
al chromatic aberration in two wavelengths (blue and red;
about 486 and 656 nm, respectively), which are brought into a
single common focal point. Furthermore, achromatic objec-
tives are corrected for spherical aberration in the color green
(546 nm; see Table 1 and Reference 4). The limited correction
772 BioTechniques
Vol. 33, No. 4 (2002)
Bi
Imaging

of achromatic objectives can lead to substantial artifacts when
specimens are examined and imaged with color microscopy
and photomicrography. If focus is chosen in the green region
of the spectrum, then images will have a reddish-magenta
halo (often termed residual color). Achromatic objectives
yield their best results with light passed through a green filter
(often an interference filter) and using black-and-white film
when these objectives are employed for photomicrography.
The lack of correction for flatness of field (or field curvature)
further hampers achromatic objectives. In the past few years,
most manufacturers have begun providing flat-field correc-
tions for achromatic objectives and have given these corrected
objectives the name of plan achromats (Figure 2). The next
higher level of correction and cost is found in objectives
called fluorites or semi-apochromats (illustrated by center ob-
jective in Figure 1), named for the mineral fluorite, which was
originally used in their construction.
During assembly of the objective, lenses are first strategi-
cally spaced, lap-seated into cell mounts, and then packaged
into a central sleeve cylinder that is mounted internally within
the objective barrel. Individual lenses are seated against a
brass shoulder mount with the lens spinning in a precise lathe
chuck, followed by burnishing with a thin rim of metal that
locks the lens (or lens group) into place. Spherical aberration
is corrected by selecting the optimum set of spacers to fit be-
tween the lower two lens mounts (the hemispherical and
meniscus lens). The objective is made parfocal by translating
the entire lens cluster upward or downward within the sleeve
with locking nuts so that objectives housed on a multiple
nosepiece can be interchanged without losing focus. Adjust-
ment for coma is accomplished with three centering screws
that can optimize the position of internal lens groups with re-
spect to the optical axis of the objective.
Fluorite objectives are produced from advanced glass for-
mulations that contain materials such as fluorspar or newer
synthetic substitutes. These new formulations allow for greatly
improved correction of optical aberration. Similar to the achro-
mats, the fluorite objectives are also corrected chromatically
for red and blue light. In addition, the fluorites are also correct-
ed spherically for two or three colors instead of a single color,
as are achromats. The superior correction of fluorite objectives
compared to achromats enables these objectives to be made
with a higher NA, resulting in brighter images. Fluorite objec-
tives also have better resolving power than achromats and pro-
vide a higher degree of contrast, making them better suited
than achromats for color photomicrography in white light.
The highest level of correction (and expense) is found in
apochromatic objectives (Figure 3). Apochromats represent
the most highly corrected microscope lenses currently avail-
able, and their high price reflects the sophisticated design and
careful assembly required in their manufacture. The lower-
power apochromatic objectives (10× and 20×) have a longer
working distance, and the overall objective length is shorter
than in higher-power (40× and 100×) apochromatic objec-
tives. Traditionally, apochromats are corrected chromatically
for three colors (red, green, and blue), almost eliminating
chromatic aberration, and are corrected spherically for either
two or three wavelengths (see Table 1). Apochromatic objec-
tives are the best choice for color photomicrography in white
Vol. 33, No. 4 (2002)
light. Because of their high level of correction, apochromatic
objectives usually have, for a given magnification, higher
NAs than do achromats or fluorites. Many of the newer high-
performance fluorite and apochromatic objectives are correct-
ed for four (dark blue, blue, green, and red) or more colors
chromatically and four colors spherically (1–3).
All three types of objectives suffer from pronounced field
curvature and project images that are curved rather than flat, an
artifact that increases in severity with higher magnification. To
overcome this inherent condition arising from curved lens sur-
faces, optical designers have produced flat-field corrected ob-
jectives, which yield images that are in common focus through-
out the viewfield. Objectives that have flat-field correction and
low distortion are called plan achromats, plan fluorites, or plan
apochromats, depending on their degree of residual aberration.
Such correction, although expensive, is quite valuable in digi-
tal imaging and conventional photomicrography.
Uncorrected field curvature is the most severe optical aber-
ration that occurs in fluorite (semi-apochromatic) and apoc-
hromatic objectives, and it was tolerated as an unavoidable ar-
tifact for many years. During routine use, the viewfield would
have to be continuously refocused between the center and the
edges to capture all specimen details. The introduction of flat-
field (plan) correction to objectives perfected their use for
photomicrography and video microscopy, and today these
corrections are standard in both general-use and high-perfor-
mance objectives. Correction for field curvature adds a con-
siderable number of lens elements to the objective, as illus-
trated in Figure 2 for a simple achromat. The significant
increase in lens elements for plan correction also occurs with
fluorite and apochromatic objectives, frequently resulting in
an extremely tight fit of lens elements (see Figure 3) within
the internal objective sleeve. In general, plan objectives cor-
rected for field curvature sacrifice a considerable amount of
free working distance, and many of the high-magnification
versions have a concave front lens, which can be extremely
difficult to clean and maintain.
Older objectives generally have lower NAs and are subject
to an aberration termed chromatic difference of magnification
that requires correction by the use of specially designed com-
pensating oculars or eyepieces (2–4,7). This type of correc-
tion was prevalent during the reign of fixed tube length mi-
croscopes but is not necessary with modern infinity-corrected
objectives and microscopes. In recent years, modern micro-
scope objectives have their correction for chromatic differ-
ence of magnification either built into the objectives them-
selves (Olympus and Nikon) or corrected in the tube lens
(Leica and Zeiss).
The intermediate image in an infinity-corrected system ap-
pears at the reference focal length (formerly the optical tube
length) behind the tube lens in the optical pathway. This
length varies between 160 and 250 mm, depending on design
constraints imposed by the manufacturer. The magnification
of an infinity-corrected objective is calculated by dividing the
reference focal length by the focal length of the objective lens.
In most biological applications, a cover glass is utilized in
774 BioTechniques
Vol. 33, No. 4 (2002)
Bi
Imaging
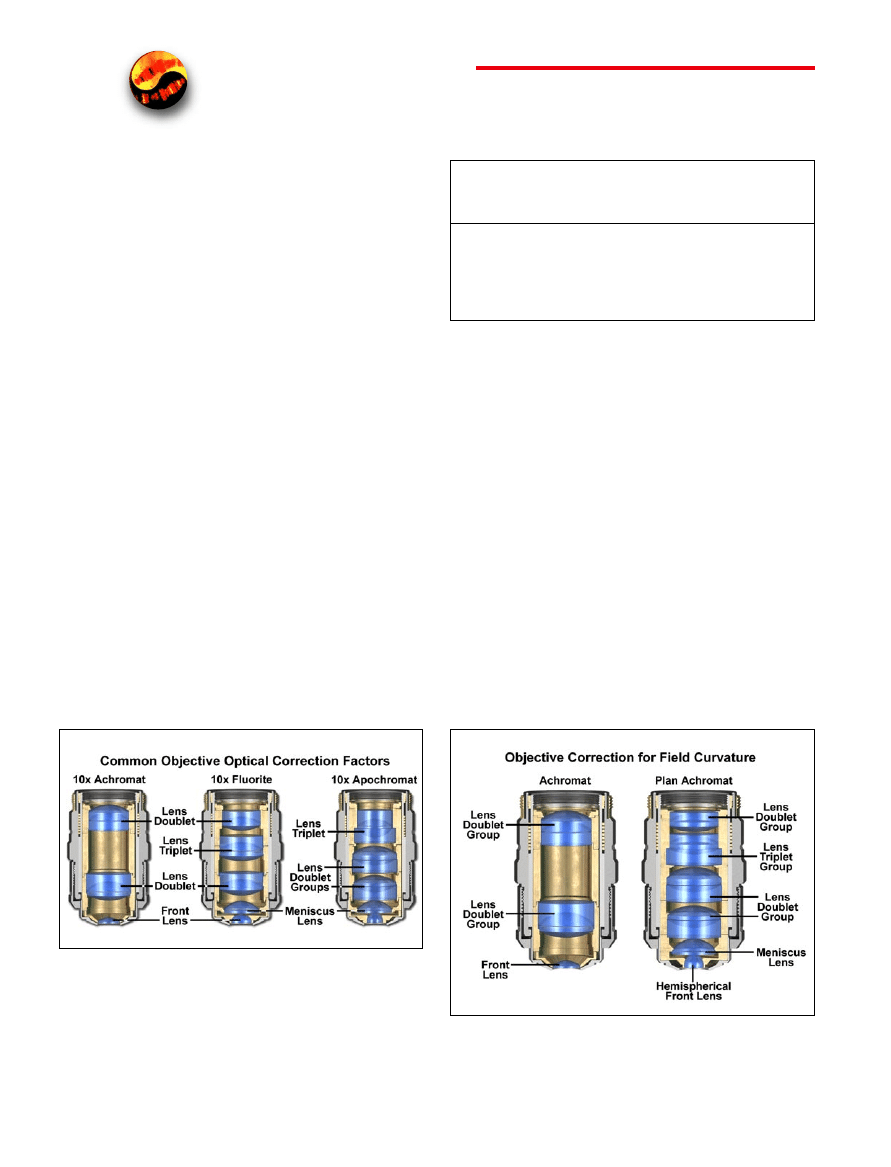
Figure 2. Flat-field correction in microscope objectives. The uncorrected
achromat on the left contains two lens doublets, in addition to a simple thin-
lens front element. In contrast, the corrected plan achromat on the right con-
tains three lens doublets, a central lens triplet group, and a meniscus lens posi-
tioned behind the hemispherical front lens. In this instance, plan correction led
to the addition of six lens elements bundled into more sophisticated lens group-
ings, which dramatically increases the optical complexity of the objective.
Table 1. Objective Correction for Optical Aberration
Spherical
Chromatic
Objective
Aberration
Aberration
Field
Type (Colors)
(Colors)
Curvature
Achromat
1
2
No
Plan Achromat
1
2
Yes
Fluorite
2–3
2–3
No
Plan Fluorite
3–4
2–4
Yes
Plan Apochromat
3–4
4–5
Yes
Figure 1. The three major classes of objectives. The achromats have the
least amount of correction, the fluorites (or semi-apochromats) have addi-
tional spherical corrections, and the apochromats are the most highly cor-
rected objectives available. The objective positioned on the far left is a 10×
achromat, which contains two internal lens doublets and a front lens ele-
ment. Illustrated in the center is a 10× fluorite objective with several lens
groups, including two doublets and a triplet, in addition to a hemispherical
front lens and a secondary meniscus lens. On the right is a 10× apochromat
objective that also contains multiple lens groups and single elements. Al-
though similar in construction to fluorite objectives, the lenses have differ-
ent thicknesses and curvatures and are arranged in a configuration that is
unique to apochromat objectives.
mounting the specimen, both to protect the integrity of the
specimen and to provide a clear window for observation. The
cover glass acts to converge the light cones originating from
each point in the specimen but also introduces chromatic and
spherical aberration (and consequent loss of contrast) that
must be corrected by the objective. The degree to which light
rays are converged is determined by the refractive index, dis-
persion, and thickness of the cover glass. Although the refrac-
tive index should be relatively constant within a batch of cov-
er glasses, the thickness can vary between 0.13 and 0.22 mm.
Another concern is the aqueous solvent or excess mounting
medium that lies between the specimen and cover glass in wet
or thickly mounted preparations. For example, in physiologi-
cal saline whose refractive index is significantly different
from that of the coverslip, the objective must focus through a
layer of water only a few microns thick, leading to significant
aberrations and a deviation of the point spread function that is
no longer symmetrical above and below the focal plane.
These factors add to the effective variations in refractive in-
dex and thickness of the coverslip and are very difficult for
the microscopist to control.
The imaging medium between the objective front lens and
the specimen coverslip is also very important with respect to
correction for spherical aberration and coma in the design of
lens elements for objectives. Lower-power objectives have
relatively low NAs and are designed to be used dry with only
air as the imaging medium between the objective front lens
and the cover glass (5). The maximum theoretical NA obtain-
able with air is 1.0; however, in practice, it is virtually impos-
sible to produce a dry objective with a NA above 0.95. The ef-
fect of cover glass thickness variation is negligible for dry
objectives having NAs less than 0.4, but such deviation be-
comes significant at NAs exceeding 0.65, where fluctuations
as small as 0.01 mm can introduce spherical aberration. This
poses problems with high-power apochromats, which must
use very short working distances in air and contain sensitive
corrections for spherical aberration that tend to make it diffi-
cult to obtain sharp images.
Many high-performance apochromat dry objectives are fit-
ted with correction collars, which allow adjustment to correct
for spherical aberration by correcting for variations in cover
glass thickness. Optical correction for spherical aberration is
produced by rotating the collar, which causes two of the lens
element groups in the objective to move either closer together
or farther apart. A majority of the correction collar objectives
designed for upright transmitted light microscopy have an ad-
justment range for cover glass thickness variations between
0.10 and 0.23 mm. Many of the specialized phase-contrast
objectives designed for observing tissue culture specimens
with an inverted microscope have an even broader compensa-
tion range between 0 and 2 mm. This allows specimens to be
viewed through the bottom of most culture vessels, which of-
ten have dramatic thickness fluctuations in this size range.
High-NA dry objectives lacking a correction collar often
produce images that are inferior to those of lower-NA objec-
tives where cover glass thickness is of less concern. For this
reason, it is often prudent to choose a lower-magnification
(and NA) objective to obtain superior contrast without the ac-
companying artifacts introduced by cover glass fluctuations.
As an example, a 40× objective having an NA of 0.65 may be
776 BioTechniques
Vol. 33, No. 4 (2002)
Bi
Imaging
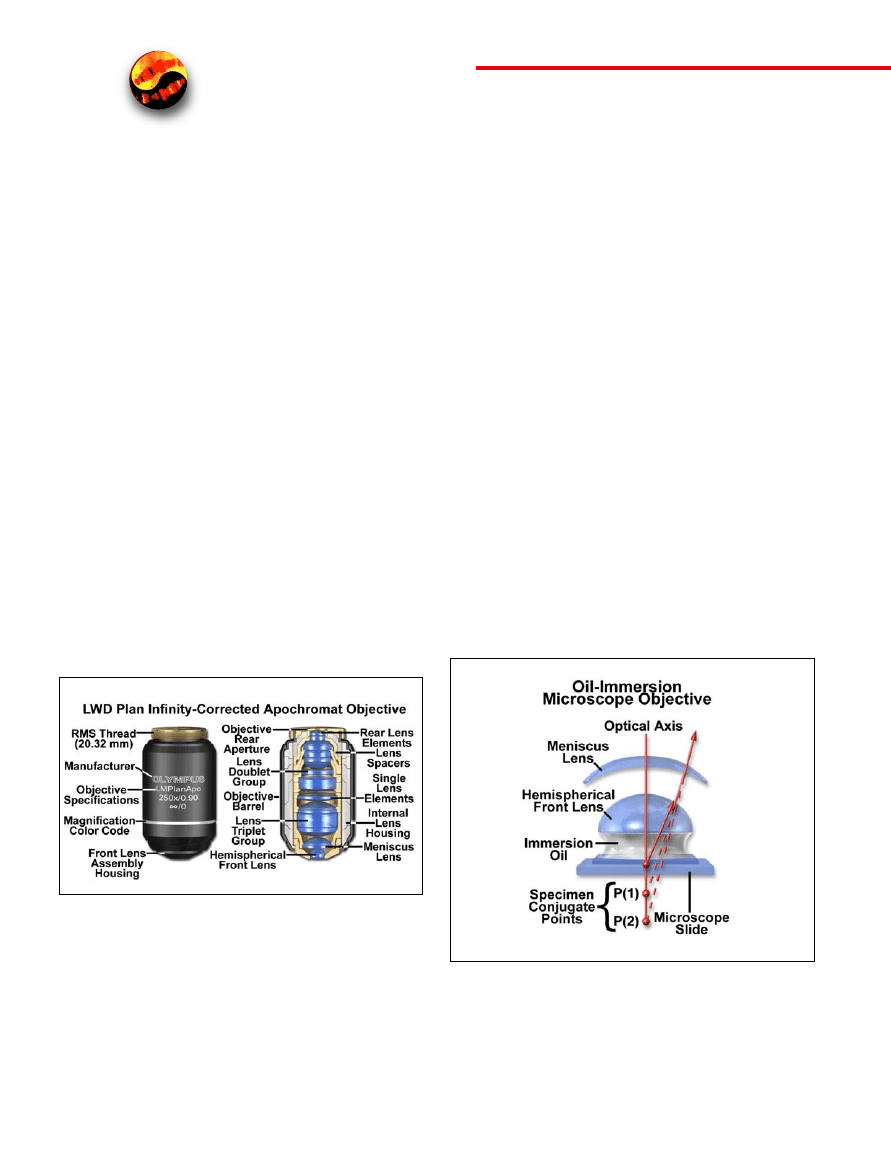
Figure 4. Light ray paths in apochromatic oil-immersion objectives. The
specimen is sandwiched between the microscope slide and cover glass at
point P, the aplanatic point of the hemispherical lens element. Light rays re-
fracted at the rear of the hemispherical lens appear to proceed from point
P(1), which is also the center of curvature for the first surface of the meniscus
lens. The refracted light rays enter the meniscus lens along the radius of its
first surface and experience no refraction at that surface. At the rear surface of
the meniscus lens, light rays are refracted aplanatically so that they appear to
diverge from P(2). Refraction of the light rays at the surfaces of subsequent
lens groups in the objective completes the convergence of light rays originat-
ing from point P, thus forming the intermediate image.
Figure 3. Objective specifications and internal elements. Major micro-
scope manufacturers offer a wide range of objective designs that feature ex-
cellent optical characteristics under a wide spectrum of illumination condi-
tions and provide various degrees of correction for the primary optical
aberrations. The objective illustrated above is a 250× long working distance
(LWD) apochromat that contains 14 optical elements that are cemented to-
gether into three groups of lens doublets, a lens triplet group, and three indi-
vidual internal single-element lenses. The objective also has a hemispherical
front lens and a meniscus second lens that work synchronously to assist in
capturing light rays at high NAs, with a minimum of spherical aberration.
Many high-magnification objectives of similar design are also equipped with
a spring-loaded retractable nosecone assembly that protects the front lens el-
ements and the specimen from collision damage. Specific objective parame-
ters such as NA magnification, optical tube length, degree of aberration cor-
rection, and other important characteristics are imprinted or engraved on the
external portion of the barrel.

able to produce better images with sharper contrast and clari-
ty than a 60× objective having an NA of 0.85, even though the
resolving power of the higher-magnification objective is theo-
retically greater.
The standard thickness for cover glasses is 0.17 mm,
which is designated as a number 1.5 cover glass. Unfortunate-
ly, not all 1.5 cover glasses are manufactured to this close tol-
erance (they range from 0.16 to 0.19 mm), and many speci-
mens have media between them and the cover glass.
Compensation for cover glass thickness can be accomplished
by adjusting the mechanical tube length of the microscope, or
(as previously discussed) by the utilization of specialized cor-
rection collars that change the spacing between critical ele-
ments inside the objective barrel. The correction collar is uti-
lized to adjust for these subtle differences to ensure the
optimum objective performance (2,3).
Objective NA can be dramatically increased by designing
the objective to be used with an immersion medium, such as
oil, glycerin, or water. By using an immersion medium with a
refractive index similar to that of the glass coverslip, image
degradation due to thickness variations of the cover glass are
practically eliminated, whereby rays of wide obliquity no
longer undergo refraction and are more readily grasped by the
objective. Typical immersion oils have a refractive index of
1.51 and a dispersion profile similar to that of glass coverslips.
Light rays passing through the specimen encounter a homoge-
neous medium between the coverslip and immersion oil and
are not refracted as they enter the lens, but only as they leave
its upper surface. It follows that if the specimen is placed at the
aplanatic point (at the focal point and in the center of the field)
of the first objective lens, then imaging by this portion of the
lens system is totally free of spherical aberration.
The general design of a practical oil immersion objective in-
cludes a hemispherical front lens element, followed by a posi-
tive meniscus lens and a doublet lens group (6). Presented in
Figure 4 are the aplanatic refractions that occur at the first two
lens elements in a typical apochromatic oil immersion objec-
tive. Properly designed oil immersion objective lenses also cor-
rect for chromatic defects that are introduced by the first two
lens elements, while introducing a minimum amount of spher-
ical aberration. The fact that the light cone is partially con-
verged before entering the first lens element aids in the control
of spherical aberration. It should be noted that employing an oil
immersion objective without the application oil between the
coverslip and first lens element results in defective images.
This is due to refraction that occurs at the surface of the front
lens, which introduces spherical aberration that cannot be cor-
rected by subsequent lens components within the objective.

The advantages of oil immersion objectives are severely
compromised if the wrong immersion fluid is used. Micro-
scope manufacturers produce objectives with tight tolerances
to refractive index and dispersion, which require matching
values in the liquid placed between the cover glass and objec-
tive front lens. It is advisable to employ only the oil intended
by the objective manufacturer and not to mix immersion oils
between manufacturers to avoid unpleasant artifacts such as
crystallization or phase separation.
Objectives that use water and/or glycerin as an imaging
medium are also available for applications with living cells in
culture or sections of tissue immersed in physiological saline
solution. Plan apochromat water immersion lenses are
equipped with correction collars and NAs up to 1.2, slightly
less than their oil immersion counterparts. These objectives
allow microscopists to focus through up to 200
µm aqueous
media and still retain excellent optical correction.
There is a wealth of information inscribed on the objective
barrel (1–3; Figure 3). Briefly, each objective has inscribed on
it the magnification (e.g., 10×, 20×, or 40×, etc.), the tube
length for which the objective was designed to give its finest
images (usually 160 mm or
∞), and the thickness of cover
glass protecting the specimen, which was assumed to have a
constant value by the designer in correcting for spherical
aberration (usually 0.17 mm). If the objective is designed to
operate with a drop of oil between it and the specimen, then
the objective will be engraved OIL or OEL or HI (homoge-
neous immersion). In cases where these latter designations
are not engraved on the objective, the objective is meant to be
used dry, with air between the lowest part of the objective and
the specimen. Objectives also always carry the engraving for
the NA value. This may vary from 0.04 for low power objec-
tives to 1.3 or 1.4 for high-power oil immersion apochromatic
objectives. If the objective carries no designation of higher
correction, then one can usually assume it is an achromatic
objective. More highly corrected objectives have inscriptions
such as apochromat or apo, plan, FL, fluor, etc. Older objec-
tives often have the focal length (lens-to-image distance) en-
graved on the barrel, which is a measure of the magnification.
In modern microscopes, the objective is designed for a partic-
ular optical tube length, so including both the focal length and
magnification on the barrel becomes somewhat redundant.
Table 2 lists working distance and NA as a function of
magnification for the four most common classes of objec-
tives: achromats, plan achromats, plan fluorites, and plan
apochromats. Note that dry objectives all have an NA value of
less than 1.0, and only objectives designed for liquid immer-
sion media have an NA that exceeds this value.
When a manufacturer’s set of matched objectives (e.g., all
achromatic objectives of various magnifications; a single sub-
set of the objectives listed in Table 2) are mounted on the nose-
piece, they are usually designed to project an image to approx-
imately the same plane in the body tube (7). Thus, changing
objectives by rotating the nosepiece usually requires only min-
imal use of the fine adjustment knob to reestablish sharp focus.
Such a set of objectives is described as being parfocal, a useful
convenience and safety feature. Matched sets of objectives are
also designed to be parcentric so that a specimen centered in
the field of view for one objective remains centered when the
nosepiece is rotated to bring another objective into use.
For many years, objective lenses designed for biological
applications from most manufacturers all conformed to an in-
ternational standard of parfocal distance. Thus, a majority of
objectives had a parfocal distance of 45.0 mm and were con-
sidered interchangeable. With the migration to infinity-cor-
778 BioTechniques
Vol. 33, No. 4 (2002)
Bi
Imaging
Magnification
NA
Working Distance (mm)
Achromat
4×
0.10
30.00
10×
0.25
6.10
20×
0.40
2.10
40×
0.65
0.65
60×
0.80
0.30
100× (oil)
1.25
0.18
Plan Achromat
0.5×
0.02
7.00
1×
0.04
3.20
2×
0.06
7.50
4×
0.10
30.00
10×
0.25
10.50
20×
0.40
1.30
40×
0.65
0.57
50× (oil)
0.90
0.40
100× (oil)
1.25
0.17
40×
0.65
0.48
100×
0.90
0.26
Plan Fluorite
4×
0.13
17.10
10×
0.30
16.00
20×
0.50
2.10
40×
0.75
0.72
40× (oil)
1.30
0.2
60×
0.85
0.3
100× (dry)
0.90
0.30
100× (oil)
1.30
0.20
100× (oil with iris)
0.5–1.3
0.20
Plan Apochromat
2×
0.10
8.50
4×
0.20
15.70
10×
0.45
4.00
20×
0.75
1.00
40×
0.95
0.14
40× (oil)
1.00
0.16
60×
0.95
0.15
60× (oil)
1.40
0.21
60× (water immersion)
1.20
0.22
100× (oil)
1.40
0.13
100× (NCG oil)
1.40
0.17
NCG, no cover glass
Table 2. Objective Specification By Magnification

Vol. 33, No. 4 (2002)
Bi
Imaging
rected tube lengths, a new set of design criteria emerged to
correct for aberrations in the objective and tube lenses. Cou-
pled to an increased demand for greater flexibility to accom-
modate the need for ever-greater working distances with high-
er NAs and field sizes, interchangeability between objective
lenses from different manufacturers disappeared. This transi-
tion is exemplified by modern optical systems that feature
“Chrome Free” objectives, tube lenses, and eyepieces. Each
component in these systems is separately corrected without
one being utilized to achieve correction for another. The tube
length is set to infinity (parallel light path) using a tube lens,
and the parfocal distance has been increased to 60 mm. Even
the objective mounting thread size has been altered from 20.32
to 25 mm to meet the new requirements of the optical system.
The axial range through which an objective can be focused
without any appreciable change in image sharpness is re-
ferred to as the depth of field. This value varies radically from
low to high NA objectives, usually decreasing with increasing
NA (see Table 3 and Reference 3). At high NAs, the depth of
field is determined primarily by wave optics, while at lower
NAs, the geometrical optical “circle of confusion” dominates.
The total depth of field is given by the sum of the wave and
geometrical optical depths of field as:
dtot =
λn/NA2 + (n/M•NA)e
where
λ is the wavelength of illumination, n is the refrac-
tive index of the imaging medium, NA is the objective numer-
ical aperture, M is the objective lateral magnification, and e is
the smallest distance that can be resolved by a detector that is
placed in the image plane of the objective. Notice that the dif-
fraction-limited depth of field (the first term on the right-hand
side of the equation) shrinks inversely with the square of the
NA, while the lateral limit of resolution is reduced with the
first power of the NA. The result is that axial resolution and
the thickness of optical sections are affected by the system
NA much more than is the lateral resolution of the micro-
scope (Table 3).
The clearance distance between the closest surface of the
cover glass and the objective front lens is termed the working
distance. In situations where the specimen is designed to be
imaged without a cover glass, the working distance is mea-
sured at the actual surface of the specimen. Generally, work-
ing distance decreases in a series of matched objectives as the
magnification and NA increase (see Table 2). Objectives in-
tended to view specimens with air as the imaging medium
should have working distances as long as possible, provided
that NA requirements are satisfied. Immersion objectives, on
the other hand, should have shallower working distances to
contain the immersion liquid between the front lens and the
specimen. Many objectives designed with close working dis-
tances have a spring-loaded retraction stopper that allows the
front lens assembly to be retracted by pushing it into the ob-
jective body and twisting to lock it into place (1). Such an ac-
cessory is convenient when the objective is rotated in the
nosepiece so that it will not drag immersion oil across the sur-
face of a clean slide. Twisting the retraction stopper in the op-
posite direction releases the lens assembly for use. In some
applications (see below), a long free working distance is in-
dispensable, and special objectives are designed for such use
despite the difficulty involved in achieving large NAs and the
necessary degree of optical correction.
One of the most significant advances in objective design
during recent years is the improvement in antireflection coat-
ing technology, which helps to reduce unwanted reflections
that occur when light passes through a lens system (4). Each
uncoated air-glass interface can reflect between 4% and 5%
of an incident light beam normal to the surface, resulting in a
transmission value of 95%–96% at normal incidence. Appli-
cation of a quarter-wavelength thick antireflection coating
Depth of
Depth of
Magnification
NA
Field (
µµm)
Focus (mm)
4×
0.10
15.5
0.13
10×
0.25
8.5
0.80
20×
0.40
5.8
3.8
40×
0.65
1.0
12.8
60×
0.85
0.40
29.8
100×
0.95
0.19
80.0
Table 3. Depth of Field and Depth of Focus

Vol. 33, No. 4 (2002)
BioTechniques 781
having the appropriate refractive index can decrease this val-
ue by 3%–4%. As objectives become more sophisticated with
an ever-increasing number of lens elements, the need to elim-
inate internal reflections grows correspondingly. Some mod-
ern objective lenses with a high degree of correction can con-
tain as many as 15 lens elements having many air-glass
interfaces. If the lenses were uncoated, then the reflection
losses of axial rays alone would drop transmittance values to
around 50%. The single-layer lens coatings once utilized to
reduce glare and improve transmission have now been sup-
planted by multilayer coatings that produce transmission val-
ues exceeding 99.9% in the visible spectral range.
Magnesium fluoride is one of many materials utilized in
thin-layer optical antireflection coatings, but most micro-
scope manufacturers now produce their own proprietary for-
mulations. The general result is a dramatic improvement in
contrast and transmission of visible wavelengths with a con-
current destructive interference in harmonically related fre-
quencies lying outside the transmission band. These special-
ized coatings can be easily damaged by mishandling, and the
microscopist should be aware of this vulnerability. Multilayer
antireflection coatings have a slightly greenish tint, as op-
posed to the purplish tint of single-layer coatings, an observa-
tion that can be employed to distinguish between coatings.
The surface layer of antireflection coatings used on internal
lenses is often much softer than corresponding coatings de-
signed to protect external lens surfaces. Great care should be
taken when cleaning optical surfaces that have been coated
with thin films, especially if the microscope has been disas-
sembled and the internal lens elements are subject to scrutiny.
The focal length of a lens system is defined as the distance
from the lens center to a point where parallel rays are focused
on the optical axis (often termed the principal focal point). An
imaginary plane perpendicular to the principal focal point is
called the focal plane of the lens system. Every lens has two
principal focal points for light entering each side, one in front
and one at the rear. By convention, the objective focal plane
that is nearer to the front lens element is known as the front
focal plane, and the focal plane located behind the objective
is termed the rear focal plane. The actual position of the rear
focal plane varies with objective construction but is generally
situated somewhere inside the objective barrel for high-mag-
nification objectives. Objectives of lower magnification often
have a rear focal plane that is exterior to the barrel, located in
the thread area or within the microscope nosepiece.
As light rays pass through an objective, they are restricted
by the rear aperture or exit pupil of the objective. The diame-
ter of this aperture varies between 12 mm for low-magnifica-
tion objectives down to around 5 mm for the highest-power
apochromatic objectives. Aperture size is extremely critical
for epi-illumination applications that rely on the objective to
act as both an imaging system and condenser, where the exit
pupil also becomes an entrance pupil. The image of the light
source must completely fill the objective rear aperture to pro-
duce even illumination across the viewfield. If the light source
image is smaller than the aperture, then the viewfield will ex-
perience vignetting from uneven illumination. On the other
hand, if the light source image is larger than the rear aperture,
then some light does not enter the objective and the intensity
of illumination is reduced.
Many of the microscope objectives being produced today
offer remarkably low degrees of aberration and other imper-
fections, provided the appropriate objective is selected and it
is used properly. Nevertheless, the microscopist needs to be
aware that objectives are not made to be perfect from every
standpoint but are designed to meet a certain set of specifica-
tions depending on the intended use, constraints on physical
dimensions, and price ranges. Therefore, objectives are made
with different degrees of correction for chromatic and spheri-
cal aberration, field size and flatness, transmission wave-
lengths, freedom from fluorescence, birefringence, and other
factors contributing to noise. In addition, they are designed to
be used under certain circumscribed conditions, such as with
specific tube lengths and tube lenses, type and thickness of
immersion media and cover glasses, wavelength ranges, field
sizes, ocular types, and special condensers.
REFERENCES
1.Davidson, M.W. and M. Abramowitz. 2002. Optical microscopy, p.
1106-1141. In J.P. Horniak (Ed.), Encyclopedia of Imaging Science and
Technology, vol. 2. John Wiley and Sons, New York.
2.Inoué, S. and R. Oldenboug. 1995. Microscopes, p. 17.1-17.50. In M.
Bass, E.W. Stryland, D.R. Williams, and W. Wolfe (Eds.), Handbook of
Optics: Devices, Measurements, and Properties, vol. 2. McGraw-Hill,
New York.
3.Inoué, S. and K.R. Spring. 1997. Video Microscopy: The Fundamentals,
p. 49-58. Plenum Press, New York.
4.Keller, H.E. 1995. Objective lenses for confocal microscopy, p. 111-126.
In J.B. Pawley (Ed.), Handbook of Biological Confocal Microscopy.
Plenum Press, New York.
5.Murphy, D.B. 2001. Fundamentals of Light Microscopy and Digital
Imaging, p. 43-59. Wiley-Liss, New York.
6.Pluta, M. 1988. Advanced Light Microscopy: Principles and Basic Prop-
erties, vol. 1, p. 135-238. Elsevier, New York.
7.Zieler, H.W. 1972. The Optical Performance of the Light Microscope,
Part 1, p. 81-90. Microscope Publications Ltd., Chicago.
Address correspondence to Dr. Michael W. Davidson, Na-
tional High Magnetic Field Laboratory, 1800 East Paul Dirac
Drive, The Florida State University, Tallahassee, FL 32310,
USA. e-mail: davidson@magnet.fsu.edu
Suggestions for contributions to the BioImaging
feature are welcomed by its editor, Dr. Steve
Paddock (paddock@facstaff.wisc.edu)
Wyszukiwarka
Podobne podstrony:
3 Abramowitz, Davidson Light Microscopy chap01
8 Abramowitz, Davidson Optical Microscopy Phase Contrast Microscopy
6 Abramowitz, Davidson Optical Microscopy
3 Abramowitz, Davidson Light Microscopy chap01
biotechnologia, TEST KOŃCOWY 200.., TEST KOŃCOWY 2001/2002
biotechnologia, TEST KOŃCOWY 200.., TEST KOŃCOWY 2001/2002
2002 04 33
2002 09 33
toleramcja kadm Wang 2002 Acta Biotechnologica
Biotechnologia w 6
etapy i perspektywy biotechnologii
(33) Leki stosowane w niedokrwistościach megaloblastycznych oraz aplastycznych
więcej podobnych podstron