
2006-01-0460
Effect of Active Muscle Forces on the Response of knee Joint
at Low Speed Lateral Impacts
Anurag Soni, Anoop Chawla and Sudipto Mukherjee
Indian Institute of Technology Delhi, Department of Mechanical Engineering, India
Copyright © 2005 SAE International
ABSTRACT
In vehicle-pedestrian collisions, lower extremities of
pedestrians are frequently impacted by the vehicle front
structure. The aim of the current study is to understand
the role of muscle activity in knee joint injuries at low
velocity lateral impacts, characteristic of vehicle-
pedestrian collisions. Therefore, a group of muscles in
the lower extremity are modeled using bar elements with
the Hill material model. The reflex response of the
muscle is then included. Simulations indicate that
muscle activation decreases the probability of failure in
knee ligaments.
INTRODUCTION
The issue of pedestrian safety has been a matter of
concern for public health practitioners and vehicle
designers (Ashton et al., 1977). Pedestrians represent
65% of the 1.17 million people killed annually in road
accidents worldwide (World Bank, 2001).
Epidemiological studies on pedestrian victims have
indicated that together with the head, the lower
extremities are the most frequently injured body region
(Chidester et al., 2001; Mizuno, 2003). The 2003
summary report of International Harmonized Research
Activities (IHRA) Pedestrian Safety Working Group
activity (Mizuno, 2003) has showed that 1,605
pedestrian victims in Australia, Germany, Japan and
USA, sustained a total of 3,305 AIS 2+ injuries, out of
which almost one third (32.6%) were to the lower
extremity. The injuries to lower extremities in car
crashes mainly include bone fractures and avulsion or
stretching in knee ligaments (Mizuno, 2005). To mitigate
the incidences and extent of lower limb injuries, it is
essential to understand the mechanism of these injuries,
and both experimental as well as numerical methods
have been widely used for this purpose.
For ethical reasons, volunteer experiments cannot be
performed in the higher injury severity range similar to
those in pedestrian-car crashes. Therefore, the loading
environment in pedestrian-car collisions has been
characterized by experiments using Post Mortem
Human Specimens (PMHS) (Bunketorp et al., 1981;
1983; Aldman et al., 1985; Kajzer et al., 1990; 1993;
1997; 1999; Ramet et al., 1995; Bhalla et al., 2003;
2005; Kerrigan et al., 2003; Bose et al., 2004; Ivarsson
et al., 2004; 2005). As cadavers have been used in
these experiments, these studies could not consider the
effect of live muscle actions such as involuntary muscle
reflexes, pre-impact voluntary muscle bracing etc.
Mechanical legforms (the EEVC legform by TRL;
FlexPLI (Konosu et al., 2005); Polar II pedestrian
dummy by Honda R&D; frangible legform by Dunmore et
al., 2005) have also been developed on the basis of
these tests, and as a result do not account for muscle
forces. Finite element (FE) studies offer an alternate
method of studying these effects.
Based on the results of PMHS studies, validated FE
models of pedestrian lower extremities have been
developed, and the knee injury mechanism and criteria
have been investigated (Schuster et al., 2000; Maeno et
al., 2001; Takahashi et al., 2001; 2003; Matsui et al.,
2001; Nagasaka et al., 2003; Chawla et al., 2004).
However, these FE models have not included the effect
of muscle actions, as yet.
Thus, neither the human surrogates nor the current FE
models include the effect of live muscles. It is however
reported that muscle active forces reduce the risk of
injuries in soft tissues (Brolin et al., 2005). According to
Pedestrian Crash Data Studies (PCDS) (Chidester et al.,
2001), pedestrian accidents occur for various pre-impact
postures. Postures are maintained due to muscle forces.
Louie et al., (1984) asserted that effective stiffness of the
knee joint increases with increase in muscle activation
and the number of recruited muscles. Pope et al., (1979)
have also demonstrated that muscles contracted for
posture control or for other motion function affect the
loading at the knee joint. Therefore, muscle forces are
expected to affect stresses and injuries in crashes.
To verify the hypothesis that contracted muscles protect
the knee joint during rapid loading, we have investigated
the effects of pre-impact active muscle forces on knee
ligament forces in pedestrian accidents using finite
element models. We have added muscles in the lower
extremity model of the THUMS human body model that
was validated for passive response by Chawla et al.,
(2004). The muscle elements, represented as bar
elements, were assigned the Hill material model to
simulate the effect of muscular contraction.
In order to study the effect of muscles, we have chosen
the leg configuration used by Kajzer et al., (1997; 1999).
The results obtained with deactivated muscles have
been compared with Kajzer experimental results as well
as simulation results from Chawla et al., (2004). Our
choice of this configuration was based on availability of
the base model and experimental data. The PCDS study
(Chidester et al., 2001) reports that this configuration is
a low probability event (only a 5% likelihood of
occurrence in pedestrian accidents). However, we have
opted for this configuration because our study focuses
on change caused by inclusion of muscle activation and
is not targeted at quantifying injuries in real crash
situations, as yet. Konosu et al., 2005 have raised
issues about the fidelity of the boundary conditions used
in Kajzer tests and the accuracy of their bending
moment calculations. However, in this study, we needed
a validated FE model that has the overall characteristics
exhibited by the human knee. Issues about the
relevance of boundary conditions and the accuracy of
bending moment calculations are hence not important in
this study.
After validating our model and the muscle definitions, we
have modeled a pedestrian in a standing posture with
muscle activation. Only the muscle forces required to
maintain the standing human posture are modeled
(without any evasive action) in the pre-impact stage.
Stretch reflex, by which an automatic counteraction
stabilizes a muscle to over stretching, was also modeled
in simulation. Ligament forces with and without muscle
activation for this posture have then been compared.
MATERIALS AND METHODS
FINITE ELEMENT MODEL DESCRIPTION
In the present work, the lower extremity model validated
by Chawla et al., (2004) was used as a base model and
40 lower extremity muscles were modeled on it using 1-
D bar elements.
Figure 1 shows the FE mesh of the simulation set up.
The model included the cortical and the spongy parts of
the pelvis, the femur, tibia, fibula, and the patella. The
cortical part of the bones was modeled by shell elements
while the spongy part was modeled by solid elements.
Apart from these, passive muscle and skin were also
modeled using solid elements and membrane elements
respectively. The four major knee ligaments, the anterior
cruciate ligament (ACL), the posterior cruciate ligament
(PCL), medial collateral ligament (MCL) and the lateral
collateral ligament (LCL), were modeled using
membrane elements. The default material properties
defined in THUMS have been retained in this study.
Figure 1 Modified THUMS model validated by Chawla et al., 2004 for
shear and bending load conditions of Kajzer test
MUSCLE MODELING
Mathematical models of lower extremity muscles have
been widely used to predict muscle and joint forces in
gait studies (Dul et al., 1984a; 1984b; Seireg et al.,
1973; Yeo, 1976; Hardt et al., 1978; Pedotti et al., 1978;
Crowninshield et al., 1981; Davy et al., 1987; White et
al., 1989; Glitch et al., 1997). Of late, Brolin et al., (2005)
has incorporated neck muscles in a finite element model
of the human cervical spine to study neck response in
traffic accidents. He showed that muscle activation
decreases the risk of injury to spinal ligaments. An
accurate representation of muscle geometric parameters
such as moment arm, fiber pennation angle, muscle
fiber length, and muscle size is needed to accurately
model the muscles.
Muscles follow curved paths due to the presence of
bony prominences and other soft tissues. The exact way
of representing a muscle’s line of action about a joint
would be to describe its three-dimensional centroidal
path on bones. However, the detailed description of a
muscle’s centroidal path is complex. Therefore muscles
are assumed to act along straight lines from origin to
insertion (Brand et al., 1982).
Investigators have used a variety of methods to identify
the origin of the lower extremity muscles and the
location of the point of insertion on the bone segment.
Brand et al., (1982); Friedrich and Brand, (1990); Seireg
and Arvikar, (1989) and Wickiewicz et al., (1983) have
dissected the fresh and embalmed cadavers, whereas
Pierrynowski and Morrison, (1985); Dostal and Andrews,
(1981); White et al., (1989); have identified the center of
muscle attachment points by measuring relevant points
on polymer models of bones. Yamaguchi et al., (1990)
report an extensive survey of human musculoskeletal
actuator parameters, including data from many
published sources. Subsequently Kepple et al., (1998)
generated an extensive three-dimensional database of
lower extremity musculoskeletal system from 52 dried
skeletal specimens.
In the present study, we have used the data of origin
and insertion locations of the muscles as reported in
White et al., (1989). The basis for selection of this
specific database was the similarity in height of the
reported male specimen (177 cm) and the THUMS
model (175 cm).
The points of origin and the orientations of four local
reference frames at the pelvic, femur, tibia and foot,
defined by White et al., (1989), were reproduced using
Altair Hyper Mesh
TM
. Origin and insertion locations of
each muscle were then digitized and mapped on to the
FE mesh of the cortical bone segments. The nodes
nearest to the two identified locations were selected and
joined by 1-D bar element to represent a muscle. Figure
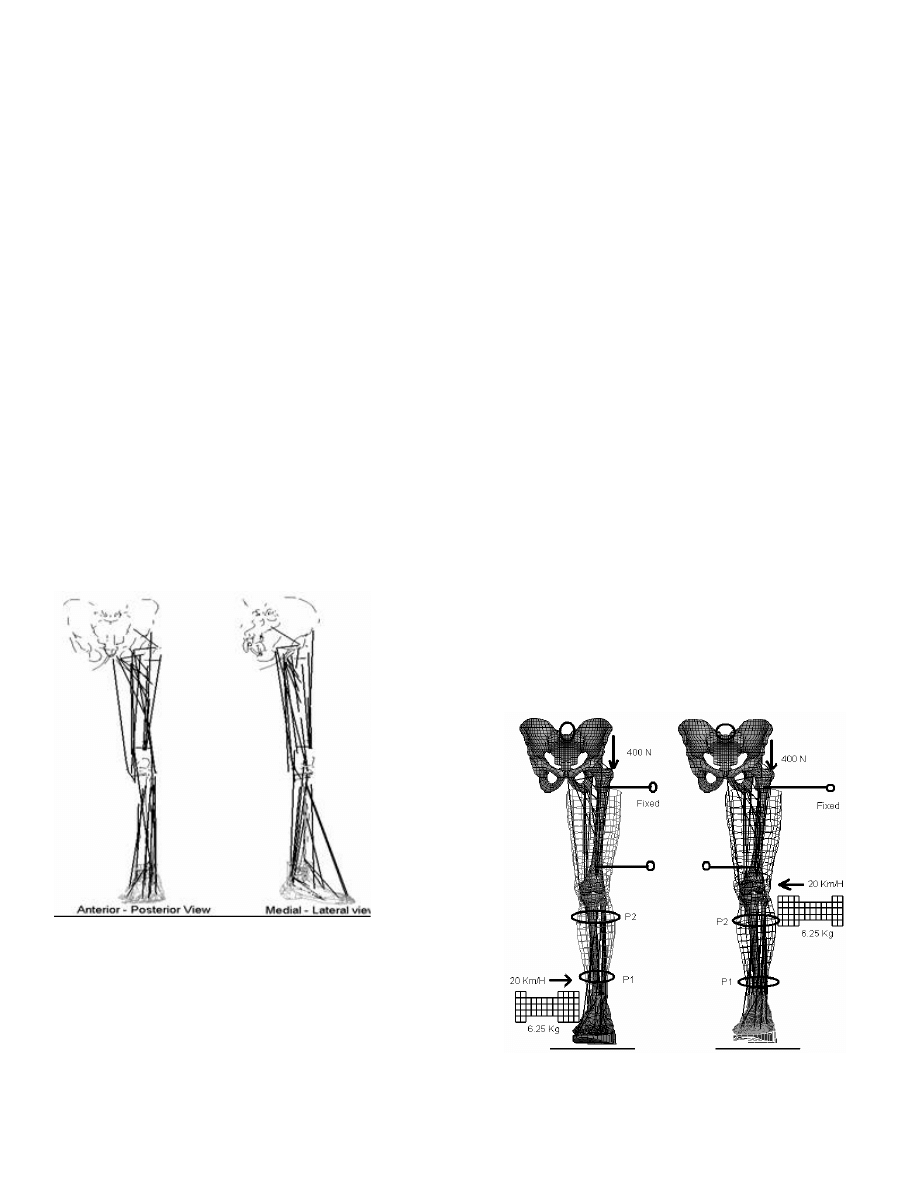
2 shows the lower extremity muscles thus modeled.
According to Brand et al., (1982), some muscles with
broad origin (e.g. Glutes Maximus, Glutes Medius,
Glutes minimus) or broad insertions (e.g. Glutes
Maximus, adductor brevis, adductor magnus) should be
defined by multiple bar elements to account for
functional independence in the different groups of
muscle fibers and their effect on torque prediction.
However, certain muscles like Vastus Internmedius and
Soleus have a broad origin and insertion, but can be
defined by single bar elements without significantly
affecting torque prediction (Brand et al., (1982))
Figure 2. Anterior-posterior and Medial-Lateral views showing 40 lower
extremity muscles modeled as bar elements for a standing posture.
Origin and insertion location of these muscles are defined according to
White et al. (1989).
Muscle parameters, such as optimal muscle length (L
opt
),
maximum isometric force (F
max
), maximum contraction/
elongation velocity (V
max
), pennation angle (
α), and an
initial value of activation level (N
a
), are required to define
the Hill type muscle bar element. The initial activation
level (N
a
) is defined as the ratio of a current force to the
maximum force that can be exerted by a muscle. Thus it
is a dimensionless quantity whose range is set in
Pamcrash
TM
to have a minimum value of 0.005 to
maximum value of 1. Activation value of 0.005
represents a muscle at rest whereas maximum value
(i.e.1) represents maximum activation in a muscle, such
as that for a maximum voluntary contraction (Winters et
al., 1988). Optimal muscle length and maximum velocity
of a muscle are related to the muscle fiber length at rest
(L
ofib
). The muscle length at rest was taken to be the
distance between the nodes where the muscle element
terminates. Maximum isometric force was calculated
from Physiological Cross-Section Area (PCSA) and
maximum muscle stress. The maximum muscle stress
varies from 20 N/cm
2
to 100 N/cm
2
(Winters et al.,
1988). Brolin et al., (2005) has reported a value of 50
N/cm
2
for neck muscles. Data for mammalian thigh
muscles suggests a higher value of 70 N/cm2 which has
been used for the study. At later stages of the work the
sensitivity of this parameter will be studied. The PCSA of
the muscles has been taken from Yamaguchi et al.
(1990) (Appendix A).
VALIDATION OF FINITE ELEMENT MODEL WITH
MUSCLES
To set up a base model, forty lower extremity muscles
were added to the FE model used by Chawla et al. As a
first step it was considered important to ascertain that
the passive model validates against known experimental
corridors. In-vivo passive response from a cadaver was
modeled by setting the minimum activation level of 0.005
for each muscle and deactivating the reflex action. As
the current FE model is an extension of Chawla’s model,
we have compared it with the simulation results reported
by Chawla et al., (2004) and the experimental results of
Kajzer et al., (1999).
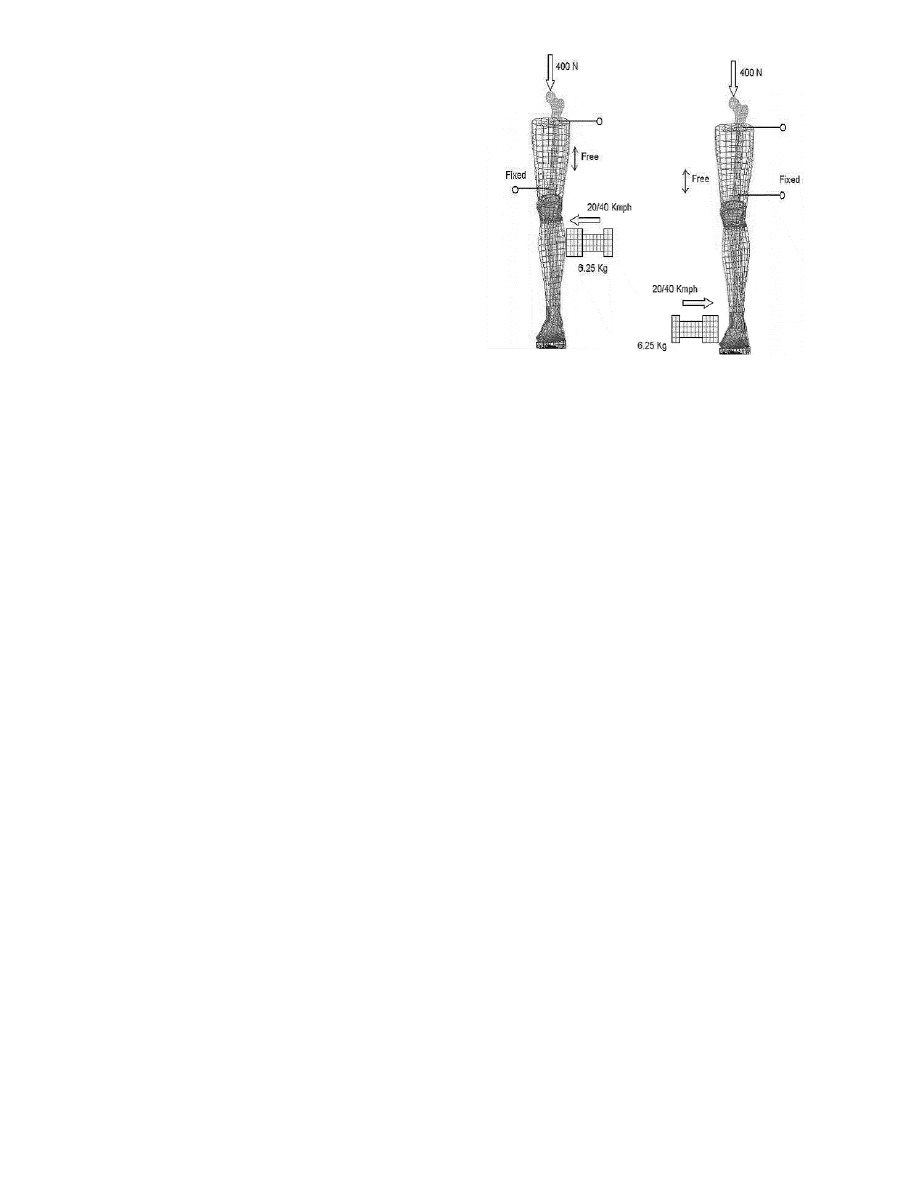
Figure 3 Simulation set up for FE model validation in bending (left) and
shear (right) load at an impactor speed of 20 Km/h. Passive behavior
of muscles is modeled by assigning a minimum value of 0.005 as initial
activation level to each muscle.
Simulations for the validation were performed using
PAM-CRASH
TM
, an explicit dynamic solver. Figure 3
shows the set up used to perform the simulation to
validate the FE model.
The sacrum and two locations of the femur were fixed
(as shown in Figure 3) and a pre-load of 400 N
representing body weight was applied at the top of the
femur. The impactor force, lower and upper tibia
displacements at locations (P1 and P2) and the ligament
forces were compared with the simulation results of
Chawla et al. (2004) and test results of Kajzer et al.
(1999).
Comparison of passive loading cases
Figure 4 shows the impactor forces in shear loading
simulations with inactivated muscles and those reported
by Chawla et al., (2004) and Kajzer et al., (1999) for the
impactor speed of 20 km/h. Peak impactor forces did not
change significantly. Small variation in the force history
is expected due to inclusion of minimum muscle forces
corresponding to minimum activation levels (0.005) and
the same is observed. However, the impact force
correlates well with the forces reported by Chawla et al.,
(2004) and Kajzer et al., (1999) (correlation of 0.91 and
0.95 respectively, as obtained using the “correl” function
in Microsoft Excel
TM
).
Impactor Force in Shear
0
1000
2000
3000
4000
0.000
0.008
0.015
0.023
0.030
Time (sec)
C
ont
ac
t For
c
e
(N
)
Present Study
Chawla et al. 2004
Kajzer et al. 1999
Figure 4 Comparison of Impactor force in shear loading.
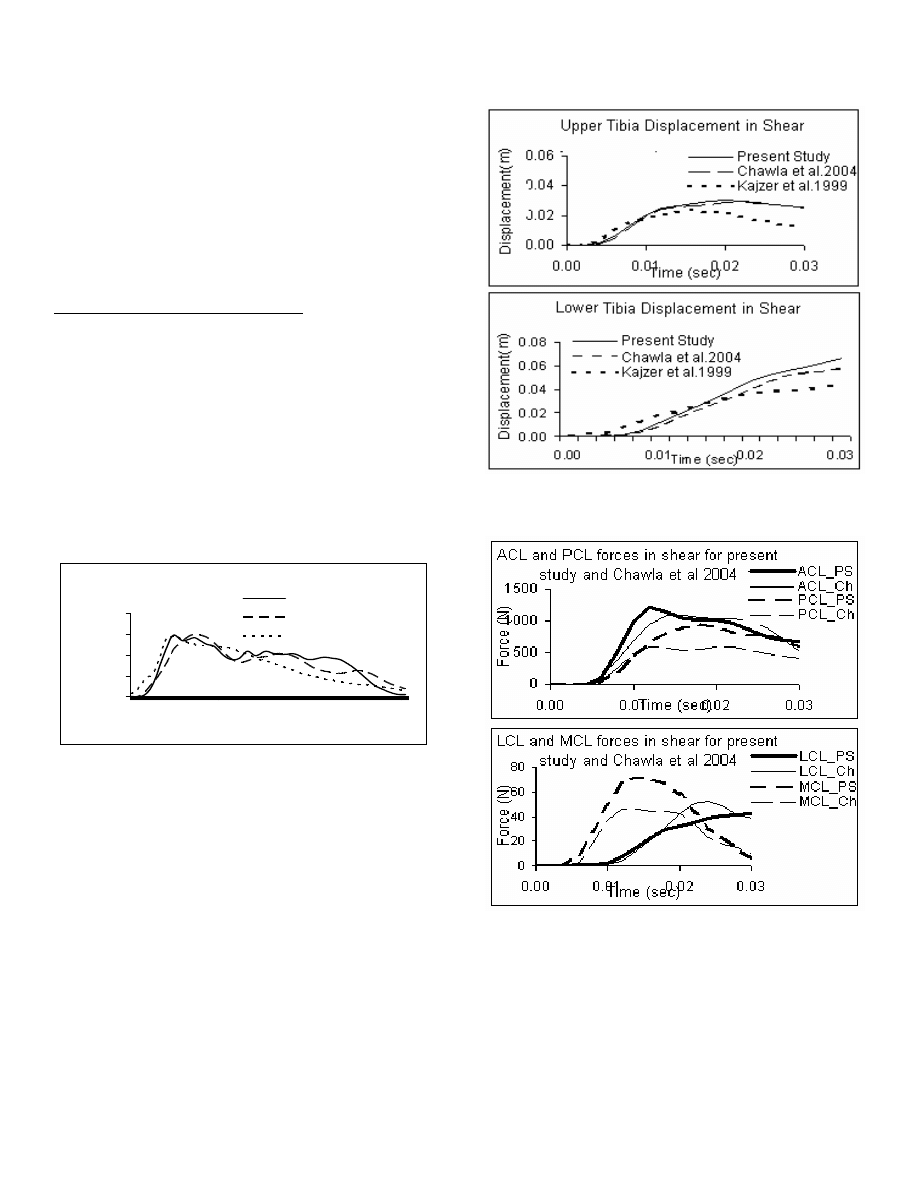
Figure 5 compares the lower and upper tibia
displacements (at P1 and P2 in Figure 3) for shear
loading.
The lower displacements curves match with the
displacement curves of Chawla et al. and Kajzer et al.
shear test with correlations of 0.99 and 0.97
respectively. The upper tibial displacements show
correlations of 0.99 and 0.91 respectively with respect to
Chawla et al., (2004) and the experimental results
respectively. The upper tibial displacements deviate
slightly from the experimental results after about 15-20
ms. However, these values are very sensitive to the
point chosen for recording the displacement as
significant tibial rotations are observed during this
phase. The current curve has been taken at a point
which is just above the impactor and which was
considered to be the closest to the experimental point
used by Kajzer. The corresponding point has also been
chosen in the Chawla et al., (2004) model for
comparison.
Figure 5 Comparison of upper and lower tibia displacement for 20 km/h
in shear
Figure 6 Comparison of forces in knee ligaments in shear load
conditions for 20 km/h. (The PS curves are curves for the present
study, while the Ch curves are curves from Chawla et al., 2004)
Figure 6 compares the ligament forces from the two
simulations. The PCL and ACL loadings between 0.01 s
and 0.03 s differ in the two simulations. In the
simulations it was observed that during this period, the
muscle forces were constant. However, the location of
the instantaneous center of rotation (ICR) of the knee
joint changes due to a change in the direction of muscle
forces as shown in Figure 7. This changes the moment
arms of the muscles with respect to the effective point of
knee rotation, thereby changing the torque produced by
the muscles. Consequently the PCL and ACL loading
were redistributed even though the external
measurements like kinematics and support loading were
the same.
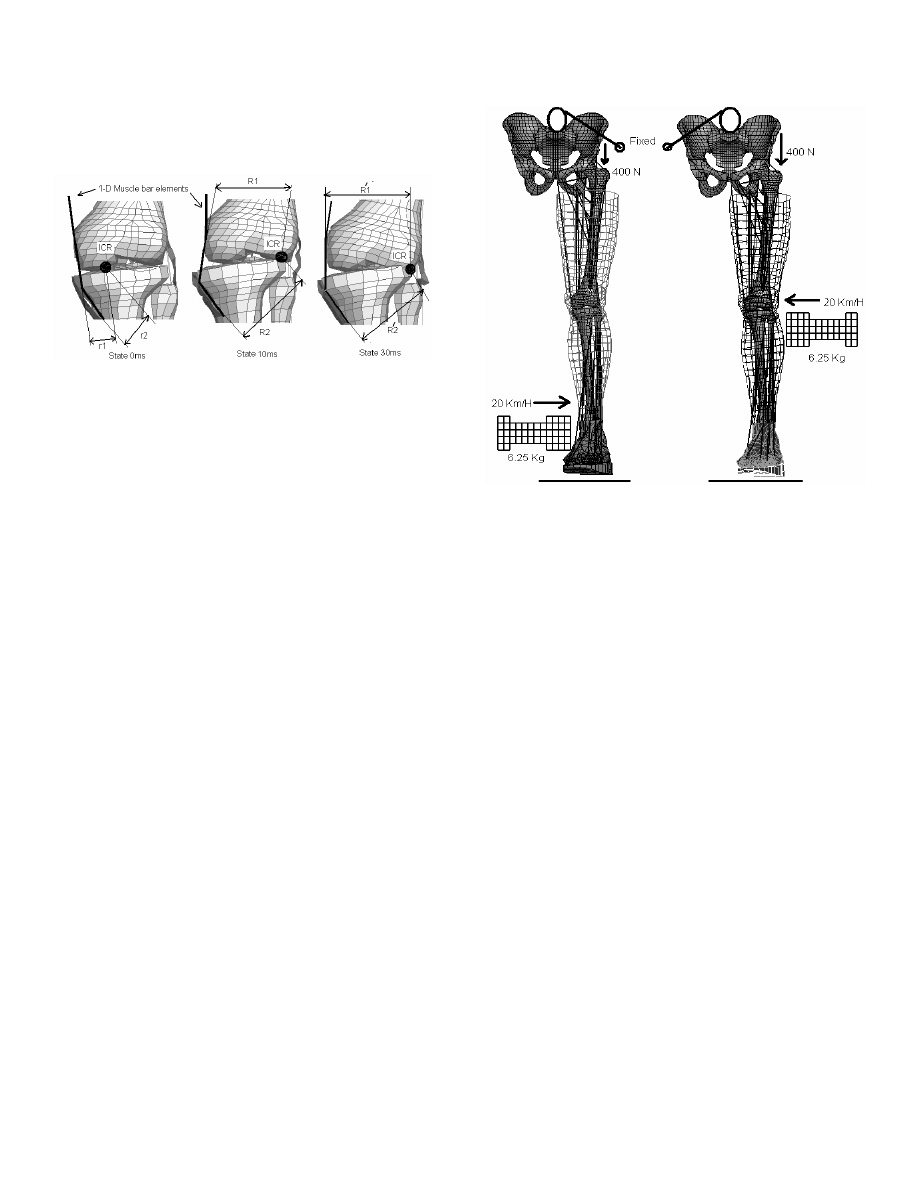
Figure 7 Change in instantaneous center of rotation and change in
moment arms of muscle forces during post impact movement of the
knee.
We note that the peak ligament forces in passive muscle
simulations and those reported by Chawla et al., (2004)
vary by about 10%. However, the experimentally
measured parameters, the impactor force (corr > 0.95),
and the lower extremity kinematics (corr > 0.97) match.
Therefore, we conclude that the response of the FE
model with minimum muscle activation captures the
characteristics of cadaver knee loading. The forces in
the MCL are seen to be very low. This is attributed to the
ligament stiffnesses being used, which are currently as
originally defined in THUMS.
SIMULATIONS FOR STANDING POSTURE
Effect of muscle activation in a free standing posture has
been studied next. In these simulations, a significant
difference from the Kajzer test is that the pins on the
femur were not modeled. Even though the impact
locations near the ankle and knee were the same, the
loading did not correspond to shear and bending. They
are hence referred to as below-knee and at-ankle
impacts (Figure 8). There are no earlier results for free
standing impact tests to compare with. To represent
cadaver tests, simulations were carried out with muscle
response deactivated. In the second step, the standing
posture of a pedestrian with muscle activation needed to
maintain stability in a gravity field is modeled using data
reported by Kuo et al., (1993). Rupture of ligaments was
not modeled as ligament rupture is not common in knee
injuries during pedestrian accidents (Chidester and
Isenberg, 2001). The response of the standing posture
modeled with active muscle forces was compared with
the passive model response to determine the role of
muscle loading.
For simulations with deactivated muscles, the minimum
muscle activation level of 0.005 was assigned to each
muscle and all reflex actions were deactivated.
The activation values used to model active muscles for
standing posture are listed in Table A1 in appendix A.
Figure 8 Simulation set up for below knee impact (left) and ankle
impact (right). Constraints are removed from femur and adequate
activation levels are defined in the Hill type muscle bar elements to
maintain an upright standing posture.
Ackerman, (2002) has suggested a delay of 20 ms for
the onset of involuntary reflex for skeletal muscles. A
delay of 20 ms is therefore taken for the onset of the
involuntary reflexive action after the impactor touches
the leg. Stretch reflexes that automatically maintain
posture were also enabled.
RESULTS AND DISCUSSION
The loading can be divided into two phases. In the initial
phase, the impactor contacts the lower extremity which
is initially at rest and passes energy in-elastically to the
leg segments. Relative movement between tibia and
femur starts only after the impactor force crosses a
certain threshold, leading to fall in impactor contact
forces and a shear loading in the knee joint.
In the second phase, the motion of the lower extremity
creates a bending motion at the knee joint called varus
and valgus. The large angular displacement between
femur and tibia due to this bending motion leads to
stretching in ligaments and the ligament forces peak
during this phase.
BELOW-KNEE IMPACT
In simulations with activated muscles, it was observed
that the impactor force reached its peak value of 2720 N
about 5 ms after initial contact with the leg. During this
interval no lateral movement was noticeable at the knee.
As the impactor force peaks, the femur and tibia condyle
started moving laterally and away from the impactor.
This event is the onset of ligament loading. In the initial
phase which lasts till 10 ms, forces in the ACL, PCL and
MCL increase due to shear displacement. The knee joint
motion then changes from shear to valgus due to
rotation of the leg. After this transition, forces in ACL and
PCL decreased, whereas the force in MCL remained
high till about 40 ms. A similar phenomenon was
observed in simulations with deactivated muscles.
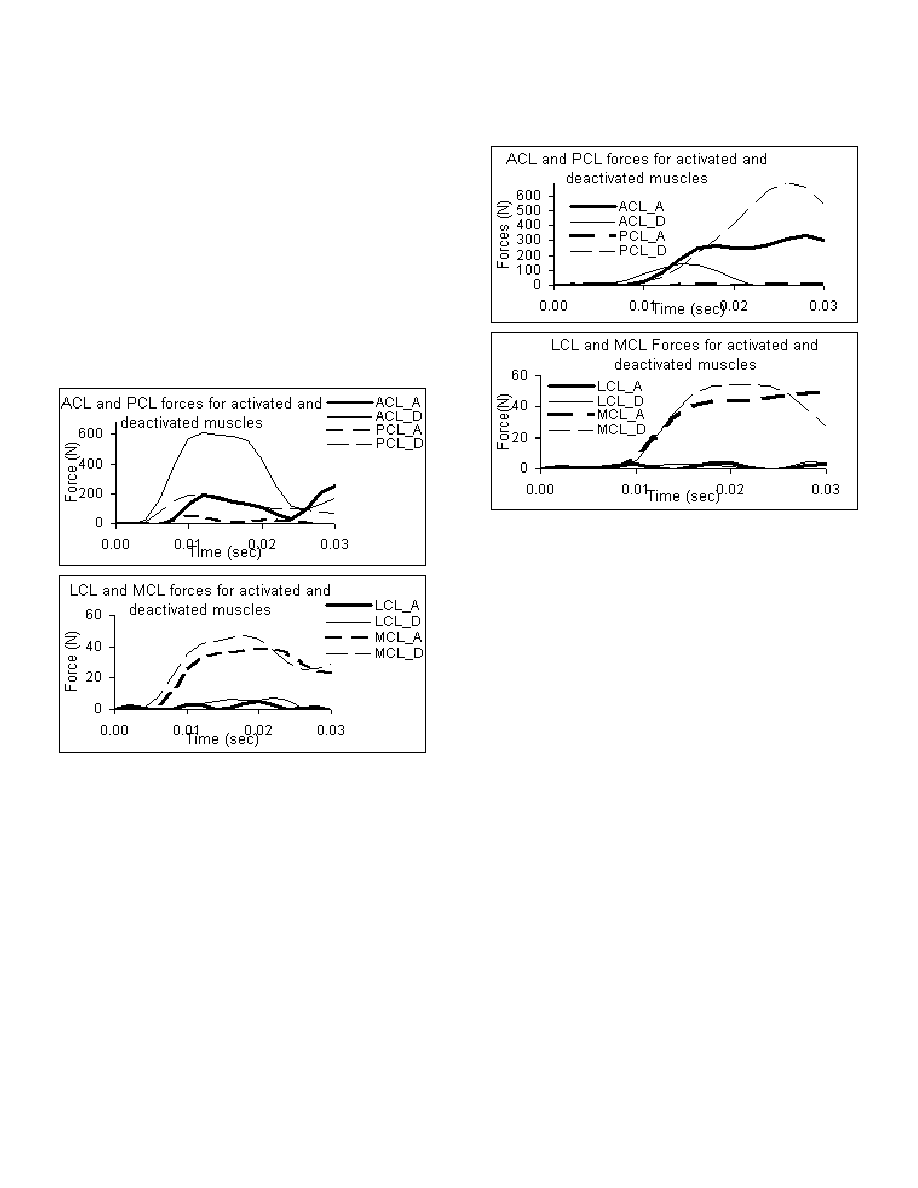
Forces in the knee ligaments for the standing posture
with activated and deactivated muscles for the below-
knee impact have been plotted in Figure 9. With
activated muscles, a maximum force of 180 N in ACL,
60 N in PCL and 40 N in MCL was predicted. For
deactivated muscles, significantly higher peak values
(615N in ACL, 194N in PCL, 48 N in MCL) were
predicted.
Figure 9 Comparison of forces in knee ligaments for the standing
posture with below-knee impact. The A curves are curves with
activated muscles and the D curves are those with deactivated
muscles.
ANKLE IMPACT
Figure 10 compares forces in knee ligaments for
standing posture with activated and deactivated muscles
for the ankle impact.
In the simulation with activated muscles, the impactor
force reaches a peak value of 2400 N in 6 ms. Over this
duration no movement was noticeable in the lower leg.
From 6 ms to 10 ms the lower leg forces the femur in the
upward direction and a center of rotation was
established at the extreme lateral point of contact
between the tibia and femur condyles. Subsequently,
from 10 ms to 20 ms, the lower leg continued rotating
about this point. During this interval, forces in ACL and
MCL increased as these ligaments along with the
activated muscles resisted the tibia rotation. From 20 ms
onwards, muscle forces increased due to the onset of
reflex action. The foot flexed in the saggital plane away
from the tibia and started rotating externally.
Figure 10 Comparison of forces in knee ligaments for the standing
posture with ankle impact loading. The A curves are curves with
activated muscles and the D curves are those with deactivated
muscles.
Due to this flexion of the foot, the tibia plateau moved a
little higher in the posterior side, relieving the PCL and
tightening the ACL. Therefore, a second peak in the ACL
force is observed (Figure 10) whereas the force in PCL
has reduced.
In simulations with deactivated muscles, these events
are not observed as reflex actions do not kick in.
Therefore forces in PCL stay higher. Peak PCL forces
for the case of deactivated muscles is about 700 N
which is more than twice the peak ACL loading of 300 N
in the case of activated muscles.
CONCLUSION
A lower extremity finite element model, representing a
standing posture, with muscles modeled as Hill elements
was developed. Reflexive muscle action was included in
the model. A comparison of the shear and bending loads
at low velocity lateral impacts showed a good correlation
with experimental data (Kajzer et al., 1999) as well as
with earlier simulation data (Chawla et al., 2004). Having
thus established the suitability of the model for further
study, the effect of muscle activation has then been
examined in lateral impacts in the standing posture.
In lateral impacts for free standing postures, the
activation of lower extremity muscles in simulation
predicts a reduction in peak knee ligament forces by a
factor of two or more. Since ligament loading is

predicted to be lower with muscle activation, the
likelihood of ligament injury in active postures may be
expected to be lower than that predicted by cadaver
tests.
LIMITATIONS AND FURTHER IMPROVEMENTS
In our study, the data for point of origin and insertion
was from White et al., (1989). The basis for selection of
this study was the similarity in the height of the reported
male specimen (177 cm) and THUMS (AM50) (175 cm),
there is still a difference of 2 cm in their body height.
According to Winter et al (2005) the length of the lower
extremity segment is on the average 0.53 times the total
body height. Using this estimate, the difference in the
lower extremity segments is about 1 cm. This difference
can be further reduced by using scaling techniques.
Dimensions of individual segments (femur, tibia, fibula
and pelvis) required to calculate scaling factors in each
direction, were not available in the literature. Apart from
this, THUMS represents a 50
th
percentile American male
and its segments length are not according to the
standard fraction of total body height. However, we do
not anticipate that a difference of 1 cm in length of lower
extremities will change the results significantly.
The effect of patella on the moment-arm seen by the
quadricep muscles (vastus lateralis, vastus medialis,
vastus intermediate, and rectus femoris) has not been
taken into account. Thus, the torque produced by these
muscles at the knee joint is underestimated. The
strategy for modeling the patella effect presented by
Brand et al., (1982) could be used for more accurate
modeling.
In the present study we have adopted a straight line
geometric model of the muscle because of the simplicity
of definition using the origin and insertion locations of a
muscle. This approach can lead to errors for muscles
which do not work in a straight line (gracilis,
semitendinosis, tibialis posterior, flexor digitorium
longus, flexor hallucis longus, tibialis anterior, extensor
hallucis longus, extensor digitorium longus, peroneus
tertius, peroneous brevis, and peroneus longus).
Multiple points could be used in the muscle definition to
account for the curved path of some muscles.
For further improvements in the current finite element
model, tendons should also be modeled along with the
muscles to consider their effects. Other than the
limitations due to muscle modeling, the basic THUMS
model is not completely bio-fidelic yet as reported in
Chawla et al., (2004). This could also lead to some
errors.
ACKNOWLEDGEMENTS
The authors would like to acknowledge the support from
the Transportation Research and Injury Prevention
Program (TRIPP) at Indian Institute of Technology Delhi
and the Volvo Research Foundation. The authors also
acknowledge Toyota Central Research and
Development Lab (TCRDL) for providing the finite
element human body model, Total Human body Model
for Safety (THUMS) which has been used in this study.
REFERENCES
1. Ackerman U., PDQ Physiology (2002) Ch. (2), at,
www.fleshandbones.com/readingroom/pdf/226.pdf
2. Aldman, B., Kajzer, J., Bunketorp, O., Eppinger, R.
(1985) An experimental study of a modified
compliant bumper. In Proceedings of 10
th
International Technical Conference on the
Experimental Safety Vehicles.
3. Ashton, S., J., Pedded, J., B., Mackay, G., M. (1977)
Pedestrian injuries, the bumper and other front
structure. International IRCOBI conference on the
Biomechanics of Impact, pp.33-51.
4. Bhalla, K., Bose, D., Madeley, N.,J., Kerrigan, J.,
Crandall, J., Longhitano, D., and Takahashi, Y.
(2003) Evaluation of the response of mechanical
pedestrian knee joint impactors in bending and
shear loading, In Proceedings of the 2003 ESV
conference.
5. Bhalla, K., Takahashi, Y., Shin, J., Kam, C., Murphy,
D., Drinkwater, C., J., Crandall. (2005) Experimental
investigation of the response of the human lower
limb to the pedestrian impact loading environment.
Society of Automotive Engineers World Congress,
SAE paper, 2005-01-1877
6. Bose, D., Bhalla, K., Rooij, L., Millington, S., Studley,
A., and Crandall, J., (2004) Response of the knee
joint to the pedestrian impact loading environment.
SAE paper number 2004-01-1608.
7. Brand, R., Crowninshield, R., Wittstock, C.,
Pederson, D., Clark, C. and Van Frieken, F. (1982)
A model of lower extremity muscular anatomy.
Journal of Biomechanical Engineering 104, 304-310.
8. Brolin, K.,Halldin, P. and Leijonhfvud, I. (2005) The
effect of muscle activation on neck response. Traffic
injury prevention, 6: 67-76.
9. Bunketorp, O. et al., (1981) Experimental studies on
leg injuries in car-pedestrian impacts. IRCOBI,
pp.243-255.
10. Bunketorp, O. et al., (1983) Experimental study of a
compliant bumper system. SAE Paper Number
831623.
11. Chawla, A., Mukherjee, S., Mohan, D. and Parihar,
A. (2004) Validation of lower extremity model in
THUMS. IRCOBI 2004.
12. Chidester, A. B., Isenberg, R. A. (2001) Final report -
the pedestrian crash data study. In Proceedings of
the 17 International Technical Conference on the
Enhanced Safety of Vehicles.
13. Crowninshield, R. and Brand, R. A. (1981) A
physiologically based criterion of muscle force
prediction in locomotion. Journal of Biomechanics
14, 793-801.

14. Davy, D. T. and Audu, M. L. (1987) A dynamic
optimization technique for predicting muscle forces
in swing phase of gait. Journal of Biomechanics 20,
187-201.
15. Dostal, W. F. and Andrews, J. G. (1981) A three-
dimensional biomechanical model of hip
musculature. Journal of Biomechanics 14, 803-812.
16. Dul, J., Townsend, M., A., Shiavi, R. and Johnson,
G. E. (1984 a) Muscular Synergism- I. On criteria for
load sharing between synergistic muscles. Journal
of Biomechanics 17, 663-673.
17. Dul, J., Johnson, G. E., Shiavi, R. and Townsend, M,
A. (1984 b) Muscular Synergism- II. A minimum
fatigue criteria for load sharing between synergistic
muscles. Journal of Biomechanics 17, 675-684.
18. Dunmore, M., Brooks, R., McNally, D., Madeley, J.,
(2005). Development of an alternative frangible knee
element for a pedestrian safety legform. In
proceedings of 2005 IRCOBI Conference.
19. Friedrich, J. A. and Brand, R. A. (1990) Muscle fiber
architecture in the human lower limb. 23, 91-95.
20. Glitch, U. and Baumann, W. (1997) The three-
dimensional determination of internal loads in the
lower extremity. Journal of Biomechanics 30, 1123-
1131.
21. Hardt, D. E. (1978) Determining muscle forces in the
leg during normal human walking –an application
and evaluation of optimization methods. Journal of
Biomechanical Engineering 100, 72-80.
22. Ivarsson, J., Lessley, D., Kerrigan, J., Bhalla, K.,
Bose, D., Crandall, J., Kent, R., (2004) Dynamic
response corridors and injury thresholds of the
pedestrian lower extremities. In Proceedings of 2004
IRCOBI Conference.
23. Ivarsson, J., Kerrigan, J., Lessley, D., Drinkwater,
C., Kam, C., Murphy, D., Crandall, J., Kent, R.
(2005) Dynamic response of corridors of the human
thigh and leg in non midpoint three-point bending.
Society of Automotive Engineers World Congress,
SAE paper, 2005-01-0305
24. Kajzer, J., Cavallero, S., Ghanouchi, S., Bonnoit, J.,
(1990) Response of the knee joint in lateral impact:
Effect of shearing loads. IRCOBI.
25. Kajzer, J., Cavallero, S., Bonnoit, J., Morjane, A.,
Ghanouchi, S., (1993) Response of the knee joint in
lateral impact: Effect of bending moment. IRCOBI.
26. Kajzer, J., Schroeder, G., Ishikawa, H., Matsui, Y.,
Bosch, U. (1997) Shearing and Bending Effects at
the Knee Joint at High Speed Lateral Loading.
Society of Automotive Engineers, SAE Paper
973326.
27. Kajzer, J., Ishikawa H., Matsui Y., Schroeder G.,
Bosch U. (1999) Shearing and Bending Effects at
the Knee Joint at Low Speed Lateral Loading.
Society of Automotive Engineers, SAE Paper 1999-
01-0712.
28. Kepple, T. M., Sommer, H., Siegel, K. L. and
Stanhope, S. J. (1998) A three-dimensional
musculoskeletal database for the lower extremities.
31, 77-80.
29. Kerrigan, J., Bhalla, K., Madeley, N., Funk, J., Bose,
D., Crandall, J. (2003) Experiments for establishing
pedestrian impact lower injury criteria. SAE Paper
2003-01-0895.
30.
Konosu A., Issiki, T., Tanahashi M. (2005)
Development of a biofidelic flexible pedestrian leg-
form impactor (Flex -PLI 2004) and evaluation of its
biofedility at the component level and the assembly
level. Society of Automotive Engineers World
Congress, SAE paper, 2005-01-1879.
31. Kuo, A. D. and Zajac, F. E. (1993) A biomechanical
analysis of muscle strength as a limiting factor in
standing posture. Journal of Biomechanics 26, 137-
150.
32. Louie, J. K., Kuo, C. Y., Gutierrez, M. D. and Mote,
C. D. J. (1984) Surface EMG measurements and
torsion during snow skiing: laboratory and field tests.
Journal of Biomechanics 17, 713-724.
33. Maeno, T. and Hasegawa, J. (2001) Development of
a finite element model of the total human model for
safety (THUMS) and application to car-pedestrian
impacts. 17th international ESV conference, Paper
No. 494.
34. Matsui, Y. (2001) Biofidelity of TRl legform impactor
and injury tolerance of human leg in lateral impact.
Stapp Car Crash Journal, Vol 45
35. Mizuno, Y. (2003) Summary of IHRA Pedestrian
safety WG activities (2003) – proposed test methods
to evaluate pedestrian protection afforded by
passenger cars. In Proceedings of the 18
th
International Technical Conference on the
Enhanced Safety of Vehicles.
36. Mizuno, Y. (2005) Summary of IHRA Pedestrian
safety WG activities (2005) – proposed test methods
to evaluate pedestrian protection afforded by
passenger cars. In Proceedings of the 19
th
International Technical Conference on the
Enhanced Safety of Vehicles.
37. Nagasaka, K., Mizuno, K., Tanaka, E., Yamamoto,
S., Iwamoto, M., Miki, K. and Kajzer J. (2003) Finite
element analysis of knee injury in car-to-pedestrian
impacts. Traffic injury prevention, 4:345-354.
38. Pedotti, A., Krishnan, V. V. and Stark, L. (1978)
Optimizing of muscle force sequencing in human
locomotion. Mathl. Biosci. 38, 57-76.
39. Pierrynowski, M. R. and Morrison, J. B. (1985) A
physiological model for the evaluation of muscular
forces in human locomotion theoretical aspects.
Mathl Biosci. 75, 69-101.
40. Pope, M. H., Johnson, R. J., Brown, D. W., and
Tighe, C. (1979) The role of musculature in injuries
to the medial collateral ligament. J. Bone Jt Surg.
62-A, 398-402.
41. Ramet, M., Bouquet, R., Bermond, F., Caire, Y.
(1995) Shearing and Bending Human Knee Joint
Tests In Quasi-Static Lateral Load. Proceeding of
the International Conference on the Biomechanics of
Impact (IRCOBI).
42. Schuster, J. P., Chou, C. C., Prasad, P.,Jayaraman,
G. (2000) Development and validation of a

pedestrian lower limb non-linear 3-D finite element
model. 2000-01-SC21, Vol. 44. Stapp Car Crash
journal.
43. Seireg, A. and Arkivar, R. J. (1973) A mathematical
model for evaluation of forces in lower extremities of
the musculoskeletal system. Journal of
Biomechanics 6, 313-326.
44.
Seireg, A. and Arvikar, R.J. (1989). Biomechanical
Analysis of the Musculoskeletal Structure for
Medicine and Sports. Hemisphere Publishing
Corporation, New York.
45. Takahashi, Y., Kikuchi, Y. (2001) Biofidelity of test
devices and validity of injury criteria for evaluating
knee injuries to pedestrians, Proceedings of the ESV
conference.
46. Takahashi, Y., Kikuchi, Y., Mori, F., Konosu, A.
(2003) Advanced FE lower limb model for
pedestrians. 18th International ESV conference,
Paper no. 218.
47. White, S. C., Yack, H. J. and Winters, D. A. (1989) A
three dimensional musculoskeletal model for gait
analysis, anatomical variability estimates. Journal of
Biomechanics 22, 885-893.
48. Wickiewicz, T. L., Roy, R. R., Powell, P. L. and
Edgerton, V. R. (1983) Muscle architecture of
human lower limb. Clin. Ortho. Rel. Res. 179, 275-
283.
49. Winters, J. M. and Stark, L. (1988) Estimated
mechanical properties of synergistic muscles
involoved in movements of a variety of human joints.
Journal of Biomechanics 12, 1027-1041.
50. Winter D. A., (2005) Biomechanics and motor
control of human movement. 3
rd
edition John Wiley
and Sons, New Jersey.
51.
World Bank (2001) Road Safety,
http://www.worldbank.org/transport/roads/safety.html
52. Yamaguchi, G., Sawa, A., Moran, D., Fessler, M.
and Winters, J. (1990) A survey of human
musculotendon actuator parameters. In: Winters, J.
Woo, S., (Eds.) Multiple Muscle Systems, Springer,
New York pp. 717-773.
53. Yeo, B. P., (1976) Investigation concerning the
principle of minimum total muscular force. Journal of
Biomechanics 9, 413-416.

APPENDIX - A
40 lower extremity muscles are defined in the local
reference frames according to White et al. (1989). Data
used to define Hill muscle card for a muscle are listed in
the Table A.1.
Table A.1. Data for Lower extremity muscles
Muscle
PCSA (cm
2
) L
opt
(mm)
σ
max
(N/cm
2
)
F
max
(N)
Na
Vastus Lateralis
17.76
336
70
1243
0.1
Vastus
Intermedius 9.03 178 70 632 0.1
Vastus
Medialis
14.04
294 70 982 0.1
Rectus
Femoris
9.03 387 70 632 0.1
Soleus 15.08
390
70
1055
1.0
Gastrocnemius
Medialis
9.88 482 70 691 1.0
Gastrocnemius
Lateralis
7.73 474 70 541 1.0
Flexor Hallucis Longus
2.90
406
70
203
0.1
Flexor Digitorium Longus
1.96
424
70
137
0.1
Tibialis
Posterior
3.41 391 70 238 1.0
Biceps Femoris (LH)
9.89
436
70
692
1.0
Biceps Femoris (SH)
7.24
188
70
506
1.0
Semimembranosus 9.96 409 70 697 0.1
Semitendinosus
7.99 455 70 559 0.1
Tibialis
Anterior
6.28 365 70 439 0.5
Extensor Digitorium Longus
2.85
420
70
199
0.1
Extensor Hallucis Longus
2.85
230
70
199
0.1
Gracilis
5.02 427 70 351 0.1
Adductor Brevis 1
4.44
113
70
310
0.5
Adductor brevis 2
4.44
145
70
310
0.5
Adductor
Longus
7.91 217 70 553 0.5
Adductor Mangus 1
8.66
97
70
606
0.5
Adductor Mangus 2
8.66
154
70
606
0.5
Adductor Mangus 3
8.66
320
70
606
0.5
Peroneus
Brevis
2.97 262 70 207 1.0
Peroneus
longus
4.61 381 70 322 1.0
Peroneus
Tertius
1.76 140 70 123 0.1
Piriformis
8.66 105 70 606 0.1
Pectineus
7.50 104 70 525 0.1
Obturatorius
Internus
9.99
68 70 699
0.1
Obturatorius
Externus
3.22
72 70 225
0.1
Sartorius
4.17 525 70 291 0.1
Tensor Fasciae Latae
8.23
145
70
576
1.0
Glutaeus Maximus
16.71
160
70
1169
1.0
Glutaeus Medius 1
11.73
135
70
821
0.1
Glutaeus Medius 2
11.73
125
70
821
0.1
Glutaeus Medius 3
5.62
110
70
393
0.1
Glutaeus Minimus 1
5.62
95
70
393
0.1
Glutaeus Minimus 2
5.62
85
70
393
0.1
Glutaeus Minimus 3
5.62
80
70
393
0.1
* Na represents initial activation level in a muscle during standing posture. These values have been taken from Kuo et al.,
(1993).
Wyszukiwarka
Podobne podstrony:
Effect of long chain branching Nieznany
4 effects of honed cylinder art Nieznany
Effect of long chain branching Nieznany
Effect of Kinesio taping on muscle strength in athletes
Effects Of 20 H Rule And Shield Nieznany
Effect of Kinesio taping on muscle strength in athletes
effects of kinesio taping on the timing and ratio of vastus medialis obliquus and lateralis muscle f
The effect of duration of stretching hamstring muscles
53 755 765 Effect of Microstructural Homogenity on Mechanical and Thermal Fatique
Effect of File Sharing on Record Sales March2004
31 411 423 Effect of EAF and ESR Technologies on the Yield of Alloying Elements
21 269 287 Effect of Niobium and Vanadium as an Alloying Elements in Tool Steels
Impact of opiate addiction on n Nieznany
(10)Bactericidal Effect of Silver Nanoparticles
Effect of?renaline on survival in out of hospital?rdiac arrest
Effects of the Great?pression on the U S and the World
Effects of the Atomic Bombs Dropped on Japan
więcej podobnych podstron