
1
e-Polymers 2002, no. 046.
http://www.e-polymers.org
Review:
Effect of long chain branching on linear-viscoelastic melt
properties of polyolefins
Juanfran Vega, Marina Aguilar, Jon Peón, David Pastor, Javier Martínez-Salazar
*
Grupo de Investigación y Desarrollo en Macromoléculas (GIDEM), Instituto de
Estructura de la Materia (IEM), Consejo Superior de Investigaciones Científicas
(CSIC), C/Serrano 113bis, 28006 Madrid, Spain; Fax +34915855413;
jmsalazar@iem.cfmac.csic.es
(Received: September 2, 2002; published: October 24, 2002)
Abstract:
The aim of this review is to provide evidence that rheological testing is a
potent tool for characterising polymers in the melt. An effort has been made in
order to gather results in conventional and model polyolefins, and correlating them
with phenomena occurring at the molecular level. We have focused our interest on
long chain branching (LCB). In the case of materials containing long side-chain
branches, strong effects on viscosity, elastic character and activation energy of
flow are general features. Literature results mostly indicate that the effect of poly-
dispersity on these parameters could be very similar to that expected due to the
presence of LCB – notwithstanding that the effects of LCB seem to be stronger
than those due to polydispersity for a given molecular weight. Different relaxation
processes appear as a consequence of the presence of LCB: slower terminal
relaxation behaviour than of linear counterparts, and faster additional branch
relaxation at higher frequencies, clearly distinguishable from polydispersity effects.
To measure the amount of LCB from limited viscoelastic data and molecular
properties seems to be a suitable instrument to explain the rheological features of
the different polymers, but it fails when the results are compared with measured
values of LCB density in model polymers. The actual framework leads us to say
that the number of branches is less important than the topology itself. Therefore,
the position and architecture of the branches along the polymer main chain are the
main factors that control the rheology of the material.
Introduction
The rheology of polyolefin melts is much affected by molecular weight (M), molecular
weight distribution (MWD) and the presence of short (SCB) and long chain branching
(LCB). However, exploring the relationships between these molecular variables and
rheological properties has been seriously limited by a lack of samples of controlled
molecular architecture. Within the large polyolefin group, the polyethylene (PE) family
is a good example of how understanding its viscoelastic response has paralleled
progress in describing the molecular population involved. Indeed, the industrial poly-
merisation of PE has dramatically evolved in line with the market needs, and existing
knowledge on new catalyst systems has been incorporated into the technological
process. The overall result is a spectrum of a more or less complex molecular popu-
lation with one end occupied by commercial high-pressure low density PE (LDPE)
and the other corresponding to PE models obtained in selected labs either by
Unauthenticated
Download Date | 5/5/16 2:50 PM
2
fractionation of existing chromium-based or Ziegler-Natta products or by hydrogen-
ation of anionically polymerised polybutadiene (HPB). In general, traditional catalyst
systems give rise to broad molecular weight and SCB distributions and to the uncon-
trolled presence of LCB. In these materials, it is very difficult to separate the effects of
the different molecular features. On the other hand, most researchers find it difficult
to obtain model polymers of narrow MWD by fractionation or anionic polymerisation
and hence scientific information is much more limited.
The development of single-site catalysts (SSC) has made it possible to synthesise
completely linear samples of narrow molecular weight and SCB distributions. More-
over, some types of catalyst systems are able to introduce LCB. In some cases, this
may be performed in a controlled manner, depending on the catalyst system and
polymerisation conditions such as polymer, monomer, co-monomer and hydrogen
concentrations, temperature and reaction medium. However, it is not only the number
of branch points that determines the effects of LCB on rheological behaviour. Branch
length, distribution and architecture also play an important role. For example, new PE
made with the novel late metal catalysts can contain certain amounts of complex
‘branch-on-branch’ structures. These complex structures can, on their own, affect
rheological behaviour, suggesting that it is not the content, but the distribution and
architecture of LCB that need to be controlled. These features dictate that compar-
isons made between polymers obtained via different catalyst systems and/or in
different polymerisation conditions need to be interpreted with caution.
Background
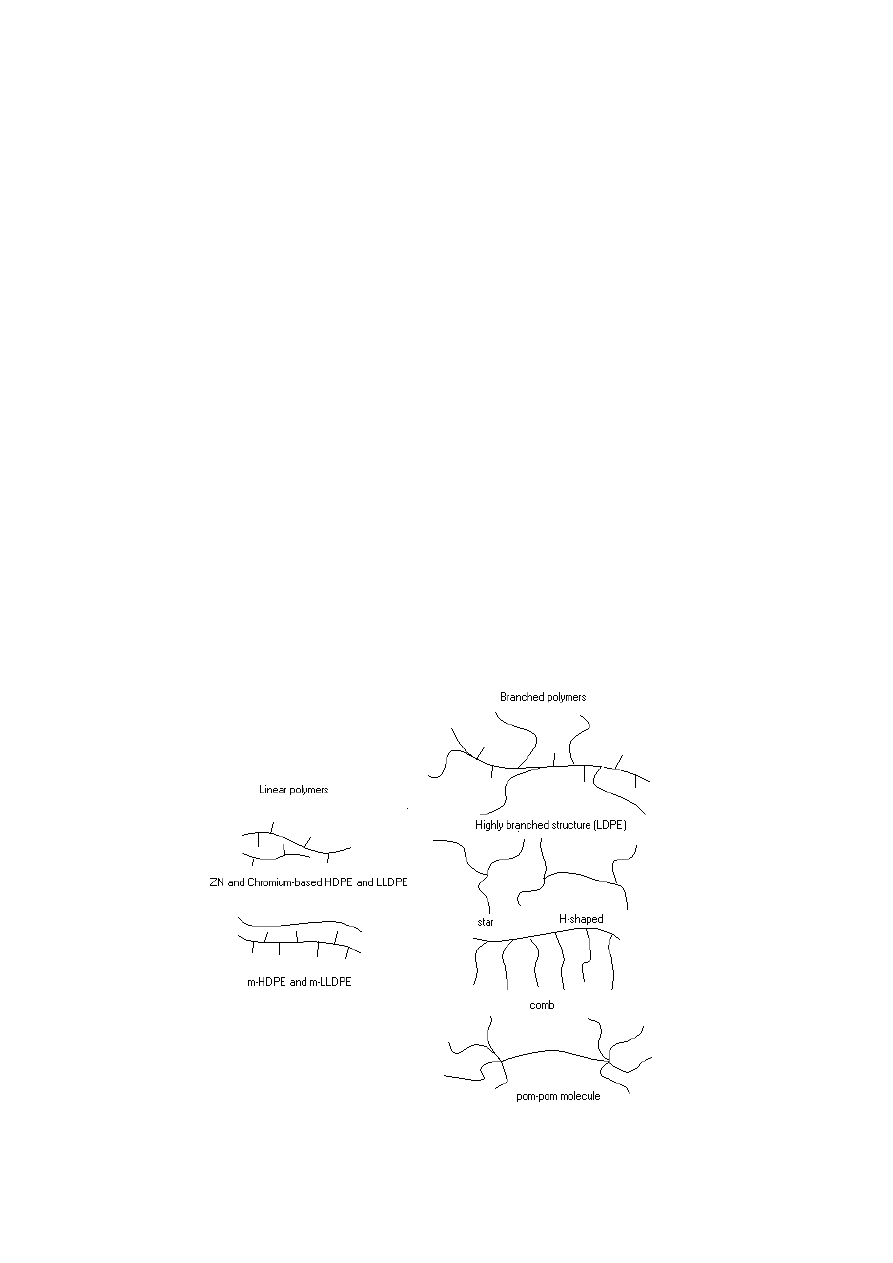
Branched polymers differ structurally depending on their origin. The range of
structures is shown in Fig. 1.
Fig. 1.
Molecular architectures of ethylene-based products
Unauthenticated
Download Date | 5/5/16 2:50 PM

3
In general, the use of Ziegler-Natta or chromium-based (Phillips technology) hetero-
geneous catalyst systems gives rise to linear polyolefins. These materials are charac-
terised by a linear chain structure with no LCB, and a polydispersity index higher than
M
w
/M
n
= 3. The use of catalyst systems such as these allows a co-monomer to be
incorporated heterogeneously along the chain. Single-site catalysts make it possible
to synthesise linear polymers with a lower polydispersity index (M
w
/M
n
= 2) and a
more even co-monomer distribution. The PE obtained by radical polymerisation is
believed to have a highly branched structure, i.e., it has a central backbone with
many branches whose lengths show a broad distribution. Other branched structures
such as stars, combs, H- and pom-pom-shaped molecules have been produced by
anionic techniques. These ‘model’ polymers typically have a controlled structure and
molecular weight with a polydispersity index close to M
w
/M
n
=1. Finally, the branched
single-site (metallocene) polyethylenes (mPEs) are thought to be blends of linear and
branched species. These branched species seem to be stars or H-shaped molecules.
Conventional polymers
Since the 1930s, PE has been produced by high-pressure radical polymerisation [1]
as low-density polyethylene (LDPE) in a way similar to the ethylene-vinyl acetate
copolymers (EVAc) developed in the 1960s. This type of polymerisation process
yields a polydisperse polymer with a high degree and different types of branching.
Roedel established that in this type of process, C4 is the most probable length for
SCB, followed by C5 and C3, while LCB moieties were comparable in length with the
main polymer chain. The physical properties of SCB and LCB obtained by free
radical polymerisation have been known since the early 1950s [2]. However, despite
extensive work on the effects of LCB on the viscoelastic properties of these types of
material in the melt in the 1960s, there is no unified picture of their dependence on
molecular variables. The following general properties were established for a moder-
ate to high degree of LCB (>> 1 LCB/10
4
carbon atoms):
a) lower Newtonian or zero-shear viscosity
η
o
and a higher critical shear rate
o
γ
& for
the onset of shear thinning behaviour than linear polymers of the same weight-
average molecular weight, M
w
[3-14];
b) less intense pseudoplastic behaviour [11,15-17];
c) increased activation energy of flow, E
a
[18-29]; and
d) enhanced melt elasticity expressed in terms of first normal stress difference N
1
,
steady-state compliance J
e
o
and extrudate swell d
j
/D [4,5,12,13,16,17,30-32].
The emergence in the late 1970s of devices that measured rheological behaviour in
extensional flows in the melt, revealed that branched polymers show high elon-
gational viscosity and a characteristic strain-hardening behaviour, which is not
common in linear polymers [33-39].
In highly branched PE, long chain branching is often defined as the ratio of the radius
of gyration of a branched molecule to that of a linear molecule of the same total M
w
:
L
B
S
S
g
2
2
=
(1)
A branched chain will be more compact than a linear one of the same M
w
, so this
factor will be 1 for a linear polymer and lower than unity for a branched one. Another
Unauthenticated
Download Date | 5/5/16 2:50 PM
4
common measure of LCB arises when the intrinsic viscosity of the polymer is
compared with that of a linear chain of the same M
w
[7,40]:
[ ]
[ ]
L
B
g
η
η
=
'
(2)
One can express the correlation between these two quantities in terms of the
exponent
ε
:
g’ = g
ε
(3)
The literature quotes values of
ε
ranging from 0.5 to 1 [7,41,42]. Using a value of
ε
=
0.5, Mendelson et al. [7] demonstrated that comparisons made at a constant effective
molecular volume, given by the product gM
w
, yielded values of
η
o
for polymer melts
with long branches that were exponentially related to molecular size [43] and always
higher than those recorded for linear polymers. A similar conclusion was reached for
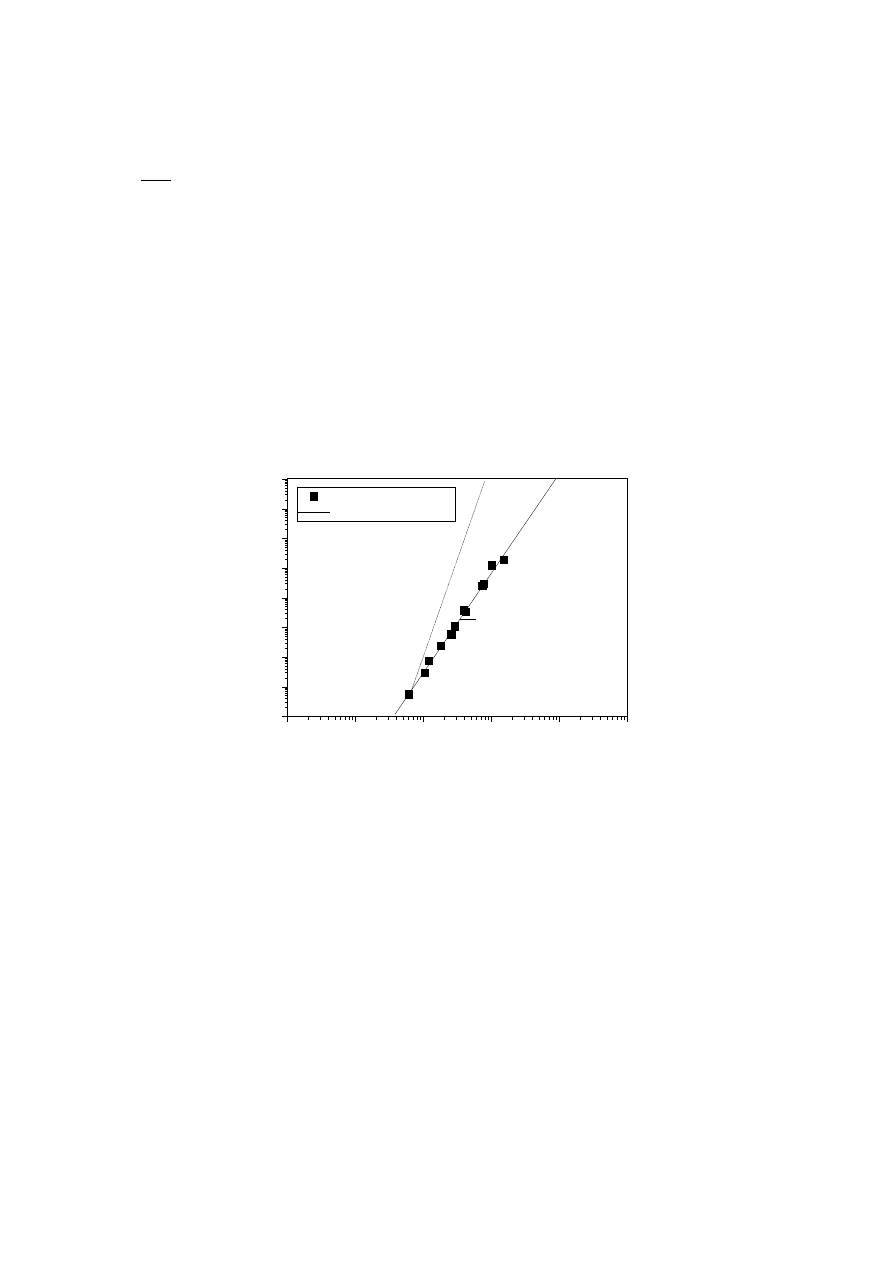
the onset of pseudoplastic behaviour. Fig. 2 shows the results obtained for fractions
of linear and branched PE by these authors [7].
Fig. 2.
Newtonian viscosity
η
o
versus weight-average molecular weight M
w
for
fractions of linear and branched polyethylenes. Results by Mendelson et al. [7]
When the LCB content is very low (less than 1 LCB /10
4
C), its effect on the radius of
gyration goes unnoticed and values of g
≈ 1 are obtained [42]. The effect of such a
low amount of LCB has been explored in LDPE and in modified linear polymers of
ethylene/
α-olefins and propylene (PP) by irradiation, electron-beam treatment, per-
oxide reaction, and thermal/mechanical degradation [7,10,17,44-59]. In principle, low-
pressure processes (chromium-based and Ziegler-Natta type catalysts, developed in
the 1950s and 1970s, respectively) yield linear species. However, the possible
existence of LCB in high molecular weight fractions of this type of polymer was first
suspected by Tung [60]. Many investigators found evidence of LCB in supposedly
linear HDPEs [61-63]. In all these cases, enhanced
η
o
values and pseudoplastic and
elastic behaviour were observed, with respect to highly branched polymers of the
same M
w
.
Wild et al. [46] explained these features by pointing out the predominant effect of
entanglements at low degrees of LCB (differences in g are not noticeable and the
polymers are ‘essentially linear’) and the molecular size reduction effect at medium
10
2
10
3
10
4
10
5
10
6
10
7
10
-1
10
0
10
1
10
2
10
3
10
4
10
5
10
6
10
7
3.4
Linear PE fractions
Branched PE fractions
η
o
/ P
a s
gM
w
Unauthenticated
Download Date | 5/5/16 2:50 PM
5
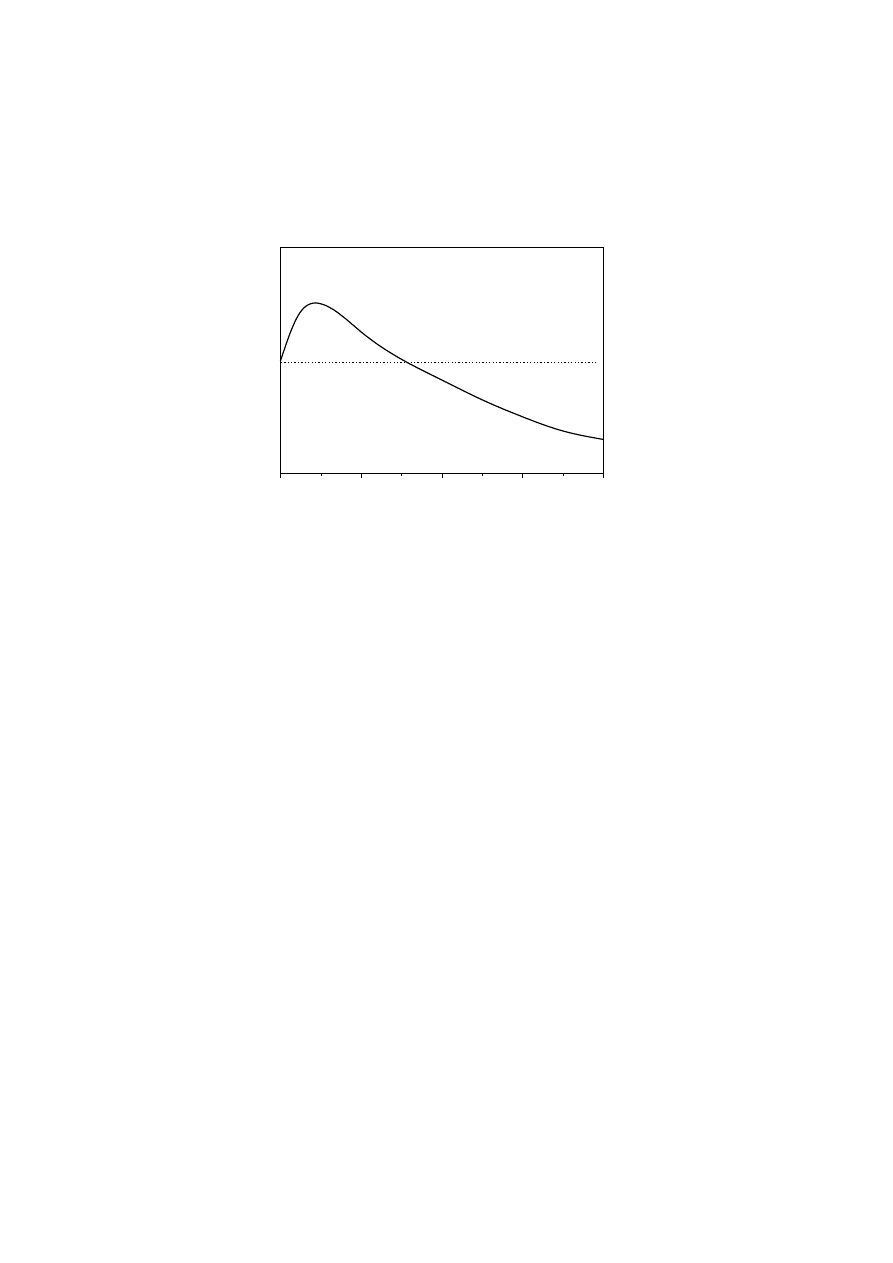
and high degrees of LCB (values of g <
1). Using this approach, Bersted [47,50]
developed a model that predicts a Newtonian viscosity peak at a branching level of
approximately 2.5 LCB/10
4
C and a subsequent decrease at higher LCB density, as a
consequence of the decrease in molecular size (see Fig. 3). This model has been
successfully applied in predicting the rheological response shown by peroxide
modified and thermally/mechanically degraded series of PEs.
Fig. 3.
Change in
η
o
with degree of LCB (Bersted model [47,50])
Model polymers
Early studies on randomly branched poly(vinyl acetate) (PVA) and polybutadiene
(PB) indicated higher melt viscosity than linear polymers of the same M
w
at sufficient
branch lengths M
b
above the characteristic molecular weight between entanglements
M
e
[64-67]. Graessley et al. [68-70] and Raju et al. (71) observed viscosity enhance-
ment over that of linear polymers of equivalent molecular size in star and comb poly-
isoprene (PI), polystyrene (PS) and hydrogenated polybutadiene (HPB). In star HPB,
considered to be a model of monodisperse branched PE,
η
o
seems to depend expo-
nentially on M
b
[71-73] but not on the number of arms [74]. Moreover, in blends of
branched and linear HPB, this enhancement does not depend on the interaction
between two branched species, but rather on the interaction of a branched chain with
other entangled chains [75,76]. In these types of polymer, it is possible to observe
characteristic branching relaxation processes at intermediate frequencies between
the terminal and plateau regions in the linear viscoelastic response [67,70,76].
Roovers and Graessley reported that this relaxation mechanism was dependent on
M
b
[70] but independent of the number of arms [76].
There are several reports on how long an arm should be before it is considered a
long branch. Jordan et al. [77] and Gell et al. [78] examined the asymmetric 3-star
deuterated PB and poly(ethylene-alt-propylene) (PEP). Both groups of investigators
concluded that branches with 2 - 3 entanglements were long enough to affect rheo-
logical behaviour (M
b
= 2.5
M
e
). Kasehagen et al. [79] came to similar conclusions
after exploring more realistic polymers: the presence of long branches accounts for
the enhanced
η
o
and the broadening of relaxation spectra with additional relaxation
processes between terminal and plateau zone.
Entangled branches have other effects connected to their thermorheological
behaviour. For entangled linear melts, the temperature dependence of viscoelastic
0
5
10
15
20
0
50
100
150
200
250
300
350
400
Essentially linear
LDPE
η
o
Number of LCB/10
4
C atoms
Unauthenticated
Download Date | 5/5/16 2:50 PM

6
functions is remarkably simple. The time-temperature superposition principle (TTSP)
works well and the melts are known to be thermorheologically simple. In some
branched model polymers such as PS, PB and PI, these features remain unchanged
[69,70,72,79,80], but model PE with long branches, i.e., branched HPB and hydro-
genated polyisoprene (HPI), behave quite differently; their behaviour resembles that
of commercial LDPE and mPE with LCB. In these cases, temperature coefficients are
increased over linear values and an anomalous temperature dependence of the
relaxation spectrum is observed [71,72], though these features seem to be highly
dependent on microstructure, i.e., SCB content.
It has been recently reported that long chain branched semicrystalline polymers such
as mPEs show very different viscoelastic features to amorphous long chain branched
polymers such as PS of similar polydispersity index and branching content [81]. The
viscosity function in shear is strongly influenced by LCB in the case of PE melts;
while only a small change is observed for the PS. Similar observations have been
made with regard to elastic properties. The
η
o
values shown by LCB polymers
relative to linear ones were higher for PE and lower for PS. The E
a
value of PE is
strongly increased by LCB, whereas the temperature dependence of the shift factor
of linear and LCB PS is the same. The different molecular processes governing the
temperature dependence of melts of amorphous and semicrystalline polymers are
thought to account for the differences observed. Carella and co-workers [72]
proposed that the effects of long branches were probably more prominent in the
species for which the temperature coefficient of the linear polymer was low such that
departures can be easily detected. In addition, the M
e
for these species is usually
quite small, so departures occur even in the presence of arms of relatively low
molecular weight.
From a theoretical perspective, several successful treatments for branched polymers
have been proposed to explain their viscoelastic response [82-89]. The tube model
theory has been shown to describe the viscoelastic behaviour of linear polymers [90-
92]. For polymer melts, the main relaxation process occurs via length fluctuations and
at low frequencies by reptation. This reptation mechanism can be described as the
motion of a linear molecule along the length of its tube contour formed by the neigh-
bouring molecules. This enables the molecule to escape from its original tube to
explore new paths. The main idea of this theory applied to branched molecules is that
long branches suppress reptation and cause much slower chain relaxation. The
relaxation of a branched molecule can then occur via arm fluctuations. These relax-
ation mechanisms associated with arms cannot be clearly observed in traditional
branched polymers due to both the broad MWD and the distribution of LCB extending
the spectrum to high frequencies: these effects of MWD and LCB act in the same
direction. Indeed, polydisperse linear polymers, like branched ones, are character-
ised by a pronounced elastic and pseudoplastic character [93-103]. Correlations
between molecular structure and rheological behaviour have been analysed in
bimodal blends of well-defined substances such as PS and PB [104-110]. Some
studies have shown a slight increase in viscosity and E
a
with the polydispersity index
in supposedly homogeneous linear LLDPE blends [111].
State-of-the-art
This last decade has seen a huge leap forward in polymerisation mechanisms with
the development of SSC as an alternative route for polymerising
α-olefins [112-118].
The use of various types of organometallic-based catalysts is currently the subject of
Unauthenticated
Download Date | 5/5/16 2:50 PM

7
several investigations. Metallocene-based catalysts deserve particular attention,
since their use has been successfully scaled to industrial plant production for various
degrees of polymerisation of PE and PP [119-121]. These catalyst systems are able
to synthesise polymers of relatively narrow MWD and well-defined architecture, two
key factors determining physical properties [122]. The peculiar molecular charac-
teristics of the polymers obtained through SSC systems has led to the proposal of the
use of this option to obtain model polymers, mainly in the case of PE. It should be
mentioned that producing monodisperse samples of PE requires fractionation or
hydrogenation of PB (HPB). Both processes are very tedious, and the resultant
amounts available for measurements are very small.
The rheology of linear and branched single-site (particularly metallocene) catalysed
polyethylene (mPE) has received considerable attention in the last years [123-155].
Most studies reported in the literature deal with linear viscoelastic properties in the
melt state. There are only a few reports on non-linear viscoelasticity in extensional
flows. In this context, there is much interest in detecting small levels of LCB by
rheological testing. The effects of small amounts of LCB have been shown to be very
noticeable in this type of experiment. In fact, it was demonstrated that the presence
of only one long branched chain every six linear chains (implying 0.1 LCB/10
4
C for a
M
w
= 200
000) leads to a noticeable change in viscoelastic properties [143]. Accord-
ing to Soares and Hamielec [156], for a specific catalyst system such as a
constrained geometry catalyst, the polymer produced is in fact a mixture of linear, T-
shaped (star) and H-shaped molecules, with very small amounts of more highly
branched molecules. The difficulty in evaluating such a small degree of branching
using classical methods such as size exclusion chromatography (SEC) and nuclear
magnetic resonance (
13
C NMR) is proverbial [157]. Levels of branching ranging from
0.1 to 1 LCB/10
4
C have been recorded in mPE [147,148], yet there is some contro-
versy on the utility of these techniques [158]. Branching levels of around 2 branches
per 10
4
C were determined by
13
C NMR in only one polymer of a wide branched
series [136]. The technique seems to fail in supposedly branched materials of similar
properties analysed by the same authors [139]. Due to the limitations of spectro-
scopic and chromatographic methods, some authors have suggested regarding the
rheological response as a probe of molecular structure since it is more sensitive to
molecular and architectural features. Janzen and Colby [158] suggest the need to
relegate classical analyses based on Zimm-Stockmayer predictions [40] to a
secondary role and to address the problem through more modern concepts of
polymer physics based on scaling and percolation arguments. These authors present
a semiempirical method of determining the level of LCB almost entirely from
η
o
values. The method relies on a formula that relates
η
o
to M
w
and a ‘branching
exponent’ s/
γ
, obtained by making empirical adjustments to the theory developed for
the rheological behaviour of fractal gelation clusters approaching the critical gel point
[159,160].
There is also a lack of consensus as to the most adequate rheological technique for
detecting and quantifying the level of LCB. A recent paper demonstrated that the
higher the branching content the more strain hardening in extensional flow a polymer
shows [145]. Unfortunately, only two branched samples were examined. Other
studies show that this strain hardening can also be affected by the presence of small
amounts of high molecular weight material in the sample [79,147] or by molecular
topology [155], which questions the relationship between LCB and strain hardening.
Recent general MWD rheology models have been suggested as power tools to
detect the presence of LCB. Phenomenological approximations were developed in
Unauthenticated
Download Date | 5/5/16 2:50 PM

8
the 1980s for commercial randomly branched polymers. As already pointed out,
Bersted [47] was able to predict the rheological behaviour from the MWD of slightly
branched PE by treating the materials as blends of branched and linear species
following classical analyses based on Zimm and Stockmayer's study [40]. Wasser-
man and Graessley [161] proposed a non-quantitative method in which the dynamic
viscoelastic response to predictions based on the MWD and the double-reptation
theory for linear chains were compared. In the same way, Wood-Adams and Dealy
[147] used the Shaw and Tuminello [162] viscosity-MWD conversion factor to
determine LCB by comparing viscosity-MWD with gel permeation chromatograpy
(GPC)-MWD in branched mPEs.
From a theoretical point of view, the situation becomes complex. In general,
branched structures in polyolefins are topologically and geometrically irregular. More-
over, the MWD is very broad in this type of polymer. Yet melt rheology has been
successfully predicted using constitutive equations based on molecular consider-
ations [163,164]. The ‘pom-pom’ molecular model (see Fig. 1) seems able to explain
melt rheology in the linear and non-linear regimes of complex branched polymers
such as LDPE and H-shaped polymers.
Finally, in a recent investigation, Larson [165] developed an algorithm for predicting
the linear viscoelasticity of polydisperse polymers containing long side branches with
arbitrary distributions of branch lengths and branch location along the backbone. This
model is based on recent advances in branched polymer molecular theories on
branch hierarchical relaxation by path arm fluctuations, arm collapse and reptation
[84-89]. In his work, Larson discusses the limitations of Janzen and Colby's approach
[158], and demonstrates that
η
o
and the entire viscoelastic response depend not only
on branching content, but also on the type and topology of branching.
Experimental part
Test materials and sample preparation
Three families of polymers were examined: branched ethylene/vinyl acetate
copolymers (EVAc) obtained by free radical polymerisation, PEs obtained by
chromium-based catalyst systems assumed to be linear, and metallocene catalysed
PEs. All the polymers were supplied by Repsol-YPF, Spain. The molecular variables
of the materials, M
w
and M
w
/M
n
, were obtained by size exclusion chromatography
(SEC) using a 150 CV Waters GPC instrument equipped with a differential refractive
index device and viscometer. The set up used to measure the polymers' intrinsic
viscosity comprised an on-line 150R model high-temperature viscometer. For SEC,
the universal calibration procedure was applied using a set of polystyrene standards
dissolved in 1,2,4-trichlorobenzene (TCB) at 145ºC. Intrinsic viscosity was calculated
from the measured relative viscosity at a single nominal concentration c of 0.2 g·dL
-1
in TCB at 145ºC. The calculation was performed iteratively using Martin’s equation:
[ ]
[ ]
c
K
c
m
sp
η
η
η
+
=
log
log
(4)
where K
m
= 0.2138 is Martin’s constant. The level of SCB, LCB and the double bond
content of the samples were determined by
13
C NMR with a Bruker DPX-300 NMR
spectrometer operating at 75 MHz and 100°C. (SCB is defined as the number of
branches with less than 6 carbon atoms per 1000C, LCB with more than 6 carbons.)
Unauthenticated
Download Date | 5/5/16 2:50 PM

9
Sample solutions of 20% (v/v) were prepared using deuterated benzene and TCB
with trimethylsilane as an internal standard. All molecular variables are provided in
Tabs. 1 to 3.
Tab. 1.
Molecular variables of EVAc
Sample M
w
/
g
⋅mol
-1
M
w
/M
n
SCB
/
1000C LCB
/
1000C
[
η
]
/
dL
⋅g
-1
EVA1 189800 8.4
6.5
<2.5
1.03
EVA2 76300 4.2
6.0
<2.0
0.64
EVA3 48500 3.3
14.0
<2.0
0.45
EVA4 46800 3.5
11.5
<3.5
0.43
EVA5 40200 2.9
11.5
<2.5
0.39
EVA6 33500 2.1
13.5
<2.5
0.41
Tab. 2.
Molecular variables of the chromium-based PEs
Sample
M
w
/
g
⋅mol
-1
M
w
/M
n
[
η
]
/
dL
⋅g
-1
PE221 160700 9.5 1.79
PE222 135500 11.4 1.59
PE223 137600 8.8 1.61
PE224 143500 15.5 1.66
TR210 182000 9.5 1.96
Tab. 3.
Molecular variables of the metallocene-catalysed polyethylenes
Sample
M
w
/
g
⋅mol
-1
M
w
/M
n
SCB
/
1000C
[
η
]
/
dL
⋅g
-1
mPE0 65000 3.6
0.0
0.87
mPE1 110000 2.0
7.3
1.39
mPE2 170000 2.1
0.0
1.83
mPE3
a)
110000 2.0
n.m.
1.39
a)
Commercial sample.
A stabiliser (IRGANOX 1001) was added for long-term stability in the molten state
and protection against oxygen. The resultant materials were compression-moulded
into sheets in a Schwabenthan Polystat 200T for 5 min at 160°C from which test
samples with the required dimensions were obtained.
Rheological techniques
Dynamic oscillatory measurements
Oscillatory measurements were performed in a Bohlin CVO rheometer in parallel
plate and cone-plate modes. Oscillatory viscoelastic determinations were carried out
over the range of frequencies 6.28·10
-4
≤ ω ≤ 6.28·10
2
rad·s
-1
in the linear viscoelastic
region. The following viscoelastic functions were measured: storage modulus G’(
ω);
Unauthenticated
Download Date | 5/5/16 2:50 PM

10
loss modulus G”(
ω); complex viscosity
η
*(
ω); and loss tangent, tan
δ
= G"/G'. The
temperature range of measurements was from 130 to 190°C. The time-temperature
superposition principle was applied for all the samples. Data for each sample were
then shifted along frequency and modulus axes to construct dynamic modulus master
curves at a common reference temperature T
R
. The horizontal shift factor resulting
from application of time-temperature superposition can be interpreted in terms of a
flow activation energy defined through an Arrhenius type equation. Similarly, the ver-
tical shift was defined in terms of vertical flow activation energy using the Arrhenius
type equation
[27]. For the polymers studied, the values of the characteristic rheo-
logical variables Newtonian viscosity
η
o
, steady-state compliance J
e
o
and relaxation
time
λ
, were obtained according to standard procedures [135-155]. Values of hori-
zontal and vertical shifts of activation energy, E
a,h
, E
a,v
, as well as
η
o
, J
e
o
and
λ
are
listed in Tab. 4 for all polymers studied. LCBI, E
R
and G
x
will be discussed later.
Tab. 4.
Rheological variables of the materials examined at 145 - 150°C
Sample
η
o
* in
Pa
⋅s
λ
/
s
LCBI J
e
o
/
Pa
-1
E
R
G
x
/
Pa
E
a,h
in
kJ
⋅mol
-1
E
a,v
in
kJ
⋅mol
-1
EVA1 23
780 9.7 0.57
4.1·10
-4
2.1
20
500
55.7
± 2.4
8.4
± 0.4
EVA2 1
200 0.35 0.36
2.9·10
-4
0.89 58
000
56.9
± 2.9
13.8
± 0.6
EVA3 240 0041
0.39
1.7·10
–4
0.71 >
60
000
54.0
± 3.2
9.6
± 0.4
EVA4 150 0.027
0.32
1.8·10
-4
0.80 >
60
000
51.0
± 3.2
2.5
± 0.1
EVA5 70
0.0056
0.14
8.0·10
-5
0.28
–
43.5
± 2.4 0.0 - 4.2 ± 0.2
EVA6 60
0.0078
0.24
1.3·10
-4
0.66 >
60
000
55.2
± 3.0
15.1
± 0.9
Sample
η
o
in Pa
⋅s
λ /
s
LCBI
J
e
o
/
Pa
-1
E
R
G
x
/
Pa
E
a,h
in
kJ
⋅mol
-1
E
a,v
in
kJ
⋅mol
-1
PE221 104
500 940 0.23 9.0·10
-3
3.9
70
800
39.7
± 1.9
10.5
± 0.6
PE222 190
000 380 0.57 2.0·10
-3
4.8 42
600
73.6
± 3.3
22.2
± 1.3
PE223 175
000 455 0.52 2.6·10
-3
5.2 45
000
66.1
± 3.6
20.5
± 1.3
PE224 170
000 714 0.47 4.2·10
–3
4.1 43
100
61.5
± 2.6
17.2
± 1.0
TR210 130
000 520 0.17 4.0·10
-3
3.4 74
100
38.5
± 1.5
7.5
± 0.5
Sample
η
o
* in
Pa
⋅s
λ*
/
s
LCBI
J
e
o
/ Pa
-1
E
R
G
x
/
Pa
E
a,h
in
kJ
⋅mol
-1
E
a,v
in
kJ
⋅mol
-1
mPE0 1
400 0.005 0.04
–
0.17
>
1.1·10
5
23.8
± 1.7
0.0
mPE1 9
700 0.01 -0.03 –
0.10 >
1.9·10
5
28.9
± 1.5
3.8
± 0.2
mPE2 43
000 0.05 0.00
–
0.065 2.5·10
5
20.8
± 0.0
0.0
mPE3 48
000 0.40 0.34
–
0.40 >
1.3·10
5
41.8
± 0.0
8.4
± 0.0
*
Calculated from dynamic measurement.
Creep-recovery measurements
The creep-recovery tests were performed in a Bohlin CVO rheometer in the cone/
plate geometry. The temperature chosen was 145°C to avoid degradation, since
Unauthenticated
Download Date | 5/5/16 2:50 PM
11
some of the materials are characterised by broad relaxation and retardation spectra
and long duration experiments are needed. Incomplete creep tests were performed
according to the method of Meissner [166,167]. Preliminary incomplete creep tests
were performed by varying shear stress until the same value as the viscosity was
achieved, indicating the condition of the linear viscoelastic response. The values of
η
o
, J
e
o
, and
λ
are shown in Tab. 4.
Results and discussion
The viscosity function
Figs. 4 and 5 show plots of complex viscosity
η
*(
ω) versus frequency ω at 145°C for
the materials listed in Tabs. 1 to 3, which were grouped according to M
w
(around M
w
= 100
000 and 170
000). The effect of LCB on the complex viscosity pattern is
evident. In the mPE group, viscosity at low frequencies increases drastically for the
branched material mPE3. In this case, viscosity at low frequency is similar to that of
the linear polymer mPE2, with the highest M
w
(see Tab. 4). A similar behaviour was
shown by the chromium-based polymer PE221. In addition, the degree of shear
thinning increases in these materials, while its onset occurs at smaller frequencies.
All the chromium-based polymers listed in Tab. 2 presented a similar behaviour.
Fig. 4.
(left) Complex viscosity
η
*(
ω) curves of several PEs listed in Tabs. 1 to 3 of
M
w
= 110
000 - 135
000 (T = 145°C)
Fig. 5.
(right) Complex viscosity
η
*(
ω) curves of several PEs listed in Tabs. 1 to 3 of
M
w
= 170
000 - 182
000 (gM
w
= 50
000), except mPE0 of M
w
= 69000 (T = 145°C)
EVA1 showed reduced viscosity with respect to the linear PE of similar M
w
(Fig. 5). In
this case, M
w
obtained by GPC was not corrected for branching content and does not
take into account the decrease in molecular size with respect to a linear species of
the same M
w
. Calculating the branching index g from the ratio of intrinsic viscosity of
the branched polymer to that of a linear polymer of the same M
w
(see Eqs. (1) and (2)
where
ε
= 0.5) leads to a measure of ‘hydrodynamic volume’ of gM
w
= 50
000, compa-
rable to the value of M
w
= 65
000 for linear mPE0 in Tab. 3. The complex viscosity of
both polymers is also compared in Fig. 5. It thus becomes clear that LCB enhances
the viscosity function at low frequencies and shear thinning when comparisons are
made at similar molecular size.
10
-3
10
-2
10
-1
10
0
10
1
10
2
10
3
10
4
10
5
mPE1
mPE3
PE222
ω
/rad s
-1
η
* / P
a
s
10
-3
10
-2
10
-1
10
0
10
1
10
2
10
2
10
3
10
4
10
5
ω
/rad s
-1
η
* / P
a s
mPE2
PE221
EVA1
mPE0
Unauthenticated
Download Date | 5/5/16 2:50 PM
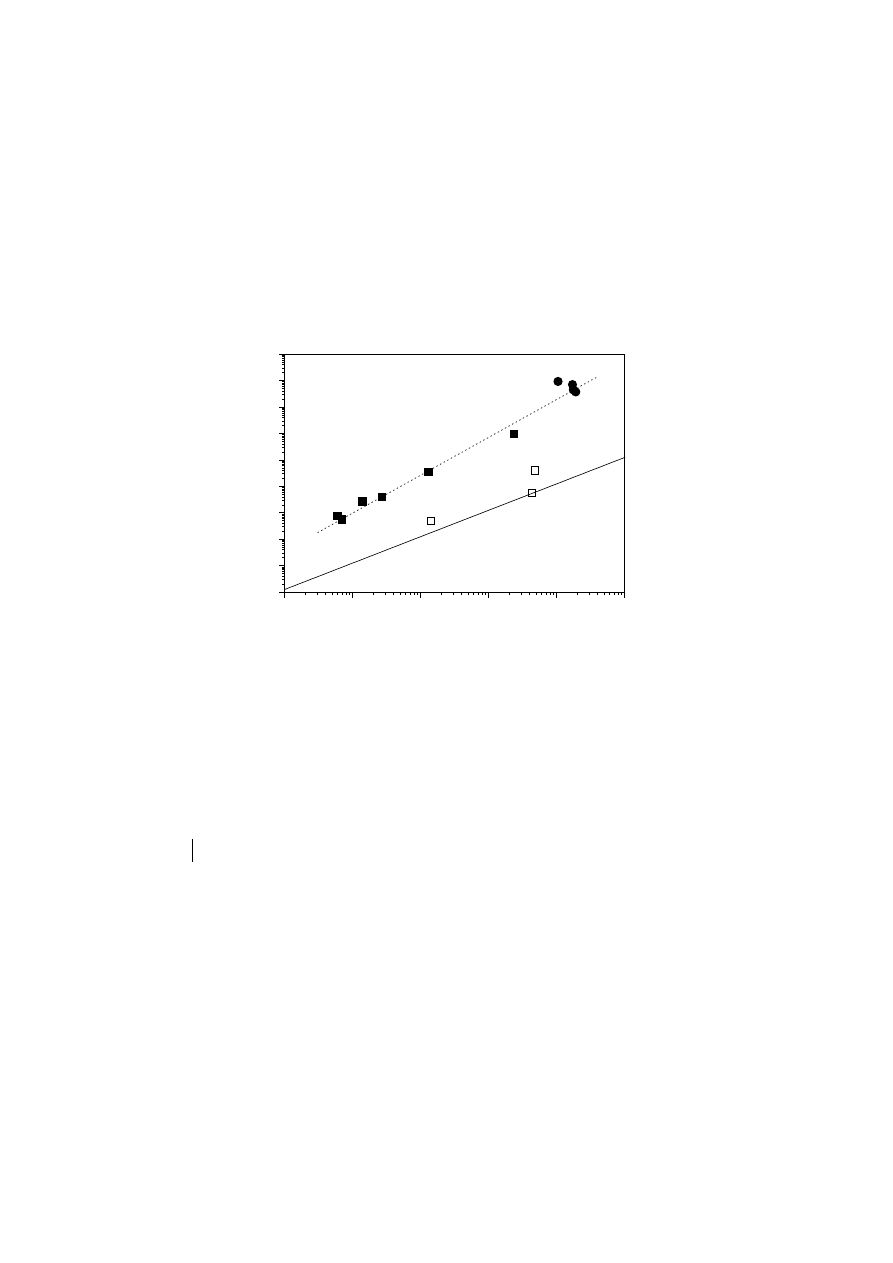
12
Fig. 6 shows plots of
η
o
versus M
w
for all the materials examined. These data were
calculated directly from dynamic and/or creep-creep recovery measurements [135-
155,166,167]. It can be observed that neither the chromium-based and metallocene
mPE3 polymers nor the EVAc show the behaviour expected for linear PEs. The solid
line represents the results obtained for linear model PEs [150] at 145°C:
4
.
3
14
10
96
.
5
w
o
M
−
×
=
η
(5)
For viscous flow of linear polymers, reptation theory predicts that the characteristic
time for diffusion of the molecule’s centre of mass is proportional to the third power of
molecule length [92,93]. However, a more detailed evaluation, which takes into
account increased lateral mobility of the chain ends and fluctuations in tube length
[168-170], yields a markedly higher exponent. Since
η
o
is proportional to the reptation
time, this is in agreement with the well-known dependence given by Eq. (5).
10
4
10
5
10
6
10
1
10
2
10
3
10
4
10
5
10
6
EVA-c
Chromium-based PEs
mPEs
Linear model PEs
145-150ºC
η
o
/ P
a s
M
w
Fig. 6.
Newtonian viscosity
η
o
versus weight-average molecular weight M
w
(T = 145 -
150°C). The solid line represents the fit to a power law function,
η
o
∝ M
w
α
(Eq. (5))
similar to those found in the literature [150] for linear PEs; the dashed line represents
the power law fit for EVAc
Hatzikiriakos [29] recently observed a power-law exponent higher than 3.4 for linear
polymers obtained by blending, due to a possible effect of polydispersity on
η
o
. Other
authors noted correlations of
η
o
with a molecular weight M
t
, lying between M
w
and
M
z
, and with the polydispersity index M
w
/M
n
[162,171,172]. One would suspect a
similar effect in our chromium-based polymers due to their high polydispersity index,
but as we will see later, there is further evidence of the presence of LCB in these
samples.
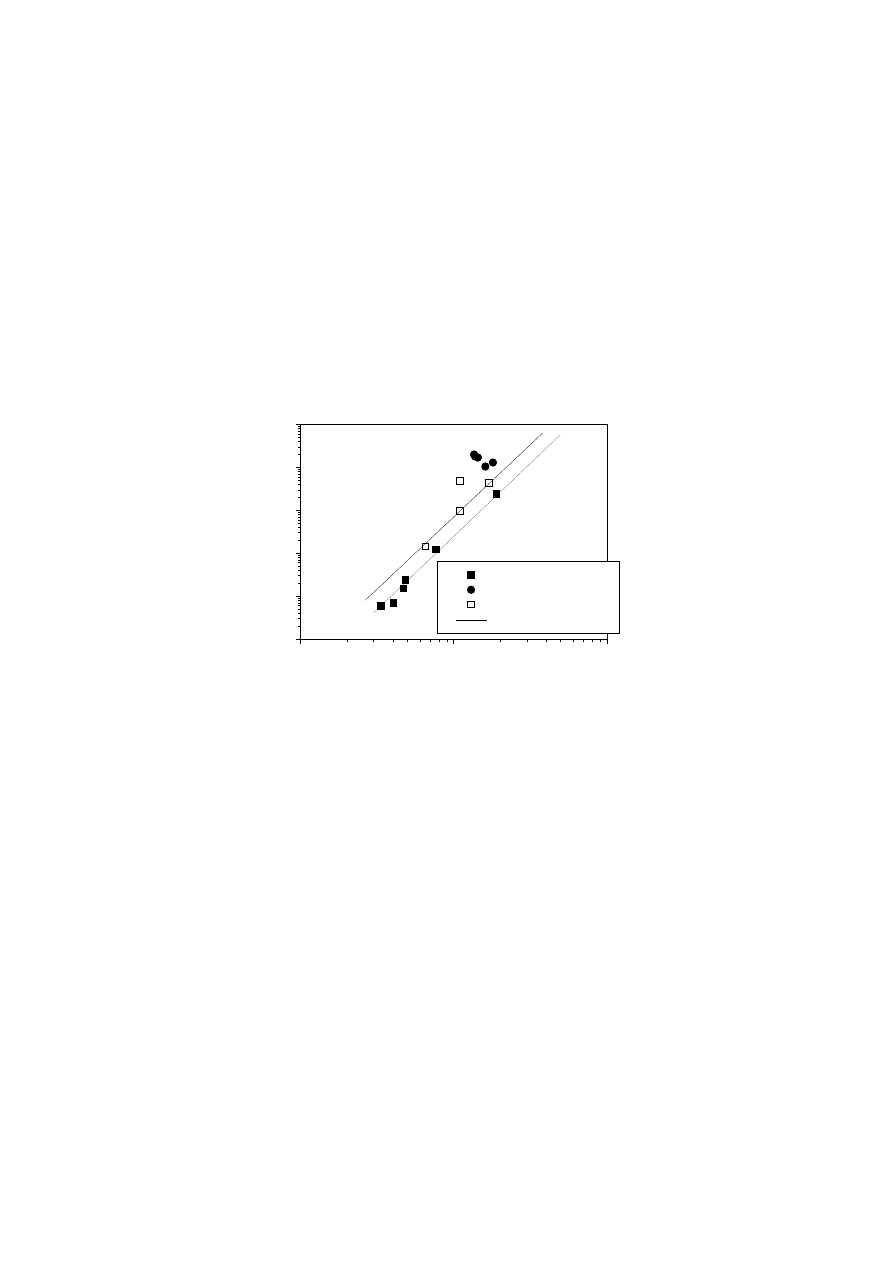
Fig. 7 shows the values of
η
o
versus [
η
] for all the polymers studied and some from
the literature [147]. The graph clearly shows that the viscosities of most of the
polymers examined are considerably higher than that of equivalent linear PEs of
equal [
η
]. This behaviour is consistent with results obtained for branched polymers
[71] when [
η
] is used as a correlating parameter for molecular size to compensate for
the smaller radius of gyration of the branched molecules.
Now, if one considers the
13
C NMR results corresponding to branches longer than 6
carbon atoms for EVAc (see Tab. 1), it may be argued that the LCB present in this
type of sample could be responsible for this viscosity enhancement.
Unauthenticated
Download Date | 5/5/16 2:50 PM
13
Fig. 7.
Newtonian viscosity
η
o
versus intrinsic viscosity [
η
] obtained by GPC for the
materials examined here, and taken from the literature for other samples [147,148,
150]. The lines represent the fit to a power law function, K
2
[
η
]
α
2
Zero-shear viscosity is known to depend on molecular weight and long chain
branching according to an equation of the form [12]:
( )
1
1
1
α
η
gM
K
o
Γ
=
(6)
where K
1
and
α
are constants and
Γ
1
is the viscosity enhancement factor due to
LCB. In the case of EVAc, the factor g can be calculated from the intrinsic viscosity
data provided in Tab. 1 (see Eqs. (1) - (3)). The dependence of
η
o
on gM
w
is
presented in Fig. 8 with reference to other highly branched polymers (LDPEs) [7,47].
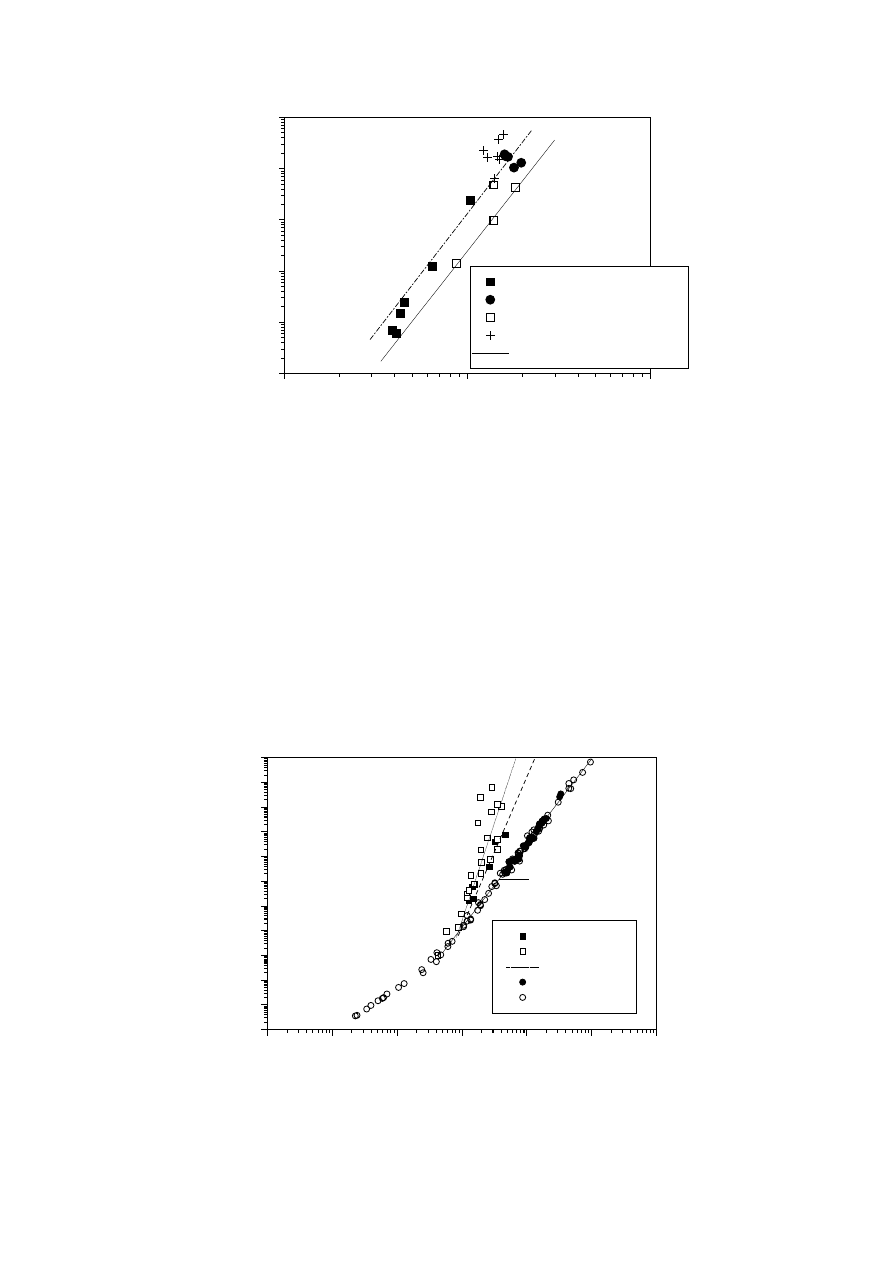
Fig. 8.
Newtonian viscosity
η
o
versus ‘hydrodynamic volume’ given by the product
gM
w
for EVAc and literature results for LDPEs [7,47] and linear PEs [150]
10
1
10
2
10
3
10
4
10
5
10
6
10
7
10
-4
10
-3
10
-2
10
-1
10
0
10
1
10
2
10
3
10
4
10
5
10
6
10
7
3.4
1
EVA-c
LDPEs (7)
LDPEs (47)
mPEs (135-146)
Linear PEs (150)
T=190ºC
η
o
/ P
a s
gM
w
0.1
1
10
10
1
10
2
10
3
10
4
10
5
10
6
EVA-c
Chromium-basesd PEs
mPEs
Branched mPEs (147,148)
Linear mPEs (150)
η
o
/ P
a s
η
/ dLg
-1
Unauthenticated
Download Date | 5/5/16 2:50 PM
14
The values of
η
ο
were calculated for 190°C from E
a
in Tab. 4 to allow results to be
compared with literature data obtained at this temperature. All branched LDPEs show
enhanced values of
η
o
when comparisons are made at constant gM
w
. The value of
the exponent of the power correlation is around 6 - 8 [7,47]. However, a slightly lower
exponent of 4.9 was obtained for EVAc. This may suggest a lower LCB density in
these materials compared to conventional LDPEs [173].
For the chromium-based PEs and mPE3, it was not possible to obtain a value of g
≠
1. The values of intrinsic viscosity are very similar to those corresponding to linear
polymers of the same M
w
. This behaviour is characteristic of essentially linear
polymers of branching contents below 3 LCB/10
4
C. For this type of polymer, Shroff
and Mavridis [142] developed a simple LCB index combining measured [
η
] and
η
o
data. Given that in linear polymers both physical properties are related to M
w
:
1
1
α
η
w
o
M
K
=
(7)
[ ]
2
2
α
η
w
L
M
K
=
(8)
using Eqs. (6) - (8) and since the viscosity enhancement factor
Γ
1
in Eq. (6) is
primarily dependent on LCB, these authors define:
[ ]
1
1
1
3
3
3
1
3
1
1
−
=
−
Γ
=
α
α
α
η
η
K
LCBI
B
o
(9)
where K
3
= K
1
/K
2
α
³
and
α
3
=
α
1
/
α
2
. LCBI is 0 for linear polymers with no LCB.
In our case, values of
α
3
= 4.83 and K
3
= 2.32·10
3
at 145°C [7,150] were used, shown
as a continuous line in Fig. 7. As shown in Tab. 4, the chromium-based PEs and
mPE3 show values of LCBI of the same order of magnitude as EVAc. Mavridis and
Shroff recently obtained similar results for LDPEs. This index does not provide
quantitative correlation with the level of branching, and does not seem to work well
for materials of high branching content. Wood-Adams and Dealy also obtained
ambiguous results in slightly branched mPEs [147], arguing that this index is based
on scarce information on the branched material. Notwithstanding, we decided to
calculate and compare the values of this index, since there could be some interesting
correlations with other properties of the materials.
Relaxation time and steady-state compliance
In strictly linear polymers of moderate polydispersity index, i.e., mPEs,
η
o
is directly
proportional to
τ
o
, which is an average relaxation time [125,135,142,144,146]. This
conclusion is easily attainable from the linear viscoelastic model assuming a single
exponential relaxation modulus G(t) in the terminal zone, and is considered to be
consistent with the behaviour predicted by reptation theory for linear, long chain,
branchless, monodisperse polymers [92,93]. This relaxation time is related to
o
γ
& , i.e.,
the shear rate for the onset of shear thinning behaviour. From the theory of linear
viscoelasticity, the longest relaxation time
λ
related to
τ
o
= 1/
o
γ
& can be defined as
λ
=
η
o
J
e
o
. The values obtained for
λ
from creep-recovery measurements for the materials
studied are listed in Tab. 4.
Fig. 9 shows the relationship between
λ
and
η
o
for the materials examined here. The
chromium-based PEs and EVAc display a correlation different to that observed for
Unauthenticated
Download Date | 5/5/16 2:50 PM
15
linear polymers
[150]. Moreover, the materials mPE0 and mPE3 show a similar
deviation, although mPE0 is linear (according to its viscosity and E
a
values, as
discussed later) but of slightly higher polydispersity index. Therefore, this plot cannot
distinguish between the effects of polydispersity and LCB. Lai et al. [125] introduced
a LCB index, denoted DRI, using the relation between
η
o
and relaxation time.
However, this index was specifically designed for polymers of similar MWD. Shroff
and Mavridis [142] stated that DRI is a measure of rheological polydispersity and as
such depends on both MWD and LCB. DRI could be used as a measure of LCB for
polymers of known similar MWD, as could any other measure of rheological poly-
dispersity [54].
Fig. 9.
Newtonian viscosity,
η
o
, versus relaxation time
λ
. The solid line represents
results for linear mPEs
[150]
Rheological polydispersity and steady state compliance
Mavridis and Shroff [54] described several indices to quantify the rheological poly-
dispersity of polymeric materials. MWD and LCB are specific molecular features that
affect these elastic indices. One such index is E
R
:
Pa
G
R
G
C
E
500
"
'
=
⋅
=
(10)
where C is an arbitrary constant chosen so that E
R
falls between 0.1 and 10. E
R
is
actually a measure related to the steady state compliance J
e
o
:
[
]
2
)
(
"
)
(
'
ω
ω
G
J
G
o
e
=
when
ω→0 (11)
which accounts for the effect of polydispersity (the high molecular weight tails) and/or
LCB. This rheological function is itself proportional to the polydispersity of the relax-
ation spectrum. From the results in Tab. 4 one can deduce that the higher the value
of J
e
o
(obtained in creep-recovery measurements) the higher the rheological
polydispersity index E
R
.
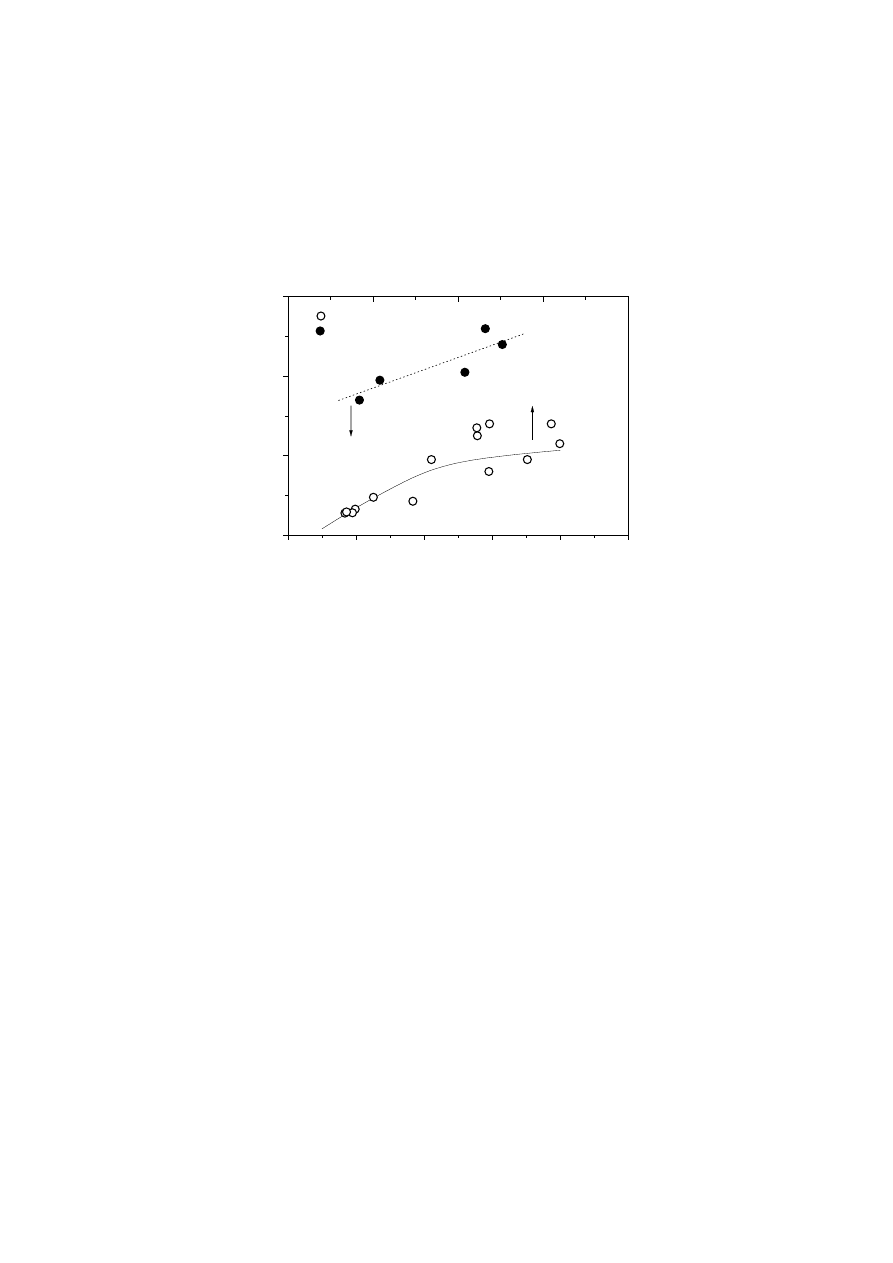
Fig. 10 shows the difference between the chromium-based PE series and linear PEs
of similar polydispersity index taken from the literature [54]. In principle, the enhanced
values of E
R
in the former could be attributable to a non-symmetric relaxation time
spectrum, with a tail of high relaxation times corresponding to large molecular
10
1
10
2
10
3
10
4
10
5
10
6
10
-5
10
-4
10
-3
10
-2
10
-1
10
0
10
1
10
2
10
3
10
4
λ
/ s
η
o
/ Pa s
Unauthenticated
Download Date | 5/5/16 2:50 PM
16
species giving rise to extremely high values of E
R
. The SEC results indicate a clear
log-normal MWD for these polymers. Moreover, it has also been proven that
branched molecules in symmetric MWD can give rise to similar increases in rheo-
logical polydispersity indices [54]. Although it has been demonstrated that LCBI
defined by Eq. (9) does not give a quantitative measure of LCB density, it seems to
correlate well with rheological polydispersity in chromium based PEs.
0
2
4
6
0.0
0.2
0.4
0.6
0.8
1.0
Chromium-based PEs
E
R
LCBI
0
5
10
15
20
M
w
/M
n
Linear PEs (54)
Fig. 10.
Elastic index E
R
versus polydispersity index M
w
/M
n
(for linear PEs
[54]) and
LCB index defined by Eq. (10) (for chromium-based PEs)
Another measure of the elastic character is the cross-point between storage and loss
moduli G
x
[54]. This value defines the transition between viscous (G” > G’) and
elastic behaviour (G’ > G”). Calculated values of G
x
are provided in Tab. 4. In the
materials of lower M
w
, the cross-point was not experimentally attained. There seems
to be a connection between LCBI and the elastic indices E
R
and G
x
; the lower G
x
and
the higher E
R
, the higher LCBI. Interestingly, if one focuses on J
e
o
values obtained
via creep measurements, it is not possible to observe the expected correlation
between elastic indices and this terminal parameter. From Tab. 4, the supposedly
most branched polymer (higher E
a
and E
R
) shows the lowest J
e
o
. It has been recently
reported that branched polydisperse polymers show lower values of J
e
o
than slightly
branched ones. The reduction in J
e
o
could be explained by an increased degree of
branching that leads to a different physical state with lower entanglement density [81,
174]. The concept of dilution proposed by McLeish et al.
[89] also serves to explain
this behaviour: the relaxation of polymer chains with long relaxation times will be
accelerated by surrounding chains or chain segments with shorter relaxation times,
since they act as diluents. In highly branched materials (high volume fraction
occupied by the branches), branches may relax more rapidly than entire molecules,
thus diluting the immediate environment, leading to an overall reduction in elasticity.
Activation energy of flow and thermorheological complexity
For EVAc, chromium-based PEs and branched mPE3, it was necessary to apply a
vertical shift factor (E
a,v
>> 4.2 kJ·mol
-1
) to obtain superimposable viscoelastic curves
Unauthenticated
Download Date | 5/5/16 2:50 PM
17
(see Tab. 4). Moreover, higher values of E
a,h
were observed for these materials (up
to 83.7 kJ·mol
-1
), compared to linear species. These observations serve to distinguish
between the effects of LCB and polydispersity. Polydisperse linear polymers show
lower values of E
a,h
and negligible values of E
a,v
[29]. Mavridis and Shroff extensively
explored the temperature dependence of a large number of materials in an attempt to
identify the effects of molecular structure in polyolefins [27]. For linear polyolefins, it is
not necessary to vertically shift viscoelastic moduli to obtain master curves. However,
neglecting the vertical shift impedes applying the TTSP when dealing with branched
materials. This observation also leads to a stress-dependent E
a
value or ‘thermo-
rheologically’ complex behaviour. This complex behaviour has been attributed to the
different relaxation mechanisms for branched and linear chains in an entangled
environment [72].
Values of E
a
may also be used to determine LCB concentration. Hughes proposed a
simplified expression for peroxide modified HDPEs [48]:
(
)
5
10
93
.
7
24
.
6
×
−
=
=
a
o
E
M
α
λ
(12)
where E
a
is the horizontal activation energy of the branched polymer, 6.24 is E
a
for a
linear polymer, and
α
is the effective LCB concentration. A non-quantitative relation
was developed for ethylene/1-hexene metallocene copolymers taking into account
the effect of SCB [135]:
( )
( )
( )
SCB
a
SCB
a
LCB
a
E
E
E
LCBI
−
=
(13)
( )
−
−
+
=
4
.
35
exp
1
4
.
6
7
.
5
ν
SCB
a
E
(14)
where
ν
is the degree of butyl branching per 1000 carbon atoms.
More recently, Wood-Addams and Costeux
[153] pointed out that this correlation is
not valid. These authors noted a synergistic effect of LCB in the values of E
a
when
there was SCB in the polymer system.
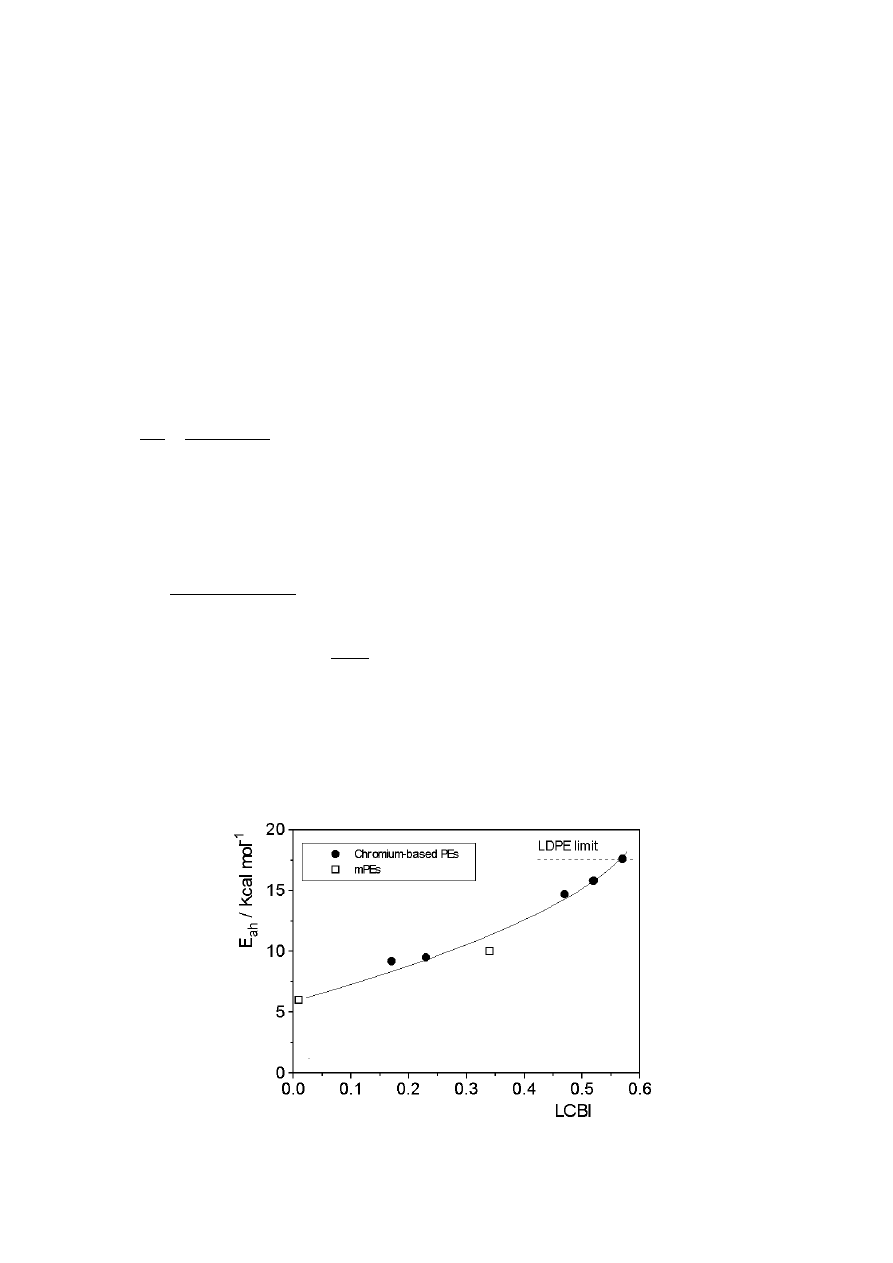
Fig. 11.
Activation energy of flow versus LCB index from Eq. (9) for chromium-based
PEs and mPEs
Unauthenticated
Download Date | 5/5/16 2:50 PM

18
E
a
values seem to be related to the indices LCBI, E
R
and G
x
, for mPE and the
chromium-based series, as shown in Tab. 4 and Fig. 11. Moreover, the chromium-
based PEs with the highest values of LCBI present values of E
a
close to typical LDPE
values.
The correlation between E
a
and LCBI for the chromium-based PEs and mPEs does
not hold for the EVA copolymers. This may be due to the inapplicability of the LCB
index to highly branched polymers as indicated above [142]. Correlations between E
a
and the absolute number of LCB were recently made by Yan et al. [143] and Hatzi-
kiriakos [29]. However, these approaches have not been widely accepted since the
range of temperature and frequency data employed in the calculation is likely to
affect E
a
values [142]. Moreover, some published results suggest that the absence of
an enhanced E
a
value in PEs does not necessary preclude the absence of low levels
of LCB. As Wasserman and Graessley suggested [156], in polymers with small
fractions of branched chains, E
a
may be dominated by the contribution of the linear
chain majority, but the few branches present may be sufficiently long to enhance
viscosity and elastic properties. In a recent study, similar values of E
a
were obtained
for two mPEs of different levels of LCB [145]. Published results indicate that these
correlations are strongly dependent on the nature, i.e., the length and distribution of
branches [71]. In other cases in which the TTSP is not fulfilled [142], which suggests
a different mechanism of flow depending on the molecular structure, it is not possible
to give a reliable value of E
a
. For example, values of E
a,h
ranging from 37.7 to 100.5
kJ·mol
-1
and E
a,v
from 1.67 to 35.6 kJ·mol
-1
were obtained for LLDPE modified with
peroxide depending on the frequency range used in the calculation. Wood-Addams
and Costeux
[153] reported similarly dependent E
a
values for branched mPEs and
proposed that E
a
has to be measured at very low frequency or derived from
η
o
data
to avoid frequency dependence in these particular cases. These authors obtained a
linear correlation between E
a
and LCB for ethylene/1-octene copolymers and ethyl-
ene homopolymers, and a synergistic effect of the comonomer on E
a
values. At this
point it should be underscored that Eqs. (12) - (14) do not account for this synergistic
effect. In the case of EVAc, the E
a
results (around 54.4 kJ·mol
-1
) are certainly lower
than would be expected for highly branched polyolefins (around 67 - 88 kJ·mol
-1
in
LDPE). These lower values of EVAc with respect to LDPE could reflect a slightly
different structure due to the introduction of the vinyl acetate comonomer in the highly
similar radical polymerisation process [173].
Dynamic moduli and loss angle
Differences between linear and branched polymers are not only due to varying basic
terminal variables such as
η
o
, J
e
o
or E
a
. In general, the introduction of long branches
leads to a broad viscoelastic response, extended at lower frequencies, and to the
appearance of a characteristic relaxation mechanism between the terminal and the
plateau zones. Fig. 12 shows a reduced plot of the dynamic moduli versus
η
o
ω for
mPEs and branched EVAc of moderate polydispersity index (M
w
/M
n
= 2 - 4).
This procedure yields an M
w
-invariant asymptote G”(
η
o
ω) =
η
o
ω for the loss modulus
versus reduced angular frequency. For materials that follow a power law relation
η
o
∝
M
w
α
and present similar values of J
e
o
, master curves of G’ and G” are observed [26],
as in the case of EVAc [173]. From this figure, it may be assumed that either the
EVAc or branched mPE3 show a very different viscoelastic pattern to linear polymers
of moderate polydispersity index. It can be seen that branched polymers present
enhanced values of G’ at low frequencies and a broader transition between the
Unauthenticated
Download Date | 5/5/16 2:50 PM
19
terminal zone (low frequencies) and the plateau zone (high frequencies). This behav-
iour suggests a new well-defined relaxation regime.
10
1
10
2
10
3
10
4
10
5
10
6
10
7
10
8
10
0
10
1
10
2
10
3
10
4
10
5
10
6
0.6-0.5
1
2
EVAc (PI=3-4) dashed lines
mPE3 (PI=2) symbols
mPE1,2 and 4 (PI=2) solid lines
Branched Polymers
G
', G
" / P
a
ωη
o
/ Pa
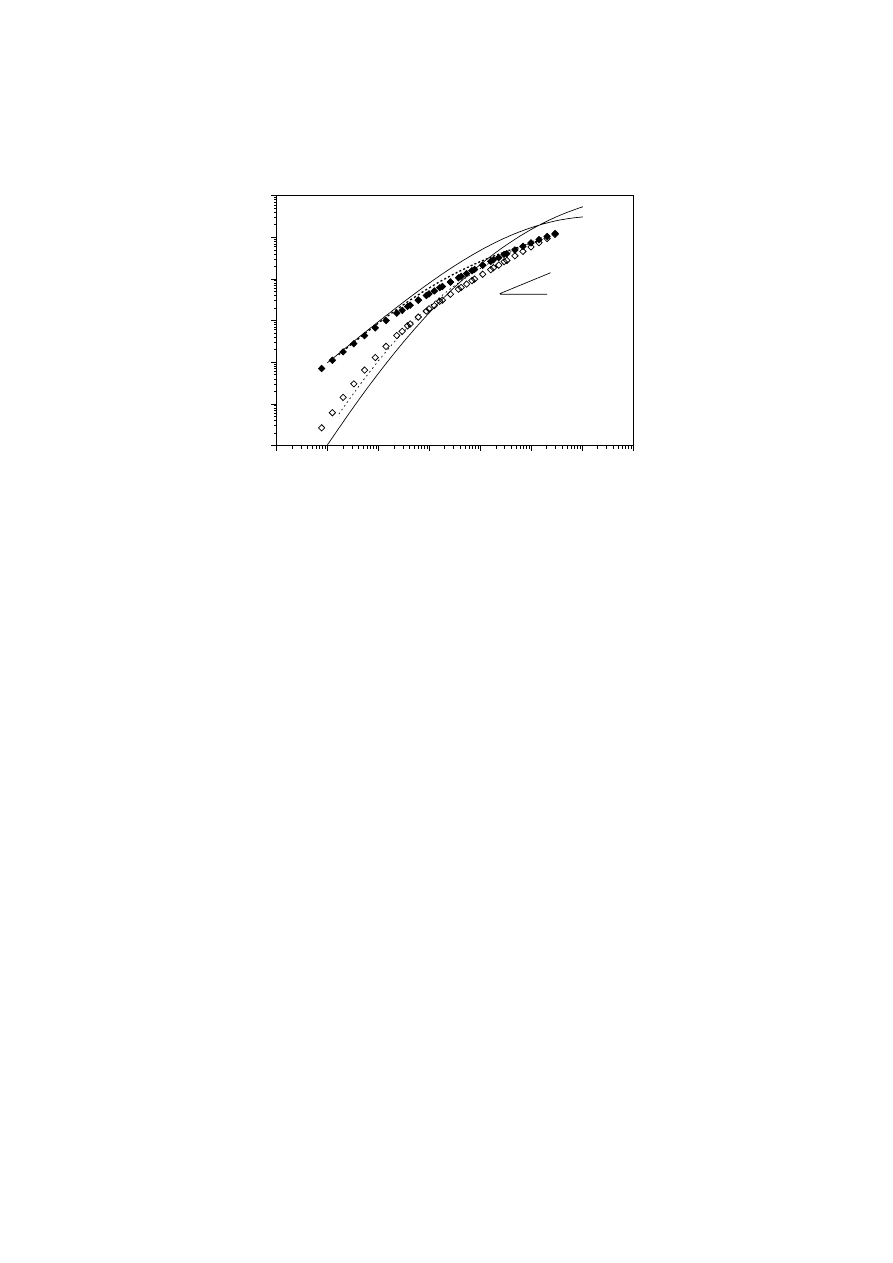
Fig. 12.
Reduced curves of storage and loss moduli G' and G" for some of the
materials examined. The solid line shows the behaviour of linear mPEs. Symbols
represent the behaviour of branched mPE3, and the dashed line indicates the
behaviour of EVAc [168]
Hingmann and Marczinke [57] and Kasehagen et al. [79] obtained similar results for
randomly branched PP and PB. The new relaxation mechanism observed at
intermediate frequencies in star and comb polymers has been shown to depend on
branch molecular weight M
b
[70,76]. In these polymers, relaxation of the whole
branched molecules moves towards lower frequencies (higher relaxation times to
reach terminal behaviour G’
∝ ω
2
) compared to linear species, and intermediate
dispersion of relaxation modes associated with movements of the branches occurs.
This additional relaxation regime between the plateau modulus and the terminal
region has also been reported for mPEs [138,147,148] but has not been discussed in
detail. Only Wood-Adams et al. [147,148] suggested that the presence of LCB greatly
affects the loss angle
δ
and discussed the effect in terms of a plateau in the loss
angle versus frequency plots, whose magnitude and breadth depends on the degree
of LCB. These observations are in accordance with findings by Koopmans for LDPE,
LLDPE and branched mPEs [175]. The loss angle not only appears to be the most
sensitive indicator of the presence of LCB, but plots of
δ
versus the complex modulus
G
* or reduced frequency
ω
η
o
have even been proposed to evaluate thermorheo-
logical complexity in polymers and blends [29,175,176]. Fig. 13 shows plots of the
loss angle versus reduced frequency
ω
η
o
for some of the materials examined.
This graph serves to eliminate the effect of M
w
[148]. One can observe a clear
inflexion in the loss angle for branched mPE3, which does not occur in the case of
the linear mPE1. For the chromium-based polymer PE222, the variation in
δ
is very
discrete and lower than for a PE sample of similar polydispersity index [177].
In a recent study, García-Franco et al. [178] analysed the results obtained by Wood-
Adams et al. [148] from a different perspective. They considered that branched
Unauthenticated
Download Date | 5/5/16 2:50 PM
20
polyolefins show physical gel-like behaviour. Consequently, these materials can be
evaluated in terms of the relaxation of critical gels [179-182]. The storage and loss
moduli of a critical gel obey a scaling law with the same exponent, n:
( ) ( )
n
G
G
ω
ω
ω
∝
"
,
'
(15)
10
1
10
2
10
3
10
4
10
5
10
6
10
7
10
8
30
40
50
60
70
80
90
Terminal region
Additional/Broad relaxation
mPE1
mPE3
Polydisperse HDPE (171)
PE222
δ
º
ωη
o
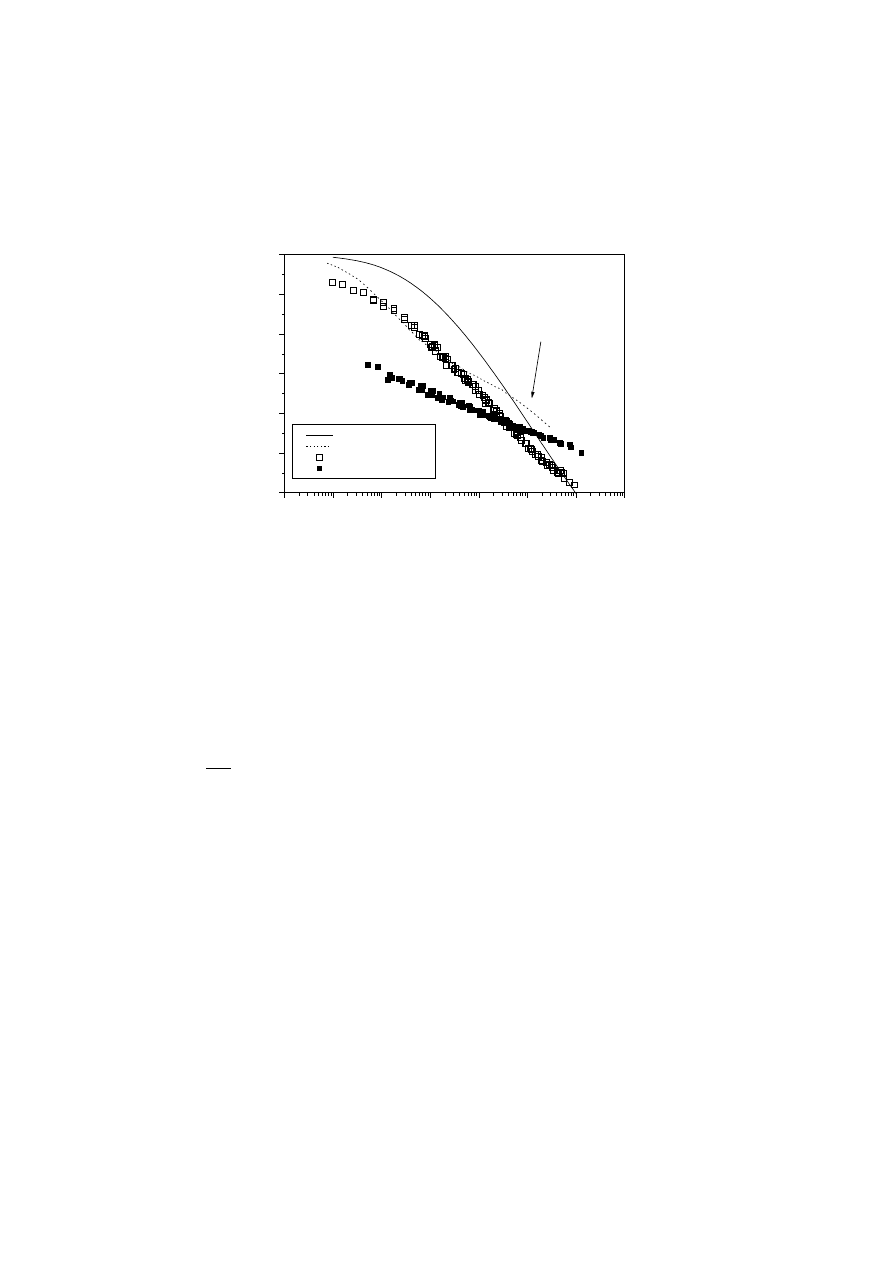
Fig. 13.
Reduced curves of the loss angle
δ
for some of the materials evaluated at
145°C. The solid line indicates the behaviour of linear mPEs. The dashed line
represents the behaviour of branched mPE3. Open symbols show the behaviour of
linear polydisperse HDPE [177] and solid symbols represent the behaviour of one
chromium-based PE (PE222)
According to this approach, the loss angle is independent of the frequency at the gel
point:
=
2
tan
tan
π
δ
n
c
(16)
for
ω < 1/
λ
o
,
λ
o
being a relaxation time characteristic of a crossover to a different
relaxation mechanism. A gel described by n = 1 is predominantly viscous, while one
described by n = 0 shows elastic behaviour. Thus, the frequency independence of
tan
δ
at intermediate frequencies provides a reliable method of establishing similarity
with a gelation process. It is clear from Fig. 13 that polymers with LCB show a
plateau that does not appear for linear species. Moreover, this behaviour is partic-
ularly enhanced in chromium-based PE, for which a slight variation in
δ
is observed
across the entire frequency range. In this case, an inflexion is not clear, but a
dependence of G’ and G” on the frequency with an exponent of n < 0.6 is obtained in
the high frequency zone, as for the branched polymers in Fig. 12. According to the
study by García-Franco et al. (for mPEs) [172], these values of n correspond to LCB
levels higher than 0.1 LCB
/
10
4
C.
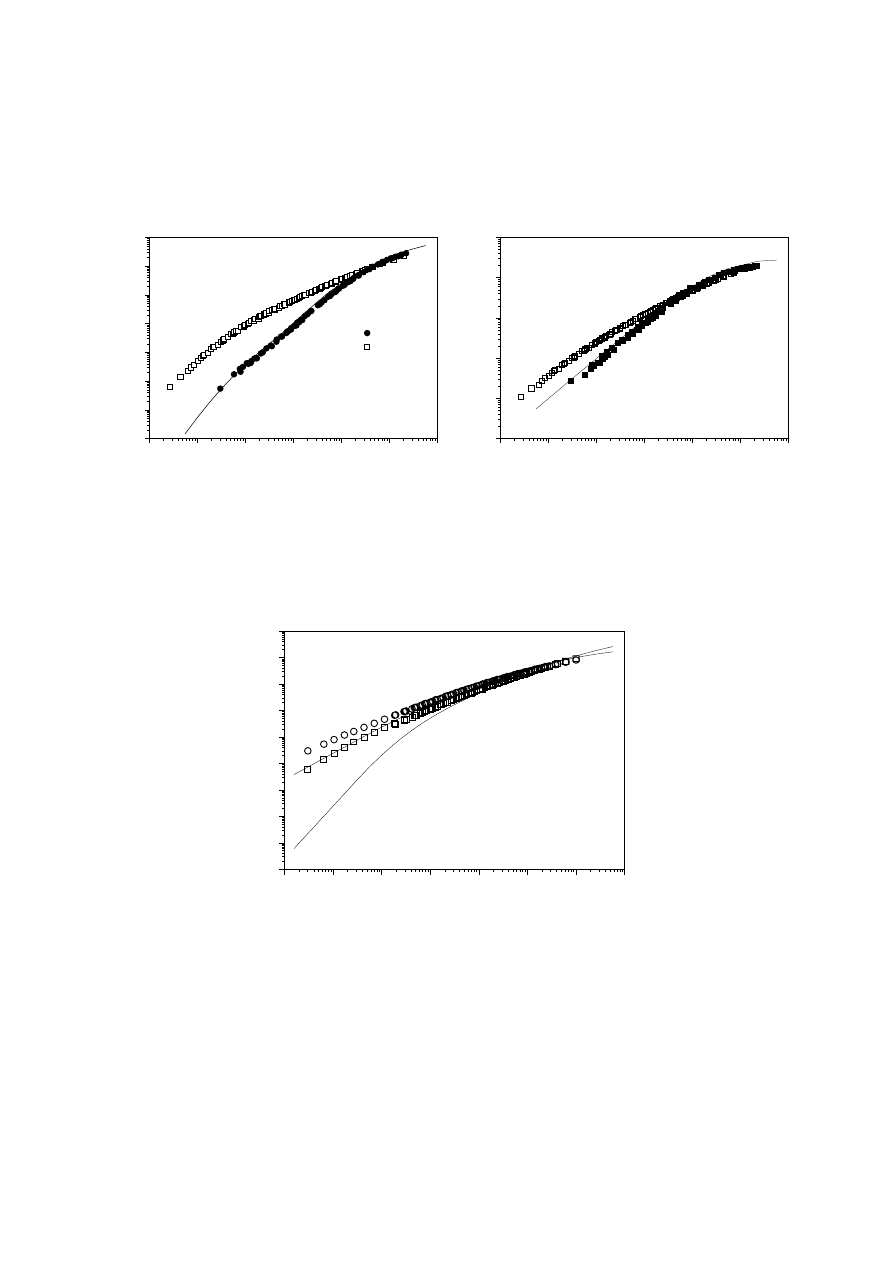
Predicting the presence of LCB from MWD
The relationship between rheological properties of polymer melts and MWD is a topic
of increasing interest. All the current models that relate viscoelastic functions and
δ/°
Unauthenticated
Download Date | 5/5/16 2:50 PM

21
MWD are based on the classical reptation theory of de Gennes [90], lately
implemented by Doi-Edwards [91]. The monodisperse model assumes that the
surrounding species of a polymer molecule constitute a time invariant matrix that can
be described as a fixed tube along which the polymer chain reptates. The different
models available allow testing of the ability of boundary viscoelastic properties of the
transition zone, i.e.,
η
o
and ‘plateau’ modulus G
N
o
, to describe the viscoelastic
behaviour of linear polymers. A good summary of the state-of-the-art of this particular
subject can be found elsewhere [183]. Llorens et al. developed a relatively simple
model that provides a good description of linear polymers [184]. The model is based
on a chain relaxation time, convoluted by an average molecular weight distribution,
that describes the effect of the environment where the molecule reptates. G’ and G”
can be then expressed by:
( )
( )
M
dM
A
A
A
M
M
c
c
G
G
G
o
N
+
+
−
=
+
∫
∞
2
2
0
2
0
2
/
1
1
ln
1
exp
"
'
π
ω
ω
(17)
[ ]
[ ]
4
.
3
15
.
2
25
.
1
w
n
o
N
o
M
M
M
G
A
η
ω
=
(18)
where M
o
and c values depend on the type of MWD. In our case, the MWD may be
approximated by a log-normal distribution and the above can then be expressed as:
=
−
=
4
exp
4
exp
2
2
c
M
c
M
M
n
w
o
(19)
η
o
in Eq. (18) is that corresponding to a linear polymer of weight-average molecular
weight M
w
according to Eq. (5). By applying the above expressions, the rheological
response of the material can be directly connected with MWD without using the
relaxation spectrum. In our samples, GPC measurements always took the form of a
bell-shape and thus Eq. (19) is applicable.
The model was applied to the molecular variables listed in Tab. 1 together with the
values of G
N
o
obtained from rheological measurements and the literature [150,177,
185]. A value of G
N
o
of 1.0·10
6
Pa has been used for mPEs [150]. For chromium-
based PEs, a value of 1.5·10
6
Pa, commonly used in this type of calculation for
HDPE and LLDPE, was previously selected [185]. The value of G
N
o
for PE has
generated much controversy, and values ranging from 1.1·10
6
Pa (in mPEs) to
2.6·10
6
Pa (in HPB) can be found in the literature. This particular subject is discussed
elsewhere [150]. The lines in Figs. 14 and 15 represent the results of the model for
two mPEs showing a polydispersity index of 2 and similar M
w
. Reasonable accuracy
between experimental results and those obtained by applying the model can be
observed for linear mPE1. However, for the metallocene sample mPE3, the model
fails across the whole frequency range. This material shows enhanced viscosity and
elastic character at low frequencies and a broader viscoelastic response.
A similar result was obtained for the chromium-based PE PE221 (see Fig. 16). For
this material, the high polydispersity index M
w
/M
n
= 9.5 does not explain its visco-
elastic response, unlike polydisperse linear polyethylenes [52,161,162]. It seems
reasonable to suggest that this result is attributable to the presence of LCB, provided
the model is only applied to linear species. It should be noted that independent
evidence of the presence of these structures, such as E
a
values, is provided above
for mPE3 and the chromium-based PE series. Unfortunately, there is presently no
Unauthenticated
Download Date | 5/5/16 2:50 PM
22
simple rheology-MWD conversion model able to quantify LCB in polyolefins. Only
Wood-Adams and Dealy [147] were able to analytically correlate characteristic
features of the viscosity-MWD conversion curve and measured LCB levels, obtained
by
13
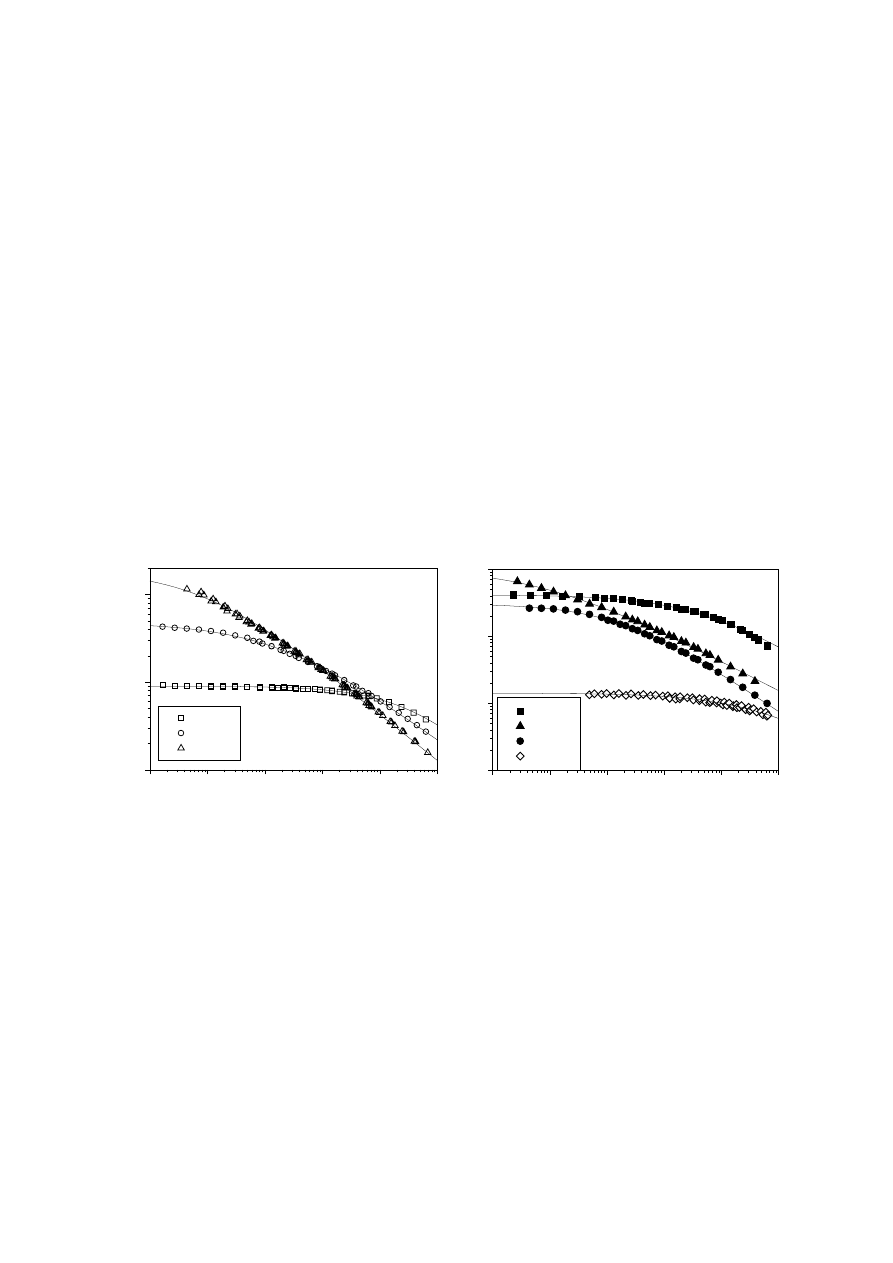
C NMR and solution methods for constrained-geometry mPEs.
Fig. 14.
(left) Experimental G' values for two of the mPEs. The solid line represents a
fit to Eqs. (17) - (19)
Fig. 15.
(right) Experimental G" values for two of the mPEs. The solid line represents
a fit to Eqs. (17) - (19)
10
-4
10
-3
10
-2
10
-1
10
0
10
1
10
2
10
3
10
-3
10
-2
10
-1
10
0
10
1
10
2
10
3
10
4
10
5
10
6
M
w
=160700
M
w
/M
n
=9.5
c=2.21
PE221
G'
b
T
, G
"b
T
/ P
a
ω
a
T
/ rad s
-1
Fig. 16.
Experimental storage G' (squares) and loss G" (circles) moduli for a
chromium-based PE (PE221). Solid lines represent a fit to Eqs. (17) - (19)
Quantitative prediction of LCB from rheological data: rheology and topology
Bersted and co-workers presented a general description of the rheological response
of PE containing any level of LCB in terms of molecular structure, namely MWD and
LCB content. This model extends a previous approach to predicting the rheological
properties of linear [47,50] and branched [31] PEs. Basically, Bersted considered that
PEs with very low levels of LCB (less than 0.1 LCB
/
10
000 C) behave as blends of
linear (HDPE) and branched (LDPE) species. This model shows good agreement
10
-3
10
-2
10
-1
10
0
10
1
10
2
10
3
10
-1
10
0
10
1
10
2
10
3
10
4
10
5
10
6
mPE1
mPE3
M
w
=110000
M
w
/M
n
=2
c=1.18
G'
b
T
/
P
a
ω
a
T
/ rad s
-1
10
-3
10
-2
10
-1
10
0
10
1
10
2
10
3
10
1
10
2
10
3
10
4
10
5
10
6
G"
b
T
/
P
a
ω
a
T
/ rad s
-1
Unauthenticated
Download Date | 5/5/16 2:50 PM

23
between predicted relationships among
η
o
, E
a
and branching level, and experimental
data. Maximum
η
o
is predicted at approximately 2.5 LCB/10
000 C. A further increase
in LCB density leads to a decrease in
η
o
(see Fig. 3) and an increase in E
a
up to that
corresponding to LDPEs.
Recently, Lussignan and co-workers [159,160] analysed the effects of branching on
η
o
values in polyesters. In particular, by constraining the molecular weight between
branch points M
bb
, they systematically varied M
w
. These authors found that the
exponent in the relation between
η
o
and M
w
could be higher or lower than 3.4,
depending on the magnitude of M
bb
, i.e., the level of branching. Janzen and Colby
[158] took advantage of these studies and presented a method of determining the
level of LCB from
η
o
values.
The authors proposed a general phenomenological description for the dependence of
η
o
on M
w
when there is random LCB:
<
<
+
<
<
+
=
w
bb
c
s
bb
w
c
bb
w
w
c
bb
c
w
w
o
M
M
forM
M
M
M
M
KM
M
M
forM
M
M
KM
γ
η
4
.
2
4
.
2
1
1
(20)
M
c
is the critical molecular mass for the effect of entanglement of random branching
to set in, and M
bb
is the average molecular mass between a branch point and its
adjacent vertices, either chain ends or other branch points. When M
bb
is lower than
M
c
, the material is considered as a linear one for which the classical dependence
η
o
∝ M
w
3.4
exists. When M
bb
is higher than M
c
, the effect of branching on
η
o
is described
by the exponent s/
γ
:
+
=
Kuhn
bb
M
M
B
s
90
ln
8
9
2
3
,
1
max
γ
(21)
The numerical pre-factor K carries the dimensions of viscosity and is specific for a
chosen polymer at a given temperature, B is a constant and M
Kuhn
is the mass
corresponding to the Kuhn length. Furthermore, it was proposed that M
bb
is directly
related to the LCB content in terms of the fraction of total carbons that are long-
branch vertices
α in an assumed topological structure (Cayley tree) [158]:
(
)
1
1
2
−
−
−
=
w
bb
o
M
M
M
α
(22)
Predictions of the Janzen and Colby model are presented in Fig. 17 for PEs of fixed
M
w
= 200
000 and varying degree of branching.
The parameter K is 1.42·10
-5
Pa·s·mol·g
-1
at 190°C if we choose an average value of
M
c
= 3800 and apply the results of
η
o
versus M
w
for several model linear PEs [150].
This M
c
value of 3800 was selected as the average of values reported for PE (2000
to 5200) [150,158,160]. The variables B = 6, M
o
= 14.027 g·mol
-1
and M
Kuhn
=145.9
g·mol
-1
were taken from Janzen and Colby's study [158]. Note that
η
o
is extremely
sensitive to branch content and that the dependence is non-monotonic. This result
qualitatively resembles that obtained by Bersted [30,47,50]. In both cases, as LCB
density increases,
η
o
is predicted to increase to a maximum at around 1 - 3
Unauthenticated
Download Date | 5/5/16 2:50 PM
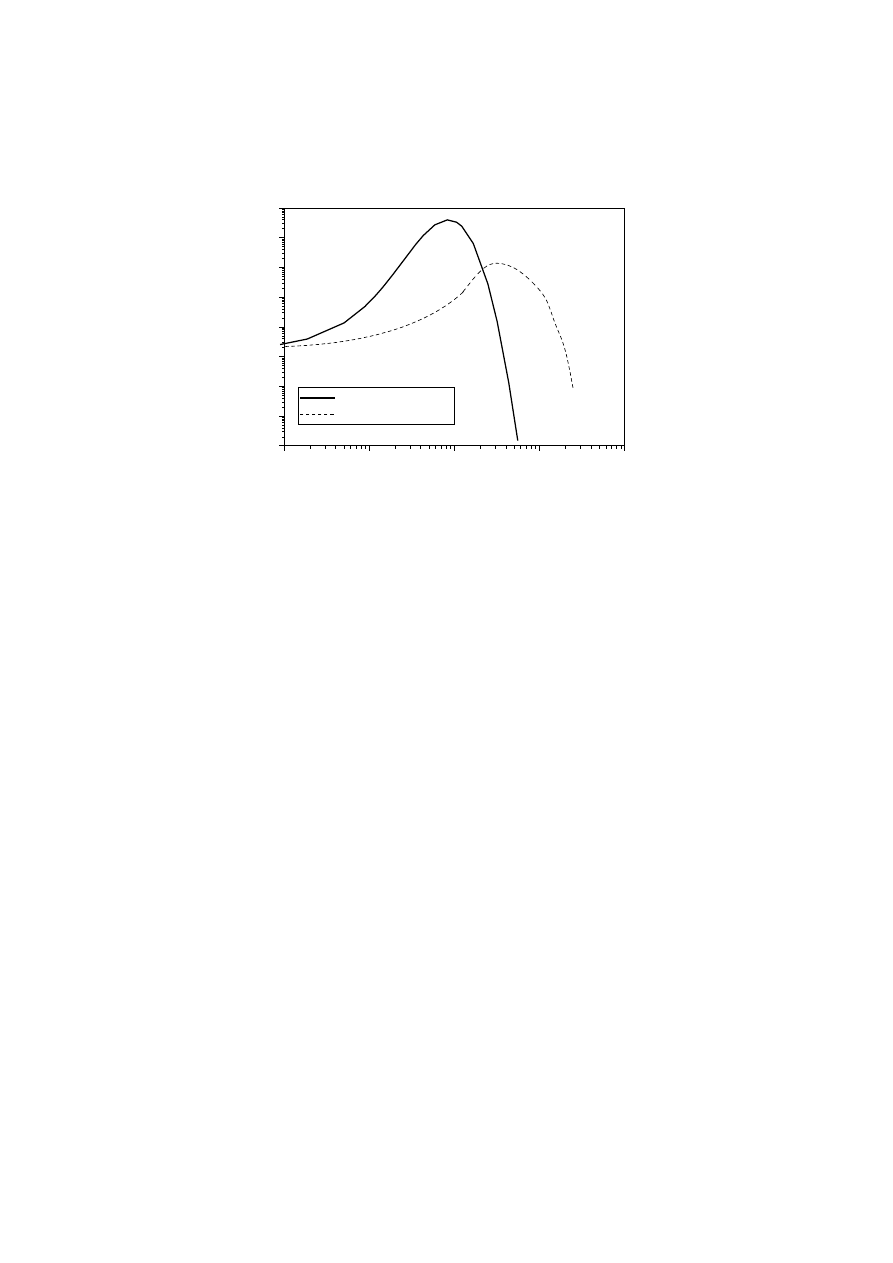
24
LCB
/
10
4
C, and then to decrease to values below that corresponding to a linear
polymer. The model has been successfully applied to predict the branching level in
randomly cross-linked melts of linear chains and LDPEs [158].
Fig. 17.
Predictions of Newtonian viscosity
η
o
, based on the theories of Janzen and
Colby [158] and Bersted [47,50] for randomly branched PEs, as a function of LCB
density for a weight-average molecular weight M
w
of 200
000
As pointed out in Janzen and Colby's work, for
η
o
values higher than that corre-
sponding to the linear polymer, the model has two solutions for M
bb
and only one in
the region below. The choice of one of these two solutions can be based on further
indication of the presence of LCB such as the E
a
value. We considered that the
materials showing the lowest E
a
(up to 42 kJ·mol
-1
) would contain the lowest amounts
of LCB, i.e., mPE3 and the chromium-based PEs PE221 and TR210. Materials with
the highest E
a
(higher than 42 kJ·mol
-1
and close to that corresponding to LDPE)
were taken to contain the highest amount of LCB (> 1 LCB
/
10
000
C in Fig. 17).
Values of
α were calculated taking into account the above considerations for the
materials under study by means of Eqs. (20) - (22) using the experimental values of
M
w
and
η
o
listed in Tabs. 1 to 4. The constant K was calculated to be 3.21·10
-5
Pa·s·mol·g
-1
at 145 - 150°C from the plot of
η
o
versus M
w
for linear PE in Fig. 6.
These values of
α were compared with those obtained by
13
C NMR (EVAc) shown in
Tab. 5. A difference of one order of magnitude can be observed. This difference
seems plausible [158], given that for LDPE,
13
C NMR spectroscopy almost certainly
counts branches longer than 6 C atoms that are, nevertheless, too short to produce a
rheological effect (M
b
> M
e
). In contrast, the LCB density obtained for the chromium-
based PEs is of the same order of magnitude as those obtained using García-
Franco's correlation described in the preceding section. Fig. 18 shows that there is
good correlation between the values of E
a
and estimated values of LCB density.
Several recent literature values of E
a
and LCB density (obtained by
13
C NMR and
GPC-LALLS (low-angle laser light scattering)) are included in this figure. Values
obtained for homopolymers and copolymers appear to differ, higher values of E
a
at
the same estimated and/or measured value of LCB density being observed for the
copolymers. This is most likely due to an effect of the comonomer in E
a
[135,153,
10
-2
10
-1
10
0
10
1
10
2
10
1
10
2
10
3
10
4
10
5
10
6
10
7
10
8
10
9
Janzen-Colby (153)
Bersted (47,50)
η
o
/ P
a s
LCB/ 10000 C
Unauthenticated
Download Date | 5/5/16 2:50 PM
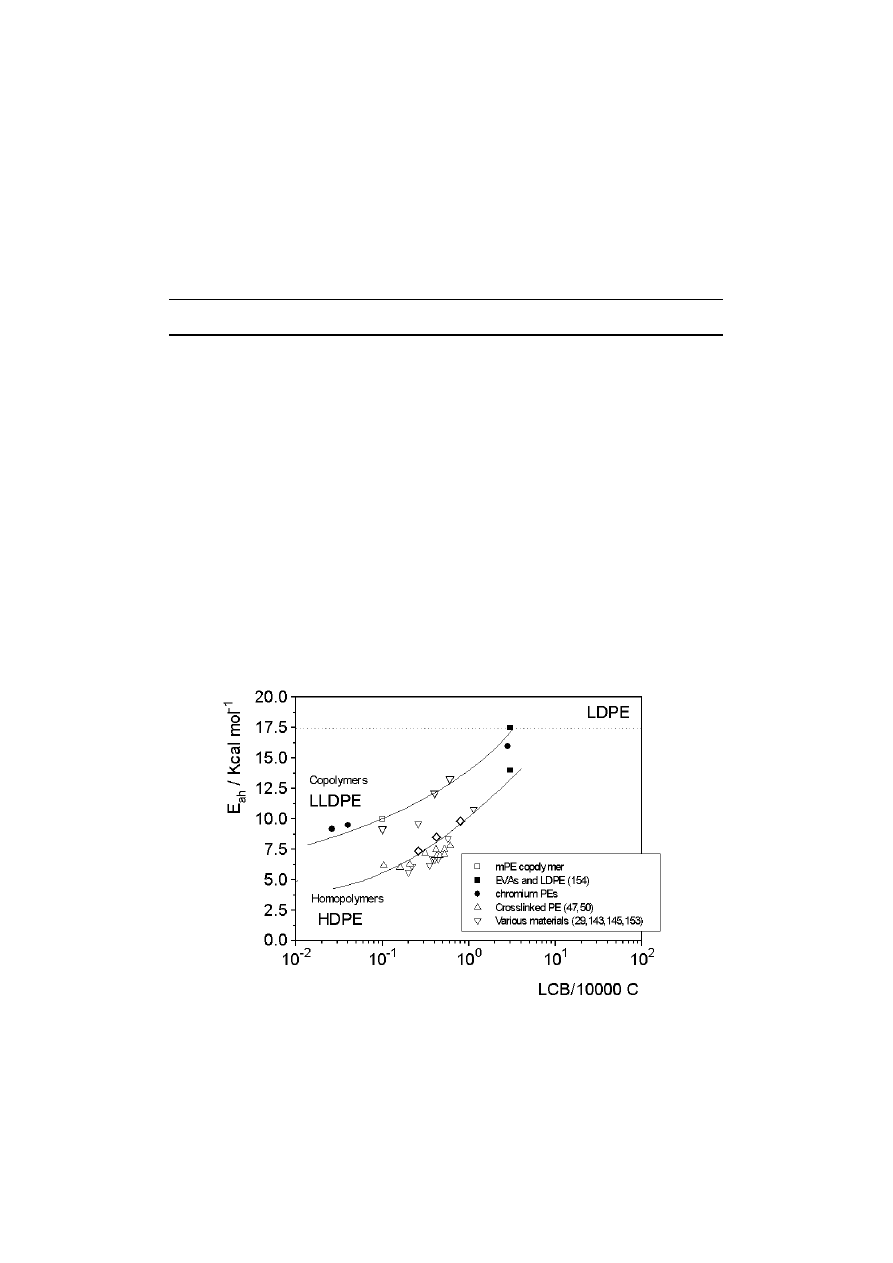
25
186]. At very low LCB content, from Fig. 18 one can infer the value for completely
linear HDPE (20.9 kJ·mol
-1
for metallocene homopolymers in refs. [135,143,150]) and
LLDPE (around 29 - 34 kJ·mol
-1
for metallocene and Ziegler-Natta copolymers,
depending on comonomer type and content in refs. [27,29,135,150]). For LCB
density higher than 1 LCB /10
000
C atoms, the typical values of EVA copolymers
and LDPE (55 - 84 kJ·mol
-1
in refs. [18-29, 173]) are obtained.
Tab. 5.
Long chain branching level of the materials examined
Sample
α×10
4
(NMR) M
bb
(Eqs. (20),(21))
α×10
4
(Eq. (22))
EVA1 <25
16400
3.9
EVA2 <20
16100
3.4
EVA3 <20
15500
3.1
EVA4 <35
14830
3.2
EVA5 <25
14100
3.2
EVA6 <25
14500
2.7
PE221 -
148500 0.036
PE222 -
20850
2.8
PE223 -
20500
2.9
PE224 -
20200
2.9
TR210 -
171500 0.024
mPE3 -
95500
0.1
Fig. 18.
Effect of long chain branching on the activation energy of flow E
a,h
. The lines
are drawn to guide the eye. Solid symbols indicate results obtained by the Janzen
and Colby approach [158] for our samples. Open symbols represent results from the
literature obtained by
13
C NMR and/or SEC-LALLS [29,143,145,153]
Recently, Tsenoglou and Glotsis [187] developed a simple rheological method for
estimating the degree of branching as the branched polymer fraction x, also based
Unauthenticated
Download Date | 5/5/16 2:50 PM
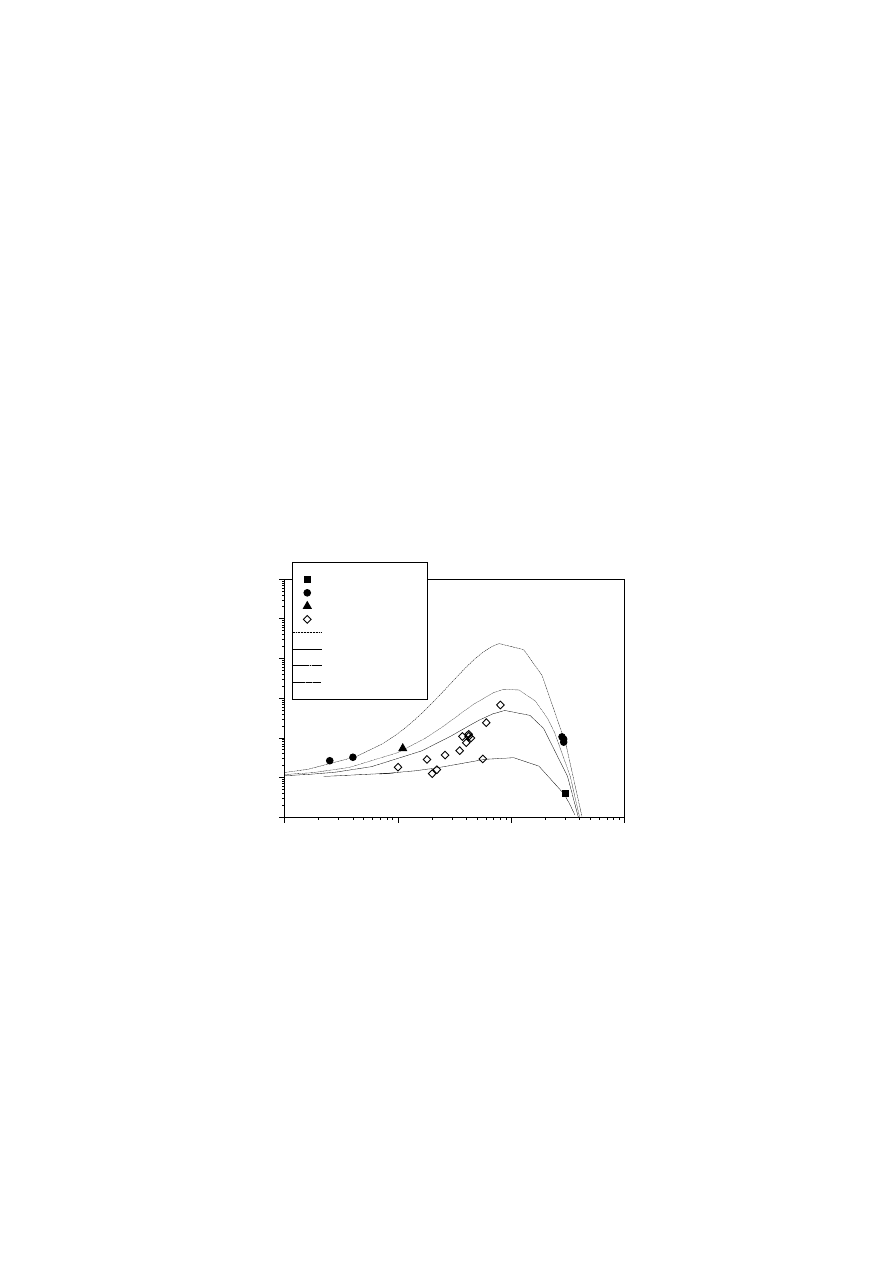
26
on
η
o
data for cross-linked polymers. The method relies on several assumptions, the
most important being: (i) branching structures have a tree-like star topology; (ii) the
molecular weight of the branched fraction is 1.5
M
w
, M
w
being the weight-average
molecular weight of the linear precursor; (iii) the viscosity of a branched polymer
varies exponentially with M
w
, and (iv) the viscosity of a blend of linear and branched
species shows log-additivity. The method seems to work well for branch-modified
samples from the same linear precursor of PP. The authors point out that for random
long chain branched structures (of LDPE tree-like architecture) some of the assump-
tions do not hold true.
In a recent paper, Larson explored the degree to which predictions such as that
shown in Fig. 17 are sensitive to the type of branching present and whether it might
be possible to infer the branching type from linear viscoelastic data [165]. This author
considered mixed systems with wide polydispersity in branch length and branch
position. The main conclusion was that the dependence of
η
o
on LCB density qualita-
tively matches that predicted by Janzen and Colby's model [158]. However, for the
cases explored by Larson (stars, combs, and mixtures of both with linear species),
viscosity can differ greatly, even for the same LCB content. This means that the
viscosity strongly depends on the particular branching architecture and that LCB
density can not only be calculated from
η
o
and M
w
values. Fig. 19 shows predictions
of the Janzen and Colby model for PEs of M
w
between 400
000 and 150
000.
0.01
0.1
1
10
10
-1
10
0
10
1
10
2
10
3
10
4
10
5
EVAc
Chromium-based PEs
mPE
mPEs (143,145,148)
M
w
=150000
M
w
=100000
M
w
=80000
M
w
=40000
η
ob
/
η
ol
LCB/ 10000 C
Fig. 19.
Predicted variation in Newtonian viscosities
η
o
for branched ethylene-based
homo- and copolymers of different weight-average molecular weight M
w
from 40
000
to 150
000 as a function of long chain branching density. The black square (EVAc),
open squares (branched mPE3) and black circles (chromium-based PEs) are the
predictions obtained by applying Janzen and Colby's theory [153]. Open diamonds
indicate measured long chain branching contents (by
13
C NMR and/or SEC-LALLS)
for mPEs [143,145,147,148]
The black symbols correspond to the materials examined here, whose LCB content
was estimated using the Janzen and Colby formula (Eqs. (20) - (22)). Obviously they
match the model. The open symbols correspond to branched mPEs of M
w
= 100
000,
for which LCB density was obtained by
13
C NMR and SEC-LALLS [143,145,147,148].
The plot shows that the Janzen and Colby model slightly underestimates LCB density
Unauthenticated
Download Date | 5/5/16 2:50 PM
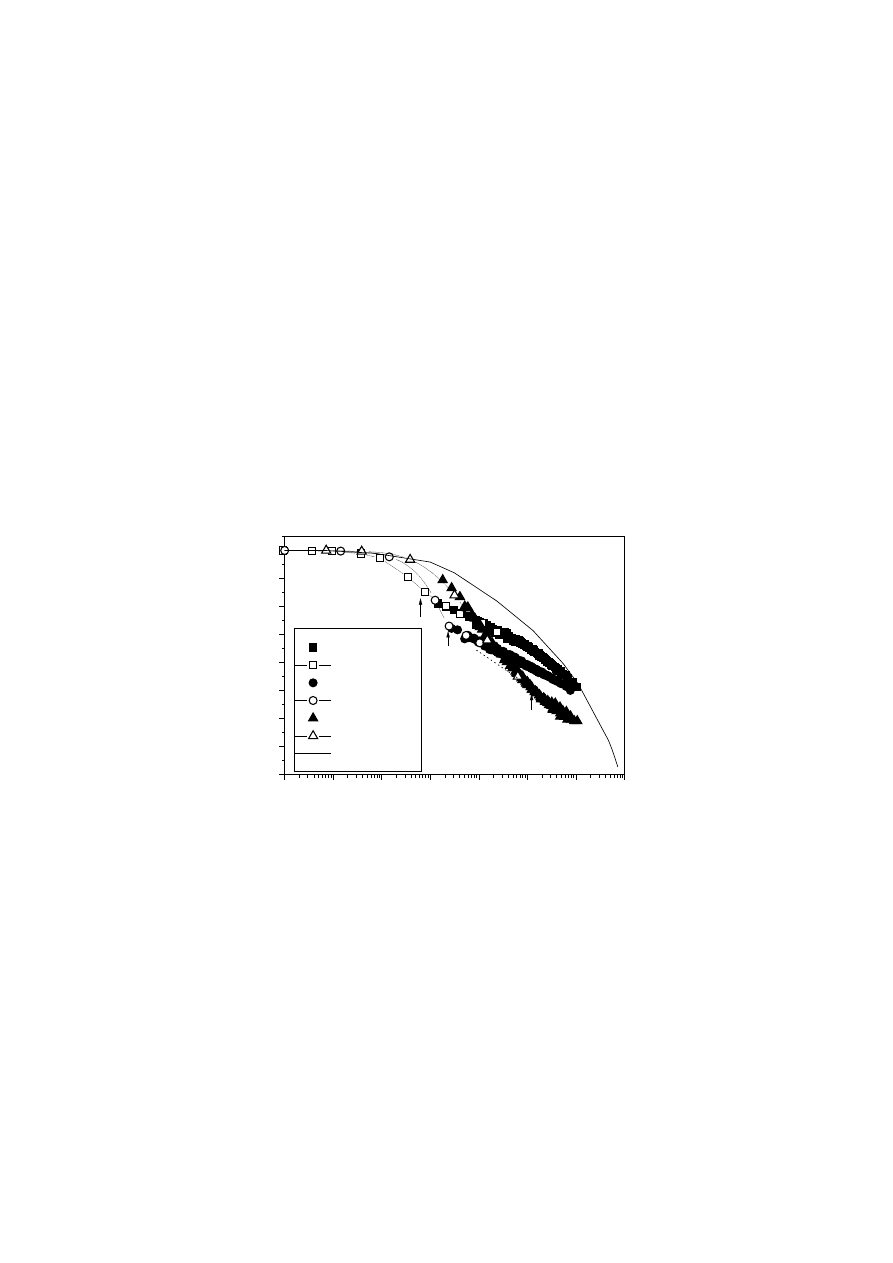
27
for a given value of
η
o
. The values estimated by the model are around half those
measured by
13
C NMR or solution methods, but, nonetheless, are in fair agreement.
Bin Wadud and Baird recently described a similar difference between experimental
and estimated LCB levels for two commercial mPEs [143]. This difference hardly
affects the results in Fig. 18.
It is worth pointing out that Janzen and Colby's model was developed for randomly
branched polymers in which there may be a wide range of branching types. In
contrast, it is suspected that branched metallocene PEs are blends of linear and
branched star- and H-shaped molecules [156], so it is expected that the model will
not hold for these polymers. Larson [165] obtained very different values of
η
o
for star
and comb branched polymers (PB) with the same LCB content; the comb polymers
always showed higher viscosity values even at very low branching content (blend of
branched and linear species). The results obtained here also reflect the complexity of
the ‘branched polymer problem’, as highlighted by Larson. This author concludes that
the question needs to be addressed by examining the entire viscoelastic response of
the materials, comparing results of well characterised model branched polymers and
their blends with model linear polymers, and improving the limited theories of
branched polymer rheology.
10
-7
10
-6
10
-5
10
-4
10
-3
10
-2
10
-1
10
0
10
20
30
40
50
60
70
80
90
δ
c
,G*
c
TR210
TR210 creep
PE222
PE222 creep
LDPE
LDPE creep
Model PI=10
δ
/ º
G*/G
N
o
Fig. 20.
Reduced van Gurp-Palmen plot for some of the materials studied. The solid
line represents simulated data based on the model described in the text for a linear
PE of M
w
/M
n
= 10 (see Fig. 16)
From a more phenomenological perspective, Trinkle et al. [187] developed a system-
atic method of inferring the topology of branched polymers, irrespective of M
w
,
chemical nature and composition, or microstructure (tacticity etc.). The authors van
Gurp and Palmen [189] plotted the loss angle function
δ
against the reduced complex
modulus G*/G
N
o
for several families of model branched polymers (stars, combs and
H-shaped) and mPEs and found that branched polymers usually show a character-
istic inflexion point, not shown by their linear counterparts, defined by the coordinates
δ
c
and G*
c
. We plotted this function for some of the polymers examined here (Fig.
20). We included creep data at low frequencies and the results obtained for a LDPE
as an example of a highly branched polymer [190]. A sudden ‘bump’ in the
δ
function
can be observed at a characteristic value of G*
c
for each polymer. It can be seen
Unauthenticated
Download Date | 5/5/16 2:50 PM
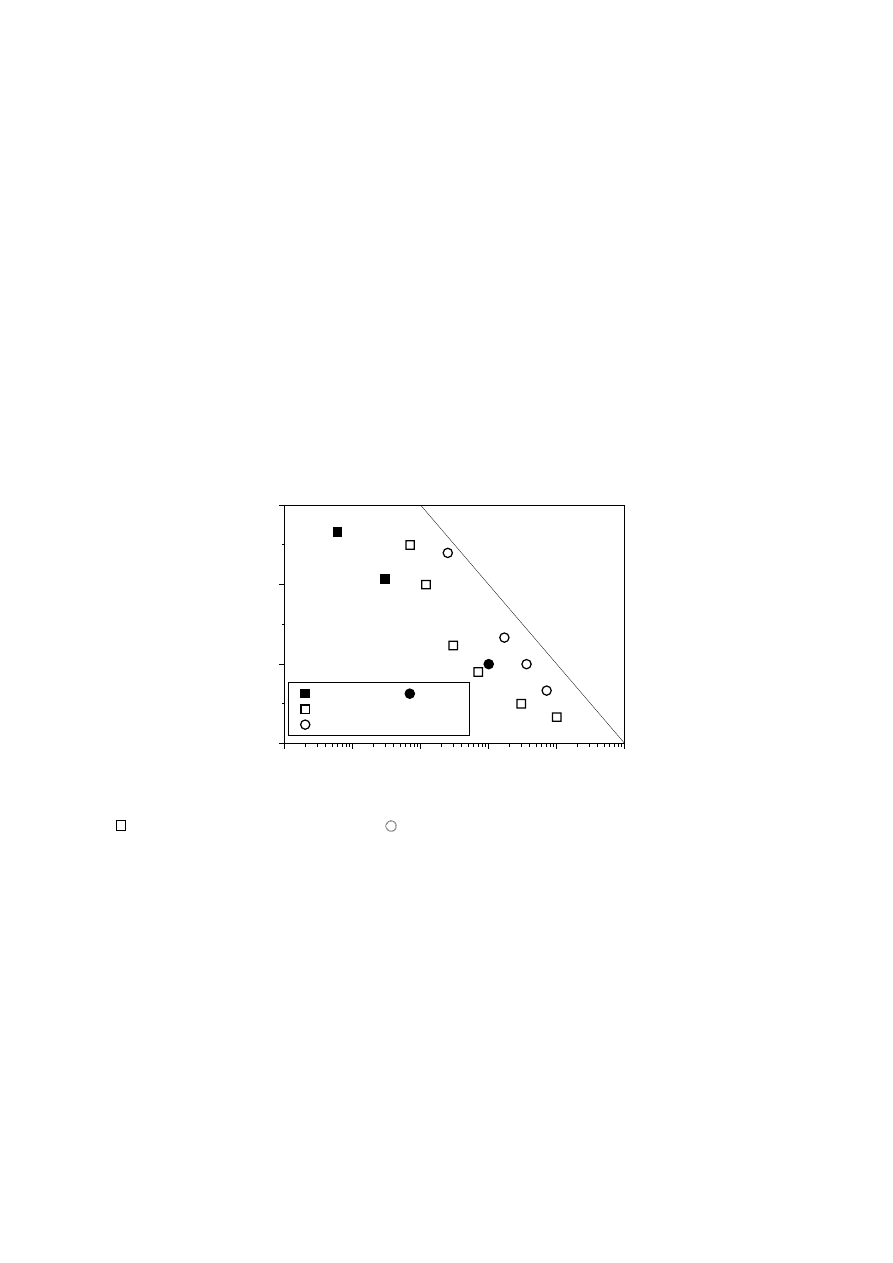
28
from the branching contents in Tab. 5 that increased branching leads to a decrease
in the coordinate
δ
c
. The materials present an enhanced elastic character (lower
values of
δ
) and a broader transition between the terminal (
δ
= 90°) and plateau
zones (
δ
= 0°) than that predicted for a linear polymer of the same MWD (solid line).
As discussed in Figs. 12 and 13, this result suggests a relaxation mechanism linked
to the presence of long branches.
The systematic study of these coordinates in model branched polymers and
branched mPEs allowed Trinkle and co-workers to construct a topology map in which
characteristic branched morphologies are assigned to different areas, as represented
in Fig. 21. We plotted the results obtained for our materials along with published data
for linear and branched polymer blends
[188] and branched mPEs [138]. All the
materials were found to occupy the section corresponding to combs and diluted
branched polymers, thus they are mixtures of linear and branched molecules. Note
that the calculated values of
δ
c
for our materials are lower than those corresponding
to the polymers and blends studied by Trinkle and co-workers. This difference is
probably attributable to the heterogeneous MWD and branching structure of our
materials.
Fig. 21.
LCB topology map
[188]. ( ) Chromium-based PEs, (z) LDPE [190],
( ) linear/branched blends
[188], ( ) branched mPEs [138]
General conclusions
The aim of this review was to present rheological testing as a powerful tool for
characterising polymeric materials. Indeed, the viscoelastic response of polymers has
been long explored by rheological measurements, since these properties are directly
connected to molecular structure and architecture.
Particular efforts were made to obtain experimental results for model and conven-
tional polyolefins and to interpret these data according to the phenomena that take
place at the molecular level. In general, we were able to observe good agreement
between experimental data and curves representing phenomenological and theo-
retical equations for linear polymers. However, we focused our interest on long chain
branching, and noted a profound effect of these structures on the viscoelastic
response. Materials with a substantial amount of long chain branching show exten-
sive effects of this factor on general features like viscosity function, elastic character
10
-5
10
-4
10
-3
10
-2
10
-1
10
0
0
30
60
90
combs
highly entangled
Diluted LCB
H-shaped
stars
TR210, PE222
LDPE
Linear/branched blends
branched mPEs
δ
c
/
º
G*
c
Unauthenticated
Download Date | 5/5/16 2:50 PM

29
and activation energy of flow. Results from the literature suggest that the effect of
polydispersity on these variables could be very similar to that predicted by the
presence of LCB. Notwithstanding, the effects of long chain branching seem to be
stronger than those due to polydispersity for a given molecular weight. Simple
molecular relaxation models developed for linear polydisperse polymers are unable
to explain the whole viscoelastic response in the presence of long chain branching.
Several relaxation processes appear as a consequence of long chain branching:
slower terminal relaxation behaviour than that shown by linear counterparts and
faster additional branch relaxation (or ‘gel-like’ behaviour!) at higher frequencies, both
clearly distinguishable from polydispersity effects.
The quantitative measure of LCB density from limited viscoelastic data and molecular
characteristics is proposed as a power tool to explain the rheological features of
different polymers, but the system fails when results are compared with measured
values of LCB density in model polymers. It is worth mentioning that the most current
view of the problem indicates that branch number contributes less to rheological
behaviour than the topology of the branched polymer. Thus, branch position and
architecture along the main polymer chain are the main factors controlling rheology.
Acknowledgement:
Thanks are due to the CICYT (Grant MAT99-1053) for financial
support.
[1] Fawcett, E. W.; Gibson, R. O.; J. Chem. Soc. 1934, 386; British Patent no. 43159,
1937
.
[2] Roedel, M.; J. Am. Chem. Soc. 1953, 75, 6110.
[3] Rudin, A.; Schreiber, H. P.; J. Polym. Sci. 1960, 44, 261.
[4] Boghetich, L.; Krantz, R. F.; Trans. Soc. Rheol. 1965, 9, 255.
[5] Gillet, J. E.; Combs, R. L.; Slonaker, D.-F.; Weemes, D. A.; Coover, H. W., Jr.; J.
Appl. Polym. Sci. 1965, 9, 767.
[6] Combs. R. L.; Slonaker, D. F. C.; Coover, H. W., Jr.; J. Appl. Polym. Sci. 1969,
14, 519.
[7] Mendelson, R. A.; Bowles, W. A.; Finger, F. L.; J. Polym. Sci., Polym. Phys. Ed.
1970
, 8, 105.
[8] Han, C. D.; Yu, T.; Kim, K. V.; J. Appl. Polym. Sci. 1971, 15, 1149.
[9] Miltz, J.; Ram, A.; Polymer 1971, 12, 685.
[10] Locati, G.; Gargani, L.; Proc. 7
th
Int. Congr. Rheol. 1976, 520.
[11] Bohdanecky, M.; Macromolecules 1977, 10, 971.
[12] Graessley, W. W.; Acc. Chem. Res. 1977, 10, 332.
[13] Han, C. D.; Villamizar, C.; J. Appl. Polym. Sci. 1978, 22, 1847.
[14] Shroff, R.; Shida, M.; J. Appl. Polym. Sci. 1981, 26, 1847.
[15] Penticolas, W. L.; Watkins, J.; J. Am. Chem. Soc. 1957, 79, 5083.
[16] Ram, A.; Polym. Eng. Sci. 1977, 17, 793.
[17] Jacovic, M. S.; Pollock, D.; Porter, R. S.; J. Appl. Polym. Sci. 1979, 23, 517.
Unauthenticated
Download Date | 5/5/16 2:50 PM

30
[18] Tung, L. H.; J. Polym. Sci. 1960, 46, 409.
[19] Aggarwal, S. L.; Marker, L.; Caarrano, M. J.; J. Appl. Polym. Sci. 1960, 3, 77.
[20] Sabia, R.; J. Appl. Polym. Sci. 1964, 8, 1651.
[21] Mendelson, R. A.; Trans. Soc. Rheol. 1965, 9, 53.
[22] Seminov, V.; Adv. Polym. Sci. 1969, 5, 387.
[23] Verser, D. W.; Maxwell, B.; Polym. Eng. Sci. 1976, 10, 122.
[24] Starck, P.; Lindberg, J.; Angew. Makromol. Chem. 1979, 75, 1.
[25] Graessley, W. W.; Macromolecules 1981, 15, 1164.
[26] Laun, H. M.; Prog. Colloid Polym. Sci. 1987, 75, 111.
[27] Mavridis, H.; Shroff, R. N.; Polym. Eng. Sci. 1992, 32, 1778.
[28] Wang, J. S.; Porter, R. S.; Rheol. Acta 1995, 34, 496.
[29] Hatzikiriakos, S. G.; Polym. Eng. Sci. 2000, 40, 2279.
[30] Wild, L.; Ranganath, R.; Ryle, T.; Polym. Prepr. (ACS Div. Polym. Chem.) 1971,
12, 266.
[31] Pedersen, S.; Ram, A.; Polym. Eng. Sci. 1978, 18, 990.
[32] Han, C. D; Polym. Eng. Rev. 1981, 1, 364.
[33] Laun, H. M.; Münstedt, H. M.; Rheol. Acta 1976, 15, 517.
[34] Laun, H. M.; Münstedt, H. M.; Rheol. Acta 1978, 17, 415.
[35] Laun, H. M.; Münstedt, H. M.; Rheol. Acta 1979, 18, 492.
[36] Münstedt, H.; J. Rheol. 1980, 24, 847.
[37] Münstedt, H.; Laun, H. M.; J. Rheol. 1981, 20, 211.
[38] Laun, H. M.; Schuch, H.; J. Rheol. 1989, 33, 119.
[39] Münstedt, H. M.; Kurzbeck, S.; Egersdofer, L.; Rheol. Acta 1998, 37, 31.
[40] Zimm, B. H.; Stockmayer, W. H.; J. Chem. Phys. 1949, 17, 1301.
[41] Mirabella, F. M., Jr.; Wild, L.; in “Polymer Characterization: Physical Property,
Spectroscopic and Chromatographic Methods”, Craver, C. D.; Prover, T.; Eds.; Adv.
Chem. Ser. 227, American Chemical Society, Washington DC 1990.
[42] Pang, S.; Rudin, A.; Polym. Mater. Sci. Eng. 1991, 65, 95.
[43] Mendelson, R. A.; J. Appl. Polym. Sci. 1970, 8, 105.
[44] Chartoff, R. P.; Maxwell, A.; J. Polym. Sci.: Phys. Ed. 1970, 8, 455.
[45] Rideal, G. R.; Padget, J. C.; J. Polym. Sci., Symp. 1976, 57, 1.
[46] Wild, L.; Ranganath, R.; Knobeloch, D. C.; Polym. Eng. Sci. 1976, 16, 811.
[47] Bersted, B. H.; Slee, J. D.; Ritchter, C. A.; J. Appl. Polym. Sci. 1981, 26, 1001.
[48] Hughes, J. K.; SPE ANTEC Technol. Papers 1983, 29, 306.
[49] Agarwal, R.; Horsk, J.; Stejskal, J.; Quadrat, O.; Kratochvil, P.; J. Appl. Polym.
Sci. 1983, 28, 3453.
[50] Bersted, B. H.; J. Appl. Polym. Sci. 1985, 30, 3751.
[51] Koopmans, R. J.; Polym. Eng. Sci. 1992, 32, 1741.
[52] Mavridis, H.; Shroff, R.; J. Appl. Polym. Sci. 1993, 49, 299.
Unauthenticated
Download Date | 5/5/16 2:50 PM

31
[53] Lachtermacher, M. G.; Rudin, A.; J. Appl. Polym. Sci. 1995, 58, 2483.
[54] Shroff, R.; Mavridis, H.; J. Appl. Polym. Sci. 1995, 57, 1605.
[55] Lucelli, E.; Locatelli, L.; Cacianotti, L.; Morelli, G. B.; “Investigation of induced
branching in polyethylenes through rheometry”, DSM Research Symposium
‘Rheology/Chain Structure Relationship in Polymers’; May 14 - 15; Newton Institute,
Cambridge 1996.
[56] Harlin, A.; Heino, E. L.; J. Polym. Sci., Part B: Polym. Phys. 1995, 33, 479.
[57] Hingmann, R.; Marczinke, B. L.; J. Rheol. 1994, 38, 573.
[58] Yoshii, F.; Makuuchi, K.; Kikukawa, S.; Tanaka, T.; Saitoh, J.; Koyama, K.; J.
Appl. Polym. Sci. 1996, 60, 617.
[59] Kurzbeck, S.; Oster, F.; Münstedt, H.; J. Rheol. 1998, 43, 359.
[60] Tung, L. H.; J. Polym. Sci. 1959, 36, 287.
[61] Hogan, J. P.; Levett, C. T.; Werkman, R. T.; SPE J. 1967, 23, 87.
[62] Drott, E. E.; Mendelson, R. A.; Polym. Prepr. (ACS Div. Polym. Chem.) 1971, 12,
277.
[63] Servotte, A.; DeBruille, R.; Makromol. Chem. 1975, 176, 203.
[64] Long, V. C.; Berry, G. C.; Hobbs, L. M.; Polymer 1964, 3, 517.
[65] Gruver, J. T.; Kraus, G. J.; J. Polym. Sci., Part A-2 1964, 2, 8598.
[66] Krauss, G.; Gruver, T.; J. Polym. Sci., Polym. Chem. Ed. 1965, 3, 105.
[67] Ghijsels, A.; Mieras, H.
J.
M.
A.; J. Polym. Sci., Polym. Phys. Ed. 1973, 11, 1849.
[68] Graessley, W. W.; Masuda, T.; Roovers, J. E. L.; Hadjichristidis, N.; Macro-
molecules 1976, 9, 127.
[69] Graessley, W. W.; Roovers, J.; Macromolecules 1979, 12, 959.
[70] Roovers, J.; Graessley, W. W.; Macromolecules 1981, 14, 766.
[71] Raju, V. R.; Rachapudy, H.; Graessley, W. W.; J. Polym. Sci., Polym. Phys. Ed.
1979
, 17, 1183.
[72] Carella, J. M.; Gotro, J. T.; Graessley, W. W.; Macromolecules 1986, 19, 659.
[73] Fetters, L. J.; Kiss, A. D.; Pearson, D. S.; Quack, G. F.; Vitus, F. J.; Macro-
molecules 1993, 26, 647.
[74] Graessley, W. W.; Raju, V. R.; J. Polym. Sci., Polym. Symp. 1984, 71, 77.
[75] Struglinski, M. J.; Graessley, W. W.; Macromolecules 1988, 21, 783.
[76] Roovers, J.; Polymer 1985, 26, 1091.
[77] Jordan, E. A.; Donald, A. M.; Fetters, L. J.; Klein, L. J.; Polym. Prepr. (ACS Div.
Polym. Chem.) 1989, 30, 63.
[78] Gell, C. B.; Graessley, W. W.; Efstratiadis, V.; Pitsikalis, M.; Hadjichristidis, N.; J.
Polym. Sci., Part B: Polym. Phys. 1997, 35, 1943.
[79] Kasehagen, L. J.; Macosko, C. W.; Trowbridge, D.; Magnus, F.; J. Rheol. 1996,
40, 689.
[80] Bero, C. A.; Roland, C. M.; Macromolecules 1996, 29, 1562.
[81] Münstedt, H.; Gabriel, C.; Hepperle, J.; 72
nd
Annual Meeting of the Society of
Rheology, Hilton Head Island, South California, February 11 - 15, 2001.
Unauthenticated
Download Date | 5/5/16 2:50 PM

32
[82] Doi, M.; Kuzuu, N. Y.; J. Polym. Sci., Polym. Lett. Ed. 1980, 18, 775.
[83] Pearson, D. S.; Helfland, E.; Macromolecules 1984, 17, 888.
[84] McLeish, T. C. B.; Europhys. Lett. 1988, B6, 511.
[85] McLeish, T. C. B.; Macromolecules 1988, 21, 1962.
[86] Ball, R. C.; McLeish, T. C. B.; Macromolecules 1989, 22, 1911.
[87] Milner, S.; McLeish, T. C. B.; Macromolecules 1997, 30, 2159.
[88] Milner, S.; McLeish, T. C. B.; Phys. Rev. Lett. 1998, 81, 725.
[89] McLeish, T. C. B.; Allgaier, J.; Bick, D. K.; Bishko, G.; Biswas, P.; Blackwell, R.;
Blottiere, B.; Clarke, N.; Gibbs, B.; Groves, D. J.; Hakiki, A.; Heenan, R. K.; Johnson,
J. M.; Kant, R.; Read, D. J.; Young, R. N.; Macromolecules 1999, 32, 6734.
[90] de Gennes, P. G.; “Scaling Concept In Polymer Physics”, Cornell University
Press, Ithaca, New York 1979.
[91] Doi, M.; Edwards, S. F.; “The Theory of Polymer Dynamics”, Clarendon Press,
Oxford 1986.
[92] Doi, M.; “Introduction to Polymer Physics”, Clarendon Press, Oxford 1996.
[93] Han, C.
D.; “Rheology in Polymer Processing”, Academic Press, New York 1976.
[94] Ferry, J. D.; “Viscoelastic Properties of Polymers”, J. Wiley and Sons, New York
1980
.
[95]
Dealy, J. M.; Wissburn, K. F.; “Melt Rheology and Its Role in Plastics
Processing: Theory and Applications”, Van Nostrand Reinhold, New York 1989.
[96] Graessley, W. W; Adv. Polym. Sci. 1974, 16, 1.
[97] Zeichner, G. R.; Patel, P. D.; Proc. 2
nd
World Congress of Chemical Engi-
neering, Montreal 1981, 333.
[98] Han, C. D.; Lem, K. W.; Polym. Eng. Rev. 1982, 2, 135.
[99] Zeichner, G. R.; Macosko, C. W.; SPE ANTEC Tech. Papers 1982, 28, 79.
[100] Harrel, E. R.; Nakajima, N.; J. Appl. Polym. Sci. 1984, 29, 995.
[101] Pucci, M. S.; Shroff, R. N.; Polym. Eng. Sci. 1986, 26, 569.
[102] Graessley, W. W.; “Physical Properties of Polymers”, J. E. Mark et al., Eds.;
ACS, Washington D.C., 1993.
[103] Yoo, H. J.; SPE ANTEC Tech. Papers 1993, 39, 3037.
[104] Graessley, W. W.; J. Chem. Phys. 1967, 47, 1942.
[105] Prest, W. M.; Porter, R. S.; Polym. J. 1973, 4, 154.
[106] Montfort, J. P.; Polymer 1976, 17, 157.
[107] Montfort, J. P.; Marin, G.; Arman, J.; Monge, P.; Polymer 1978, 19, 277.
[108] Struglinski, M. J.; Graessley, W. W.; Macromolecules 1985, 18, 2630.
[109] Zang, Y. H.; Miller, R.; Froelich, D.; Polymer 1987, 28, 1577.
[110] Berger, L.; Meissner, J.; Rheol. Acta 1992, 31, 63.
[111] Kazatchkov, I. B.; Bohnet, M.; Goyal, S. K.; Hatzikiriakos, S. G.; Polym. Eng.
Sci. 1999, 39, 804.
[112] Sasaki, T.; Ebara, T.; Johojo, H.; Polym. Adv. Technol. 1993, 4, 406.
Unauthenticated
Download Date | 5/5/16 2:50 PM

33
[113] Guypot, A.; Böhm, L.; Sasaki, T.; Zucchini, U.; Karol, F.; Hattori, Y.; Makromol.
Chem., Macromol. Symp. 1993, 66, 311.
[114] Garbassi, F.; Gila, L.; Proto, A.; Polym. News 1994, 19, 367.
[115] Batistini, A.; Macomol. Symp. 1995, 100, 137.
[116] Díaz-Barrios, A.; Méndez, R.; Becker, Y.; Joskowicz, P.; Perfetti, J. C.; Latin.
Am. Appl. Res. 1996, 26, 49.
[117] Soga, K.; Macromol. Symp. 1996, 101, 281.
[118] Todo, A.; Kashiva, N.; Macromol. Symp. 1996, 11, 301.
[119] Burkhard, T. J.; Murata, M.; Brandley, W. B.; US Patent 5240894, 1993.
[120] Lai, S.
Y.; Wilson, J.
R.; Knight, G.
W.; Stevens, J.
C.; US Patent no. 5,272,236,
1993
; US Patent no. 5,278,272, 1994.
[121] Michiels, W.; Lafuente, P.; Muñoz-Escalona, A.; Hidalgo, S.; Sancho, J.,
Méndez, L.; US Patent no. 5,824,620, 1998.
[122] Benedikt, G. M.; Gooball, B. L.; Eds.; “Metallocene-Catalyzed Polymers:
Materials, Properties, Processing and Markets”, Plastics Design Library, New York
1998
.
[123] Schwank, D.; Modern Plastics 1993, August, 40.
[124] Knight, G. W.; Lai, S.; VIII International Polyolefins Congress, SPE RETEC,
February 21 - 24, 1993.
[125] Lai, S.; Knight, G. W.; SPE ANTEC Tech. Papers 1993, 39, 1188.
[126] Story, B. A.; Knight, G. W.; “The New Family of Polyolefins from INSITE*
Technology”, Catalyst Consultant Inc. MetCon’93, May 26 - 28, 1993.
[127] Lai, S.; Plumbey, T. A.; Butler, T. I.; Knight, G. W.; Kao, C. I.; SPE ANTEC
Tech. Papers 1994, 40, 1814.
[128] Chum, P. S.; Kao, C. I.; Knight, G. W.; Plastics Engineering 1995, June, 21.
[129] Chum, Y. S.; Chung, C. I.; SPE ANTEC Tech. Papers 1995, 41, 1112.
[130] Kim, Y. S.; Chung, C. I.; Lai, Y.; Hyun, K. S.; Korean J. of Chem. Eng. 1996,
13, 294.
[131] Kim, Y.
S.; Chung, C.
I.; Lai, Y.; Hyun, K.
S.; J. Appl. Polym. Sci. 1996, 59, 125.
[132] Vega, J. F.; Muñoz-Escalona, A.; Santamaría, A.; Muñoz, E.; Lafuente, P.;
Macromolecules 1996, 29, 96.
[133] Carella, J. M.; Macromolecules 1996, 28, 8280.
[134] Hatzikiriakos, S. G.; Kazatchkov, I. B.; J. Rheol. 1997, 41, 1299.
[135] Vega, J. F.; Santamaría, A.; Muñoz-Escalona, A.; Lafuente, P.; Macromole-
cules 1998, 312, 3639.
[136] Malmberg, A.; Kokko, E.; Lehmus, P.; Löfgren, B.; Seppälä, J. V.; Macro-
molecules 1998, 31, 8448.
[137] Fernández M.; Vega, J. F.; Peña, J.; Santamaría, A.; 33éme Colloque Annuel
du Groupe Français de Rhéologie, Biarritz, France 1998; Les Cahiers de Rhéologie
1998
, XVII(I), 369.
[138] Vega, J. F.; Fernández, M.; Santamaría, A.; Muñoz-Escalona, A.; Lafuente, P.;
Macromol. Chem. Phys. 1999, 20, 2257.
Unauthenticated
Download Date | 5/5/16 2:50 PM

34
[139] Malmberg, A.; Liimatta, J.; Lehtinen, A.; Löfgren, B.; Macromolecules
1999, 32,
6687.
[140] Muñoz-Escalona, A.; Lafuente, P.; Vega, J. F.; Santamaría, A.; Polym. Eng.
Sci. 1999, 39, 2292.
[141] Santamaría, A.; Fernández, M.; Vega, J. F.; Muñoz-Escalona, A.; 2nd Inter-
national Symposium on Rheology, ‘Chain Structure Relationships in Polymers’,
Amsterdam 1999.
[142] Shroff, R. N.; Mavridis, H.; Macromolecules 1999, 32, 8454.
[143] Yan, D.; Wang, W. J.; Zhu, S.; Polymer 1999, 40, 1737.
[144] Fernández, M.; Vega, J. F.; Santamaría, A.; Muñoz-Escalona, A.; Lafuente, P.;
Macromol. Rapid. Commun. 2000, 21, 973.
[145] Bin Wadud, S. E.; Baird, D. G.; J. Rheol. 2000, 44, 1151.
[146] Santamaría, A.; Vega, J. F.; Muñoz-Escalona, A.; Lafuente, P.; Macromol.
Symp. 2000, 152, 15.
[147] Wood-Adams, P. M.; Dealy, J. M.; Macromolecules 2000, 33, 7481.
[148] Wood-Adams, P. M.; Dealy, J. M.; deGroot, A. W.; Redwine, O. D.; Macromole-
cules 2000, 33, 7489.
[149] Wood-Adams, P.; J. Rheol. 2001, 45, 203.
[150] Aguilar, M.; Vega, J. F.; Sanz, E.; Martínez-Salazar, J.; Polymer 2001, 42,
9713.
[151] Kokko, E.; Malmberg, A; Lehmus, P.; Löfgren, B; Seppälä, J. V.; J. Polym. Sci.,
Part. A: Polym. Chem. 2000, 38, 376.
[152] Walter, P.; Trinkle, S.; Suhn, J.; Mäder, D.; Friedrich, C.; Mülhaupt, R.;
Macromol. Chem. Phys. 2000, 201, 604.
[153] Wood-Addams, P; Cousteux, S.; Macromolecules 2001, 34, 6828.
[154] Starck, P; Malmberg, A.; Löfgren, B.; J. Appl. Polym. Sci. 2002, 83, 1140.
[155] Malmberg, A; Grabiel, C.; Strffl, T.; Münstedt, H.; Löfgren, B.; Macromolecules
2002
, 35, 1038.
[156] Soares, J. B.; Hamielec, A. E.; in “Metallocene-Catalyzed Polymers: Materials,
Properties, Processing and Markets”, Plastics Design Library, New York 1998.
[157] Nakajima, N.; Applied Rheology 1999, May/June, 116.
[158] Janzen, J.; Colby, R. H.; J. Macromol. Struct. 1999, 485-486, 569.
[159] Lusignan, C.
P.; Mourey, T.
H.; Woilson, J.
C.; Colby, R.
H.; Phys Rev. E 1995,
52, 6271.
[160] Lusignan, C.
P.; Mourey, T.
H.; Woilson, J.
C.; Colby, R.
H.; Phys Rev. E 1999,
60, 5657.
[161] Wasserman, S. H.; Graessley, W. W.; Polym. Eng. Sci. 1996, 6, 852.
[162] Shaw, M. T.; Tuminello, W. H.; Polym. Eng. Sci. 1994, 34, 159.
[163] McLeish, T. C. B.; Larson, R. G.; J. Rheol. 1998, 42, 81.
[164] Inkson, N. J.; McLeish, T. C. B.; Harlen, O. G.; Groves, D. J.; J. Rheol. 1999,
43, 873.
[165] Larson, R. G.; Macromolecules 2001, 34, 4556.
Unauthenticated
Download Date | 5/5/16 2:50 PM

35
[166] Meissner, J.; Makromol. Chem., Macromol. Symp. 1992, 56, 25.
[167] Kraft, M.; Meissner, J.; Kaschta, J.; Macromolecules 1999, 32, 751.
[168] Doi, M.; J. Polym. Sci., Lett. 1981, 19, 265.
[169] Doi, M. ; J. Polym. Sci., Polym. Phys. Ed. 1983, 21, 667.
[170] Wendel, H.; Colloid Polym. Sci. 1981, 259, 908.
[171] Locati, G.; Gargani, L.; J. Polym. Sci., Polym. Lett. Ed. 1973, 11, 95.
[172] Utracki, L. A.; Schlund, B.; Polym. Eng. Sci. 1987, 27, 1512.
[173] Peón, J.; Vega, J. F.; Aroca, M.; Martínez-Salazar, J.; Polymer 2001, 42, 8093.
[174] Grabiel, C.; Münstedt, H.; Rheol. Acta 2002, 41, 232.
[175] Koopmans, R. J.; SPE ANTEC Technol. Papers 1997, 43, 1006.
[176] Zárraga, A.; Peña, J. J.; Muñoz, M. E.; Santamaría, A.; J. Polym. Sci., Part B:
Polym. Phys. 2000, 38, 469.
[177] Vega, J. F.; Martínez-Salazar, J.; private communication, 2002.
[178] García-Franco, C. A.; Srinivas, S.; Lohse, D. J.; Brant, P.; Macromolecules
2001
, 34, 3115.
[179] Chambon, F.; Winter, H. H.; Polym. Bull. 1985, 13, 499.
[180] Winter, H. H.; Chambon, F.; J. Rheol. 1986, 30, 367.
[181] Chambon, F.; Winter, H. H.; J Rheol. 1987, 31, 683.
[182] Winter, H. H.; Polym. Eng. Sci. 1987, 27, 1698.
[183] Tuminello, W. H.; Annual Meeting of The Society of Rheology, Madison
(Wisconsin), October 1999.
[184] Llorens, J.; Rude, E.; Marcos, R. M.; J. Polym. Sci., Part. B: Polym. Phys.
2000
, 38, 1539.
[185] Carrot, C.; Guillet, J.; J. Rheol. 1997, 42, 1203.
[186] Arnett, R. L.; Thomas, C. P.; J. Phys. Chem. 1980, 84, 649.
[187] Tsenoglou, C. J.; Gotsis, A. D.; Macromolecules 2001, 34, 4685.
[188] Trinkle, S.; Walter, P.; Friedrich, C.; Rheol. Acta 2002, 41,103.
[189] van Gurp, M.; Palmen, J.; Rheology Bulletin 1998, 67, 5.
[190] Vega, J. F.; Martínez-Salazar, J.; to be published.
Unauthenticated
Download Date | 5/5/16 2:50 PM
Wyszukiwarka
Podobne podstrony:
4 effects of honed cylinder art Nieznany
Effect of Active Muscle Forces Nieznany
Effects Of 20 H Rule And Shield Nieznany
Effect of Kinesio taping on muscle strength in athletes
53 755 765 Effect of Microstructural Homogenity on Mechanical and Thermal Fatique
Effect of File Sharing on Record Sales March2004
31 411 423 Effect of EAF and ESR Technologies on the Yield of Alloying Elements
21 269 287 Effect of Niobium and Vanadium as an Alloying Elements in Tool Steels
Impact of opiate addiction on n Nieznany
(10)Bactericidal Effect of Silver Nanoparticles
Effect of?renaline on survival in out of hospital?rdiac arrest
Effects of the Great?pression on the U S and the World
Effects of the Atomic Bombs Dropped on Japan
Effect of aqueous extract
Integration of the blaupunkt RC Nieznany
Effects of Kinesio Tape to Reduce Hand Edema in Acute Stroke
1 Effect of Self Weight on a Cantilever Beam
więcej podobnych podstron