
Copyright 2003 AADE Technical Conference
This paper was prepared for presentation at the AADE 2003 National Technology Conference “Practical Solutions for Drilling Challenges”, held at the Radisson Astrodome Houston, Texas, April 1 - 3,
2003 in Houston, Texas. This conference was hosted by the Houston Chapter of the American Association of Drilling Engineers. The information presented in this paper does not reflect any position,
claim or endorsement made or implied by the American Association of Drilling Engineers, their officers or members. Questions concerning the content of this paper should be directed to the individuals
listed as author/s of this work.
Abstract
Drilling fluid yield stress has been embraced by the
industry as a key rheological parameter for evaluating
hole cleaning, barite sag, equivalent circulating density,
surge/swab pressures, and other drilling concerns.
Because this parameter is particularly difficult to quantify
with standard field and lab viscometers, different
conventional measurements and regression-analysis
techniques routinely are used to approximate the true
yield stress. This paper presents results from a study
conducted to determine the most appropriate option in
order to promote standardization within the industry.
The study focused on yield-stress measurements using
a vane rheometer and statistical analysis of nearly
50,000 mud reports. A wide range of water, oil, and
synthetic-based field muds was involved. Results were
encouraging, but not entirely conclusive. Inconsistencies
with vane-rheometer measurements, especially with the
oil-based muds tested, indicate that refinement of the
technique is in order. However, there was enough
evidence to propose that the low-shear yield point
(LSYP) is the most suitable alternate for yield stress
using standard viscometers until more definitive
correlations suggest otherwise.
Introduction
Drilling fluids, both aqueous and non-aqueous, exhibit
complex non-Newtonian rheological behavior. The yield
stress is a key rheological parameter that the drilling
industry has recognized as critical to the performance of
drillings fluids. Hole cleaning, barite sag, equivalent
circulating density, surge and swab pressures, and other
important drilling issues are impacted directly by the
yield-stress characteristics. Successful completion of
challenging wells, especially deepwater, high-
temperature / high-pressure, and other narrow-margin
wells, can be compromised unless yield-stress values
are measured consistently and managed properly.
The yield stress can best be described as the stress that
must be applied to a material to initiate flow. If the
applied stress is below the yield stress, then the fluid will
display strain recovery when the stress is removed.
Once the yield stress has been exceeded, the fluid
displays viscous flow characteristics.
Previous work
1
highlighted both the importance of yield
stress and difficulties encountered in determining this
value, whether via direct measurement, extrapolation, or
curve fitting. Most advanced hydraulics models rely on
Herschel-Bulkley-type rheological models that incor-
porate a yield-stress term and consider shear-thinning
behavior. Conventional Couette viscometers used at the
wellsite and in the laboratory are ideal instruments
2
for
high-shear-rate measurements where fluid samples are
completely sheared within the viscometer gap.
Unfortunately, fluids exhibiting yield-stress charac-
teristics may not be fully sheared in the viscometer gap
at low shear rates. This can generate misleading data
by artificially distorting the measurement geometry
through the presence of a plug-flow region.
3
Presented in this paper are results from a study
designed to determine the most appropriate option using
existing techniques and viscometer data. This would
help promote the much-needed standardization within
the industry. The study involved vane-rheometer yield-
stress measurements on various field muds in current
use, and statistical analysis of nearly 50,000 mud checks
conducted on a wide range of water-based (WBM), oil-
based (OBM), and synthetic-based (SBM) field muds.
Yield Stress
Drilling fluids are designed such that under static
conditions they are capable of suspending barite and
drill cuttings. In order for this to be possible, drilling
fluids must exhibit yield-stress behavior, or a very high
zero-shear-rate viscosity. It has been the assumption in
the drilling industry that most drilling fluids do in fact
display yield-stress characteristics, even though this
property is not measured directly. Problems often are
encountered in the field that are assumed to be related
to inadequate yield-stress properties
Traditionally, three rheological models have been
applied in drilling fluid hydraulics and rheological
analyses: Bingham plastic, power law, and yield-power
AADE-03-NTCE-35
Drilling Fluid Yield Stress: Measurement Techniques for Improved
Understanding of Critical Drilling Fluid Parameters
David Power and Mario Zamora, M-I
L.L.C.

2
D. POWER and M. ZAMORA
AADE-03-NTCE-35
law (Herschel-Bulkley). These models adequately cover
the range of yield-stress values that are encountered in
the field. The power law represents the case of zero
yield stress, while at the other end of the spectrum the
Bingham plastic model covers the case where the yield
stress (
τ
y
) equals the yield point (YP). The Herschel-
Bulkley model covers both these conditions, as well as
all cases in between. By definition, the yield stress of
drilling fluids is limited by the criteria in Eq. 1.
0 ≤
τ
y
≤ YP
(1)
Options for Determining Yield Stress
Fluid yield stress can be obtained via a number of
different routes – direct measurement, and interpolation,
and regression analysis of Fann viscometer data. The
following section discusses the merits of each method.
Ideally, the yield stress of a drilling fluid should be
measured directly, as it is a material property.
Unfortunately, standard Fann-type viscometers do not
take readings below 5.1 s
-1
shear rate, and as discussed
earlier, the accuracy of low-shear-rate measurements
can be suspect. One of the most common and simplest
yield-stress measurement techniques uses the vane
geometry rotating at very low rotary speeds. Vane
rheometers were used in this study to establish the true
yield stress. There was no intent, however, to suggest
that vane rheometers should routinely be used in the
field.
While direct measurement offers a sound approach for
determining the yield stress, the most practical option for
the drilling industry would be to use data provided by
existing viscometers. The challenge then becomes to
determine which of these data to use for the yield stress.
Experimental data generated from a vane viscometer
were used to help resolve this challenge.
Fann 35 data can be used to estimate the yield stress;
however, a number of options using these data have
been proposed by different groups over time. As
discussed in a previous publication,
1
the following
options are available for measuring reasonable, usable
values for
τ
y
:
1. Fann R
3
2. Fann R
6
3. Low-shear yield point (LSYP = 2R
3
-
R
6
)
4. “Zero” gel strength (no time delay)
5. Initial gel strength (10-sec delay)
6. 10-min gel strength (10-min delay)
The first three options are based on stabilized readings
and the last three on gel-strength-type measurements. It
could be argued at this point that LSYP is the best
choice from the first group and the initial gel strength is
the best from the second group. For cases where R
3
>
R
6
, the LSYP should be set to R
6
.
Curve-fitting techniques to determine
τ
y
are common;
however, computer processing is required to establish
the yield stress. This can be an inconvenience in the
field and detracts from the premise that
τ
y
is a material
property. Nevertheless, regression analysis can be very
useful to help identify true yield-stress values.
Three options for curve-fitting techniques include the
unweighted-average, weighted-average, and “3-point”
method. Each option requires a convergence or trial-
and-error solution. The unweighted method, as the name
implies, gives equal weight to the six standard dial
readings. This could potentially skew the true fluid
properties because of the less accurate and more
numerous low-shear-rate readings. Mathematically, the
weighted-average method
4
probably is the superior of
the three, but it is somewhat complex and requires
nontrivial software programming.
The 3-point method forces the regression curve through
R
600
, R
300
, and iteratively through one other point, as
opposed to using a least-square technique with all six
data points. This approach preserves values for PV and
YP. The additional point can be R
3
, R
6
, or the average
of R
3
and R
6
. As seen later, the 3-point method using
the R
3
and R
6
average at 4.5 rpm gives results almost
identical to the weighted-average curve fit.
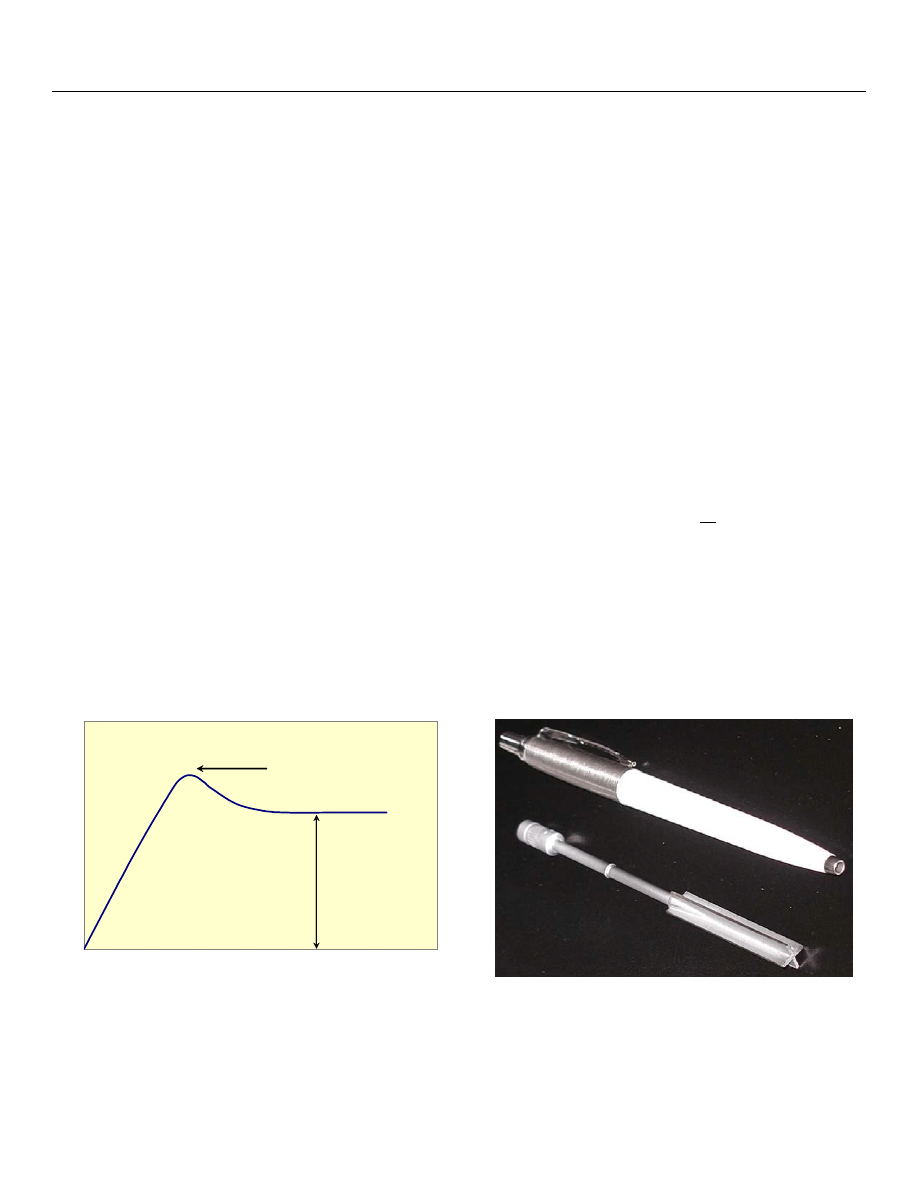
Vane Measurements
The vane-rheometer method is based on the stress
overshoot behavior associated with yielding materials.
As a solid material begins to deform plastically, a
maximum in the applied stress is observed immediately
prior to the structure of the material failing
catastrophically. Yield-stress fluids will display a
maximum in applied stress when sheared at very low
shear rates prior to flowing. A thorough discussion of
the yield stress and various measurement techniques is
given by Nguyen and Boger.
5
While the vane technique is an established method for
direct measurement of the yield stress, it has not been
widely used in the drilling fluids industry. The vane
technique is derived from stress-growth experiments
conducted in rotational viscometers. The vane, fully
immersed in a fluid, is slowly rotated until the fluid begins
to deform plastically as indicated in Fig. 1. The stress-
versus-time data for a yield-stress fluid will exhibit a
stress overshoot, with the maximum value of the stress
corresponding to the true yield stress. Though simple in
concept, the method is not straight-forward and care
should be exercised defining the experimental

AADE-03-NTCE-35 DRILLING FLUID YIELD STRESS: MEASUREMENT TECHNIQUES FOR IMPROVED UNDERSTANDING
3
OF CRITICAL DRILLING FLUID PARAMETERS
parameters. In order to remove any viscous effects, the
shear rate (proportional to the rate of rotation of the
vane) should be very low. This is particularly important
for fluids with low yield-stress values, as was evident
from the OBM data.
The advantage the vane method has over conventional
rotational devices is the fact that the vane overcomes
the wall-slip problem. The assumption is made that
when using a vane, the fluid yields across a cylindrical
surface defined by the diameter and length of the vane.
In this work, the vane was attached to a Brookfield
constant shear-rate viscometer.
The vane used in this study, shown in Fig. 2, had a
length of 43 mm and diameter of 7.5 mm. The minimum
rate of rotation for the Brookfield viscometer was 0.3
rpm, and this value was used for all tests. Further work
is required in order to assess the impact varying vane
dimensions and shear rates have on the measured yield
stress. As indicated in the OBM data, different shear
rates may be necessary when measuring the yield stress
via the vane method for fluids displaying low yield-stress
values. In this case, the viscous properties of the
material may have masked the yield-stress value and
the maximum torque value may not have been properly
detected.
Statistical Analysis
The primary goals of the statistical analysis were (a) to
narrow the potential options for determining
τ
y
, (b) to
determine
τ
y
from regression analysis, and (c) to provide
a background perspective for data obtained from the
vane rheometer. An extensive central database of
historical well records proved to be a great source of
rheological data representing how muds actually are
being run in the field.
For this study, 2,400 wells drilled over the past 5 years
were selected from the United States (Gulf of Mexico,
Louisiana, Texas, Alaska, California, Colorado, New
Mexico, Montana, Wyoming, and Utah), North Sea,
Norway, Shetland Basin, Canada, Austria, Germany,
Croatia, and Angola. In all, 48,310 wellsite mud checks
were evaluated - 12,371 SBM, 11,169 OBM, and 24,770
WBM. The large data sample made it possible to
statistically consider a wide range of drilling muds used
in an even wider range of environments.
Data of particular interest were mud type, mud weight,
temperature, YP, R
6
and R
3
readings, and 10-sec and
10-min gel strengths. Unfortunately, “zero-gel” values
were not available, so this option was categorically
eliminated from this study. Rheological parameters were
measured using Fann 35 viscometers at the wellsite at
120°F (WBMs) and 150°F (SBMs and OBMs). Two
parameters calculated from the data were LSYP and
yield-stress value based on the 3-point curve-fit method.
Much of the regression analyses focused on evaluating
the individual rheological parameters vs mud weight.
Despite the expected scatter in nearly all of the data,
conventional statistical-analysis techniques found in
Microsoft Excel were adequate to complete the analysis.
Third-order polynomial curve fits worked particularly well
and were used throughout for consistency.
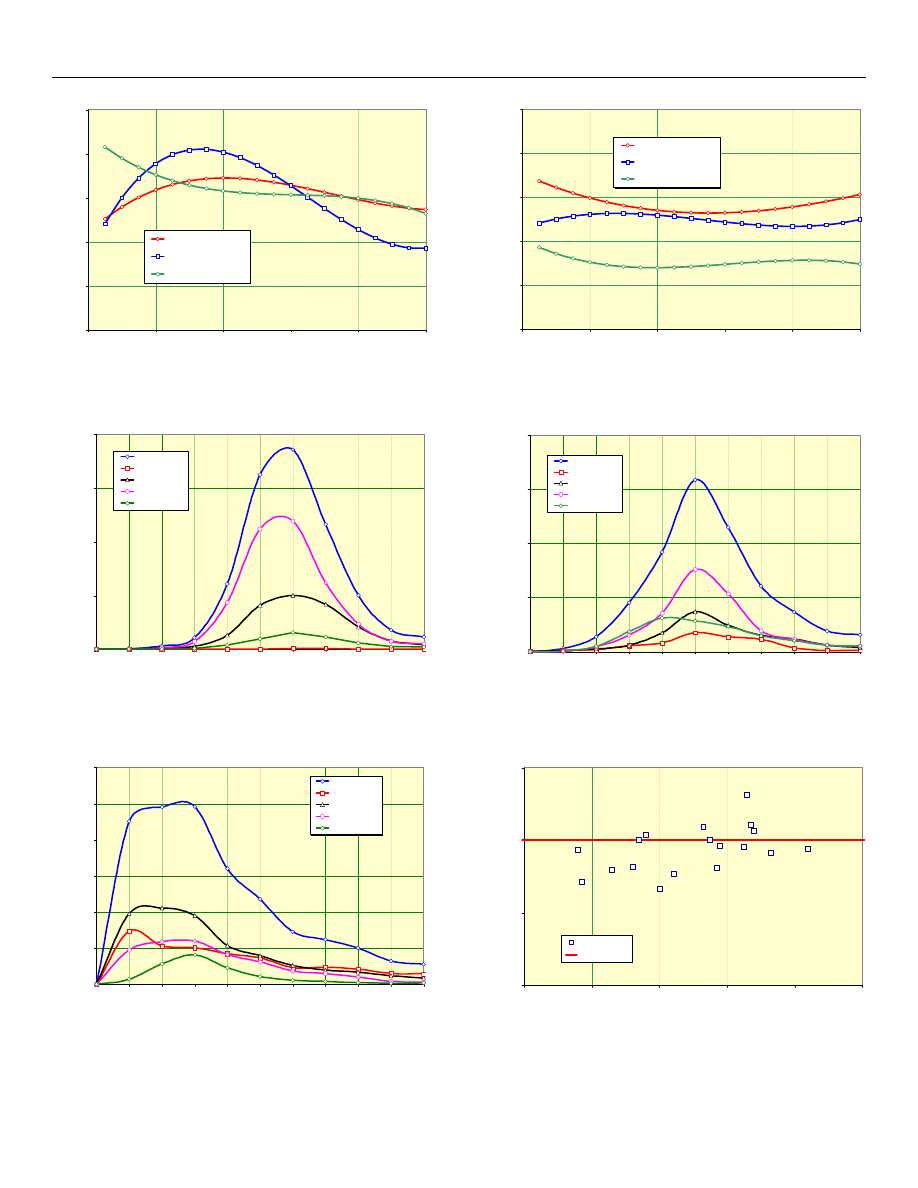
Fig. 3 shows regression analyses of YP vs mud weight
for the SBM, OBM and WBM data. In order to
“normalize” the data, it was convenient to evaluate the
parameter
τ
y
/YP, where
τ
y
could be any of the available
options for specifying the true yield stress. For example,
Fig. 4 plots this
τ
y
/YP ratio vs mud weight, where the
τ
y
values were calculated using the 3-point regression
analysis of the viscometer data. The table below
summaries averages of this ratio for the three mud data
sets:
It is noteworthy that the variations by mud type illustrated
in Figs. 3 and 4 reflect more of how and where the
different mud types were used, rather than their intrinsic
rheological characteristics. Higher yield points at lower
mud weights and lower yield points at higher mud
weights, for the most part, were generally in line with
field operations. Typically, lower weight muds are used
at shallow depths where hole cleaning is a major
concern in larger-diameter intervals. Conversely, high-
weight muds are more common at deep depths, where
elevated yield points are neither required (small holes)
nor desired (high pressure losses).
To provide better definition based on mud weight, the
data were also evaluated using frequency counts for
muds < 9.5 lb/gal, 9.5 – 12 lb/gal, 12 – 16 lb/gal, and >
16 lb/gal. The results are given for SBMs, OBMs, and
WBMs in Figs. 5 - 7, respectively. This type of analysis
tended helped minimize the dependence on the number
of mud samples in the different mud-weight ranges.
Similar correlations were developed for the other
rheological parameters. Because
τ
y
/YP ratios for the 10-
sec and 10-min gels were highly skewed above 1.0, the
two gel-strength measurements were essentially
removed from contention as alternatives for the yield
stress.
Mud Type
Minimum
τ
y
/YP
Maximum
τ
y
/YP
Curve-Fit
τ
y
/YP
SBM 0.50 0.68 0.57
OBM 0.48 0.59 0.50
WBM 0.20 0.40 0.30

4
D. POWER and M. ZAMORA
AADE-03-NTCE-35
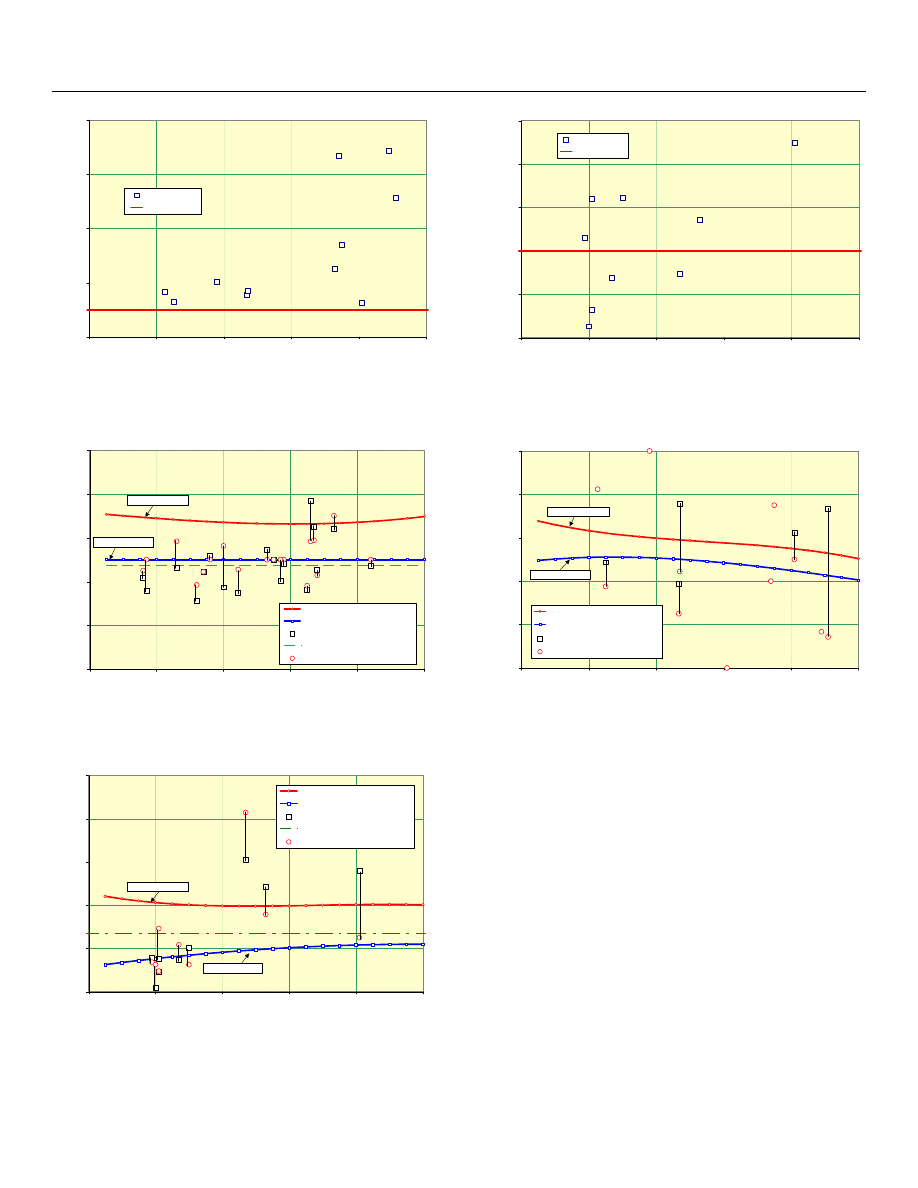
Based on the statistical analysis, R
3
and the curve-fit
τ
y
were consistently between LSYP and R
6
. This provided
the opportunity to eliminate R
3
from contention and use
R
6
and LSYP to establish the range for maximum and
minimum expected yield-stress values. Combinations of
data such as that provided in Figs. 5 – 7 were used to
establish expected minimum and maximum values of
τ
y
/YP used to contrast the measured vane viscometer
data. For WBMs, curve-fit
τ
y
values were less than the
LSYP at the lower mud weights, so the minimum curve
was adjusted accordingly.
Vane-Rheometer Results
As discussed previously, one major goal of this work
was to determine which conventional oilfield viscometer
parameter is best suited to estimate the true yield stress
of drilling fluids. As the vane method allowed direct
determination of a material property, the data from the
vane was used to establish the true yield stress of the
fluids tested. With a direct measurement of the yield
stress, indirect parameters were compared directly to the
vane yield stress.
Vane test results on the SBMs, OBMs and WBMs are
given in Tables 1 – 3, respectively. Also included are
the Fann properties and several other useful relation-
ships. Of the six methods available for determining the
yield stress using conventional oilfield viscometer data,
the LSYP appeared to offer the best correlation with data
generated using the vane. With the exception of OBMs,
ratios of the vane yield stress to the LSYP were very
close to 1.0, as indicated in Figs. 8 - 10. Fig. 8, for
example, compares the ratio of the vane yield stress to
the LSYP across a broad range of mud weights for
SBMs. These fluids in particular appeared very well
suited for approximating the yield stress by using LSYP.
The same comparison is made for OBMs and WBMs in
Figs. 9 and 10, respectively.
Further work is required on all fluid types, but problems
with OBM data indicate that more detailed analysis is
needed using a broader range of shear rates and
possibly different vane dimensions. For the OBMs, dis-
tinct maxima in the torque readings were difficult to
discern. Also, a larger vane may be required to capture
these low yield-stress values. The fact that the ratio of
measured yield stress to LSYP for the OBMs was
relatively high suggests that the shear rate used to
perform the measurement may have been excessive.
The YP, R
6
and R
3
readings of the OBMs were all
significantly lower on average than other mud systems
tested. Interestingly, the ratio of plastic viscosity to yield
point for both the SBMs and WBMs was in the range of
4.3 to 4.5, while for the OBMs, this ratio was significantly
higher (PV/YP for OBMs = 8.7) indicating the inherently
higher viscous nature of the OBMs tested.
Also in Tables 1 - 3, the correction factor of 1.066 for
Fann data was applied to all LSYP values of the fluids
tested in order to achieve constant units of lb/100 ft
2
. In
all cases, including the OBMs, the corrected LSYP
shows very good agreement with the yield stress
determined from the 3-point and weighted-average curve
fits. This analysis helped to support the recommen-
dation that the weighted average or 3-point curve-fit
methods provide the better fit for Fann 35 data
measured in the field. The 3-point method is preferred
for practical purposes, as this procedure is simpler and
provides almost exactly the same numbers as the
weighted average method.
Figs. 11 - 13 compare measured yield stress to LSYP,
both parameters normalized by dividing by the yield
point. In each case, statistical data from the 48,310 mud
reports were used to set upper and lower limits to
indicate the range where the yield stress would be
expected to fall. These limits were defined by taking the
maximum and minimum yield-stress parameters
determined using data extracted from the field database.
In the case of the SBMs, the measured data suggest an
average value of 0.47 for measured
τ
y
/YP, while the
lower boundary, defined by the LSYP, indicated a ratio
of LSYP to YP of 0.5. As discussed previously, the SBM
systems provided a good data set, with clear trends
discernable. The OBMs, on the other hand, did not
allow definitive trends to be established between
measured yield stress or LSYP. The WBM data
indicated that the normalized yield stress was much
lower, in the range of 0.27. The normalized LSYP for
these fluids showed the same average value,
strengthening the argument that the LSYP is a solid
indication of a WBM actual yield stress.
Conclusions
1. The low-shear yield point (LSYP) is the most
suitable alternative for determining drilling fluid yield
stress from industry standard Couette viscometer
data. This is based on a study involving direct
measurements using the vane technique and
statistical analysis of 48,310 mud reports.
2. Average values for the vane
τ
y
/LSYP ratio were 0.94
for SBMs and 1.09 for WBMs. Results for OBMs
were inconclusive, indicating that refinement of the
vane technique is in order. This would involve
investigation of a range of vane sizes and shear
rates.
3. The
ratio
τ
y
/YP is a useful parameter to characterize
fluids rheologically. The acceptable range of
τ
y
/YP
values is 0 – 1 for rheological models used in
drilling.
4. Statistical analysis of historical data established
reasonable correlations for the expected range of
AADE-03-NTCE-35 DRILLING FLUID YIELD STRESS: MEASUREMENT TECHNIQUES FOR IMPROVED UNDERSTANDING
5
OF CRITICAL DRILLING FLUID PARAMETERS
τ
y
/YP for different mud types: 0.50 – 0.68 for SBMs,
0.48 – 0.59 for OBMs, and 0.2 – 0.4 for WBMs.
Average values for curve-fit
τ
y
/YP were 0.57 (SBMs)
0.50 (OBMs), and 0.30 (WBMs)
5. A weighted-average technique is preferred if
regression analysis of viscometer data is used to
estimate the true yield stress. However, a simpler 3-
point method yields almost identical results and
preserves the measured values for plastic viscosity
and yield point.
Nomenclature
YP
= Bingham yield point
PV
= Bingham plastic viscosity
LSYP = low-shear yield point
R
600
= Fann shear stress at 600 rpm
R
300
= Fann shear stress at 300 rpm
R
6
= Fann shear stress at 6 rpm
R
3
= Fann shear stress at 3 rpm
τ
y
= Ty = yield stress
ECD =
equivalent
circulation
density
SBM =
synthetic-based
mud
OBM =
oil-based
mud
WBM =
water-based
mud
Acknowledgments
We thank the management of M-I
L.L.C.
for support and
permission to publish this paper. Special thanks go to
Mary Dimataris from M-I L.L.C. for professionally
revising this paper.
References
1. Zamora, M. and Power, D.: “Making a Case for
AADE Hydraulics and the Unified Rheological
Model,” AADE-02-DFWM-HO-13, AADE Technical
Conference on Drilling & Completion Fluids and
Waste Management, Houston, April 2-3, 2002.
2. API RP 13D, Recommended Practice on the
Rheology and Hydraulics of Oil-Well Drilling Fluids,
3
rd
ed., American Petroleum Institute (June 1, 1995).
3. Savins, J. G. and Roper, W. F.: “A Direct-Indicating
Viscometer for Drilling Fluids,” Drilling and
Production Practices; API (1954) 7-22.
4. Klotz, J. A. and Brigham, W. E.: “To Determine
Herschel-Bulkley Coefficients,” Journal of Petroleum
Technology (November 1998) 80-81.
5. Nguyen, Q. D. and Boger, D. V.: “Measuring the
Flow Properties of Yield Stress Fluids”, Annual
Review of Fluid Mechanics, 24 (1992) 47-88.
Fig. 2: 4-blade vane used to measure yield stress – 43-
mm x 7.5-mm.
Time -->
To
rq
ue --
>
Use maximum torque
to determine Ty
Viscous
component
Fig. 1: Stress over-shoot for determining yield stress.
6
D. POWER and M. ZAMORA
AADE-03-NTCE-35
0
5
10
15
20
25
8
10
12
14
16
18
Mud Weight (lb/gal)
Ty
/ YP
Synthetic-Based Muds
Oil-Based Muds
Water-Based Muds
Fig. 3: YP vs mud weight curves based on regression analysis
of 12,371 SBM, 11,169 OBM, and 24,770 WBM mud checks.
0.0
0.2
0.4
0.6
0.8
1.0
8
10
12
14
16
18
Mud Weight (lb/gal)
T
y
/ YP
Synthetic-Based Muds
Oil-Based Muds
Water-Based Muds
Fig. 4:
τ
y
/YP vs mud weight curves where
τ
y
values are based
on 3-point curve-fitting technique.
0
1000
2000
3000
4000
0.0
0.1
0.2
0.3
0.4
0.5
0.6
0.7
0.8
0.9
1.0
Curve-Fit Ty / YP
Fr
eq
u
enc
y
All SBM
< 9.5 lb/gal
9.5 - 12 lb/gal
12 - 16 lb/gal
> 16 lb/gal
Fig. 5: Frequency chart for SBM data set.
0
1000
2000
3000
4000
0.0
0.1
0.2
0.3
0.4
0.5
0.6
0.7
0.8
0.9
1.0
Curve-Fit Ty / YP
Fr
eq
ue
n
cy
All OBM
< 9.5 lb/gal
9.5 - 12 lb/gal
12 - 16 lb/gal
> 16 lb/gal
Fig. 6: Frequency chart for OBM data set.
0
1000
2000
3000
4000
5000
6000
0.0
0.1
0.2
0.3
0.4
0.5
0.6
0.7
0.8
0.9
1.0
Curve-Fit Ty / YP
Fr
eq
u
enc
y
All WBM
< 9.5 lb/gal
9.5 - 12 lb/gal
12 - 16 lb/gal
> 16 lb/gal
Fig. 7: Frequency chart for WBM data set.
0.0
0.5
1.0
1.5
8
10
12
14
16
18
Mud Weight (lb/gal)
Ty / LSYP
SBM Ty/LSYP
Base
Fig. 8: SBM comparison of the ratio of measured yield stress
(vane) and LSYP to mud weight.
AADE-03-NTCE-35 DRILLING FLUID YIELD STRESS: MEASUREMENT TECHNIQUES FOR IMPROVED UNDERSTANDING
7
OF CRITICAL DRILLING FLUID PARAMETERS
0.0
0.2
0.4
0.6
0.8
1.0
8
10
12
14
16
18
Mud Weight (lb/gal)
Ty
/ YP
SBM Maximum Expected Ty/YP
SBM Minimum Expected Ty/YP
Vane Ty/YP
Average Vane Ty/YP
LSYP/YP
Maximum Expected
Minimum Expected
Fig. 11: SBM vane yield stress-yield point ratio as a function of
mud weight.
0.0
0.2
0.4
0.6
0.8
1.0
8
10
12
14
16
18
Mud Weight (lb/gal)
Ty / YP
OBM Maximum Expected Ty/YP
OBM Minimum Expected Ty/YP
Vane Ty/YP
LSYP/YP
Maximum Expected
Minimum Expected
Fig. 12: OBM vane yield stress-yield point ratio as a function of
mud weight.
0.0
0.2
0.4
0.6
0.8
1.0
8
10
12
14
16
18
Mud Weight (lb/gal)
Ty / YP
WBM Maximum Expected Ty/YP
WBM Minimum Expected Ty/YP
Vane Ty/YP
Average Vane Ty/YP
LSYP/YP
Maximum Expected
Minimum Expected
Fig. 13: WBM vane yield stress-yield point ratio as a function
of mud weight.
0.0
2.0
4.0
6.0
8.0
8
10
12
14
16
18
Mud Weight (lb/gal)
Ty / LSYP
OBM Ty/LSYP
Base
Fig. 9: OBM comparison of the ratio of measured yield stress
(vane) and LSYP to mud weight.
0.0
0.5
1.0
1.5
2.0
2.5
8
10
12
14
16
18
Mud Weight (lb/gal)
Ty / LSYP
WBM Ty/LSYP
Base
Fig. 10: WBM comparison of the ratio of measured yield stress
(vane) and LSYP to mud weight.

8
D. POWER and M. ZAMORA
AADE-03-NTCE-35
Table 1: SBM mud weight, Fann 35 readings and vane-rheometer measurements.
Mud T
ype
MW
(lb/ga
l)
Tem
p
(°
F)
R600
R300
R200
R100
R6
R3
Gels
10-s
Gels
10-m
LSYP
YP
LSYP/YP
Vane Ty
(lb/100
ft
2
)
Ty/YP
Ty/LSYP
WACF Ty
(lb/100
ft
2
)
3-PCF Ty
(lb/100
ft
2
)
SBM 11.4 150 72 45 35 25 10 9 10 15 8 18 0.44 7.99 0.44 1.00 8.68 8.72
SBM 14.6 150 76 44 35 24 9 8 12 24 7 12 0.58 9.20 0.77 1.31 8.03 8.22
SBM 11.6 150 86 54 43 30 13 12 14 26 11 22 0.50 11.38 0.52 1.03 11.61 11.76
SBM 14.8 150 102 58 43 26 8 7 18 23 6 14 0.43 6.38 0.46 1.06 6.64 6.66
SBM 13.8 150 66 41 32 23 10 9 14 23 8 16 0.50 7.69 0.48 0.96 9.01 9.03
SBM 13.3 150 90 52 40 26 9 8 15 22 7 14 0.50 7.64 0.55 1.09 7.80 7.92
SBM 10.6 150 58 41 34 26 16 15 20 20 14 24 0.58 11.15 0.46 0.80 15.17 15.06
SBM 15.3 150 104 57 41 25 7 7 19 23 7 10 0.70 6.41 0.64 0.92 6.55 6.43
SBM 13.5 150 52 29 20 13 5 4 6 8 3 6 0.50 3.00 0.50 1.00 4.22 4.27
SBM 12.4 150 60 41 32 24 12 11 18 23 10 22 0.45 7.66 0.35 0.77 10.71 10.38
SBM 14.5 150 75 48 37 25 10 9 14 22 8 21 0.38 7.64 0.36 0.95 8.35 8.20
SBM 11.2 150 47 30 23 16 7 6 9 12 5 13 0.38 4.07 0.31 0.81 5.97 5.85
SBM 9.7 150 32 20 15 10 4 4 5 8 4 8 0.50 2.86 0.36 0.71 3.73 3.61
SBM 14.7 150 77 47 38 27 12 11 16 22 10 17 0.59 11.05 0.65 1.11 11.03 11.24
SBM 9.6 150 50 35 28 21 11 10 12 15 9 20 0.45 8.38 0.42 0.93 9.71 9.40
SBM 13.7 150 60 38 30 21 8 8 13 19 8 16 0.50 6.47 0.40 0.81 7.23 7.22
SBM 12.0 150 60 38 30 21 9 9 13 23 9 16 0.56 5.98 0.37 0.66 8.51 8.45
SBM 16.4 150 82 47 36 23 8 7 10 13 6 12 0.50 5.64 0.47 0.94 6.91 7.00
Avg
0.50
0.47 0.94
Table 2: OBM mud weight, Fann 35 readings and vane-rheometer measurements.
Mud T
ype
MW
(lb/ga
l)
Tem
p
(°
F)
R600
R300
R200
R100
R6
R3
Gels
10-s
Gels
10-m
LSYP
YP
LSYP/YP
Vane Ty
(lb/100
ft
2
)
Ty/YP
Ty/LSYP
WACF Ty
(lb/100
ft
2
)
3-PCF Ty
(lb/100
ft
2
)
OBM 10.3 150 63 40 31 21 14 14 24 29 14 17 0.82 23.39 1.38 1.67 14.39 14.29
OBM 12.7 150 56 34 25 11 5 4 9 21 3 12 0.25 4.64 0.39 1.55 3.82 3.54
OBM 12.7 150 65 37 28 18 6 5 12 18 4 9 0.44 6.82 0.76 1.70 5.08 5.07
OBM 18.9 150 130 70 49 30 8 7 19 29 6 10 0.60 14.55 1.46 2.43 6.94 6.78
OBM 15.4 150 69 37 27 15 4 3 5 45 2 5 0.40
13.35 2.67 6.67 3.09 3.05
OBM 11.8 150 55 31 23 15 9 8 19 33 7 7 1.00 14.22 2.03 2.03 8.51 7.47
OBM 15.3 150 72 37 25 16 3 3 3 37 3 2 1.50 7.56 3.78 2.52 2.92 2.13
OBM 16.9 150 80 43 31 17 3 2 7 31 1 6 0.17 6.87 1.14 6.87 1.71 1.71
OBM 16.1 150 74 40 29 16 3 3 5 29 3 6 0.50 3.74 0.62 1.25 2.38 2.38
OBM 15.5 150 76 42 31 19 8 7 26 36 6 8 0.75 20.42 2.55 3.40 7.40 7.37
OBM 10.5 150 52 34 28 19 8 7 13 22 6 16 0.38 7.79 0.49 1.30 6.35 6.54
OBM 17.1 150 85 46
32
18 3
2 6 29 1 7 0.14 5.12 0.73 5.12 1.66 1.58
OBM 14.1 150 79 41 28 15 2 1 3 22 0 3 0.00 5.10 1.70
– 0.93 0.77
OBM 18.1 150 92 47 33 18 3 2 9 21 1 2 0.50
10.43 5.21
10.43 2.00 1.90
Avg
0.53
1.78
3.61

AADE-03-NTCE-35 DRILLING FLUID YIELD STRESS: MEASUREMENT TECHNIQUES FOR IMPROVED UNDERSTANDING
9
OF CRITICAL DRILLING FLUID PARAMETERS
Table 3: WBM mud weight, Fann 35 readings and vane-rheometer measurements.
Mud T
ype
MW
(lb/ga
l)
Tem
p
(°
F)
R600
R300
R200
R100
R6
R3
Gels
10-s
Gels
10-m
LSYP
YP
LSYP/YP
Vane Ty
(lb/100
ft
2
)
Ty/YP
Ty/LSYP
WACF Ty
(lb/100
ft
2
)
3-PCF Ty
(lb/100
ft
2
)
WBM 11.0 120 126 90 75 53 13 10 13 33 7 54 0.13 11.32 0.21 1.62 0.00 0.00
WBM 16.1 120 66 37 27 17 4 3 4 14 2 8 0.25 4.48 0.56 2.24 2.89 2.81
WBM 10.7 120 81 59 49 36 12 10 9 14 8 37 0.22 5.48 0.15 0.69 4.42 3.95
WBM 12.7 120 77 56 47 39 31 30 28 38 29 35 0.83 21.27 0.61 0.73 31.96 31.75
WBM 10.1 120 51 36 29 21 6 4 4 14 2 21 0.10 3.20 0.15 1.60 1.16 0.91
WBM 9.9 120 62 42 34 24 7 5 6 15 3 22 0.14 3.46 0.16 1.15 2.65 2.87
WBM 13.3 120 60 37 29 20 7 6 8 55 5 14 0.36 6.79 0.48 1.36 5.57 5.68
WBM 10.1 120 50 37 32 25 11 9 11 13 7 24 0.29 2.22 0.09 0.32 5.98 6.80
WBM 10.0 120 44 30 24 15 4 3 3 5 2 16 0.13 0.26 0.02 0.13 1.27 0.79
Avg
0.27
0.27
1.09
Wyszukiwarka
Podobne podstrony:
Drilling Fluid Yield Stress Measurement Techniques for Improved understanding of critical fluid p
Rindel Computer Simulation Techniques For Acoustical Design Of Rooms How To Treat Reflections
Jagota, Dani 1982 A New Calorimetric Technique for the Estimation of Vitamin C Using Folin Phenol
9[1] G Reid, Improved Understanding of
American Psychological Association Anwsers to Your Questions for a Better Understanding of Sexual O
A high sensitive piezoresistive sensor for stress measurements
Test 3 notes from 'Techniques for Clasroom Interaction' by Donn Byrne Longman
A Digital Control Technique for a single phase PWM inverter
Herbs for Improved Digestion
Techniques for controlled drinking
Dynamic gadolinium enhanced subtraction MR imaging – a simple technique for the early diagnosis of L
19 Non verbal and vernal techniques for keeping discipline in the classroom
Data and memory optimization techniques for embedded systems
LEAPS Trading Strategies Powerful Techniques for Options Trading Success with Marty Kearney
Best Available Techniques for the Surface Treatment of metals and plastics
Test 3 notes from 'Techniques for Clasroom Interaction' by Donn Byrne Longman
A Digital Control Technique for a single phase PWM inverter
Mcgraw Hill Briefcase Books Interviewing Techniques For Managers
Hypnotic Techniques for Dating Success by Steve G Jones
więcej podobnych podstron