
Explaining Welfare State Survival: The Role of Economic Freedom And Globalization
Andreas Bergh
Abstract.
Using the economic freedom index and the newly developed KOF-index of globalization, it is
shown that the Scandinavian welfare states have experienced faster, bigger and more consistent
increases in these areas, compared to the smaller Central-European and the Anglo-Saxon welfare
states. The market economy and globalization hence do not pose threats to these welfare states,
but are instead neglected factors in explaining their survival and good economic performance.
Big government decreases the economic freedom index by definition, but the welfare states
compensate in other areas, such as legal structure and secure property rights.

2
1.
I
NTRODUCTION
The big Scandinavian welfare states show remarkable resilience, and many attempts have been
made to explain the decent growth performance and the continued political support for the
Scandinavian high tax societies. This paper points to two previously neglected, but potentially
important factors: Big increases in economic freedom and globalization.
Explaining welfare state survival is a fairly new research question for social scientists. In the early
90s, both popular and academic debate focused highly on the problems caused by the welfare
states’ high taxes and high levels of public expenditure – see for example Snower (1993),
Lindbeck (1994) and the numerous examples of articles dismissing the Swedish model in
publications such as The Economist listed in Lindert (2004). In addition to internal problems,
authors such as Martin and Schumann (1997) and Strange (1996) argued that the external forces
from globalization were undermining the fundaments for big government.
Today, the debate has changed. A number of empirical studies show that high taxes and
expenditures persist, and that the universal structure of the Scandinavian welfare states remains
largely intact, despite the economic crisis of the early 90s.
1
In fact, during the economic crisis of
the 90s, welfare state cutbacks were biggest in the Anglo-Saxon countries where the welfare state
was smaller to begin with – see for example Korpi and Palme (2003) and Swank (2002). As a
result, scholars are now taking on the task of explaining what Rothstein and Lindbom (2004) calls
“the mysterious survival of the Scandinavian welfare state”.
The mystery does not primarily concern political support for big government – mainstream
public choice theory provide several explanations of why big government may arise and persist in
democracies.
2
More curious is the good economic performance of big welfare states. As can be
seen in Table 1, the Scandinavian welfare states have an above average growth record during the
1
See for example Rothstein and Lindbom (2004), Castles (2004), Timonen (2001) and Kautto (1999).
2
See for example Meltzer and Richard (1978), Peltzman (1980) and Mueller (2003) chapter 21 for a
survey.

3
period 1970-2000: Sweden has to some extent lagged behind, but Finland and especially Norway
have grown steadily.
As will be demonstrated, the development of economic freedom and globalization in the
Scandinavian welfare states since 1970 suggest that these countries have succeeded in
compensating for negative effects of high taxes by a steeper increase in economic freedom and
globalization.
Table 1 Average growth in GDP per capita
3
80s
90s
70-00
Sweden
2.0
1.3
1.6
Finland
3.2
1.6
2.6
Norway
2.3
2.7
3.0
Denmark
1.4
1.8
1.7
Average
2.2
1.9
2.2
Germany
1.9
1.4
2.0
France
1.8
1.4
2.0
Belgium
2.1
1.9
2.3
Netherlands
1.4
2.4
2.0
Italy
2.3
1.4
2.2
Switzerland
1.7
0.4
0.9
Average
1.9
1.5
1.9
Canada
1.7
1.4
2.0
Australia
1.8
2.0
1.8
United Kingdom
2.2
1.8
2.1
United States
2.0
2.1
2.2
Average
1.9
1.8
2.0
Average, OECD
2.0
1.8
2.1
The paper proceeds as follows: The next section describes the theoretical base for the
compensation hypothesis, the role of globalization, the used welfare state categories, and the
indices used to measure economic freedom and globalization. In section three, I analyze the
development of government size, economic freedom and globalization for three different types
3
Source: OECD (2002).

4
of welfare state. Finally, section four relates the empirical findings to some existing literature and
discusses implications for future research.
2.
H
YPOTHESES
,
DEFINITIONS AND MEASUREMENT
According to the compensation hypothesis developed here, welfare states compensate for
negative effects of high taxes in (at least) two ways: Economic freedom and globalization. Below
I demonstrate that such a compensation is theoretically possible, and in section 3 it is shown that
the compensation has indeed taken place.
2.1 Compensation through economic freedom
The fundament for prosperity in a market economy is a voluntary exchange of goods and
services. In markets without market failures, this will produce an efficient allocation of resources
and a division of labor. The most basic theoretical reason for expecting a negative effect of taxes
on economic efficiency, is that transactions that would take place without taxation, may not take
place when buyers or sellers in addition to the price they agree upon must may taxes.
However, the price for a good or a service (with or without taxes) is only one part of the total
cost of a transaction. Other transactions costs include for example the costs for buyers and
sellers to find each other, to reach an agreement and mutually and credibly ensure each other that
they will in fact stick to the agreement they make, and possibly also agree on how to solve
potential disputes. It is obvious that for example well-defined property rights, a functioning legal
system and a stable currency are factors that lower transaction costs drastically – and these
factors are captured by the economic freedom index.
Note that the total distortion created by taxation depends on how the tax-revenue is spent. For
example, tax revenue used to finance cash benefits that are close substitute to labor income,
induce higher inefficiencies because of the adverse effect on work incentives. On the other hand,
tax revenue may also be spent on public goods or consumption with only small negative or even
positive effects on economic efficiency – a point recently made forcefully by Lindert (2004).
However, the costs created by the tax-wedge are inescapable, regardless of how the tax revenue is
spent. Similarly, higher economic freedom decreases transaction costs regardless of how any tax
revenue is spent. For this reason, this paper is focused on taxes and economic freedom, rather
than the composition of public spending.

5
2.2 Compensation through globalization
Traditionally, it has been assumed that increasing globalization, especially the increased mobility
of labor and capital, will cause trouble for big welfare states – see for example Martin and
Schumann (1997). There has been talk about a race to the bottom, in which countries compete
with each other for high quality labor and capital, by lowering taxes and welfare benefits – see
Sinn, 2004, 1997) Peterson and Rom (1990) and Gramlich (1982). Recently, however, empirical
evidence suggest that globalization and big welfare states are compatible – see Dreher (2006b),
Mendoza and Tesar (2005) and Castles (2004).
4
Often overlooked, there are several mechanisms through which globalization may affect the
welfare state in a positive way. For example, high taxes have a negative impact on the division of
labor, but economic openness and free trade create more opportunities for a division of labor to
arise. Furthermore, with openness comes not only access to new products through free trade, but
also access to knowledge and technologies that play a fundamental role in economic growth
according to the so-called ‘endogenous’ or ‘new’ growth theory (Romer, 1986, 1990).
Iversen (2005) proposes a theory about welfare states that potentially explains why globalization
and big welfare states often exist together: Big welfare states might run into problems if they did
not apply a policy of economic openness:
“[…] labor-intensive, low-productivity jobs do not thrive in the context of high social protection and intensive
labor-market regulation, and without international trade countries cannot specialize in high value-added services.
Lack of international trade and competition, therefore, not the growth of these, is the cause of current employment
problems in high-protection countries.” [p. 74]
According to this view, the negative effects of high transfers and labor-market regulation can be
compensated by economic openness, because this allows welfare states to specialize in high
value-added services.
4
In fact, Rodrik (1998) argues that the big government of open economies is caused by the need for
protection against economic volatility – an explanation dismissed on empirical grounds by among others
Alesina and Glaeser (2005).

6
2.3 Measuring economic freedom and globalization
To examine the development of economic freedom and globalization, I use the Economic
Freedom Index (EFI) developed by The Fraser Institute, and the index of globalization
developed by the Konjunkturforschungsstelle in Zürich (the so-called KOF-index).
5
The Economic Freedom Index (EFI) consists of five dimensions: Size of government (EFI
1
),
legal structure and security of property rights (EFI
2
), access to sound money (EFI
3
), freedom to
exchange with foreigners (EFI
4
), and regulation of credit, labor, and business (EFI
5
). Using
several indicators in each dimension, the five dimensions are weighed together in a composite
index, where 0 indicates the lowest and 10 the highest degree of economic freedom.
The first component (EFI
1
) captures taxes, transfers, government enterprises and marginal tax
rates – factors that per definition decrease the index for bigger welfare states. Thus, to increase
overall economic freedom, welfare states must compensate their disadvantage in the government
size dimension by being even freer in the other four dimensions. To test this, we use an index of
economic freedom based only on EFI
2-5
, i.e. excluding the government size dimension.
The KOF-index, developed and used for the first time by Dreher (2006a), consists of three areas,
describing economic, social and political globalization respectively. Economic indicators describe
trade flows, foreign investments and import barriers, social indicators include tourism, outgoing
telephone calls and Internet usage, and political globalization captures membership in
international organizations and diplomatic relations with other countries.
While Iversen’s theory applies primarily to economic globalization, other mechanisms (such as
the possibilities to absorb knowledge) may work through social and political globalization as well.
For this reason we use both the entire index as well as the part capturing only economic
globalization.
A complete list of variables and weights can be found in the Appendix.
5
The indices are available at
www.freetheworld.com
and
www.globalization-index.org
.

7
2.4 Classifying welfare states
According to Abrahamson (1999), classifying welfare states has become a business of its own.
Important contributions to this literature are Titmuss (1974) and Esping-Andersen (1990).
Titmuss (1974) uses three categories: the ‘marginal’ (typical for Anglo-Saxon countries), the
‘industrial achievement’ (typical for Central European countries) and the ‘institutional’ (typical for
the UK and Scandinavia). These correspond roughly to the categories identified by Esping-
Andersen (1990): The ‘liberal’, the ‘corporatist’ and the ‘social democratic’ welfare state, although
UK is now put in the ‘liberal’ category.
In a well-known paper, Korpi and Palme (1998) classify “social insurance institutions” as follows:
Sweden, Norway and Finland are called Encompassing; Germany and France are called
Corporatist; Canada, Netherlands, Switzerland, United Kingdom United States are called Basic
Security; and finally Australia represents a Targeted system. The general pattern described in the
next section of this paper, holds for this categorization as well.
I refrain from the subtle intricacies of welfare state typologies. It is sufficient to note that there is
considerable agreement that the Scandinavian welfare states are substantially different from the
Central-European ones, and also from the US welfare state.
6
They are bigger in several senses:
Benefits are typically higher, cover larger shares of the population, and are to a smaller extent
means-tested against recipients’ income.
On the other side of the scale, we find ‘liberal’, ‘residual’ or ‘marginal’ welfare states such as the
US and the UK. Here benefits are lower, more means-tested and the reliance on private funding
and market provision of welfare services is bigger. Finally, we have the Central European
(‘Christian democratic’ or ‘corporatist’) welfare states with high to fairly high taxes, and a high
reliance on corporatism and family based solutions.
Beyond these broad descriptions, there are disagreements regarding the details: Different authors
use different number of categories, and some countries are not easily categorized. I follow
6
There is, however, much less agreement on the appropriate labels of different categories: The labels
Scandinavian, universal, institutional, encompassing and social democratic all refer roughly to the same
countries – see Bergh (2004) for a discussion of how to define and measure welfare state universality.

8
Bradley et al. (2003) who stay close to Esping-Andersen’s classification by using three categories,
containing the following countries: Scandinavian (Sweden, Norway, Finland, Denmark), Central-
European (Belgium, Netherlands, Germany, France, Italy, Switzerland) and Liberal (Australia,
Canada, United Kingdom, United States).
7
3.
A
NALYSIS
Table 2 shows the economic freedom index and the globalization index for the countries studied.
The economic freedom index is shown with the government size component excluded as well,
and the globalization index is also shown measuring only economic globalization.
As expected, the Scandinavian countries had the lowest degree of economic freedom in 1970.
Since then, however, the Scandinavian countries have experienced the largest increase in
economic freedom. Looking at EFI2-5, i.e. the type of economic freedom that is not related to
government size, the trajectory for the Scandinavian countries is even more remarkable, with an
average increase of 1.67 index points, compared to 0.91 for the liberal and 0.11 for the Central-
European welfare states. Except for the Scandinavian countries, only France and the Netherlands
have had a bigger increase in economic freedom when EFI
1
is excluded, compared to the total
EFI measure.
For globalization, the liberal welfare states have had the biggest increase, but the Scandinavian
ones are not far behind. Looking at economic globalization only, the Scandinavian and the
Central-European welfare states both started higher and also experienced bigger increases than
the liberal welfare states.
7
The label ‘liberal’ in this literature obviously refers to the European meaning of the word, i.e. libertarian.

9
Table 2 Levels and changes in economic freedom and globalization
8
Country
Overall economic
freedom (EFI)
Four areas of economic
freedom, EFI
2-5
(excl. gov. size)
Total gobalization (KOF)
Economic globalization
(KOF)
Scandinavian
Level
1970
Increase
1970-
2003
Slope
00-70
Level
1970
Increase
1970-
2003
Slope
00-70
Level
1970
Increase
70-2003
Slope
00-70
Level
1970
Increase
1970-
2003
Slope
00-70
Sweden
5.30
2.03
0.079
6.13
2.40
0.092
2.79
2.19
0.055
3.84
1.21
0.051
Finland
6.58
1.07
0.051
6.99
1.45
0.076
3.57
1.60
0.046
3.74
1.37
0.048
Norway
6.58
1.34
0.065
6.59
1.42
0.073
2.46
1.45
0.040
3.79
0.90
0.040
Denmark
5.96
1.08
0.051
7.02
1.40
0.075
2.58
1.51
0.037
3.52
0.90
0.031
Average
6.10
1.38
0.062
6.68
1.67
0.079
2.85
1.69
0.045
3.72
1.09
0.043
Central-
European
Germany
7.33
0.12
0.018
7.83
0.04
0.027
2.49
1.43
0.035
3.60
0.76
0.024
France
6.19
0.72
0.044
6.70
1.53
0.066
2.93
1.69
0.049
3.55
1.24
0.041
Belgium
7.27
0.10
0.015
8.17
-0.06
0.014
2.50
1.08
0.035
4.89
0.61
0.018
Netherlands
6.99
0.75
0.045
7.66
0.87
0.051
2.18
1.25
0.031
3.97
1.60
0.045
Italy
5.82
0.76
0.056
8.71
-1.66
-0.019
2.74
1.07
0.031
2.88
0.76
0.031
Switzerland
7.37
0.80
0.030
7.70
-0.05
0.037
2.72
1.48
0.041
3.65
1.51
0.056
Average
6.91
0.54
0.03
7.80
0.11
0.03
2.59
1.33
0.037
3.76
1.08
0.036
Liberal
Canada
7.37
0.66
0.038
8.19
0.19
0.031
2.48
1.63
0.043
4.13
0.56
0.017
Australia
6.61
1.24
0.064
7.41
0.86
0.053
2.43
1.83
0.050
3.11
1.23
0.051
United
Kingdom
5.94
2.21
0.098
6.51
2.06
0.086
2.46
1.99
0.046
2.78
1.72
0.058
United
States
6.96
1.23
0.056
7.77
0.51
0.034
3.32
1.84
0.052
4.19
0.24
0.012
Average
6.50
1.33
0.06
7.23
0.91
0.05
2.67
1.82
0.048
3.55
0.94
0.034
3.1 Economic freedom
Let us now study the relationship between total government size (as measured by taxes share of
GDP) and economic freedom (as measured by EFI
2-5
). In this case it is important not to use
EFI
1
because this component is almost per definition correlated with government size.
9
The
8
The table shows the increase in the index value over the entire period for which data is available, 1970
to 2003, and the slope of a OLS-fitted linear trend for the 30-year period 1970-2000.
9
Note, however, that there are ways to increase EFI
1
without decreasing government size, for example
through tax reforms that lower progressivity without lowering total tax revenue. Precisely this type of tax
10
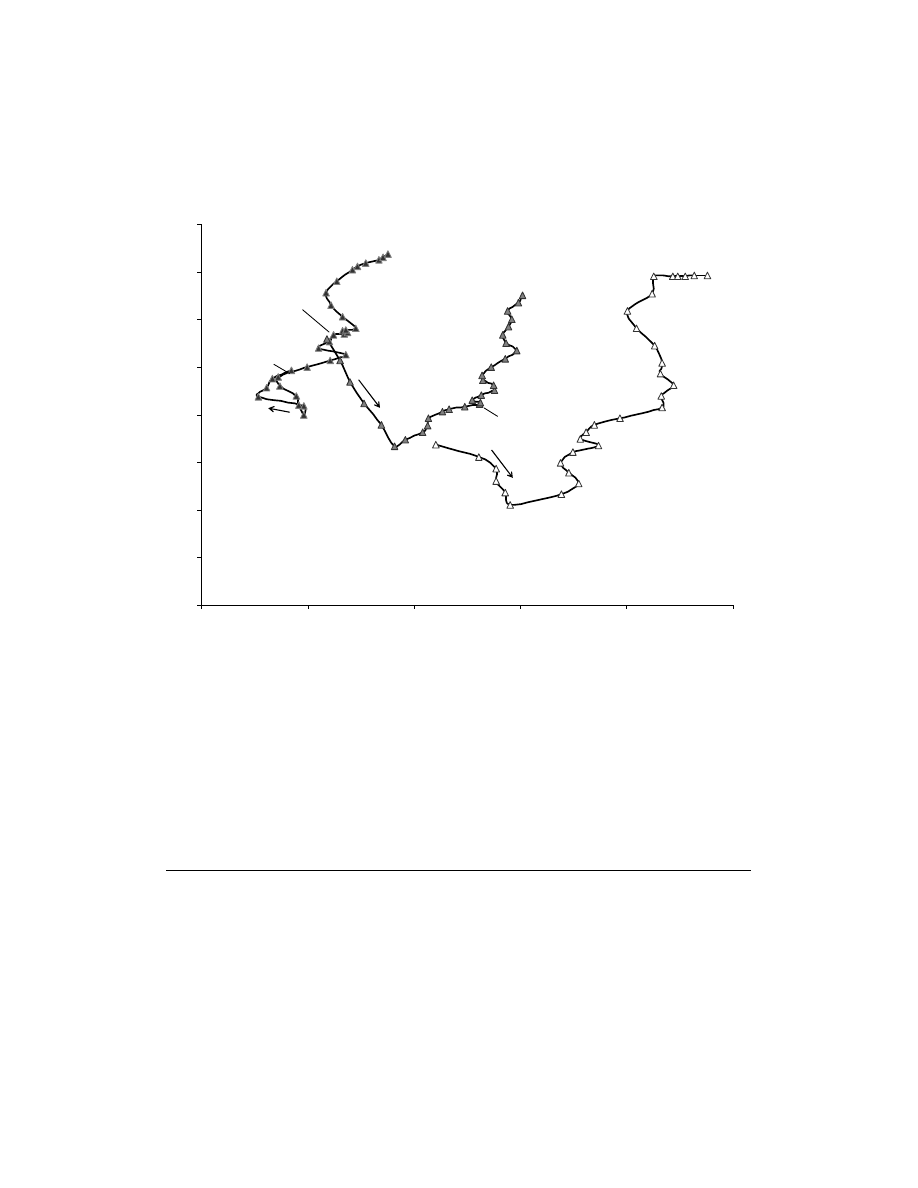
trajectories of the three different types of welfare states are shown in Figure 1. The curves
represent unweighted averages of the corresponding countries.
10
Figure 1 Government size and economic freedom for different types of welfare states
5
5.5
6
6.5
7
7.5
8
8.5
9
25
30
35
40
45
50
1970
1985
Swe, Fin,
Nor, Den.
Fra, Gre, Bel,
Ned, It a, Swi.
1985
USA, UK,
Aus, Can.
1985
EFI
2-5
Taxes (% of GDP)
2000
2000
2000
The patterns reveal some interesting facts:
• All countries experienced a decrease in economic freedom in the early 70s. This decrease
was biggest in the Central-European countries.
• The Scandinavian countries started from a very low level of economic freedom, but
since the mid-70s, the development towards economic freedom has been faster than in
other countries.
reform has been undertaken in the Scandinavian countries, see Agell et al. (1996) for Sweden and
Aarbu and Thoresen (1997) for Norway.
10
Because EFI is only available every fifth year, intermediate values have been interpolated.
11
• In the mid-80s, liberal and Central-European welfare states experienced slower
development of economic freedom, but the Scandinavian countries did not. As a result,
the Scandinavian countries passed the Central-European ones, and have since been as
free as the liberal welfare states.
• Between 1995 and 2000, the rapid development of economic freedom in Scandinavia
suddenly halted, but at a very high level.
The welfare state categories used seem to make sense: The countries in each category behave
similarly, and the categories behave differently from each other. Excluding single countries do
not alter the conclusions. Two countries deviate partially from the pattern, both in the Central-
European category. Italy started at very high levels of economic freedom in 1970 but experienced
an extremely sharp decline. The Netherlands increased economic freedom in the 90s in a pace
similar to the Scandinavian countries. Correcting for these two outliers, the curve for the Central-
European countries would start and end slightly lower.
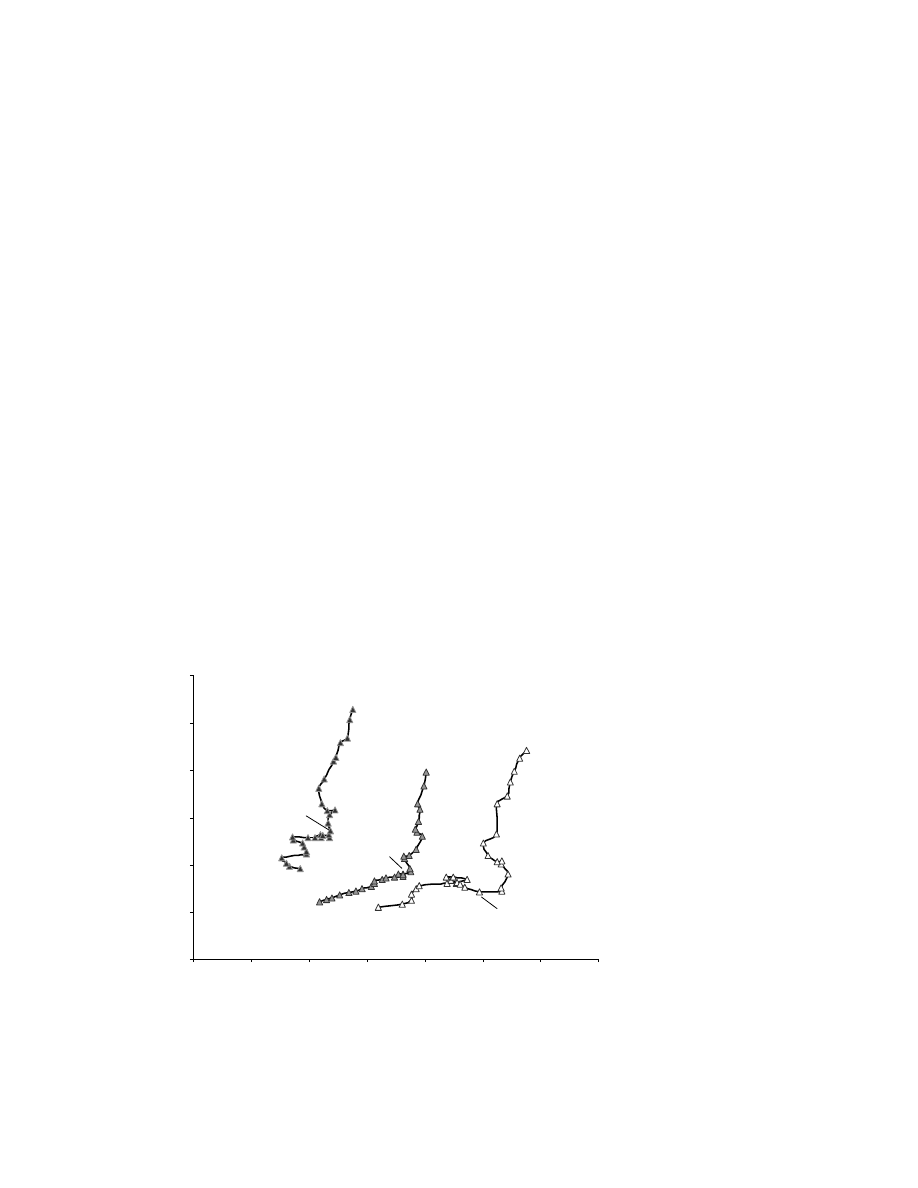
3.2 Globalization
Turning to the globalization hypothesis, Figure 2 shows that a similar pattern emerges when we
study the evolution of taxation and globalization, as measured by the KOF-index. Since 1985, the
Scandinavian welfare states have had a faster increase in overall globalization.
Figure 2 Government size and globalization
2
2.5
3
3.5
4
4.5
5
20
25
30
35
40
45
50
55
85
70
70
70
Swe,
Fin, Nor,
Den.
Fre, Gre,
Bel, Ned, Ita,
Swi.
USA, UK,
Aus, Can.
85
85
00
00
00
Taxation and the KOF-globalization index
for different types of welfare states 1970-2000
taxation (% of GDP)
Index

12
Focusing economic globalization only, the Scandinavian and central European welfare states are
rather similar – but the liberal welfare states are actually less globalized. While the low values in
the beginning of the period are driven partly by the UK, this effect disappears as UK converge,
but the liberal welfare states remain less globalized throughout the period. This supports the
mechanism described by Iversen (2005), that countries with higher social protection and labor-
market regulations compensate with a higher openness to trade.
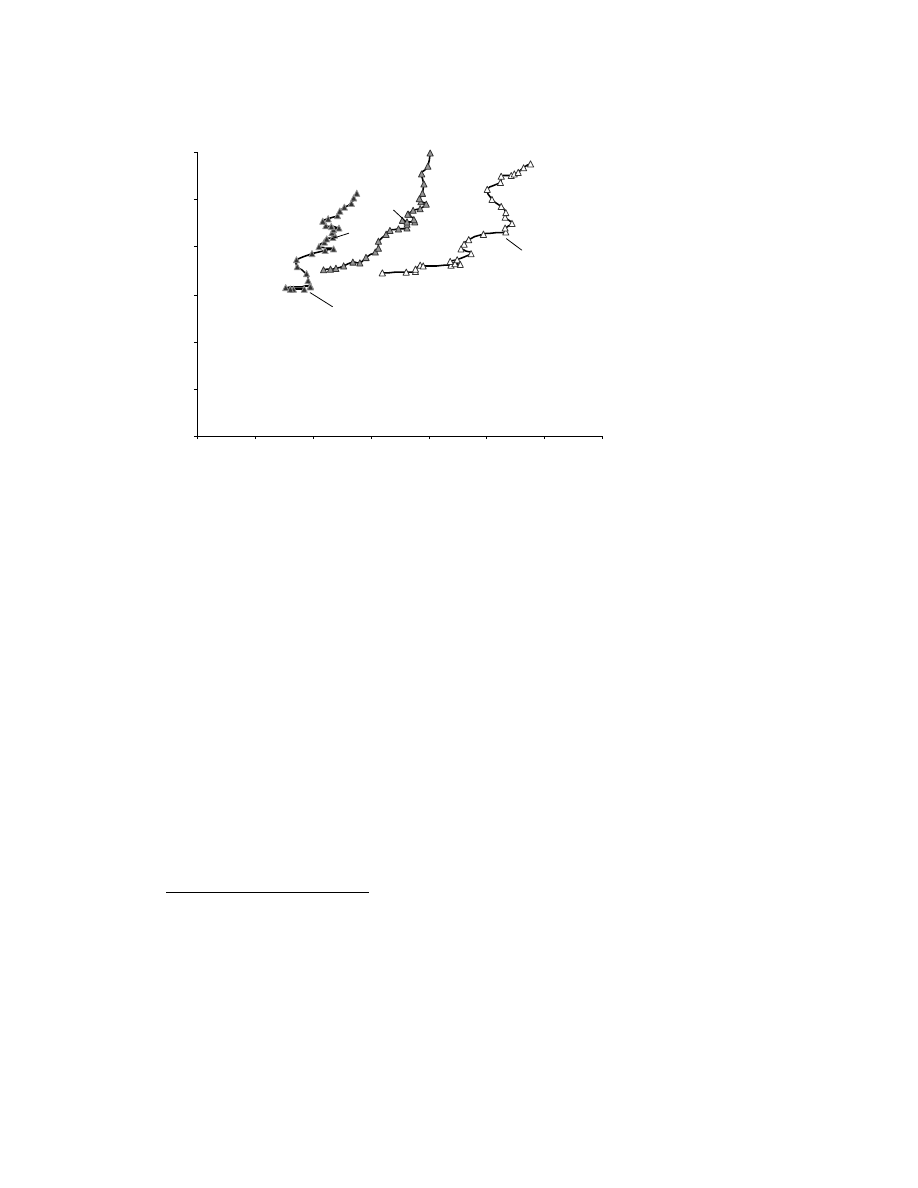
13
Figure 3 Government size and economic globalization
2
2.5
3
3.5
4
4.5
5
20
25
30
35
40
45
50
55
85
70
Swe, Fin,
Nor, Den.
Fre, Gre,
Bel, Ned,
Ita, Swi.
USA, UK,
Aus, Can.
85
85
00
taxation (% of GDP)
Index
85
3.3 Explaining growth
As noted in the introduction, the effect of general government size on growth is highly debated
and seems to be very hard to estimate robustly. A huge amount of research examines the relation
between government size and growth – but no consensus has emerged.
11
In contrast, it is undisputed that economic freedom has a big and robust positive effect on
growth: Doucouliagos and Ulubasoglu (2006) conduct a meta-study of 52 studies dealing with the
impact of economic freedom on economic growth, and conclude that “economic freedom has a
robust positive effect on economic growth regardless of how it is measured” (p. 68).
By decomposing the index into its subcomponents and by using extreme bounds analysis and
reweighted least squares, Berggren and Jordahl (2005) show that, by a big margin, the most
robust component of the EFI-index in explaining growth is EFI
2
, i.e. legal structure and security
11
For example, Lindert (2004) summarizes a number of studies with different results. Fölster and
Henrekson (1999) and Agell et al. (1999) derive different results from the same data set.

14
of property rights. As can be seen in Figure 4, the Scandinavian countries have had higher index
value than the Central European countries throughout the whole period, and the difference has
increased.
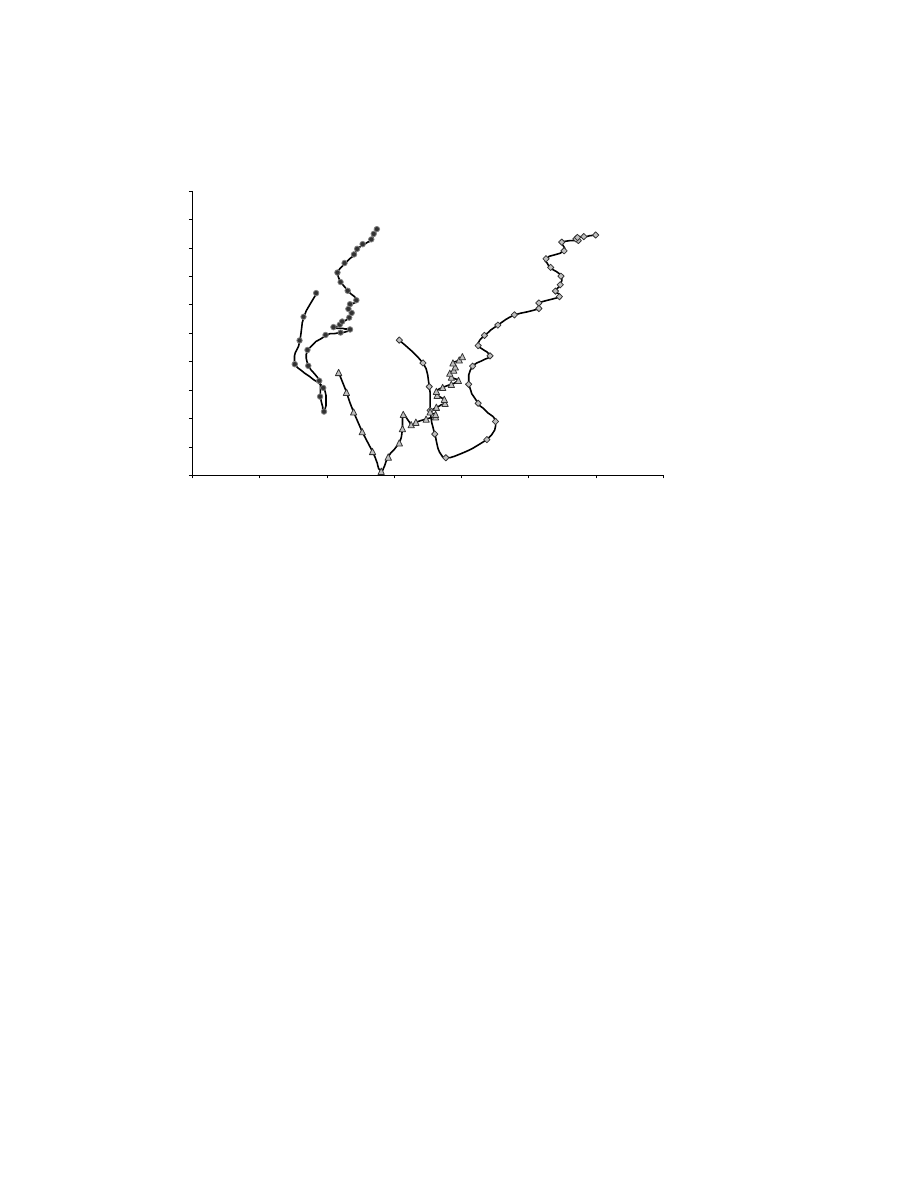
15
Figure 4 EFI
2
(property rights and legal structure) and government size
5
5.5
6
6.5
7
7.5
8
8.5
9
9.5
10
20
25
30
35
40
45
50
55
Swe, Fin,
No r, Den.
Fra, Gre,
Bel, Ned,
Ita, S wi.
USA, UK, Aus ,
Can.
Thus, high-tax countries have had the biggest increases in economic freedom, especially in those
areas which are most important for growth. For this reason, the lack of robust results in studies
trying to estimate the effect of government size on growth, is not surprising: These studies
typically do not control for economic freedom as captured by EFI
2-5
, or anything similar.
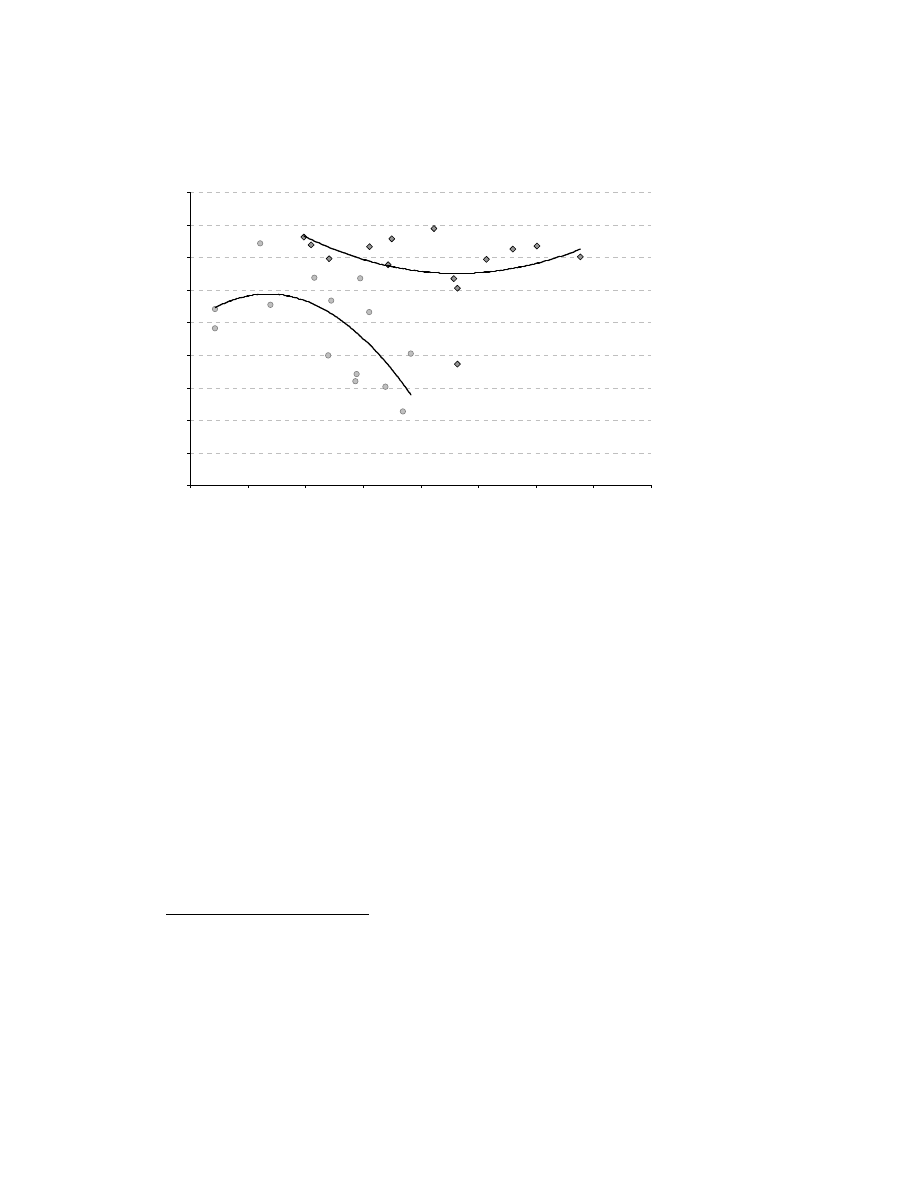
The trajectories of different countries mean that cross-country comparisons today and in the 70s
produce very different pictures, ash shown in Figure 5. In the 1970s, higher taxes were correlated
with lower economic freedom, and the trade-off seemed steep when looking at a scatter plot.
Since the mid-80s, this is no longer the case - the relation has actually become u-shaped, with the
highest economic freedom in the low-tax liberal welfare states, and in the high tax Scandinavian
welfare states. The Netherlands is an interesting outlier in this pattern: Its increase in economic
freedom in the 1990s beats all other countries (seemingly, this also resulted in higher growth, see
Table 1).
16
Figure 5 The cross-country correlation between EFI2-5 and taxes in 1970 and 2000
12
5
5.5
6
6.5
7
7.5
8
8.5
9
9.5
20
25
30
35
40
45
50
55
60
2000
EFI2-5
Taxes (% of GDP)
1970
Empirically, there is also a positive correlation between different measures of globalization and
growth – see the survey and results based on the KOF-index in Dreher (2006a). This means that
ideally, a measure of globalization should also be included when analyzing the effect of
government size on growth.
In Berggren and Jordahl (2005), government size as measured by EFI
1
, indicates that smaller
government is correlated with higher growth, but this coefficient is not significant. This suggests
that when controlling for other explaining variables, such as different measures of economic
freedom, government size does not matter significantly for growth – but the effect of property
rights and legal structure is both significant, big and robust.
To sum up, the compensation hypothesis has empirical support, when it comes to economic
freedom as well as globalization. Furthermore, since 1975 the Scandinavian countries have been
12
Source: OECD and EFI.

17
particularly successful compared to other countries in improving economic freedom through
secure property rights and legal structure, the area most robustly related to economic growth.
4.
C
ONCLUDING
D
ISCUSSION
In the Scandinavian countries, there are few signs that the dystopia described by Hayek (1944) in
“The road to serfdom” is about to come true. On the contrary, big government seem to thrive in
peaceful co-existence with high and increasing degrees of economic freedom. For over 30 years,
the Scandinavian welfare states have increased economic freedom and openness in a remarkable
way. This development does not support the idea that the welfare state is threatened by market
economy, economic freedom and globalization.
Except for the interesting case of the Netherlands, it is worth noting that the welfare states
categories seem to make sense: There are clear similarities within groups and clear differences
between groups. The qualitative results are not changed by excluding hard-to-classify countries
(such as Canada, Australia and Denmark), or by using the classification of Korpi and Palme
(1998) instead.
The mechanisms pointed to in this paper does not exclude other explanations of welfare state
survival. For example Rothstein and Lindbom (2004) argue that there are two reasons for the
mysterious survival of the Swedish welfare state, both related to its organization. First, the
middle class has stakes in the continuity of the welfare state. Second, the system promotes
attitudes of distributional and procedural justice that strengthens welfare state support. The
importance of support from the broad middle class is noted by many scholars, for example Korpi
and Palme (1998) and Goodin and Le Grand (1987). However, while these explanations without
doubt play a big role in explaining political support, they do not explain the decent economic
performance of high tax countries, as indicated by Table 1.
Lindert (2004) attempts to explain what he calls the free-lunch puzzle, by which he means the
absence of a robust and significant negative correlation between government size and growth. He
proposes the following explanations: Compared to other countries, the high tax countries have a
more pro-growth tax-structure, higher work incentives for young adults, and subsidized early

18
retirement and unemployment compensation that lower employment but raise productivity of
those who work. Finally, Lindert argues that there are positive growth effects of social
spending.
13
None of these explanations contradict the explanation proposed here, and it will be
left for future research to determine the relative importance of different factors.
Finally, it should be noted that the quantitative resilience of high tax-societies does not imply that
the organization of the welfare state today is the same as it was in the 70s. On the contrary, there
is evidence that the welfare state has undergone some important organizational changes to
increase flexibility and freedom of choice – see for example Blomqvist (2004). Nevertheless, the
development in Scandinavia over the last 30 years as described in this paper clearly shows that
economic freedom and globalization is highly compatible with high taxes and a big welfare state.
13
Just like, Rothstein and Lindbom (2004), Lindert uses the case of Sweden to illustrate his arguments.
In some areas, however, Lindert’s descriptions of Sweden have been questioned – see Bergh (2006).

19
A
PPENDIX
The Areas and Components of the Economic Freedom Index
1: Size of Government: Expenditures, Taxes, and Enterprises
A. General government consumption spending as a percentage of total consumption.
B. Transfers and subsidies as a percentage of GDP.
C. Government enterprises and investment as a percentage of GDP.
D. Top marginal tax rate (and income threshold to which it applies).
i. Top marginal income tax rate (and income threshold at which it applies)
ii. Top marginal income and payroll tax rate (and income threshold at which it applies)
2: Legal Structure and Security of Property Rights
A. Judicial independence: the judiciary is independent and not subject to interference by the government
or parties in disputes.
B. Impartial courts: A trusted legal framework exists for private businesses to challenge the legality of
government actions or regulation.
C. Protection of intellectual property.
D. Military interference in rule of law and the political process.
E. Integrity of the legal system.
3: Access to Sound Money
A. Average annual growth of the money supply in the last five years minus average annual growth of
real GDP in the last ten years
B. Standard inflation variability in the last five years.
C. Recent inflation rate.
D. Freedom to own foreign currency bank accounts domestically and abroad.
4: Freedom to Trade Internationally
A. Taxes on international trade.
i. Revenue from taxes on international trade as a percentage of exports plus imports.
ii. Mean tariff rate.
iii. Standard deviation of tariff rates.
B. Regulatory trade barriers.
i. Hidden import barriers: No barriers other than published tariffs and quotas.
ii. Costs of importing: the combined effect of import tariffs, licence fees, bank fees, and the time required
for administrative red-tape raises costs of importing equipment by (10 = 10% or less; 0 = more than
50%).
C. Actual size of trade sector compared to expected size.
D. Difference between official exchange rate and black market rate.
E. International capital market controls

20
i. Access of citizens to foreign capital markets and foreign access to domestic capital markets.
ii. Restrictions on the freedom of citizens to engage in capital market exchange with foreigners—index of
capital controls among 13 IMF categories.
5: Regulation of Credit, Labor, and Business
A. Credit Market Regulations
i. Ownership of banks: percentage of deposits held in privately owned banks.
ii. Competition: domestic banks face competition from foreign banks.
iii. Extension of credit: percentage of credit extended to private sector.
iv. Avoidance of interest rate controls and regulations that lead to negative real interest rates.
v. Interest rate controls: interest rate controls on bank deposits and/or loans are freely determined by the
market.
B. Labor Market Regulations
i. Impact of minimum wage: the minimum wage, set by law, has little impact on wages because it is too
low or not obeyed.
ii. Hiring and firing practices: hiring and firing practices of companies are determined by private contract.
iii. Share of labor force whose wages are set by centralized collective bargaining.
iv. Unemployment Benefits: the unemployment benefits system preserves the incentive to work.
v. Use of conscripts to obtain military personnel
C. Business Regulations
i. Price controls: extent to which businesses are free to set their own prices.
ii. Administrative conditions and new businesses: administrative procedures are an important obstacle to
starting a new business.
iii. Time with government bureaucracy: senior management spends a substantial amount of time dealing
with government bureaucracy.
iv. Starting a new business: starting a new business is generally easy.
v. Irregular payments: irregular, additional payments connected with import and export permits, business
licenses, exchange controls, tax assessments, police protection, or loan applications are very rare.
KOF Index of Globalization 2006: Variables and Weights
A. Economic Globalization [34%]
i) Data on Actual Flows (50%)
Trade (percent of GDP) (21%)
Foreign Direct Investment (percent of GDP) (26%)
Portfolio Investment (percent of GDP) (27%)
Income Payments to Foreign Nationals (percent of GDP) (26%)
ii) Data on Restrictions (50%)
Hidden Import Barriers (24%)
Mean Tariff Rate (27%)
Taxes on International Trade (percent of current revenue) (24%)

21
Capital Account Restrictions (25%)
B. Social Globalization [37%]
i) Data on Personal Contact (26%)
Outgoing Telephone Traffic (28%)
Transfers (percent of GDP) (13%)
International Tourism (21%)
Telephone Average Cost of Call to US (11%)
Foreign Population (percent of total population) (27%)
ii) Data on Information Flows (37%)
Telephone Mainlines (per 1000 people) (18%)
Internet Hosts (per capita) (17%)
Internet Users (share of population) (18%)
Cable Television (per 1000 people) (15%)
Daily Newspapers (per 1000 people) (16%)
Radios (per 1000 people) (17%)
iii) Data on Cultural Proximity (36%)
Number of McDonald's Restaurants (per 100,000 people) (100%)
C. Political Globalization [28%]
Embassies in Country (36%)
Membership in International Organizations (36%)
Participation in U.N. Security Council Missions (29%)

22
References
Aarbu, Karl Ove and Thor Olav Thoresen. 1997. "The Norwegian Tax Reform;
Distributional Effects and the High-income Response." Discussion Papers No.
207, December 1997, Statistics Norway, Research Department.
Abrahamson, Peter. 1999. "The Welfare Modelling Business." Social policy &
administration
33:394-416.
Agell, Jonas, Peter Englund, and Jan Södersten. 1996. "Tax reform of the century--the
Swedish experiment." National Tax Journal 49:643-665.
Agell, Jonas, T Lindh, and H. Ohlsson. 1999. "Growth and the Public Sector: A
Critical Review Essay: A reply." European Journal of Political Economy 15:359-
366.
Alesina, Alberto and Edward Glaeser 2005. Fighting Poverty in the US and Europe : A
World of Difference
. Oxford: Oxford University Press.
Berggren, Niclas and Henrik Jordahl. 2005. "Does free trade really reduce growth?
Further testing using the economic freedom index." Public Choice 122:99-114.
Bergh, Andreas. 2004. "The Universal Welfare State: Theory and the Case of Sweden."
Political Studies
52:745-766.
—. 2006. "Is the Swedish Welfare State a Free Lunch? A comment on Peter H.
Lindert's book Growing Public." Forthcoming in Econ Journal Watch.
Blomqvist, Paula. 2004. "The Choice Revolution: Privatization of Swedish Welfare
Services in the 1990s." Social Policy and Administration 38:139-155.
Bradley, David, Evelyne Huber, Stephanie Moller, Francois Nielsen, and John D.
Stephens. 2003. "Distribution and Redistribution in Postindustrial
Democracies." World Politics 55:193-228.
Castles, Francis G. 2004. The Future of the Welfare State Crisis Myths and Crisis Realities.
Oxford Scholarship Online: Oxford University Press.
Doucouliagos, C. and M.A. Ulubasoglu. 2006. "Economic freedom and economic
growth: Does specification make a difference?" European Journal of Political
Economy
22:60-81.
Dreher, Axel. 2006a. "Does Globalization Affect Growth? Empirical Evidence from a
new Index." Applied Economics forthcoming.
—. 2006b. "The Influence of Globalization on Taxes and Social Policy – an Empirical
Analysis for OECD Countries." European Journal of Political Economy 22:179-
201.
Esping-Andersen, Gösta. 1990. The Three Worlds of Welfare Capitalism. Princeton:
Princeton University Press.
Fölster, Stefan and Magnus Henrekson. 1999. "Growth and the public sector: A
Critique of the Critics." European Journal of Political Economy 15:3337-3358.
Goodin, Robert E. and Julian Le Grand. 1987. Not Only the Poor: The Middle Classes
and the Welfare State
. London: Allen & Unwin.
Gramlich, Edward M. 1982. "An Econometric Examination of the New Federalism."
Brookings Papers on Economic Activity
2:327-360.
Hayek, Friedrich A. 1944. The Road to Serfdom (1994): University of Chicago Press.

23
Iversen, Torben. 2005. Capitalism, Democracy and Welfare. USA: Cambridge University
Press.
Kautto, Mikko. 1999. "Nordic Social Policy." Pp. 272: Routledge (UK).
Korpi, Walter and Joakim Palme. 2003. "New Politics and Class Politics in the
Context of Austerity and Globalization: Welfare State Regress in 18
Countries, 1975-95." American Political Science Review 97:425-446.
Korpi, Walter and Joakim Palme. 1998. "The Paradox of Redistribution and Strategies
of Equality: Welfare State Institutions, Inequality, and Poverty in the Western
Countries." American Sociological Review 63:661-687.
Lindbeck, Assar. 1994. "The welfare state and the employment problem." The
American Economic Review
84:71-76.
Lindert, Peter H. 2004. Growing Public. Cambridge: Cambridge University Press.
Martin, Hans-Peter and Harald Schumann. 1997. The global trap: Globalization and the
assault on prosperity and democracy
. London, New York: Zed Books.
Meltzer, Allan H. and Scott F. Richard. 1978. "Why Government Grows (and Grows)
in a Democracy." Public Interest 116.
Mendoza, Enrique G. and Linda L. Tesar. 2005. "Why hasn't tax competition
triggered a race to the bottom? Some quantitative lessons from the EU."
Journal of Monetary Economics
52:163-204.
Mueller, Dennis C. 2003. Public Choice III. Cambridge: Cambridge University Press.
OECD. 2002. "National Accounts & Historical Statistics 2002." OECD Historical
Statistics 1970/2000 2001 Edition
2002:1 - 167.
Peltzman, Sam. 1980. "The Growth of Government." Journal of Law and Economics
23:209-288.
Peterson, Paul E. and Mark C. Rom. 1990. Welfare Magnets: A New Case for a National
Standard
. Washington, D. C.: The Brookings Institute.
Rodrik, Dani. 1998. "Why do more open economies have bigger governments?" The
Journal of Political Economy
106:997-1032.
Romer, Paul M. 1986. "Increasing Returns and Long Run Growth." Journal of Political
Economy
94:1002-1037.
—. 1990. "Endogenous Technological Change." Journal of Political Economy 98:71-102.
Rothstein, Bo and Anders Lindbom. 2004. "The Mysterious Survival of the
Scandinavian Welfare States." Paper presented at the annual meeting of the
American Political Science Association 2004, Chicago
.
Sinn, Hans Werner. 1997. "The Selection Principle and Market Failure in Systems
Competition." Journal of Public Economics 66:247-274.
—. 2004. "The New Systems Competition." Perspectiven der Wirtschaftspolitik 5:23-38.
Snower, Dennis J. 1993. "The Future of the Welfare State." The Economic Journal
103:700-717.
Strange, Susan. 1996. The Retreat of the State: The Diffusion of Power in the World
Economy
. Cambridge: Cambridge University Press.
Swank, Duane. 2002. Global Capital, Political Institutions, and Policy Change in Developed
Welfare States
. Cambridge: Cambridge University Press.
Timonen, Virpi. 2001. "Earning Welfare Citizenship: Welfare State Reform in Finland
and Sweden." Pp. 29-51 in Welfare States Under Pressure, edited by P. Taylor-
Gooby. London: Sage Publications.
Titmuss, Richard A. 1974. Social Policy. London: Allen and Unwin.
Wyszukiwarka
Podobne podstrony:
the role of interpersonal trust for enterpreneurial exchange in a trnsition economy
Baranowska, Magdalena; Kulesza, Mariusz The role of national minorities in the economic growth of t
Newell, Shanks On the Role of Recognition in Decision Making
Morimoto, Iida, Sakagami The role of refections from behind the listener in spatial reflection
86 1225 1236 Machinability of Martensitic Steels in Milling and the Role of Hardness
the role of women XTRFO2QO36SL46EPVBQIL4VWAM2XRN2VFIDSWYY
Illiad, The Role of Greek Gods in the Novel
The Role of the Teacher in Methods (1)
THE ROLE OF CATHARSISI IN RENAISSANCE PLAYS - Wstęp do literaturoznastwa, FILOLOGIA ANGIELSKA
The Role of Women in the Church
The Role of the Teacher in Teaching Methods
The role of the Victorian woman
the role of the victorian woman 2YEN3FEPRXWLO7M54JRW7LEE3Z4EI2JP533IAAA
the role of women
[13]Role of oxidative stress and protein oxidation in the aging process
The Role of The Japanese Emperor in the Meiji Restoration
więcej podobnych podstron