
Fluorescent proteins as a toolkit for
in vivo imaging
Dmitriy M. Chudakov, Sergey Lukyanov and Konstantin A. Lukyanov
Institute of Bioorganic Chemistry, Russian Academy of Sciences, Miklukho-Maklaya 16/10, Moscow 117997, Russia
Green fluorescent protein (GFP) from the jellyfish
Aequorea victoria, and its mutant variants, are the only
fully genetically encoded fluorescent probes available
and they have proved to be excellent tools for labeling
living specimens. Since 1999, numerous GFP homo-
logues have been discovered in Anthozoa, Hydrozoa and
Copepoda species, demonstrating the broad evolution-
ary and spectral diversity of this protein family.
Mutagenic studies gave rise to diversified and optimized
variants of fluorescent proteins, which have never been
encountered in nature. This article gives an overview of
the GFP-like proteins developed to date and their most
common applications to study living specimens using
fluorescence microscopy.
Introduction
Today, fluorescent labeling is of paramount importance to
biological studies and a great number of chemical dyes are
used extensively to label biological specimens; however,
these dyes must be added exogenously, which can be
incompatible with living systems. For such applications,
genetically encoded fluorophores – members of the GFP
family – are more suitable. These fluorescent proteins
(FPs) are comprised of b-barrels of w25 kDa and require
no external cofactors (except oxygen) to form the
chromophore within the protein globule. Thus, standard
genetic-engineering techniques make it possible to label
proteins, subcellular compartments, cells of interest
and specific tissue-regions using the protein expression
system of the cell.
GFP was discovered more than 40 years ago
, but it
was not until 1994, after cloning
and successful
heterologous expression of the gfp gene (GenBank
accession no. U17997)
, that this protein attracted
attention. GFP and its mutants soon became popular tools
for cell and molecular biology and, during the past few
years, the great spectral and phylogenetic diversity of
GFP-like proteins has been characterized in marine
organisms; furthermore, several useful mutant variants
of FPs have been generated. Consequently, a panel of
fluorescent proteins is now available that covers almost
the whole visible spectrum, each possessing different
biochemical characteristics. The development of various
sophisticated FPs, such as photoactivatable FPs
,
Timer
, a series of fluorescent sensors
and
split GFPs
has opened up novel applications for
in vivo fluorescent labeling, such as: studies of protein-
expression; -interaction; -activity; -movement; and -turn-
over; direct measurement of cell parameters and state;
organelle function; and cell motility studies.
Evolutionary diversity
Four decades ago, GFP was discovered in the hydroid
jellyfish Aequorea victoria
where it acts as a
secondary emitter in a bioluminescent system based on
the Ca
2C
-dependent photoprotein aequorin
. Although
some other bioluminescent Cnidaria contain GFPs
bioluminescence and GFP-based coloration are generally
independent phenomena: not only do the overwhelming
majority of bioluminescent organisms lack GFPs, but also
most animals expressing GFP homologues are non-
bioluminescent.
Until recently, GFP-like proteins were identified in only
two classes of Cnidaria: Hydrozoa (hydroid polyps and
medusae) and Anthozoa (scleractinian corals, sea ane-
mones, sea pens). These use GFP-like proteins extensively
for fluorescent and non-fluorescent body coloration, and in
some cases, in their bioluminescent systems (
).
Recently, we have reported several GFPs derived from
evolutionary-distant marine organisms of the Pontellidae
species. (Arthropoda: Crustacea: Maxillopoda: Copepoda:
Pontellidae)
; paradoxically, although many copepods
are bioluminescent, those that contain GFPs are not. Visual
mate-recognition can be important in Pontellidae, which
typically show sexual dimorphism in their eye design
; therefore, pronounced differences in fluorescence
localization between the species indicate that Pontellidae
GFPs might have a role in the recognition of potential mates.
The phylogenetic distribution of the GFP family is
unusual because Cnidaria and Arthropoda are very
distant groups in evolutionary terms. Excluding direct
horizontal-gene-transfer from jellies or corals to copepods,
it can only be concluded that GFP-like proteins evolved
before the separation of Bilateria and Cnidaria and thus
almost every animal taxon can potentially contain GFP
homologs. Remarkably, a close structural homolog of GFP,
a protein-binding domain of nidogen
and related
Bilateria-derived proteins, probably belong to the same
gene superfamily as GFP. The whole evolution of this
putative superfamily requires further investigation.
Color diversity
The natural diversity of the spectral properties of GFP-
like proteins was first discovered in non-bioluminescent
Corresponding author: Lukyanov, K.A. (kluk@ibch.ru).
Review
TRENDS in Biotechnology
Vol.23 No.12 December 2005
0167-7799/$ - see front matter Q 2005 Elsevier Ltd. All rights reserved. doi:10.1016/j.tibtech.2005.10.005
Anthozoa species
. Five main color classes have
been identified: cyan, green, yellow and orange-red, in
addition to non-fluorescent purple-blue chromoproteins.
Recently, a yellow FP and a purple chromoprotein were
also cloned from Hydrozoa jellyfishes
revealing a
similar spectral diversity to that of Anthozoa GFP-like
proteins. In Copepoda, only green FPs have been found to
date
. Together with engineered mutant variants, FPs
are now available for the entire visible spectrum: from
w450 to 650 nm (
a).
In parallel with the development of new FPs from
different sources, considerable progress has been made
in the improvement of Aequorea victoria GFP cyan- and
yellow-shifted mutants (CFP and YFP, respectively) and
faster maturating, less chloride- and pH-sensitive yellow
mutant variants, Venus and Citrine, have been described
A
bright
cyan-fluorescent-protein
named
Cerulean was also developed
Furthermore, improvements are constantly being made
across the spectrum of existing FPs. In the orange–red
part of the visible spectrum, the palette has been recently
expanded by the inclusion of the true yellow phiYFP
orange mKO1
and a whole series of monomeric
mutant variants of DsRed
. A novel green-FP – the
non-aggregating mutant of fast maturating Copepoda
GFP – named TurboGFP (Evrogen,
),
and the monomeric mutant mAG1 (Azami Green)
of
Galaxeidae coral GFP have also been produced recently.
The blue fluorescent variants of Aequorea victoria GFP,
reported to date, are characterized with low brightness
and low photostability
. Alternatively, a photoswitch-
able protein, PS-CFP2, can be used for labeling in the blue
Chordata
Echinodermata
Ctenophora
Porifera
?
?
?
?
?
Mollusca
Annelida
Nematoda
Cnidaria
Hydrozoa
Anthozoa
Crustacea
Arthropoda
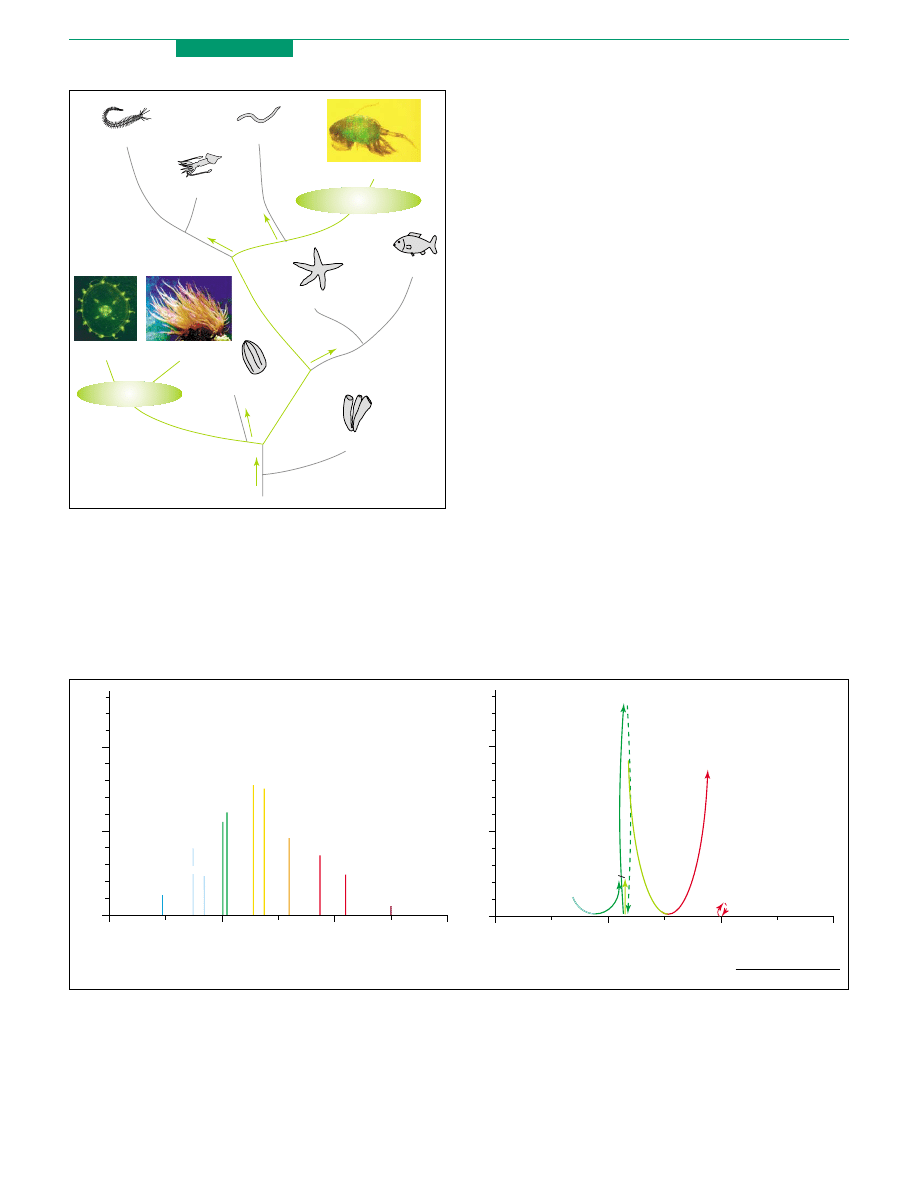
Figure 1. Positional relationship of the fluorescent protein-producing organisms on
the phylogenetic tree. The phyla Cnidaria and Arthropoda (where GFP genes were
found) and the branches connecting these phyla are highlighted in green. Photos
show organisms representative of each phylum expressing GFP-like proteins:
jellyfish Phialidium showing yellow fluorescence; sea anemone Anemonia sulcata
with purple tentacle tips; and a copepod displaying green fluorescence. Question
marks indicate possible, but unexplored, pathways of the evolution of FPs.
400
1
2
500
Cerulean
EBFP
mAG1
TurboGFP
phiYFP
Venus
DsRed2
mKo1
mCherry
mPlum
Fluorescence intensity
600
700
AmCyan1
400
PS-CFP2
KFP1
mEosFP
Dronpa
1
2
500
Wavelength, nm
Fluorescence intensity
600
700
PA-GFP
TRENDS in Biotechnology
Wavelength, nm
(a)
(b)
Figure 2. Spectral diversity of fluorescent proteins. (a) Emission maxima (x-axis) and relative brightness (y-axis) of some fluorescent proteins, shown as vertical lines.
(b) Emission changes in photoactivatable fluorescent proteins. The start- and end-points of the arrow indicate the relative brightness and emission maximum of the
corresponding protein before and after photoactivation. For both panels, fluorescence brightness values were estimated as a product of extinction coefficient and quantum
yield taken from original publications for each protein and normalized per EGFP brightness (extinction coefficient 55 000 M
K
1
cm
K
1
, quantum yield 0.6
). EBFP – enhanced
blue fluorescent mutant of A. victoria GFP
; Cerulean – improved ECFP
; AmCyan1 – enhanced Anemonia majano cyan fluorescent protein (Clontech); TurboGFP – non-
aggregating mutant of copepod green fluorescent protein (Evrogen); mAG1 – Azami Green, monomeric mutant of Galaxeidae green fluorescent protein
(MBL
International); Venus – improved EYFP
; phiYFP – enhanced variant of Phialidium yellow fluorescent protein (Evrogen); mKO1 – Kusabira Orange, monomeric mutant of
Fungia concinna orange fluorescent protein
(MBL International); DsRed2 – nonaggregating mutant of Discosoma red fluorescent protein
(Clontech); mCherry
and mPlum
– monomeric mutants of Discosoma red fluorescent protein. PS-CFP2 – monomeric photoswitchable cyan fluorescent protein (Evrogen);
Dronpa – monomeric reversibly photoactivatable green fluorescent protein
(MBL International); PA-GFP – monomeric photoactivatable fluorescent protein
; mEosFP
– monomeric mutant of EosFP; Lobophyllia hemprichii green-to-red photoconvertible protein
; KFP1 – kindling fluorescent protein
.
Review
TRENDS in Biotechnology
Vol.23 No.12 December 2005
606

part of the visible spectrum (
b). Photoactivation of
this cyan FP demands very intense (400 nm) light
irradiation; therefore, at conventional light intensities
that cause zero or negligible photoactivation, it can
be
used
as
a
routine
violet-light-excited
blue-
cyan fluorophore.
Great efforts are being made to find or create FPs as
far-red-shifted as possible. The provision of these will
expand the palette of fluorescent proteins available and
improve efficiency as light-scattering intensity drops off as
the wavelength increases. Furthermore, these will provide
a spectral window favorable for tissue light-penetration
(w650–1100 nm): determined by the efficiency of photon
absorption, with shorter wavelengths absorbed by blood
hemoglobin, and longer wavelengths by water. This will
make them suitable for whole-body mapping and other
medical applications. A natural FP emitting at 611 nm
was cloned from Entacmea quadricolor
and a more
far-red fluorescent mutant, HcRed (emission maximum:
645 nm), was developed from a non-fluorescent red-
absorbing chromoprotein
. Recently, a monomeric
far-red FP named mPlum that fluoresces at 649 nm was
created on the basis of the natural red FP DsRed
.
Despite these advances, there are still no FPs that cover
the 650–700 nm wavelengths.
The spectral diversity of FPs allows easy visualization
of up to 4–5 colors simultaneously, for example, a
combination of Cerulean (excitation/emission maxima:
433/475 nm), Venus (515/528 nm), mStrawberry
(574/596 nm) and mPlum (590/649 nm) is possible. Alter-
natively, a combination of PS-CFP2 (excitation/emission
maxima: 400/468 nm), one of the green FPs (w490/
510 nm), phiYFP (525/537 nm) or mKO1 (548/559 nm),
mStrawberry (574/596 nm) and mPlum (590/649 nm) can
also be applied.
Applications
FPs are widely used as noninvasive probes to study
different biological models – from individual cells to whole
organisms. The use of FPs enable the tracking of every
step of the protein of interest: expression, localization,
movement, interaction and activity in the cell, tissue or
organism. The main applications of FPs are: visualization
of target-gene promoter up- and down-regulation, protein
labeling, detection of protein–protein interactions, track-
ing protein movement and monitoring cellular parameters
using FP-based fluorescent sensors.
Monitoring of gene expression
Detection of promoter activity is perhaps the simplest of
FP applications. The gene encoding a FP is cloned under
the control of the target promoter, whereby activity of the
promoter can be monitored by the magnitude of the
fluorescent signal (
). While this approach has a
reduced sensitivity compared with enzyme-based assays,
it has certain advantages and a much wider range of
applications when using specially designed FP variants.
The oligomeric state of an FP is important when
applied to protein labeling but it does not have a negative
effect on monitoring of promoter activity. Therefore, many
new FPs are suitable for these applications, making it
possible to detect the activity of several different
promoters with up to 4–5 distinct fluorescent colors,
simultaneously.
Moreover, FPs allow time-scale monitoring of promoter
activity. The first approach is to use destabilized FPs
(i.e. proteins with short turnover)
to obtain a
fluorescent signal only during the period of promoter
activity. Here, fast-maturating FPs are desirable to
provide a minimal delay between the promoter activation
and fluorescent signal appearance. The second approach is
to use the so-called Timer FP, which is capable of a gradual
change in fluorescence color over time – from blue to
green, and then to red
; therefore Timer provides
retrospective information about the length of time the
promoter is active.
Recently, a novel technique to detect promoter activity
has been developed using a so-called split FP. This is a FP
expressed as two separate parts but capable of recon-
stituting to the whole functional protein when cloned
under two promoters of interest; the fluorescent signal
occurs only when both promoters are active. Moreover, by
combining separate halves, each carrying point mutations
responsible for spectral shifts, one can obtain information
about the combinations of promoters of interest active in a
system
Protein labeling and FP oligomeric state
The most widely used FP application is probably protein
tagging, achieved by cloning a FP in frame with the target
protein at either its N- or C-terminus (
Numerous experiments with GFP mutants have demon-
strated that most fusion proteins created this way are
fully functional; however, in each particular case, the
researcher must determine whether the function of the
FP-tagged protein remains natural.
The formation of oligomers is the Achilles’ heel for the
majority of the GFP-like proteins cloned to date, most of
which are tetrameric. An oligomeric state becomes crucial
when fusing GFP-like proteins to a protein of interest and,
in most cases, attempts to use tetrameric FPs to label
cellular proteins result in aggregation of the chimera and
disturbance to the target protein function and localization.
Indeed, it should be taken as a stroke of good fortune that
the first cloned fluorescent protein, Aequorea victoria GFP,
is essentially monomeric. Dimerization of this protein, or
of its mutants, is very weak (negligible for most
applications) and this can be eliminated by point
mutations, as was shown for CFP and YFP
.
Although several other solutions have been proposed to
avoid this complication
, the answer lies in
developing monomeric FPs with the desired spectral
characteristics.
Consequently,
several
monomeric
variants have been generated by extensive mutagenesis
of naturally tetrameric FPs. As a result, monomeric
orange, red and far-red FPs, as well as novel photo-
activatable FPs, have been made available
Photoactivatable fluorescent proteins
Over the past few years, considerable progress has been
made in developing the so-called photoactivatable FPs.
These proteins are capable of a many-fold increase in
Review
TRENDS in Biotechnology
Vol.23 No.12 December 2005
607
fluorescence intensity at certain excitation/emission
wavelengths, in response to irradiation with specific
light. This property can be used to ‘switch-on’ a fluorescent
signal, using a beam of focused light, and then track the
movement of labeled cells, organelles or individual
proteins. Until recently, photobleaching techniques
,
such as fluorescence recovery after photobleaching
(FRAP) or fluorescence loss in photobleaching (FLIP),
were the major tools to study protein mobility. Photo-
activatable FPs provide a more precise, direct and less
damaging way to study movement of proteins.
Several distinct types of photoactivation have been
described (
b). The first photoactivatable protein
reported, PA-GFP, is a mutant of Aequorea victoria GFP,
capable of a 100-fold increase in green fluorescence at
517 nm (excitation maximum: 500 nm) in response to
irradiation with UV to violet light (350–420 nm)
the basis for this photoconversion is the transition of the
protonated chromophore to a deprotonated form. The
same mechanism probably underlies photoactivation of
cyan fluorescent PS-CFP
, a mutant of a colorless
monomeric GFP-like protein cloned from Aequorea coer-
ulescens
. Upon intense (400 nm) light irradiation,
both the fluorescence excitation and emission of PS-CFP
change, resulting in a conversion from a cyan (emission
maximum: 468 nm) to a green (emission maximum:
511 nm) fluorescent form
. Optical contrast between
the non-activated and activated states (i.e. change of the
green-to-cyan fluorescence ratio) reaches 1500-fold for
PS-CFP and 2000-fold for its improved version, PS-CFP2.
The development of another group of photoactivatable
proteins was possible following the discovery of a natural
Target
promoter
Studying promoters
Protein labeling
Studying protein
interactions
Fluorescent
protein
Fluorescent
protein
Fluorescent
protein 1
FRET
+
No FRET
Fluorescent
protein 2
Target
protein
Target
protein 1
Target
protein 2
More colors
TRENDS in Biotechnology
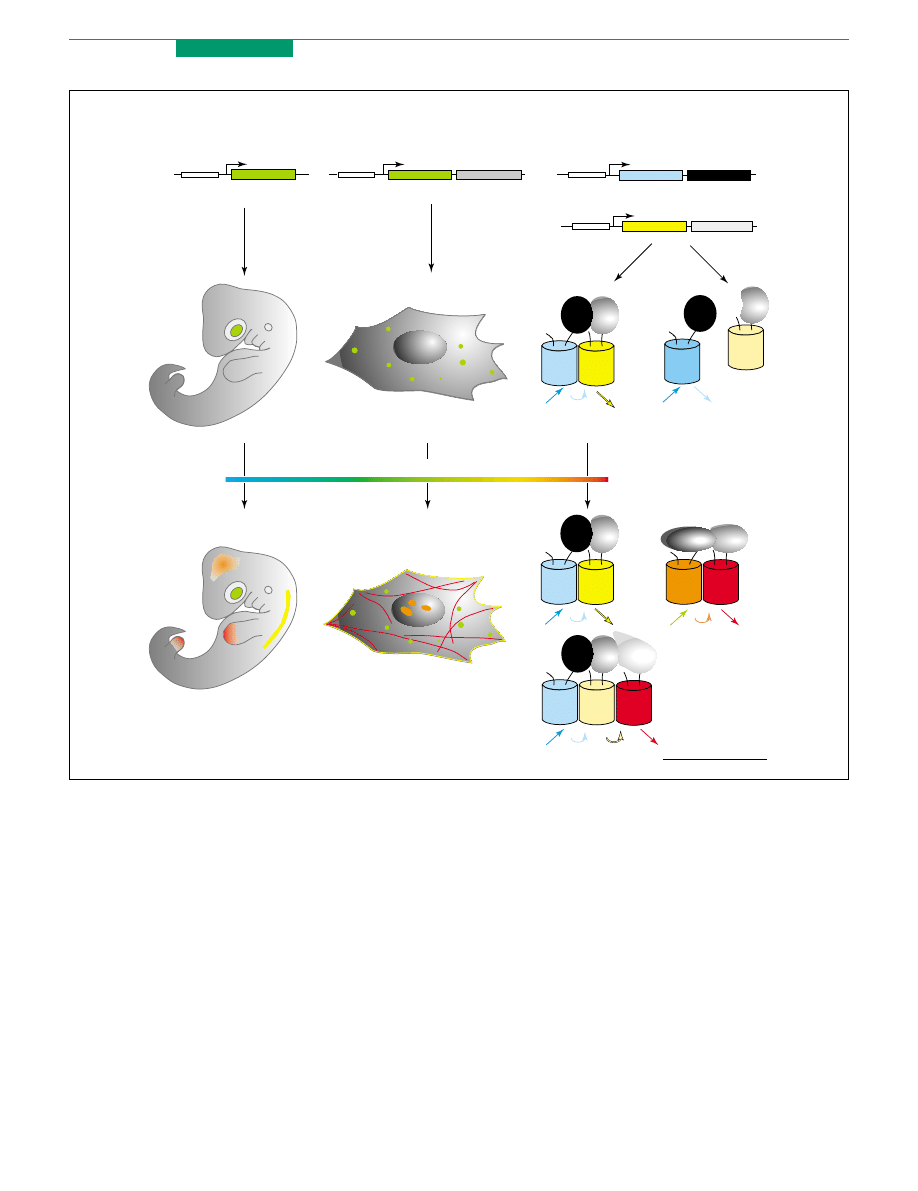
Figure 3. Applications of fluorescent proteins. Investigation of gene promoter activation (left), protein labeling (middle) and detection of protein–protein interactions using
FRET (right) are shown schematically. DNA constructs for protein expression in living objects are shown in the upper part. Visualization of green fluorescent signal in an
organism or cell is presented in the middle part. Multicolor labeling is shown at the bottom. To illustrate FRET-based detection of protein–protein interactions, fluorescent
proteins and target proteins are shown as colored barrels and gray or black ovals, respectively.
Review
TRENDS in Biotechnology
Vol.23 No.12 December 2005
608

green-to-red photoconvertible protein named Kaede,
obtained from the stony coral Trachyphyllia
. In the
dark, this protein matures to a green-fluorescent state;
then, following a brief irradiation of this green form with
UV–violet light, it undergoes an irreversible transition
to the red-fluorescent state. Optical contrast between the
Kaede ground- and activated-states (i.e. change of
the red-to-green fluorescence ratio) reaches more than
2000-fold. Whereas Kaede is a tetrameric protein, the
recently described mEosFP is a Kaede-like monomeric
mutant, making it suitable for protein photolabeling and
tracking
Reversible photoactivation is a characteristic of
another group, derived from a non-fluorescent chromo-
protein obtained from the sea anemone Anemonia sulcata,
which is naturally capable of photoactivation
. A
kindling fluorescent protein (KFP1), and other photo-
activatable variants, have been developed subsequently
. In response to irradiation with green light, KFP1 red
fluorescence (emission maximum: 600 nm) increases
70-fold. Upon more intense green-light irradiation, KFP1
undergoes irreversible photoconversion, making it the
only known protein that can be photoactivated either
reversibly or irreversibly.
While KFP1 and similar reported proteins are tetra-
meric, a reversibly photoactivatable monomeric protein,
named Dronpa, was developed recently
. Dronpa is a
bright green FP that can be quenched by irradiation with
intense blue-light and converted back to the fluorescent
state with a pulse of UV–violet light. In a similar way to
that of Anemonia sulcata, Dronpa photoconversion can be
repeated many times with a minimal loss in fluorescence
intensity; therefore, reversibly photoactivatable fluore-
scent proteins can be used for multiple ‘label and track’
events, providing a detailed map of protein movement
within a single cell.
Besides photolabeling and tracking experiments, the
ability to switch fluorescence using a beam of light opens
up novel possibilities to develop advanced microscopy
techniques, which combine photoactivation with fluor-
escence resonance energy transfer (FRET), biolumines-
cence resonance energy transfer (BRET), and various
other established protocols.
Detection of protein–protein interactions
The spatial resolution of light microscopy is too low to
indicate whether two differently labeled proteins interact
or just co-localize in a cellular compartment. To detect
protein interactions in a living cell, methods based on
FRET are widely used. FRET is the non-radiative transfer
of energy from an excited donor fluorophore to an acceptor
fluorophore, which is in close (!10 nm) proximity to the
donor and has an excitation spectrum that overlaps with
the donor emission spectrum. Because FRET results in the
quenching of the donor fluorescence and enhanced
fluorescence of the acceptor, this effect can be used to
track the interaction of two proteins of interest when they
are fused with FPs of different colors by monitoring the
changes in the ratio of acceptor–donor fluorescence
intensity (
). This approach is widely used,
both for the study of protein interactions, and for
the development of FRET-based genetically encoded
fluorescent sensors
The development of novel color FP variants
will considerably extend the scope of FRET-based
techniques. Expansion of the palette of monomeric FPs
makes it possible to distinguish between two FRET
pairs within a single cell and to monitor the interaction of
several proteins simultaneously. Moreover, it allows the
application of a three-fluorophore FRET to reveal ternary
interactions within a single complex
Fluorescence lifetime imaging microscopy (FLIM) is an
advanced method of FRET detection
, whereby
protein–protein interactions can be studied by measuring
the lifetime of donor fluorescence, which decreases during
FRET because of a higher probability of energy transfer
for the longer-lived excited states. By contrast to filter-
based FRET measurements, FLIM is independent of the
fluorophore concentrations and photobleaching. It is
becoming widely used because of the expansion of the
FPs available and advances in microscopy techniques.
Another recently proposed method to measure FRET is
fluorescence polarization microscopy
. In the absence
of FRET, the fluorescence emission from the donor FP is
highly polarized because of its relatively large size and
slow rotation, whereas in the presence of FRET, the
fluorescence emission is depolarized, enabling FRET
detection with a high dynamic range.
Recently, an approach to detect protein–protein inter-
actions, based on the reassembly of split FP fragments,
has been proposed as an alternative to FRET
. In
brief, FPs can be split into two non-overlapping fragments
comprising their N- and C-terminal halves. When fused to
proteins of interest and co-expressed, these halves will
reassemble to form a functional FP upon interaction, if
any, of the target proteins. As the reassembly is
irreversible, this complementation assay could be useful
in detecting transient interactions.
Genetically encoded sensors
Currently, efforts are targeted at developing genetically
encoded fluorescent sensors to detect various analytes
(Ca
2C
, pH, Cl
–
, membrane potential, specific proteins,
etc.), or to measure the activity of specific enzymes. By
contrast to adding chemical probes exogenously, these
sensors can be expressed within a stable cell-line or
transgenic animal, targeted at a specific organelle in a cell
or expressed within a specific tissue in an animal, thus
expanding the possibilities for cell, developmental and
physiological studies and for high-throughput screening.
Eventually, it is hoped that such sensors can be developed
for all analytes or molecular events. Current GFP-based
genetically encoded sensors can be divided into three
types:
Sensors employing a single FP molecule
This type of sensor includes single FPs, fluorescence
brightness (
a), spectrum (
b), or locali-
zation; all of which are sensitive to the environment in a
living cell. Depending on the protonation of the chromo-
phore, the fluorescence brightness or spectrum of GFP
can be pH sensitive
and several mutant variants of
Review
TRENDS in Biotechnology
Vol.23 No.12 December 2005
609

GFP – synapto-pHluorin
, deGFPs
,
mtAlpHi
– demonstrate essential pH-dependent spec-
tral changes. Furthermore, Cl
–
sensitivity was observed in
some of the yellow FP mutant variants
. Redox-sensitive
GFPs, with surface-exposed residues replaced by cysteines
, can be also added to this group.
Several single FP-based sensors have been generated,
which are capable of translocation between cell compart-
ments upon certain types of stimulation or intracellular
events
. Here, the fluorescence emission of the sensor
is invariable, while its localization within a cell serves as a
reporter for the intracellular events, for example, a
fluorescent mitosis sensor
translocates from the
nucleus to the plasma membrane upon prometaphase-
associated nuclear envelope breakdown.
Sensors representing chimeric constructs between
single FP and analyte detector protein(s)
In this approach, GFP is fused to a detector protein, which
undergoes structural rearrangement in the presence of
the analyte. This rearrangement forces a rearrangement
of GFP, causing changes to its fluorescent properties
(
c,d). Such sensors can be constructed by
combining a FP with a detector protein (e.g. Flash – a
membrane potential sensor constructed by inserting GFP
into a voltage-dependent Shaker K
C
channel
); by
inserting detector domains into a FP (e.g. the Ca
2C
sensors termed Camgaroo
with calmodulin inser-
tion); fusing detector domains to the so-called ‘circularly
permuted’ FP (e.g. Pericam
, GCaMP
– calmodulin
and M13 peptide fusion, MAPK activity sensor
); or
constructing other chimeric variants
. The most widely
used approach employs circular permutation of an FP,
which requires construction of a protein with novel N- and
C-termini, while the native termini are united using a
flexible linker. Permutation of a FP places fusion-sensitive
domains closer to the chromophore, thus facilitating the
transmission of any conformational changes to the
chromophore environment. For example, the GCaMP
calcium sensor was constructed by fusing Calmodulin
and the M13 peptide to a circularly permuted GFP. In the
presence of Ca
2C
, calmodulin binds to the M13 peptide,
causing conformational changes in the vicinity of the
chromophore and thus influencing the GFP fluorescence.
Interestingly, fusion of Aequorea victoria GFP with the
Aequorea victoria photoprotein aequorin produced a
ready-to-use calcium sensor, which can also be added to
this group. It was discovered that the GFP fluorescence
excitation spectrum is influenced by aequorin in a Ca
2C
-
dependent manner
Sensors based on the FRET effect between two FPs
in the constructs including one or several detector
proteins or peptides
In these constructs, changes in the fluorescence emission
spectra are brought about by the changes in FRET
efficiency within a donor–acceptor pair of FPs. In response
to the binding of a particular ligand, or upon specific
modification, the intramolecular interaction of domains
leads to a change in the spatial orientation and distance
between the FPs, resulting in visible changes in the FRET
effect (
e,f). For example, the Cameleon sensor
comprises CFP-calmodulin bound to YFP-M13 peptide in
the presence of Ca
2C
ions, thus increasing FRET between
CFP and YFP when complexed
. FRET-based sensors
have also been developed for measuring kinase activity
, glucose
, maltose
, cAMP
, cGMP
and chloride
. Because the principal of sensor
construction is relatively simple and reliable, this list
is growing rapidly
. In addition, FRET-based
protease assays using FPs have been developed
as well as assays that use a combination of a chemical
probe and an FP
. The maximum dynamic range of this
sensor group is limited by the FRET efficiency and
depends on the FP–FRET pairs available. Significant
progress in the development of FP–FRET pairs has been
achieved
, with further progress in
FRET-based sensor design anticipated.
In general, the GFP-based genetically encoded sensors
developed thus far have a significant limitation because
of their low dynamic range: routinely, this range lies
between 1.1 and w3–5-fold
. The FRET-based indi-
cator with the highest contrast is the calcium sensor
YC3.60
, with a 6.6-fold change in ratiometric
fluorescence. Some of the circularly permuted GFP-
based calcium sensors are reported to reach a maximum
of 8–10-fold contrast; although this increase is essentially
diminished by the low pH-stability of these sensors
. This level of sensitivity is insufficient for high-
throughput screening and reliable single-cell measure-
ments – a recent comparison, in neurons, between several
FP-based calcium sensors and a chemical probe showed
that a higher dynamic range was achieved using the
probe
Photoactivatable proteins, however, are capable of
w100–2000-fold change in fluorescence; these changes
probably occur as a result of the rearrangement of the
chromophore
, the surrounding amino acids
and
the network of hydrogen bonds around the chromophore
. Because sensors based on a single FP fused to a
sensitive domain induce rearrangements in the chromo-
phore surroundings, the possibility exists of creating
Sensitive
fluorescent
protein
(a)
(b)
(c)
(d)
(e)
(f)
Fluorescent protein
with sensitive
domain(s)
FRET pair of fluorescent
proteins with sensitive
domain(s)
TRENDS in Biotechnology
Figure 4. Main types of genetically encoded fluorescent sensors. Fluorescent
proteins and sensitive domains are shown as colored barrels and gray ovals,
respectively. (a,b) Sensors based on a single fluorescent protein that changes
brightness (a) or emission color (b) depending on the environment. (c,d) Sensors
based on a circularly permuted fluorescent protein fused to sensitive domains (c) or
fluorescent protein with an inserted sensitive domain (d). (e,f) Sensors based on
FRET between two fluorescent proteins fused to sensitive domain(s).
Review
TRENDS in Biotechnology
Vol.23 No.12 December 2005
610

high-contrast genetically encoded sensors and this
remains an important task for the future.
Another disadvantage of sensor application is that the
high level of expression necessary for reliable visualiza-
tion can interfere with the normal functions of the cell.
The sensitive domains fused to FPs in genetically encoded
sensors are commonly functional enzymes, domains
binding an analyte of interest or substrates modified by
cellular enzymes. In all these cases, the sensor influences
cell biochemistry either through its enzymatic activity, its
buffering effect, or by competing with an endogenous
substrate
. To minimize the influence of the sensor, it
should be targeted to points in the biochemical pathways
where it will be adequately diluted by endogenous
molecules. Obviously, high brightness and photostability
of a fluorescent sensor provide for better visualization at
lower expression levels and, therefore, these are also
highly desirable features of the future FP sensors.
Fluorescent proteins on the market
Several years ago, Clontech (
) was the
only company to supply plasmids encoding fluorescent
proteins – mutants of Aequorea victoria GFP. This situation
changed drastically in terms of both the number of different
fluorescent proteins available and ‘demonopolization’ of
the market. Today, an increasing number of companies are
offering fluorescent proteins of different colors, photoacti-
vatable fluorescent proteins and destabilized FPs (
suitable for a wide range of applications.
Concluding remarks
In summary, the wide palette of available FPs, and their
sophisticated variants, form the basis of a huge number
of fluorescent assays and multi-parameter imaging.
At the cellular level, FPs can provide information about
promoter activity, protein-localization, -motility, -activity
and interactions with other proteins, organelle movement,
continuity, fusion and fission events and analyte concen-
tration. At the organism level, FPs can give precise
information about the movement of cells in a tissue,
during metastasis, morphogenesis and inflammatory
processes. Design of novel FPs, along with significant
progress in whole-body imaging techniques
, provide
for multicolor labeling of cells and tissues, as well as
monitoring of promoter activity and cellular parameters in
living transgenic animals.
It is hoped that the next generation of FPs will include
bright far-red or even infrared FPs for use in whole-body
imaging and other clinical applications – for example,
tumor visualization
. Additionally, novel bright and
monomeric fluorescent markers in the blue region of the
visible spectrum are in high demand because they would
expand the scope for multicolor labeling and FRET
applications. High-sensitivity applications require novel
monomeric
photoactivatable
fluorescent
proteins,
especially in the red part of the visible spectrum, whereas
high-contrast FP-based sensors would be of great use for
reliable measurements of various cellular and tissue
parameters and high-throughput drug screenings.
Extensive research in the development of FPs ensures
that these, and other, objectives will be attained in the
coming years, facilitating studies of living systems and
opening-up possibilities for the clinical application of FPs.
Acknowledgements
We are grateful to Natalia Elina, Maria Bulina and Maria Buzdalina for
the help in manuscript preparation and T.W.J. Gadella for valuable
advice. The authors are supported by grants from European Commission
FP-6 Integrated Project LSHG-CT-2003–503259, Russian Academy of
Sciences for the Molecular and Cell Biology program and from the
National Institutes of Health, GM070358.
Table 1. Commercially available fluorescent proteins
Company
Fluorescent proteins available
Blue, Cyan
Green
Yellow
Red
Photoactivatable
Amaxa
pmaxFP-Green
a
pmaxFP-Yellow
a
pmaxFP-Red
a
(
BD Biosciences Clontech
AmCyan1
AcGFP1
ZsYellow1
DsRed2
(
ZsGreen1
DsRed-Express
DsRed-Monomer
Timer
AsRed2
HcRed1
Evrogen
PS-CFP2
TurboGFP
phiYFP
JRed
KFP-Red
(
PS-CFP2
Invitrogen
BFP
EmGFP
YFP
(
CFP
Lux Biotechnology
RmGFP
(
PtGFP
RrGFP
MBL International
Midoriishi-Cyan
Azami Green
Kusabira-Orange
Dronpa Green
(
Kaede
KikGR
NanoLight Technology
RmGFP
(
)
PtGFP
RrGFP
Promega
Monster Green
(
Stratagene
hrGFP
(
a
pmaxFP-Green, pmaxFP-Yellow, and pmaxFP-Red are other names of TurboGFP, phiYFP, and JRed proteins, respectively.
Review
TRENDS in Biotechnology
Vol.23 No.12 December 2005
611

References
1 Johnson, F.H. et al. (1962) Quantum efficiency of Cypridina
luminescence, with a note on that of Aequorea. J. Cell. Comp. Physiol.
60, 85–104
2 Shimomura, O. et al. (1962) Extraction, purification and properties of
aequorin, a bioluminescent protein from the luminous hydromedusan,
Aequorea. J. Cell. Comp. Physiol. 59, 223–239
3 Prasher, D.C. et al. (1992) Primary structure of the Aequorea victoria
green-fluorescent protein. Gene 111, 229–233
4 Chalfie, M. et al. (1994) Green fluorescent protein as a marker for gene
expression. Science 263, 802–805
5 Patterson, G.H. and Lippincott-Schwartz, J. (2002) A photoactivatable
GFP for selective photolabeling of proteins and cells. Science 297,
1873–1877
6 Ando, R. et al. (2002) An optical marker based on the UV-induced
green-to-red photoconversion of a fluorescent protein. Proc. Natl.
Acad. Sci. U. S. A. 99, 12651–12656
7 Chudakov, D.M. et al. (2003) Kindling fluorescent proteins for precise
in vivo photolabeling. Nat. Biotechnol. 21, 191–194
8 Chudakov, D.M. et al. (2003) Chromophore environment provides clue
to “kindling fluorescent protein” riddle. J. Biol. Chem. 278, 7215–7219
9 Chudakov, D.M. and Lukyanov, K.A. (2003) Use of green fluorescent
protein (GFP) and its homologs for in vivo protein motility studies.
Biochemistry (Mosc.) 68, 952–957
10 Chudakov, D.M. et al. (2004) Photoswitchable cyan fluorescent protein
for protein tracking. Nat. Biotechnol. 22, 1435–1439
11 Wiedenmann, J. et al. (2004) EosFP, a fluorescent marker protein with
UV-inducible green-to-red fluorescence conversion. Proc. Natl. Acad.
Sci. U. S. A. 101, 15905–15910
12 Verkhusha, V.V. and Sorkin, A. (2005) Conversion of the monomeric
red fluorescent protein into a photoactivatable probe. Chem. Biol. 12,
279–285
13 Terskikh, A. et al. (2000) “Fluorescent timer”: protein that changes
color with time. Science 290, 1585–1588
14 Verkhusha, V.V. et al. (2004) Common pathway for the red
chromophore formation in fluorescent proteins and chromoproteins.
Chem. Biol. 11, 845–854
15 Wiegand, U.K. et al. (2003) Red, yellow, green go!–A novel tool for
microscopic segregation of secretory vesicle pools according to their
age. Biochem. Soc. Trans. 31, 851–856
16 Mirabella, R. et al. (2004) Use of the fluorescent timer DsRED-E5 as
reporter to monitor dynamics of gene activity in plants. Plant Physiol.
135, 1879–1887
17 Griesbeck, O. (2004) Fluorescent proteins as sensors for cellular
functions. Curr. Opin. Neurobiol. 14, 636–641
18 Meyer, T. and Teruel, M.N. (2003) Fluorescence imaging of signaling
networks. Trends Cell Biol. 13, 101–106
19 Miyawaki, A. (2003) Visualization of the spatial and temporal
dynamics of intracellular signaling. Dev. Cell 4, 295–305
20 Miyawaki, A. (2003) Fluorescence imaging of physiological activity in
complex systems using GFP-based probes. Curr. Opin. Neurobiol. 13,
591–596
21 Hu, C.D. and Kerppola, T.K. (2003) Simultaneous visualization of
multiple protein interactions in living cells using multicolor fluor-
escence complementation analysis. Nat. Biotechnol. 21, 539–545
22 Zhang, S. et al. (2004) Combinatorial marking of cells and organelles
with reconstituted fluorescent proteins. Cell 119, 137–144
23 Morin, J.G. and Hastings, J.W. (1971) Energy transfer in a
bioluminescent system. J. Cell. Physiol. 77, 313–318
24 Morin, J.G. (1974) Coelenterata bioluminescence. In Coelenterate
Biology: Reviews and New Perspectives (Muscatine, L. and Lenhoff,
H.M., eds), pp. 397–438, Academic Press, New York
25 Shagin, D.A. et al. (2004) GFP-like proteins as ubiquitous metazoan
superfamily: evolution of functional features and structural complex-
ity. Mol. Biol. Evol. 21, 841–850
26 Ohtsuka, S. and Huys, R. (1998) Sexual dimorphism in calanoid
copepods: morphology and function. Hydrobiologia 453-454, 441–466
27 Buskey, E.J. (1998) Components of mating behavior in planktonic
copepods. J. Mar. Syst. 15, 13–21
28 Hopf, M. et al. (2001) Crystal structure and mutational analysis of a
perlecan-binding fragment of nidogen-1. Nat. Struct. Biol. 8, 634–640
29 Matz, M.V. et al. (1999) Fluorescent proteins from nonbioluminescent
Anthozoa species. Nat. Biotechnol. 17, 969–973
30 Lukyanov, K.A. et al. (2000) Natural animal coloration can be
determined by a nonfluorescent green fluorescent protein homolog.
J. Biol. Chem. 275, 25879–25882
31 Griesbeck, O. et al. (2001) Reducing the environmental sensitivity
of yellow fluorescent protein. Mechanism and applications. J. Biol.
Chem. 276, 29188–29194
32 Nagai, T. et al. (2002) A variant of yellow fluorescent protein with fast
and efficient maturation for cell-biological applications. Nat. Biotech-
nol. 20, 87–90
33 Rizzo, M.A. et al. (2004) An improved cyan fluorescent protein variant
useful for FRET. Nat. Biotechnol. 22, 445–449
34 Karasawa, S. et al. (2004) Cyan-emitting and orange-emitting
fluorescent proteins as a donor/acceptor pair for fluorescence
resonance energy transfer. Biochem. J. 381, 307–312
35 Shaner, N.C. et al. (2004) Improved monomeric red, orange and yellow
fluorescent proteins derived from Discosoma sp. red fluorescent
protein. Nat. Biotechnol. 22, 1567–1572
36 Karasawa, S. et al. (2003) A green-emitting fluorescent protein from
Galaxeidae coral and its monomeric version for use in fluorescent
labeling. J. Biol. Chem. 278, 34167–34171
37 Patterson, G. et al. (2001) Fluorescent protein spectra. J. Cell Sci. 114,
837–838
38 Wiedenmann, J. et al. (2002) A far-red fluorescent protein with fast
maturation and reduced oligomerization tendency from Entacmaea
quadricolor (Anthozoa, Actinaria). Proc. Natl. Acad. Sci. U. S. A. 99,
11646–11651
39 Gurskaya, N.G. et al. (2001) GFP-like chromoproteins as a source of
far-red fluorescent proteins. FEBS Lett. 507, 16–20
40 Wang, L. et al. (2004) Evolution of new nonantibody proteins via
iterative somatic hypermutation. Proc. Natl. Acad. Sci. U. S. A. 101,
16745–16749
41 Li, X. et al. (1998) Generation of destabilized green fluorescent protein
as a transcription reporter. J. Biol. Chem. 273, 34970–34975
42 Zacharias, D.A. et al. (2002) Partitioning of lipid-modified monomeric
GFPs into membrane microdomains of live cells. Science 296, 913–916
43 Campbell, R.E. et al. (2002) A monomeric red fluorescent protein. Proc.
Natl. Acad. Sci. U. S. A. 99, 7877–7882
44 Fradkov, A.F. et al. (2002) Far-red fluorescent tag for protein labeling.
Biochem. J. 368, 17–21
45 Bulina, M.E. et al. (2003) Hetero-oligomeric tagging diminishes non-
specific aggregation of target proteins fused with Anthozoa fluorescent
proteins. Biochem. J. 371, 109–114
46 Gavin, P. et al. (2002) An approach for reducing unwanted
oligomerisation of DsRed fusion proteins. Biochem. Biophys. Res.
Commun. 298, 707–713
47 Ando, R. et al. (2004) Regulated fast nucleocytoplasmic shuttling
observed by reversible protein highlighting. Science 306, 1370–1373
48 Lippincott-Schwartz, J. et al. (2003) Photobleaching and photoactiva-
tion: following protein dynamics in living cells. Nat. Cell Biol.Suppl,
S7–S14
49 Gurskaya, N.G. et al. (2003) A colourless green fluorescent protein
homologue from the non-fluorescent hydromedusa Aequorea coer-
ulescens and its fluorescent mutants. Biochem. J. 373, 403–408
50 Nguyen, A.W. and Daugherty, P.S. (2005) Evolutionary optimization
of fluorescent proteins for intracellular FRET. Nat. Biotechnol. 23,
355–360
51 Galperin, E. et al. (2004) Three-chromophore FRET microscopy
to analyze multiprotein interactions in living cells. Nat Methods 1,
209–217
52 He, L. et al. (2005) Determination of tumor necrosis factor receptor-
associated factor trimerization in living cells by CFP-OYFP-OmRFP
FRET detected by flow cytometry. Nucleic Acids Res. 33, e61
53 He, L. et al. (2004) TRAF3 forms heterotrimers with TRAF2 and
modulates its ability to mediate NF-{kappa}B activation. J. Biol.
Chem. 279, 55855–55865
54 Gadella, T.W.J. et al. (1993) Fluorescence lifetime imaging microscopy
(FLIM) - spatial resolutions of microstructures on the nanosecond
time scale. Biophys. Chem. 48, 221–239
55 Lakowicz, J.R. et al. (1992) Fluorescence lifetime imaging of free and
protein-bound NADH. Proc. Natl. Acad. Sci. U. S. A. 89, 1271–1275
56 Harpur, A.G. et al. (2001) Imaging FRET between spectrally similar
GFP molecules in single cells. Nat. Biotechnol. 19, 167–169
Review
TRENDS in Biotechnology
Vol.23 No.12 December 2005
612

57 Rizzo, M.A. and Piston, D.W. (2005) High-contrast imaging of
fluorescent protein FRET by fluorescence polarization microscopy.
Biophys. J. 88, L14–L16
58 Magliery, T.J. et al. (2005) Detecting protein-protein interactions with
a green fluorescent protein fragment reassembly trap: scope and
mechanism. J. Am. Chem. Soc. 127, 146–157
59 Bracha-Drori, K. et al. (2004) Detection of protein-protein interactions
in plants using bimolecular fluorescence complementation. Plant J.
40, 419–427
60 Kneen, M. et al. (1998) Green fluorescent protein as a noninvasive
intracellular pH indicator. Biophys. J. 74, 1591–1599
61 Miesenbock, G. et al. (1998) Visualizing secretion and synaptic
transmission with pH-sensitive green fluorescent proteins. Nature
394, 192–195
62 Yuste, R. et al. (2000) Synapto-pHluorins: chimeras between
pH-sensitive mutants of green fluorescent protein and synaptic
vesicle membrane proteins as reporters of neurotransmitter release.
Methods Enzymol. 327, 522–546
63 McAnaney, T.B. et al. (2002) Green fluorescent protein variants as
ratiometric dual emission pH sensors. 2. Excited-state dynamics.
Biochemistry 41, 15489–15494
64 Hanson, G.T. et al. (2002) Green fluorescent protein variants as
ratiometric dual emission pH sensors. 1. Structural characterization
and preliminary application. Biochemistry 41, 15477–15488
65 Abad, M.F. et al. (2004) Mitochondrial pH monitored by a new
engineered green fluorescent protein mutant. J. Biol. Chem. 279,
11521–11529
66 Wachter, R.M. and Remington, S.J. (1999) Sensitivity of the yellow
variant of green fluorescent protein to halides and nitrate. Curr. Biol.
9, R628–R629
67 Dooley, C.T. et al. (2004) Imaging dynamic redox changes in
mammalian cells with green fluorescent protein indicators. J. Biol.
Chem. 279, 22284–22293
68 Hanson, G.T. et al. (2004) Investigating mitochondrial redox potential
with redox-sensitive green fluorescent protein indicators. J. Biol.
Chem. 279, 13044–13053
69 Jones, J.T. et al. (2004) Probing the precision of the mitotic clock with a
live-cell fluorescent biosensor. Nat. Biotechnol. 22, 306–312
70 Siegel, M.S. and Isacoff, E.Y. (1997) A genetically encoded optical
probe of membrane voltage. Neuron 19, 735–741
71 Guerrero, G. et al. (2002) Tuning FlaSh: redesign of the dynamics,
voltage range, and color of the genetically encoded optical sensor of
membrane potential. Biophys. J. 83, 3607–3618
72 Baird, G.S. et al. (1999) Circular permutation and receptor insertion
within green fluorescent proteins. Proc. Natl. Acad. Sci. U. S. A. 96,
11241–11246
73 Nagai, T. et al. (2001) Circularly permuted green fluorescent
proteins engineered to sense Ca
2C
. Proc. Natl. Acad. Sci. U. S. A.
98, 3197–3202
74 Nakai, J. et al. (2001) A high signal-to-noise Ca(2C) probe composed of
a single green fluorescent protein. Nat. Biotechnol. 19, 137–141
75 Kawai, Y. et al. (2004) Single color fluorescent indicators of protein
phosphorylation for multicolor imaging of intracellular signal flow
dynamics. Anal. Chem. 76, 6144–6149
76 Gorokhovatsky, A.Y. et al. (2004) Fusion of Aequorea victoria GFP and
aequorin provides their Ca(2C)-induced interaction that results in
red shift of GFP absorption and efficient bioluminescence energy
transfer. Biochem. Biophys. Res. Commun. 320, 703–711
77 Miyawaki, A. et al. (1997) Fluorescent indicators for Ca2
C
based on
green fluorescent proteins and calmodulin. Nature 388, 882–887
78 Nagai, Y. et al. (2000) A fluorescent indicator for visualizing cAMP-
induced phosphorylation in vivo. Nat. Biotechnol. 18, 313–316
79 Sato, M. et al. (2002) Fluorescent indicators for imaging protein
phosphorylation in single living cells. Nat. Biotechnol. 20, 287–294
80 Sato, M. and Umezawa, Y. (2004) Imaging protein phosphorylation by
fluorescence in single living cells. Methods 32, 451–455
81 Ting, A.Y. et al. (2001) Genetically encoded fluorescent reporters of
protein tyrosine kinase activities in living cells. Proc. Natl. Acad. Sci.
U. S. A. 98, 15003–15008
82 Zhang, J. et al. (2001) Genetically encoded reporters of protein kinase
A activity reveal impact of substrate tethering. Proc. Natl. Acad. Sci.
U. S. A. 98, 14997–15002
83 Fehr, M. et al. (2003) In vivo imaging of the dynamics of glucose
uptake in the cytosol of COS-7 cells by fluorescent nanosensors.
J. Biol. Chem. 278, 19127–19133
84 Ye, K. and Schultz, J.S. (2003) Genetic engineering of an allosterically
based glucose indicator protein for continuous glucose monitoring by
fluorescence resonance energy transfer. Anal. Chem. 75, 3451–3459
85 Fehr, M. et al. (2002) Visualization of maltose uptake in living yeast
cells by fluorescent nanosensors. Proc. Natl. Acad. Sci. U. S. A. 99,
9846–9851
86 DiPilato, L.M. et al. (2004) Fluorescent indicators of cAMP and Epac
activation reveal differential dynamics of cAMP signaling within
discrete subcellular compartments. Proc. Natl. Acad. Sci. U. S. A. 101,
16513–16518
87 Honda, A. et al. (2001) Spatiotemporal dynamics of guanosine 3
0
,5
0
-
cyclic monophosphate revealed by a genetically encoded, fluorescent
indicator. Proc. Natl. Acad. Sci. U. S. A. 98, 2437–2442
88 Sato, M. et al. (2000) Fluorescent indicators for cyclic GMP based on
cyclic GMP-dependent protein kinase Ialpha and green fluorescent
proteins. Anal. Chem. 72, 5918–5924
89 Kuner, T. and Augustine, G.J. (2000) A genetically encoded
ratiometric indicator for chloride: capturing chloride transients in
cultured hippocampal neurons. Neuron 27, 447–459
90 Nagai, T. and Miyawaki, A. (2004) A high-throughput method for
development of FRET-based indicators for proteolysis. Biochem.
Biophys. Res. Commun. 319, 72–77
91 Hoffmann, C. et al. (2005) A FlAsH-based FRET approach to
determine G protein-coupled receptor activation in living cells. Nat
Methods 2, 171–176
92 Nagai, T. et al. (2004) Expanded dynamic range of fluorescent
indicators for Ca
2C
by circularly permuted yellow fluorescent
proteins. Proc. Natl. Acad. Sci. U. S. A. 101, 10554–10559
93 Pologruto, T.A. et al. (2004) Monitoring neural activity and [Ca2
C
]
with genetically encoded Ca
2C
indicators. J. Neurosci. 24, 9572–9579
94 Quillin, M.L. et al. (2005) Kindling fluorescent protein from Anemonia
sulcata: dark-state structure at 1.38 A
˚ Resolution. Biochemistry 44,
5774–5787
95 Ntziachristos, V. et al. (2005) Looking and listening to light: the
evolution of whole-body photonic imaging. Nat. Biotechnol. 23,
313–320
96 Yu, Y.A. et al. (2003) Optical imaging: bacteria, viruses, and
mammalian cells encoding light-emitting proteins reveal the locations
of primary tumors and metastases in animals. Anal. Bioanal. Chem.
377, 964–972
97 Yanushevich, Y.G. et al. (2002) A strategy for the generation of non-
aggregating mutants of Anthozoa fluorescent proteins. FEBS Lett.
511, 11–14
Reproduction of material from Elsevier articles
Interested in reproducing part or all of an article published by Elsevier, or one of our article figures? If so, please contact our Global Rights
Department with details of how and where the requested material will be used. To submit a permission request on-line, please visit:
http://www.elsevier.com/wps/find/obtainpermissionform.cws_home/obtainpermissionform
Alternatively, please contact:
Elsevier Global Rights Department
Phone: (+44) 1865-843830
permissions@elsevier.com
Review
TRENDS in Biotechnology
Vol.23 No.12 December 2005
613
Document Outline
- Fluorescent proteins as a toolkit for in vivo imaging
- Introduction
- Evolutionary diversity
- Color diversity
- Applications
- Monitoring of gene expression
- Protein labeling and FP oligomeric state
- Photoactivatable fluorescent proteins
- Detection of protein-protein interactions
- Genetically encoded sensors
- Sensors employing a single FP molecule
- Sensors representing chimeric constructs between single FP and analyte detector protein(s)
- Sensors based on the FRET effect between two FPs in the constructs including one or several detector proteins or peptides
- Fluorescent proteins on the market
- Concluding remarks
- Acknowledgements
- References
Wyszukiwarka
Podobne podstrony:
Ionic liquids as solvents for polymerization processes Progress and challenges Progress in Polymer
NI LabVIEW Toolkit for Lego Mindstorms License Agreement English
Formation of a new chromosomes as a virulence mechanism in C glabrata
Outer membrane proteins key players for bacterial adaptation
The Creature as a Reflection for personal Self Destruction
the creature as a reflection for personal self destruction IPNHG57EKFZNLLEVY6OHQDUFE4SCWNGUDOTRKJY
But As a Soldier, For His Count Stephen Goldin
Wheel as a Cult Symbol in the Romano Celtic World
Milk proteins as precursors of bioactive peptides
Askildson, L Effects of Humour in the Language Classroom Humour as a Padagogical Tool in Theory and
Solid phase microextraction as a tool for trace element spec
go and say we are shutting ju jutsu as a mataphor for analysing resistance
Physics Papers Andrei Linde (2003), Testing The Cosmological Constant As A Candidate For Dark Energ
(eBook PDF GUI) Design Patterns as Tools for User Interface Design
Economic evaluation of introduction of poplar as biomass crop in Italy Włochy 2014
więcej podobnych podstron