505
CHAPTER 36
TROPICAL CYCLONES
CAUSES AND DESCRIPTION OF TROPICAL CYCLONES
3600. Introduction
A tropical cyclone is a cyclone originating in the trop-
ics or subtropics. Although it generally resembles the
extratropical cyclone of higher latitudes, there are impor-
tant differences, the principal one being the concentration
of a large amount of energy into a relatively small area.
Tropical cyclones are infrequent in comparison with middle
and high latitude storms, but they have a record of destruc-
tion far exceeding that of any other type of storm. Because
of their fury, and because they are predominantly oceanic,
they merit special attention by mariners.
A tropical storm has a deceptively small size, and
beautiful weather may be experienced only a few hundred
miles from the center. The rapidity with which the weather
can deteriorate with approach of the storm, and the violence
of the fully developed tropical cyclone, are difficult to
imagine if they have not been experienced.
On his second voyage to the New World, Columbus en-
countered a tropical storm. Although his vessels suffered no
damage, this experience proved valuable during his fourth
voyage when his ships were threatened by a fully developed
hurricane. Columbus read the signs of an approaching storm
from the appearance of a southeasterly swell, the direction
of the high cirrus clouds, and the hazy appearance of the at-
mosphere. He directed his vessels to shelter. The
commander of another group, who did not heed the signs,
lost most of his ships and more than 500 men perished.
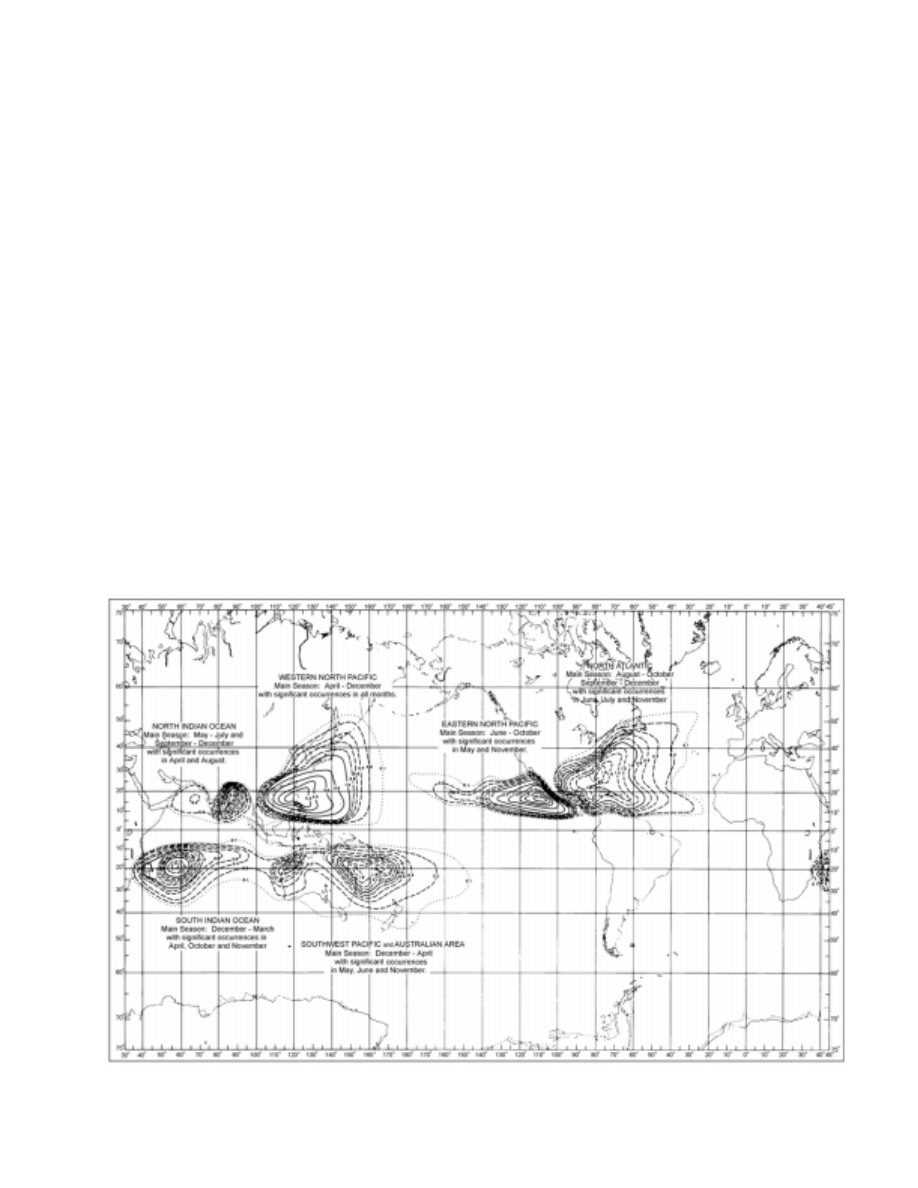
Figure 3602. Areas in which tropical cyclones occur. The average number of tropical cyclones per 5° square has been
analyzed for this figure. The main season for intense tropical storm activity is also shown for each major basin.
506
TROPICAL CYCLONES
3601. Definitions
“Tropical cyclone” is the term for cyclones originating
in the tropics or subtropics. These cyclones are classified by
form and intensity as they increase in size.
A tropical disturbance is a discrete system of appar-
ently organized convection, generally 100 to 300 miles in
diameter, having a nonfrontal migratory character, and hav-
ing maintained its identity for 24 hours or more. It may or
may not be associated with a detectable disturbance of the
wind field. It has no strong winds and no closed isobars i.e.,
isobars that completely enclose the low.
At its next stage of development it becomes a tropical
depression. A tropical depression has one or more closed iso-
bars and some rotary circulation at the surface. The highest
sustained (1-minute mean) surface wind speed is 33 knots.
The next stage is tropical storm. A tropical storm has
closed isobars and a distinct rotary circulation. The highest sus-
tained (1-minute mean) surface wind speed is 34 to 63 knots.
When fully developed, a hurricane or typhoon has
closed isobars, a strong and very pronounced rotary circu-
lation, and a sustained (1-minute mean) surface wind speed
of 64 knots or higher.
3602. Areas Of Occurrence
Tropical cyclones occur almost entirely in six distinct
areas, four in the Northern Hemisphere and two in the
Southern Hemisphere as shown in Figure 3602. The name
by which the tropical cyclone is commonly known varies
somewhat with the locality.
1. North Atlantic. A tropical cyclone with winds of 64
knots or greater is called a hurricane.
2. Eastern North Pacific. The name hurricane is used
as in the North Atlantic.
3. Western North Pacific. A fully developed storm
with winds of 64 knots or greater is called a ty-
phoon or, locally in the Philippines, a baguio.
4. North Indian Ocean. A tropical cyclone with winds
of 34 knots or greater is called a cyclonic storm.
5. South Indian Ocean. A tropical cyclone with winds
of 34 knots or greater is called a cyclone.
6. Southwest Pacific and Australian Area. The name cy-
clone is used as in the South Indian Ocean. A severe
tropical cyclone originating in the Timor Sea and
moving southwest and then southeast across the inte-
rior of northwestern Australia is called a willy-willy.
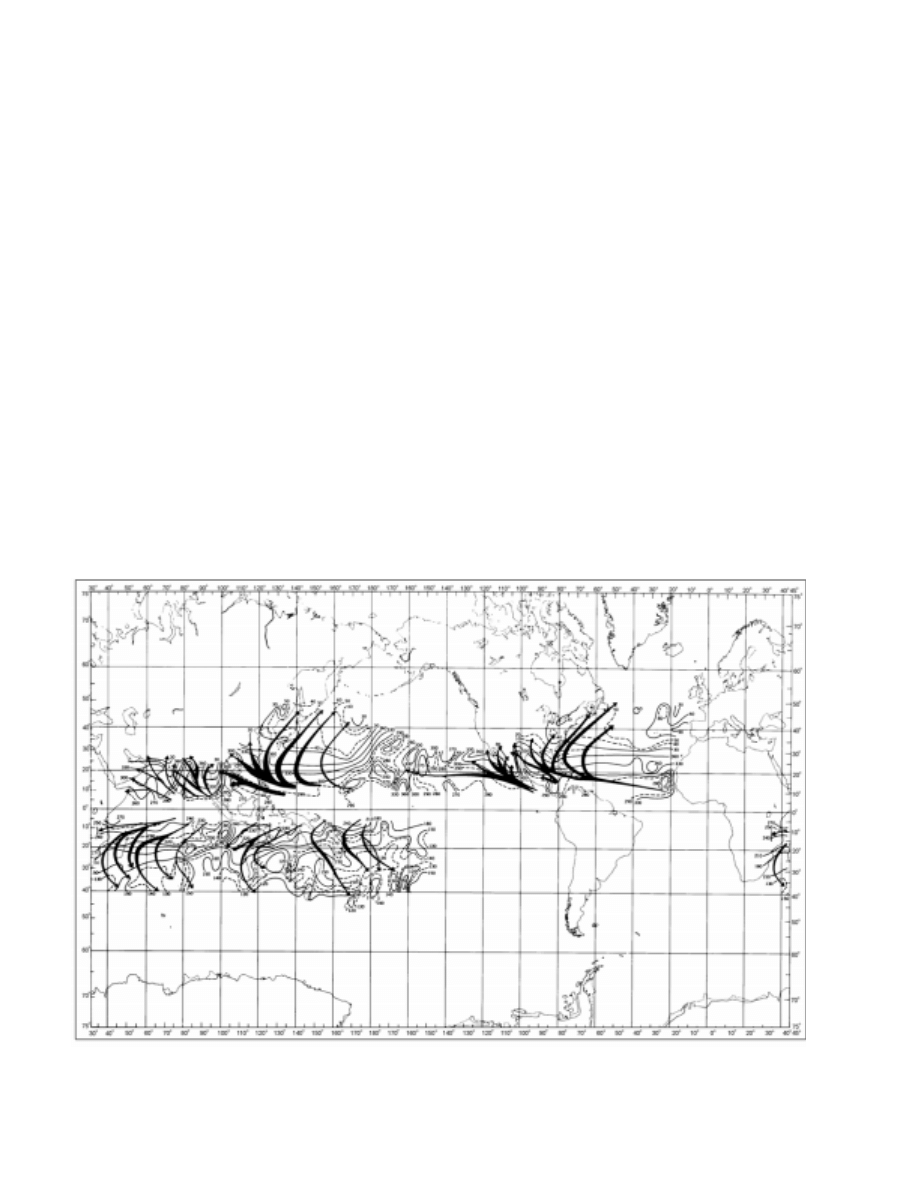
Figure 3603a. Storm tracks.The width of the arrow indicates the approximate frequency of storms; the wider the arrow
the higher the frequency. Isolines on the base map show the resultant direction toward which storms moved. Data for the
entire year has been summarized for this figure.
TROPICAL CYCLONES
507
Tropical cyclones have not been observed in the South
Atlantic or in the South Pacific east of 140
°
W.
3603. Origin, Season And Frequency
See Figures 3603a and 3603b. Origin, season, and fre-
quency of occurrence of the tropical cyclones in the six
areas are as follows:
North Atlantic: Tropical cyclones can affect the entire
North Atlantic Ocean in any month. However, they are
mostly a threat south of about 35
°
N from June through No-
vember; August, September, and October are the months of
highest incidence. See Figure 3603b. About 9 or 10 tropical
cyclones (tropical storms and hurricanes) form each season;
5 or 6 reach hurricane intensity (winds of 64 knots and
higher). A few hurricanes have generated winds estimated
as high as 200 knots. Early and late season storms usually
develop west of 50
°
W; during August and September, this
spawning ground extends to the Cape Verde Islands. These
storms usually move westward or west northwestward at
speeds of less than 15 knots in the lower latitudes. After
moving into the northern Caribbean or Greater Antilles re-
gions, they usually either move toward the Gulf of Mexico
or recurve and accelerate in the North Atlantic. Some will
recurve after reaching the Gulf of Mexico, while others will
continue westward to a landfall in Texas or Mexico.
Eastern North Pacific: The season is from June
through October, although a storm can form in any month.
An average of 15 tropical cyclones form each year with
about 6 reaching hurricane strength. The most intense
storms are often the early- and late-season ones; these form
close to the coast and far south. Mid season storms form
anywhere in a wide band from the Mexican-Central Amer-
ican coast to the Hawaiian Islands. August and September
are the months of highest incidence. These storms differ
from their North Atlantic counterparts in that they are usu-
ally smaller in size. However, they can be just as intense.
Western North Pacific: More tropical cyclones form
in the tropical western North Pacific than anywhere else in
the world. More than 25 tropical storms develop each year,
and about 18 become typhoons. These typhoons are the
largest and most intense tropical cyclones in the world.
Each year an average of five generate maximum winds over
130 knots; circulations covering more than 600 miles in di-
ameter are not uncommon. Most of these storms form east
of the Philippines, and move across the Pacific toward the
Philippines, Japan, and China; a few storms form in the
South China Sea. The season extends from April through
December. However, tropical cyclones are more common
in the off-season months in this area than anywhere else.
The peak of the season is July through October, when near-
AREA AND STAGE
JAN
FEB
MAR
APR
MAY
JUN
JUL
AUG
SEP
OCT
NOV
DEC
ANNUAL
NORTH ATLANTIC
TROPICAL STORMS
*
*
*
*
0.1
0.4
0.3
1.0
1.5
1.2
0.4
*
4.2
HURRICANES
*
*
*
*
*
0.3
0.4
1.5
2.7
1.3
0.3
*
5.2
TROPICAL STORMS AND HURRICANES
*
*
*
*
0.2
0.7
0.8
2.5
4.3
2.5
0.7
0.1
9.4
JAN
FEB
MAR
APR
MAY
JUN
JUL
AUG
SEP
OCT
NOV
DEC
ANNUAL
EASTERN NORTH PACIFIC
TROPICAL STORMS
*
*
*
*
*
1.5
2.8
2.3
2.3
1.2
0.3
*
9.3
HURRICANES
*
*
*
*
0.3
0.6
0.9
2.0
1.8
1.0
*
*
5.8
TROPICAL STORMS AND HURRICANES
*
*
*
*
0.3
2.0
3.6
4.5
4.1
2.2
0.3
*
15.2
JAN
FEB
MAR
APR
MAY
JUN
JUL
AUG
SEP
OCT
NOV
DEC
ANNUAL
WESTERN NORTH PACIFIC
TROPICAL STORMS
0.2
0.3
0.3
0.2
0.4
0.5
1.2
1.8
1.5
1.0
0.8
0.6
7.5
TYPHOONS
0.3
0.2
0.2
0.7
0.9
1.2
2.7
4.0
4.1
3.3
2.1
0.7
17.8
TROPICAL STORMS AND TYPHOONS
0.4
0.4
0.5
0.9
1.3
1.8
3.9
5.8
5.6
4.3
2.9
1.3
25.3
JAN
FEB
MAR
APR
MAY
JUN
JUL
AUG
SEP
OCT
NOV
DEC
ANNUAL
SOUTHWEST PACIFIC AND AUSTRALIAN AREA
TROPICAL STORMS
2.7
2.8
2.4
1.3
0.3
0.2
*
*
*
0.1
0.4
1.5
10.9
HURRICANES
0.7
1.1
1.3
0.3
*
*
0.1
0.1
*
*
0.3
0.5
3.8
TROPICAL STORMS AND HURRICANES
3.4
4.1
3.7
1.7
0.3
0.2
0.1
0.1
*
0.1
0.7
2.0
14.8
JAN
FEB
MAR
APR
MAY
JUN
JUL
AUG
SEP
OCT
NOV
DEC
ANNUAL
SOUTHWEST INDIAN OCEAN
TROPICAL STORMS
2.0
2.2
1.7
0.6
0.2
*
*
*
*
0.3
0.3
0.8
7.4
HURRICANES
1.3
1.1
0.8
0.4
*
*
*
*
*
*
*
0.5
3.8
TROPICAL STORMS AND HURRICANES
3.2
3.3
2.5
1.1
0.2
*
*
*
*
0.3
0.4
1.4
11.2
JAN
FEB
MAR
APR
MAY
JUN
JUL
AUG
SEP
OCT
NOV
DEC
ANNUAL
NORTH INDIAN OCEAN
TROPICAL STORMS
0.1
*
*
0.1
0.3
0.5
0.5
0.4
0.4
0.6
0.5
0.3
3.5
CYCLONES
1
*
*
*
0.1
0.5
0.2
0.1
*
0.1
0.4
0.6
0.2
2.2
TROPICAL STORMS AND CYCLONES
1
0.1
*
0.1
0.3
0.7
0.7
0.6
0.4
0.5
1.0
1.1
0.5
5.7
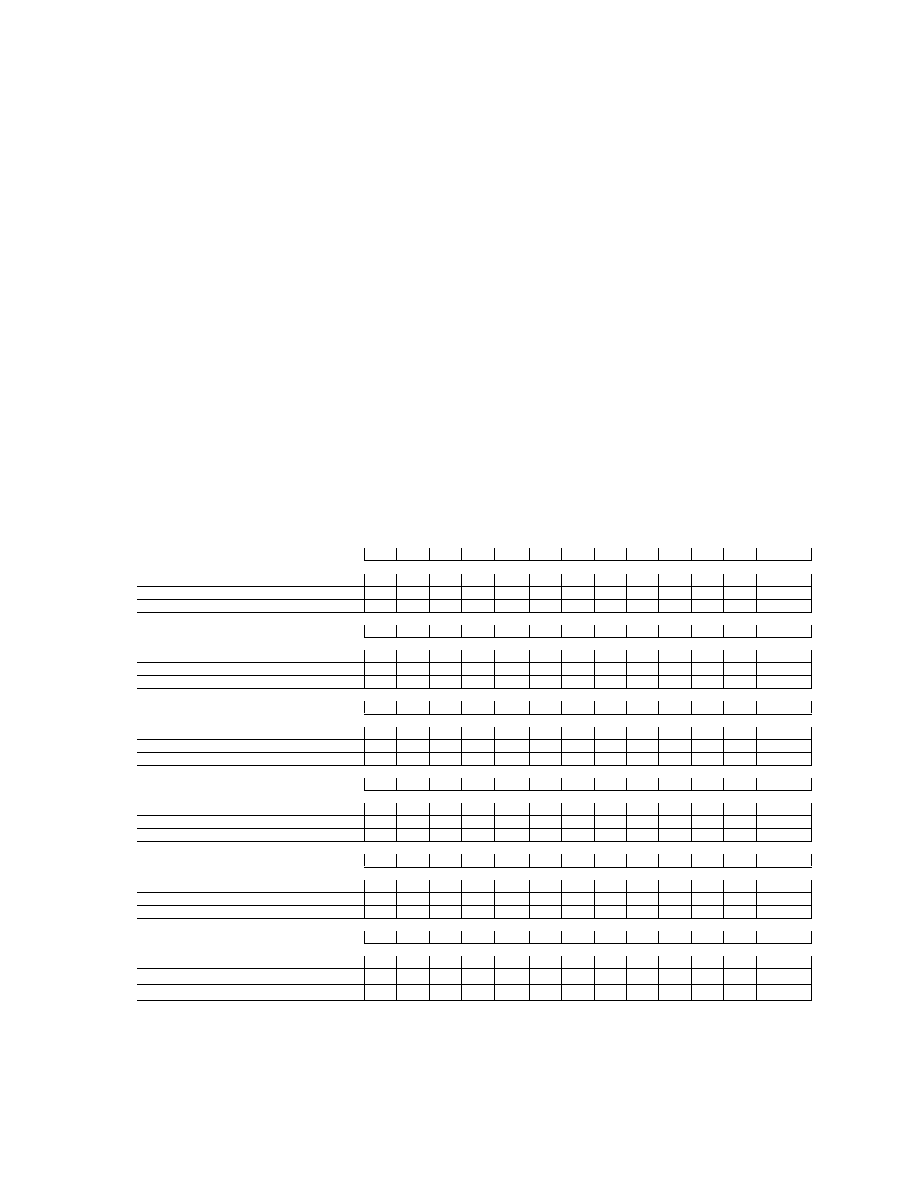
* Less than .05
1Winds
≥
48 Kts.
Monthly values cannot be combined because single storms overlapping two months were counted once in each month and once in the annual.
Figure 3603b. Monthly and annual average number of storms per year for each area.

508
TROPICAL CYCLONES
ly 70 percent of all typhoons develop. There is a noticeable
seasonal shift in storm tracks in this region. From July
through September, storms move north of the Philippines
and recurve, while early- and late-season typhoons move on
a more westerly track through the Philippines before
recurving.
North Indian Ocean: Tropical cyclones develop in
the Bay of Bengal and Arabian Sea during the spring and
fall. Tropical cyclones in this area form between latitudes
8
°
N and 15
°
N, except from June through September, when
the little activity that does occur is confined north of about
15
°
N. These storms are usually short-lived and weak; how-
ever, winds of 130 knots have been encountered. They
often develop as disturbances along the Intertropical Con-
vergence Zone (ITCZ); this inhibits summertime
development, since the ITCZ is usually over land during
this monsoon season. However, it is sometimes displaced
southward, and when this occurs, storms will form over the
monsoon-flooded plains of Bengal. On the average, six cy-
clonic storms form each year. These include two storms that
generate winds of 48 knots or greater. Another 10 tropical
cyclones never develop beyond tropical depressions. The
Bay of Bengal is the area of highest incidence. However, it
is not unusual for a storm to move across southern India and
reintensify in the Arabian Sea. This is particularly true dur-
ing October, the month of highest incidence during the
tropical cyclone season. It is also during this period that tor-
rential rains from these storms, dumped over already rain-
soaked areas, cause disastrous floods.
South Indian Ocean: Over the waters west of 100
°
E,
to the east African coast, an average of 11 tropical cyclones
(tropical storms and hurricanes) form each season, and
about 4 reach hurricane intensity. The season is from De-
cember through March, although it is possible for a storm
to form in any month. Tropical cyclones in this region usu-
ally form south of 10
°
S. The latitude of recurvature usually
migrates from about 20
°
S in January to around 15
°
S in
April. After crossing 30
°
S, these storms sometimes become
intense extratropical lows.
Southwest Pacific and Australian Area: These trop-
ical waters spawn an annual average of 15 tropical cyclones
4 of which reach hurricane intensity. The season extends
from about December through April, although storms can
form in any month. Activity is widespread in January and
February, and it is in these months that tropical cyclones are
most likely to affect Fiji, Samoa, and the other eastern is-
lands. Tropical cyclones usually form in the waters from
105
°
E to 160
°
W, between 5
°
and 20
°
S. Storms affecting
northern and western Australia often develop in the Timor
or Arafura Sea, while those that affect the east coast form in
the Coral Sea. These storms are often small, but can devel-
op winds in excess of 130 knots. New Zealand is sometimes
reached by decaying Coral Sea storms, and occasionally by
an intense hurricane. In general, tropical cyclones in this re-
gion move southwestward and then recurve southeastward.
ANATOMY OF TROPICAL CYCLONES
3604. Formation
Hurricane formation was once believed to result from
an intensification of convective forces which produce the
towering cumulonimbus clouds of the doldrums. This view
of hurricane generation held that surface heating caused
warm moist air to ascend convectively to levels where con-
densation produced cumulonimbus clouds, which, after an
inexplicable drop in atmospheric pressure, coalesced and
were spun into a cyclonic motion by Coriolis force.
This hypothesis left much unexplained. Although some
hurricanes develop from disturbances beginning in the dol-
drums, very few reach maturity in that region. Also, the high
incidence of seemingly ideal convective situations does not
match the low incidence of Atlantic hurricanes. Finally, the
hypothesis did not explain the drop in atmospheric pressure,
so essential to development of hurricane-force winds.
There is still no exact understanding of the triggering
mechanism involved in hurricane generation, the balance of
conditions needed to generate hurricane circulation, and the
relationships between large- and small-scale atmospheric
processes. But scientists today, treating the hurricane sys-
tem as an atmospheric heat engine, present a more
comprehensive and convincing view.
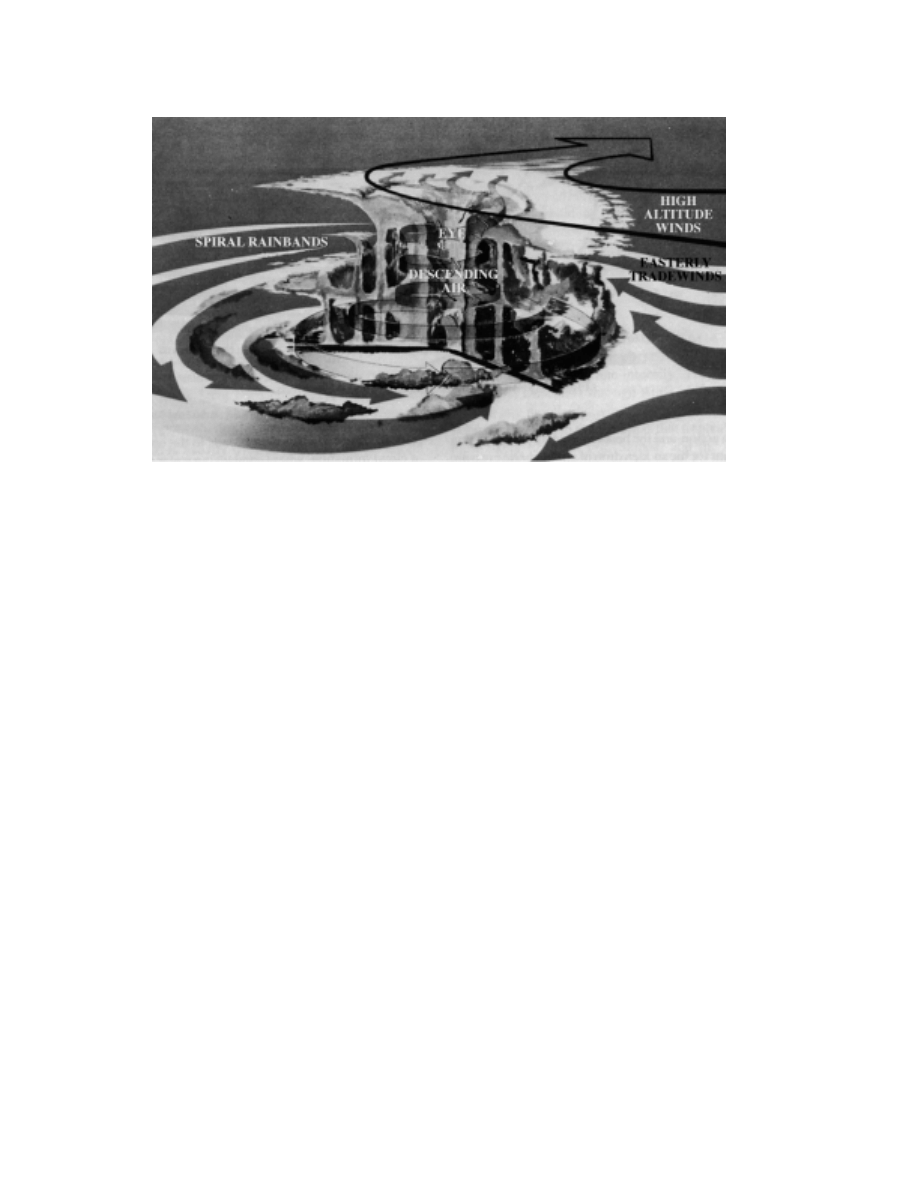
They begin with a starter mechanism in which either
internal or external forces intensify the initial disturbance.
The initial disturbance becomes a region into which low-
level air from the surrounding area begins to flow, acceler-
ating the convection already occurring inside the
disturbance. The vertical circulation becomes increasingly
well organized as water vapor in the ascending moist layer
is condensed (releasing large amounts of heat energy to
drive the wind system), and as the system is swept into a
counterclockwise cyclonic spiral. But this incipient hurri-
cane would soon fill up because of inflow at lower levels,
unless the chimney in which converging air surges upward
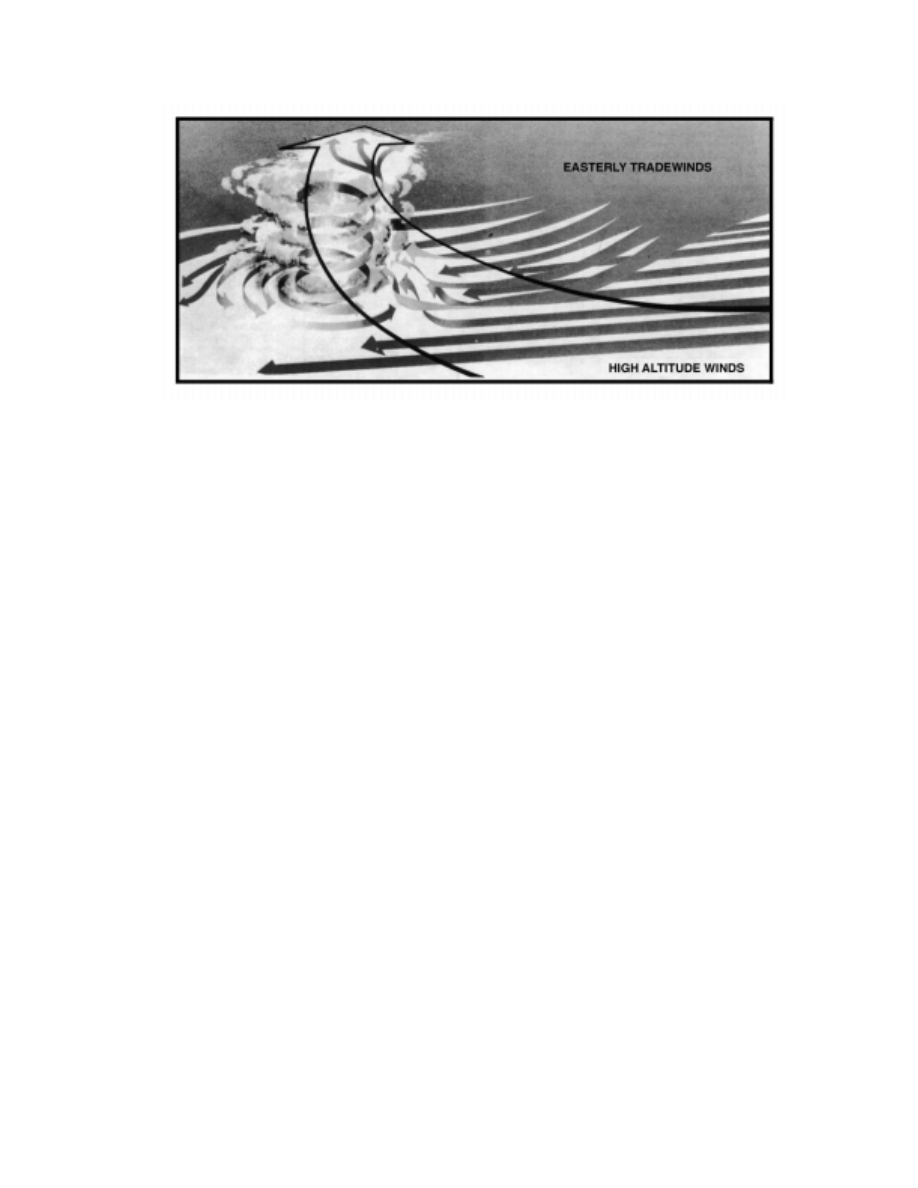
is provided the exhaust mechanism of high-altitude winds.
These high-altitude winds pump ascending air out of
the cyclonic system, into a high-altitude anticyclone, which
transports the air well away from the disturbance, before
sinking occurs. Thus, a large scale vertical circulation is set
up, in which low-level air is spiraled up the cyclonic twist-
ing of the disturbance, and, after a trajectory over the sea,
returned to lower altitudes some distance from the storm.
TROPICAL CYCLONES
509
This pumping action-and the heat released by the ascending
air may account for the sudden drop of atmospheric pres-
sure at the surface, which produces the steep pressure
gradient along which winds reach hurricane proportions.
It is believed that the interaction of low-level and high-al-
titude wind systems determines the intensity the hurricane
will attain. If less air is pumped out than converges at low lev-
els, the system will fill and die out. If more is pumped out than
flows in, the circulation will be sustained and will intensify.
Scientists have found that any process which increases
the rate of low-level inflow is favorable for hurricane devel-
opment, provided the inflowing air carries sufficient heat and
moisture to fuel the hurricane’s power system. It has also
been shown that air above the developing disturbance, at al-
titudes between 20,000 and 40,000 feet, increases 1
°
to 3
°
in
temperature about 24 hours before the disturbance develops
into a hurricane. But it is not known whether low-level in-
flow and high-level warming cause hurricanes. They could
very well be measurable symptoms of another effect which
actually triggers the storm’s increase to hurricane intensity.
The view of hurricanes as atmospheric engines is nec-
essarily a general one. The exact role of each contributor is
not completely understood. The engine seems to be both in-
efficient and unreliable; a myriad of delicate conditions
must be satisfied for the atmosphere to produce a hurricane.
Their relative infrequency indicates that many potential
hurricanes dissipate before developing into storms.
3605. Portrait Of A Hurricane
In the early life of the hurricane, the spiral covers an
area averaging 100 miles in diameter with winds of 64
knots and greater, and spreads gale-force winds over a 400-
mile diameter. The cyclonic spiral is marked by heavy
cloud bands from which torrential rains fall, separated by
areas of light rain or no rain at all. These spiral bands ascend
in decks of cumulus and cumulonimbus clouds to the con-
vective limit of cloud formation, where condensing water
vapor is swept off as ice-crystal wisps of cirrus clouds.
Thunderstorm electrical activity is observed in these bands,
both as lightning and as tiny electrostatic discharges.
In the lower few thousand feet, air flows in through the cy-
clone, and is drawn upward through ascending columns of air
near the center. The size and intensity decrease with altitude,
the cyclonic circulation being gradually replaced above 40,000
feet by an anticyclonic circulation centered hundreds of miles
away, which is the exhaust system of the hurricane heat engine.
At lower levels, where the hurricane is more intense,
winds on the rim of the storm follow a wide pattern, like the
slower currents around the edge of a whirlpool; and, like
those currents, these winds accelerate as they approach the
center of the vortex. The outer band has light winds at the
rim of the storm, perhaps no more than 25 knots; within 30
miles of the center, winds may have velocities exceeding
130 knots. The inner band is the region of maximum wind
velocity, where the storm’s worst winds are felt, and where
ascending air is chimneyed upward, releasing heat to drive
the storm. In most hurricanes, these winds reach 85 knots,
and more than 170 knots in severe storms.
In the hurricane, winds flow toward the low pressure in
the warm, comparatively calm core. There, converging air
is whirled upward by convection, the mechanical thrusting
of other converging air, and the pumping action of high-al-
titude circulations. This spiral is marked by the thick cloud
walls curling inward toward the storm center, releasing
heavy precipitation and enormous quantities of heat energy.
At the center, surrounded by a band in which this strong
vertical circulation is greatest, is the eye of the hurricane.
On the average, eye diameter is about 14 miles, al-
though diameters of 25 miles are not unusual. From the
heated tower of maximum winds and cumulonimbus
clouds, winds diminish rapidly to something less than 15
Figure 3604. Pumping action of high-altitude winds.
510
TROPICAL CYCLONES
miles per hour in the eye; at the opposite wall, winds in-
crease again, but come from the opposite direction because
of the cyclonic circulation of the storm. This sudden trans-
formation of storm into comparative calm, and from calm
into violence from another quarter is spectacular. The eye’s
abrupt existence in the midst of opaque rain squalls and hur-
ricane winds, the intermittent bursts of blue sky and
sunlight through light clouds in the core of the cyclone, and
the galleried walls of cumulus and cumulonimbus clouds
are unforgettable.
Every hurricane is individual, and the more or less or-
derly circulation described here omits the extreme
variability and instability within the storm system. Pressure
and temperature gradients fluctuate wildly across the storm
as the hurricane maintains its erratic life. If it is an August
storm, its average life expectancy is 12 days; if a July or No-
vember storm, it lives an average of 8 days.
3606. Life Of A Tropical Cyclone
Reports from ships in the vicinity of an easterly wave
(a westward-moving trough of low pressure embedded in
deep easterlies) may indicate that the atmospheric pres-
sure in the region has fallen more than 5 millibars in the
past 24 hours. This is cause for alarm, because in the Trop-
ics pressure varies little; the normal diurnal pressure
change is only about 3 millibars. Satellite pictures may in-
dicate thickening middle and high clouds. Squalls are
reported ahead of the easterly wave, and wind reports in-
dicate a cyclonic circulation is forming. The former
easterly wave, now classified a tropical disturbance, is
moving westward at 10 knots under the canopy of a large
high-pressure system aloft. Sea surface temperatures in
the vicinity are in the 28
°
-30
°
C range.
Within 48 hours winds increase to 25 knots near the
center of definite circulation, and central pressure has
dropped below 1000 millibars. The disturbance is now clas-
sified as a tropical depression. Soon the circulation extends
out to 100 miles and upward to 20,000 feet. Winds near the
center increase to gale force, central pressure falls below
990 millibars, and towering cumulonimbus clouds shield a
developing eye; a tropical storm has developed.
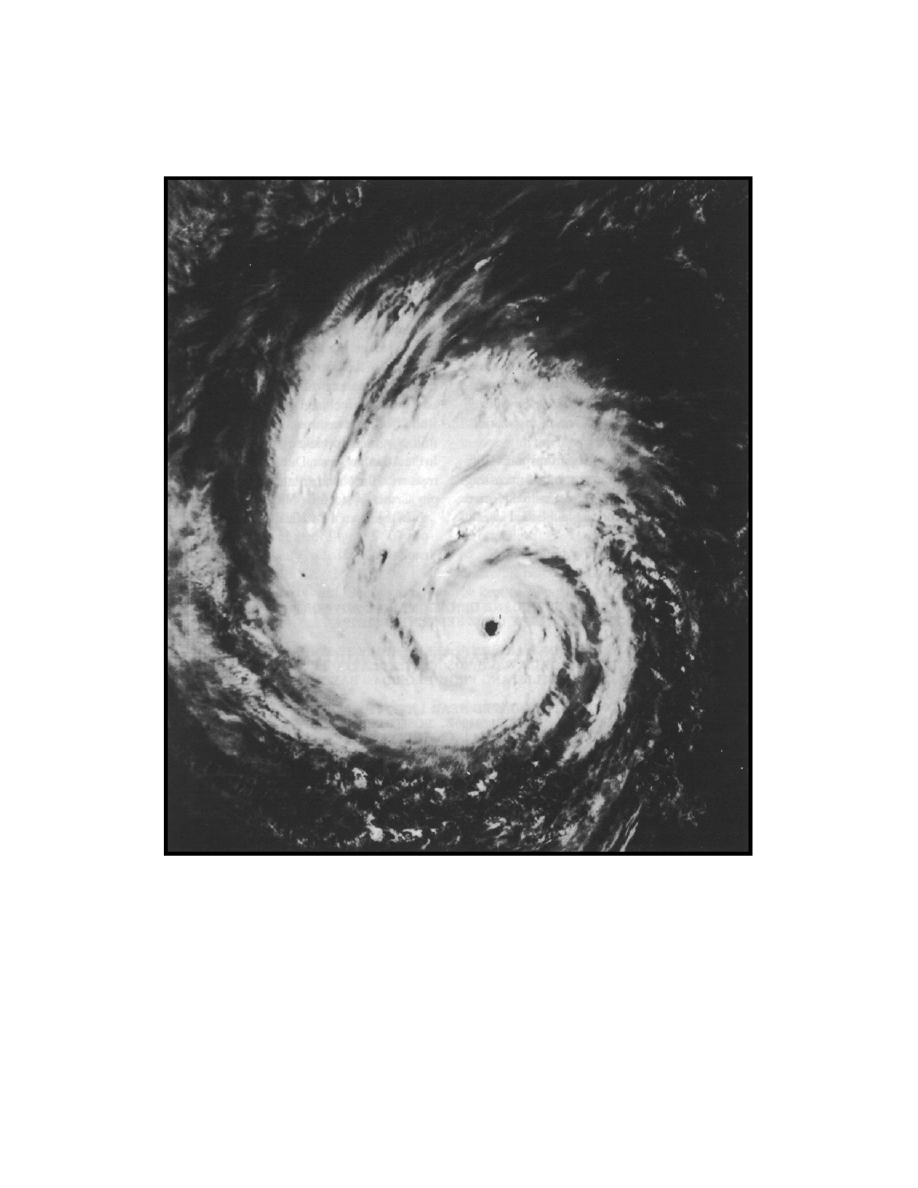
Satellite photographs now reveal a tightly organized
tropical cyclone, and reconnaissance reports indicate maxi-
mum winds of 80 knots around a central pressure of 980
millibars; a hurricane has developed. A ship to the right
(left in the Southern Hemisphere) of the hurricane’s center
(looking toward the direction of storm movement) reports
30-foot seas. The hurricane is rapidly maturing as it contin-
ues westward.
A few days later the hurricane reaches its peak. The
satellite photographs show a textbook picture, as 120-knot
winds roar around a 940-millibar pressure center; hurri-
cane-force winds extend 50 miles in all directions, and seas
are reported up to 40 feet. There is no further deepening
now, but the hurricane begins to expand. In 2 days, gales
extend out to 200 miles, and hurricane winds out to 75
miles. Then the hurricane slows and begins to recurve; this
turning marks the beginning of its final phase.
The hurricane accelerates, and, upon reaching temper-
ate latitudes, it begins to lose its tropical characteristics.
The circulation continues to expand, but now cold air is in-
truding (cold air, cold water, dry air aloft, and land, aid in
the decay of a tropical cyclone). The winds gradually abate
Figure 3605. Cutaway view of a hurricane greatly exaggerated in vertical dimension. Actual hurricanes are less than
50,000 feet high and may have a diameter of several hundred miles.
TROPICAL CYCLONES
511
as the concentrated storm disintegrates. The warm core sur-
vives for a few more days before the transformation to a
large extratropical low-pressure system is complete.
Not all tropical cyclones follow this average pattern.
Most falter in the early stages, some dissipate over land, and
others remain potent for several weeks.
FORECASTING AND PREDICTING TROPICAL CYCLONES
3607. Weather Broadcasts And Radiofacsimile
The marine weather broadcast and radiofacsimile
weather maps are the most important tools for avoiding trop-
ical cyclones. These broadcasts, covering all tropical areas,
provide information about the tropical cyclone’s location,
maximum winds and seas, and future conditions expected.
The U S. Navy, the National Oceanic and Atmospheric
Administration, and the U.S. Air Force have developed a
highly effective surveillance system for the tropical cy-
clone-prone areas of the world. Routine and special weather
reports (from land stations, ships at sea, aircraft; weather
satellite imagery; radar reports from land stations; special
reports from ships at sea; and the specially instrumented
Figure 3606. Satellite photograph of a hurricane.

512
TROPICAL CYCLONES
weather reconnaissance aircraft of National Oceanic and
Atmospheric Administration and the U.S. Air Force) enable
accurate detection, location, and tracking of tropical cy-
clones. International cooperation is effective. Data buoys,
both moored and drifting, provide another source of
information.
The tropical warning services have three principal
functions:
1. The collection and analysis of the necessary obser-
vational data.
2. The preparation of timely and accurate forecasts
and warnings.
3. The rapid and efficient distribution of advisories,
warnings, and all other pertinent information.
To provide timely and accurate information and
warnings regarding tropical cyclones, the oceans have
been divided into overlapping geographical areas of
responsibility.
For detailed information on the areas of responsibility of
the countries participating in the international forecasting
and warning program, and radio aids, refer to Selected
Worldwide Marine Weather Broadcasts, published jointly by
the Naval Meteorology and Oceanography Command and
the National Weather Service.
Although the areas of forecasting responsibility are
fairly well defined for the Department of Defense, the inter-
national and domestic civilian system provides many
overlaps and is dependent upon qualitative factors. For ex-
ample, when a tropical storm or hurricane is traveling
westward and crosses 35
°
W longitude, the continued issu-
ance of forecasts and warnings to the general public,
shipping interests, etc., becomes the responsibility of the
National Hurricane Center of the National Weather Service
at Miami, Florida. When a tropical storm or hurricane
crosses 35
°
W longitude traveling from west to east, the Na-
tional Hurricane Center ceases to issue formal public
advisories, but will issue marine bulletins on any dangerous
tropical cyclone in the North Atlantic, if it is of importance
or constitutes a threat to shipping and other interests. These
advisories are included in National Weather Service Marine
Bulletins broadcast to ships over radio station NAM Nor-
folk, Virginia. Special advisories may be issued at any time.
In the Atlantic Ocean, Department of Defense responsibili-
ty rests with the Naval Atlantic Meteorology and
Oceanography Center in Norfolk, Virginia.
In the eastern Pacific east of longitude 140
°
W, respon-
NOAA/NATIONAL HURRICANE CENTER MARINE ADVISORY NUM-
BER 13 HURRICANE LADY 0400Z SEPTEMBER 21 19--.
HURRICANE WARNINGS ARE DISPLAYED FROM KEY LARGO TO
CAPE KENNEDY. GALE WARNINGS ARE DISPLAYED FROM KEY
WEST TO JACKSONVILLE AND FROM FLORIDA BAY TO CEDAR KEY.
HURRICANE CENTER LOCATED NEAR LATITUDE 25.5 NORTH
LONGITUDE 78.5 WEST AT 21/0400Z. POSITION EXCELLENT AC-
CURATE WITHIN 10 MILES BASED ON AIR FORCE RECONNAISSANCE
AND SYNOPTIC REPORTS.
PRESENT MOVEMENT TOWARD THE WEST NORTHWEST OR 285
DEGREES AT 10 KT. MAX SUSTAINED WINDS OF 100 KT NEAR
CENTER WITH GUSTS TO 160 KT.
MAX WINDS OVER INLAND AREAS 35 KT.
RAD OF 65 KT WINDS 90 NE 60 SE 80 SW 90 NW QUAD.
RAD OF 50 KT WINDS 120 NE 70 SE 90 SW 120 NW QUAD.
RAD OF 30 KT WINDS 210 NE 210 SE 210 SW 210 NW QUAD.
REPEAT CENTER LOCATED 25.5N 78.3W AT 21/0400Z.
12 HOUR FORECAST VALID 21/1600Z LATITUDE 26.0N LONGI-
TUDE 80.5W.
MAX WINDS OF 100 KT NEAR CENTER WITH GUSTS TO 160 KT.
MAX WINDS OVER INLAND AREAS 65 KT.
RADIUS OF 50 KT WINDS 120 NE 70 SE 90 SW 120 NW QUAD.
24 HOUR FORECAST VALID 22/0400Z LATITUDE 26.0N
LONGITUDE 83.0W.
MAX WINDS OF 75 KT NEAR CENTER WITH GUSTS TO 120 KT.
MAX WINDS OVER INLAND AREAS 45 KT.
RADIUS OF 50 KT WINDS 120 NE 120 SE 120 SW 120 NW QUAD.
STORM TIDE OF 9 TO 12 FT SOUTHEAST FLA COAST GREATER
MIAMI AREA TO THE PALM BEACHES.
NEXT ADVISORY AT 21/1000Z.
Figure 3607. Example of marine advisory issued by National Hurricane Center.

TROPICAL CYCLONES
513
sibility for the issuance of tropical storm and hurricane
advisories and warnings for the general public, merchant
shipping, and other interests rests with the National Weath-
er Service Eastern Pacific Hurricane Center, San Francisco,
California. The Department of Defense responsibility rests
with the Naval Pacific Meteorology and Oceanography
Center, Pearl Harbor, Hawaii. Formal advisories and warn-
ings are issued daily and are included in the marine
bulletins broadcast by radio stations KFS, NMC, and NMQ.
In the central Pacific (between the meridian and longi-
tude 140
°
W), the civilian responsibility rests with the
National Weather Service Central Pacific Hurricane Cen-
ter, Honolulu, Hawaii. Department of Defense
responsibility rests with the Naval Pacific Meteorology and
Oceanography Center in Pearl Harbor. Formal tropical
storm and hurricane advisories and warnings are issued dai-
ly and are included in the marine bulletins broadcast by
radio station NMO and NRV.
Tropical cyclone information messages generally con-
tain position of the storm, intensity, direction and speed of
movement, and a description of the area of strong winds.
Also included is a forecast of future movement and intensi-
ty. When the storm is likely to affect any land area, details
on when and where it will be felt, and data on tides, rain,
floods, and maximum winds are also included. Figure 3607
provides an example of a marine advisory issued by the Na-
tional Hurricane Center.
The Naval Pacific Meteorology and Oceanography
Center Center-West/Joint Typhoon Warning Center (NP-
MOC-W/JTWC) in Guam is responsible for all U.S.
tropical storm and typhoon advisories and warnings from
the 180th meridian westward to the mainland of Asia. A
secondary area of responsibility extends westward to longi-
tude 90
°
E. Whenever a tropical cyclone is observed in the
western North Pacific area, serially numbered warnings,
bearing an “immediate” precedence are broadcast from the
NPMOC-W/JTWC at 0000, 0600, 1200, and 1800 GMT.
The responsibility for issuing gale and storm warnings
for the Indian Ocean, Arabian Sea, Bay of Bengal, Western
Pacific, and South Pacific rests with many countries. In
general, warnings of approaching tropical cyclones which
may be hazardous will include the following information:
storm type, central pressure given in millibars, wind speed
observed within the storm, storm location, speed and direc-
tion of movement, the extent of the affected area, visibility,
and the state of the sea, as well as any other pertinent infor-
mation received. All storm warning messages commence
with the international call sign “TTT.”
These warnings are broadcast on specified radio frequency
bands immediately upon receipt of the information and at spe-
cific intervals thereafter. Generally, the broadcast interval is
every 6 to 8 hours, depending upon receipt of new information.
Bulletins and forecasts are excellent guides to the
present and future behavior of the tropical cyclone, and a
plot should be kept of all positions.
AVOIDING TROPICAL CYCLONES
3608. Approach And Passage Of A Tropical Cyclone
An early indication of the approach of a tropical cy-
clone is the presence of a long swell. In the absence of a
tropical cyclone, the crests of swell in the deep waters of the
Atlantic pass at the rate of perhaps eight per minute. Swell
generated by a hurricane is about twice as long, the crests
passing at the rate of perhaps four per minute. Swell may be
observed several days before arrival of the storm.
When the storm center is 500 to 1,000 miles away, the
barometer usually rises a little, and the skies are relatively
clear. Cumulus clouds, if present at all, are few in number
and their vertical development appears suppressed. The ba-
rometer usually appears restless, pumping up and down a
few hundredths of an inch.
As the tropical cyclone comes nearer, a cloud sequence
begins which resembles that associated with the approach
of a warm front in middle latitudes. Snow-white, fibrous
“mare’s tails” (cirrus) appear when the storm is about 300
to 600 miles away. Usually these seem to converge, more
or less, in the direction from which the storm is approach-
ing. This convergence is particularly apparent at about the
time of sunrise and sunset.
Shortly after the cirrus appears, but sometimes before,
the barometer starts a long, slow fall. At first the fall is so
gradual that it only appears to alter somewhat the normal
daily cycle (two maxima and two minima in the Tropics).
As the rate of fall increases, the daily pattern is completely
lost in the more or less steady fall.
The cirrus becomes more confused and tangled, and
then gradually gives way to a continuous veil of cirrostratus.
Below this veil, altostratus forms, and then stratocumulus.
These clouds gradually become more dense, and as they do
so, the weather becomes unsettled. A fine, mist-like rain be-
gins to fall, interrupted from time to time by rain showers.
The barometer has fallen perhaps a tenth of an inch.
As the fall becomes more rapid, the wind increases in
gustiness, and its speed becomes greater, reaching perhaps
22 to 40 knots (Beaufort 6-8). On the horizon appears a dark
wall of heavy cumulonimbus, called the bar of the storm.
This is the heavy bank of clouds comprising the main mass
of the cyclone. Portions of this heavy cloud become de-
tached from time to time, and drift across the sky,
accompanied by rain squalls and wind of increasing speed.
Between squalls, the cirrostratus can be seen through
breaks in the stratocumulus.
As the bar approaches, the barometer falls more rapidly
and wind speed increases. The seas, which have been gradu-
514
TROPICAL CYCLONES
ally mounting, become tempestuous. Squall lines, one after
the other, sweep past in ever increasing number and intensity.
With the arrival of the bar, the day becomes very dark,
squalls become virtually continuous, and the barometer
falls precipitously, with a rapid increase in wind speed. The
center may still be 100 to 200 miles away in a fully devel-
oped tropical cyclone. As the center of the storm comes
closer, the ever-stronger wind shrieks through the rigging,
and about the superstructure of the vessel. As the center ap-
proaches, rain falls in torrents. The wind fury increases. The
seas become mountainous. The tops of huge waves are
blown off to mingle with the rain and fill the air with water.
Visibility is virtually zero in blinding rain and spray. Even
the largest and most seaworthy vessels become virtually un-
manageable, and may sustain heavy damage. Less sturdy
vessels may not survive. Navigation virtually stops as safe-
ty of the vessel becomes the only consideration. The
awesome fury of this condition can only be experienced.
Words are inadequate to describe it.
If the eye of the storm passes over the vessel, the winds
suddenly drop to a breeze as the wall of the eye passes. The
rain stops, and the skies clear sufficiently to permit the sun
or stars to shine through holes in the comparatively thin
cloud cover. Visibility improves. Mountainous seas ap-
proach from all sides in complete confusion. The barometer
reaches its lowest point, which may be 1
1
/
2
or 2 inches be-
low normal in fully developed tropical cyclones. As the
wall on the opposite side of the eye arrives, the full fury of
the wind strikes as suddenly as it ceased, but from the op-
posite direction. The sequence of conditions that occurred
during approach of the storm is reversed, and passes more
quickly, as the various parts of the storm are not as wide in
the rear of a storm as on its forward side.
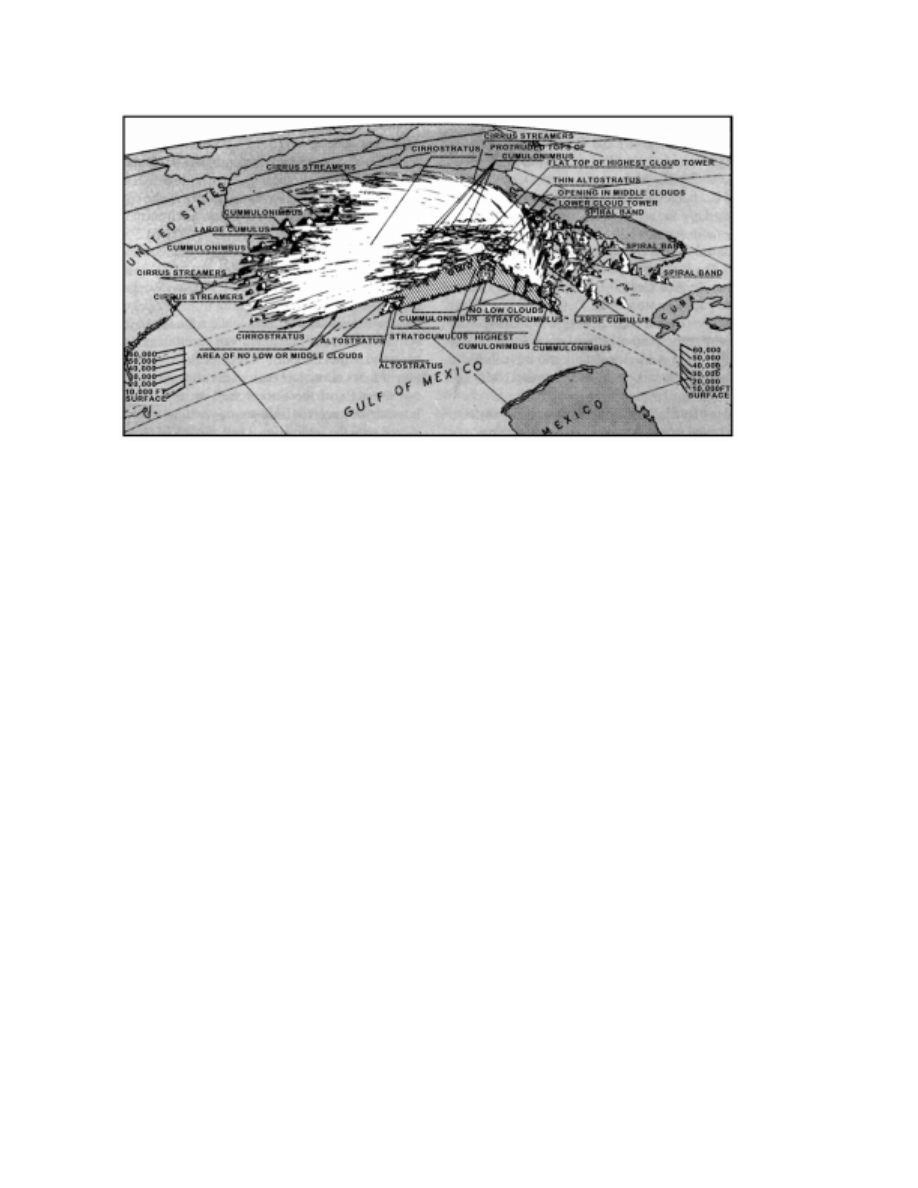
Typical cloud formations associated with a hurricane
are shown in Figure 3608.
3609. Locating The Center Of A Tropical Cyclone
If intelligent action is to be taken to avoid the full fury
of a tropical cyclone, early determination of its location and
direction of travel relative to the vessel is essential. The bul-
letins and forecasts are an excellent general guide, but they
are not infallible, and may be sufficiently in error to induce
a mariner in a critical position to alter course so as to unwit-
tingly increase the danger to his vessel. Often it is possible,
using only those observations made aboard ship, to obtain a
sufficiently close approximation to enable the vessel to ma-
neuver to the best advantage.
The presence of an exceptionally long swell is usually
the first visible indication of the existence of a tropical cy-
clone. In deep water it approaches from the general
direction of origin (the position of the storm center when
the swell was generated). However, in shoaling water this
is a less reliable indication because the direction is changed
by refraction, the crests being more nearly parallel to the
bottom contours.
When the cirrus clouds appear, their point of conver-
gence provides an indication of the direction of the storm
center. If the storm is to pass well to one side of the observ-
er, the point of convergence shifts slowly in the direction of
storm movement. If the storm center will pass near the ob-
server, this point remains steady. When the bar becomes
visible, it appears to rest upon the horizon for several hours.
The darkest part of this cloud is in the direction of the storm
center. If the storm is to pass to one side, the bar appears to
drift slowly along the horizon. If the storm is heading di-
Figure 3608. Typical hurricane cloud formations.
TROPICAL CYCLONES
515
rectly toward the observer, the position of the bar remains
fixed. Once within the area of the dense, low clouds, one
should observe their direction of movement, which is al-
most exactly along the isobars, with the center of the storm
being 90
°
from the direction of cloud movement (left of di-
rection of movement in the Northern Hemisphere, and right
in the Southern Hemisphere).
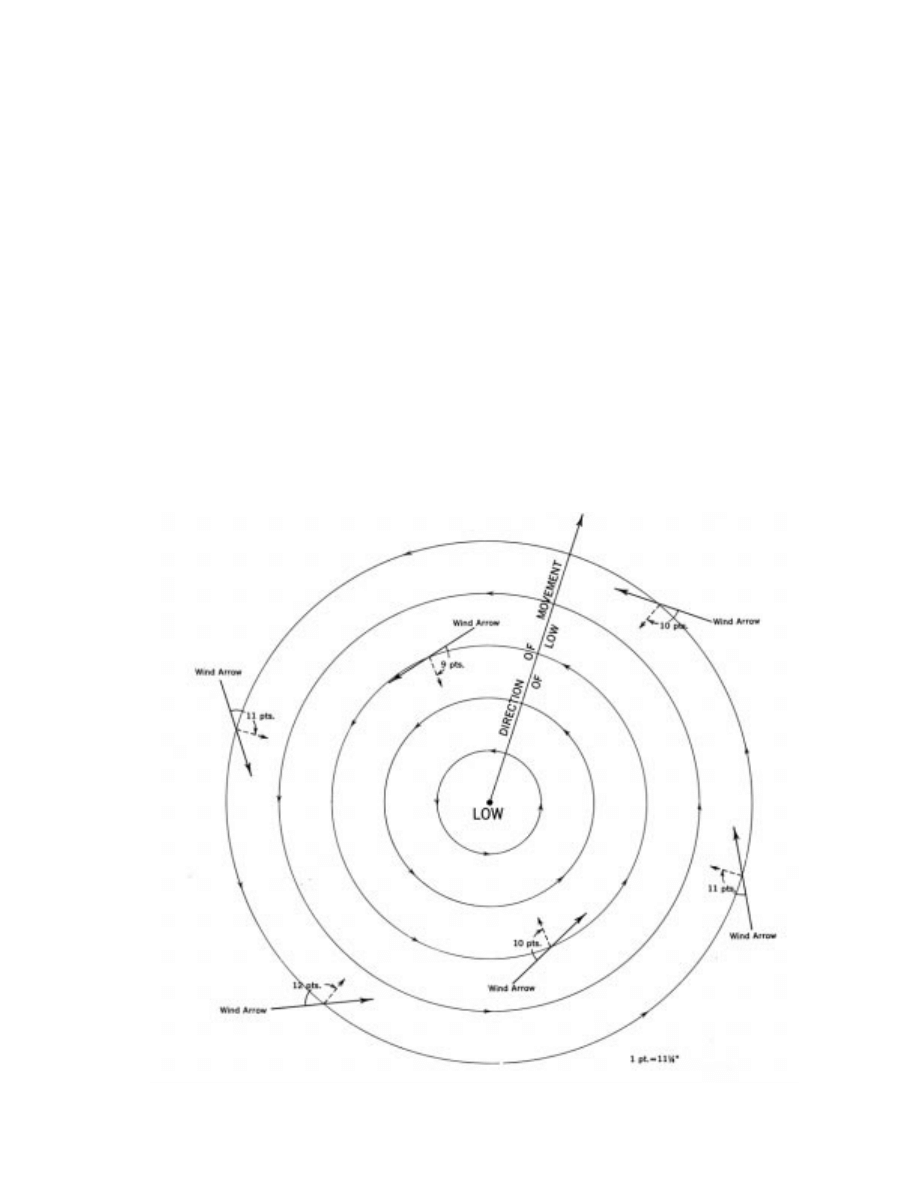
The winds are probably the best guide to the direction
of the center of a tropical cyclone. The circulation is cy-
clonic, but because of the steep pressure gradient near the
center, the winds there blow with greater violence and are
more nearly circular than in extratropical cyclones.
According to Buys Ballot’s law, an observer whose
back is to the wind has the the low pressure on his left in the
Northern Hemisphere, and on his right in the Southern Hemi-
sphere. If the wind followed circular isobars exactly, the
center would be exactly 90
°
from behind when facing away
from the wind. However, the track of the wind is usually in-
clined somewhat toward the center, so that the angle from
dead astern varies between perhaps 90
°
to 135
°
. The inclina-
tion varies in different parts of the same storm. It is least in
front of the storm, and greatest in the rear, since the actual
wind is the vector sum of the pressure gradient and the mo-
tion of the storm along the track. A good average is perhaps
110
°
in front, and 120-135
°
in the rear. These values apply
when the storm center is still several hundred miles away.
Closer to the center, the wind blows more nearly along the
isobars, the inclination being reduced by one or two points at
the wall of the eye. Since wind direction usually shifts tem-
porarily during a squall, its direction at this time should not
be used for determining the position of the center. The ap-
proximate relationship of wind to isobars and storm center in
the Northern Hemisphere is shown in Figure 3609a.
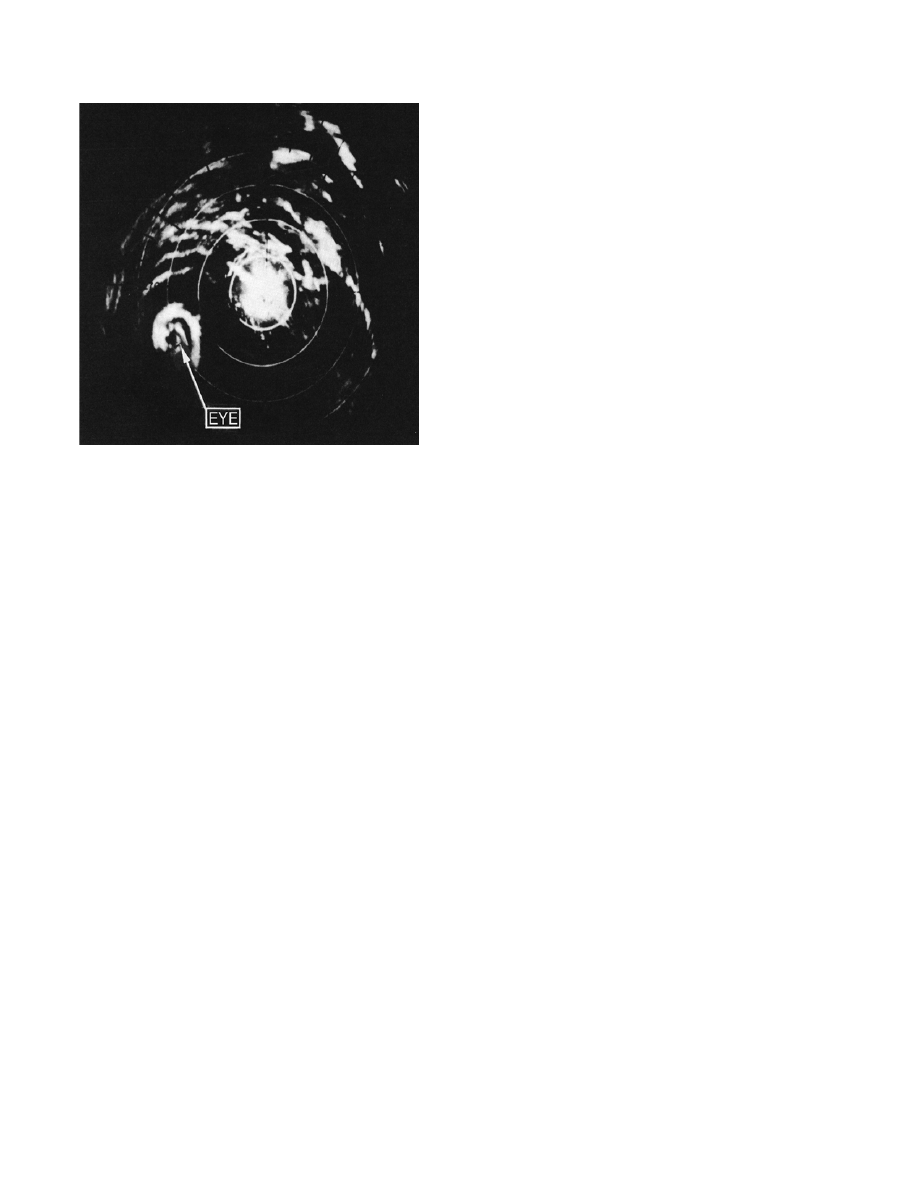
When the center is within radar range, it will probably
be visible on the scope. However, since the radar return is
predominantly from the rain, results can be deceptive, and
other indications should not be neglected. Figure 3609b
shows a radar PPI presentation of a tropical cyclone. If the
eye is out of range, the spiral bands (Figure 3609b) may in-
dicate its direction from the vessel. Tracking the eye or
upwind portion of the spiral bands enables determining the
direction and speed of movement; this should be done for at
Figure 3609a. Approximate relationship of wind to isobars and storm center in the Northern Hemisphere.
516
TROPICAL CYCLONES
least 1 hour because the eye tends to oscillate. The tracking
of individual cells, which tend to move tangentially around
the eye, for 15 minutes or more, either at the end of the band
or between bands, will provide an indication of the wind
speed in that area of the storm.
Distance from the storm center is more difficult to de-
termine than direction. Radar is perhaps the best guide.
However, the rate of fall of the barometer is some
indication.
3610. Statistical Analysis Of Barometric Pressure
The lowest-sea-level pressure ever recorded was 877
millibars in typhoon Ida, on September 24, 1958. The ob-
servation was taken by a reconnaissance aircraft dropsonde,
some 750 miles east of Luzon, Philippines. This observa-
tion was obtained again in typhoon Nora on October 6,
1973. The lowest barometric reading of record for the Unit-
ed States is 892.3 millibars, obtained during a hurricane at
Lower Matecumbe Key, Florida, in September 1935. In
hurricane Camille in 1969, a 905 millibar pressure was
measured by reconnaissance aircraft. During a 1927 ty-
phoon, the S.S. Sapoeroea recorded a pressure of 886.6
millibars, the lowest sea-level pressure reported from a
ship. Pressure has been observed to drop more than 33 mil-
libars per hour, with a pressure gradient amounting to a
change of 3.7 millibars per mile.
A method for alerting the mariner to possible tropical
cyclone formation involves a statistical comparison of ob-
served weather parameters with the climatology (30 year
averaged conditions) for those parameters. Significant fluc-
tuations away from these average conditions could mean
the onset of severe weather. One such statistical method in-
volves a comparison of mean surface pressure in the tropics
with the standard deviation (s.d.) of surface pressure. Any
significant deviation from the norm could indicate proxim-
ity to a tropical cyclone. Analysis shows that surface
pressure can be expected to be lower than the mean minus
1 s.d. less than 16% of the time, lower than the mean minus
1.5 s.d. less than 7% of the time, and lower than the mean
minus 2 s.d. less than 3% of the time. Comparison of the ob-
served pressure with the mean will indicate how “unusual”
the present conditions are.
As an example, assume the mean surface pressure in
the South China Sea to be about 1005 mb during August
with a s.d. of about 2 mb. Therefore, surface pressure can
be expected to fall below 1003 mb about 16% of the time
and below 1000 mb about 7% of the time. Ambient pressure
any lower than that would alert the mariner to the possible
onset of heavy weather. Charts showing the mean surface
pressure and the s.d. of surface pressure for various global
regions can be found in the U.S. Navy Marine Climatic At-
las of the World.
3611. Maneuvering To Avoid The Storm Center
The safest procedure with respect to tropical cyclones
is to avoid them. If action is taken sufficiently early, this is
simply a matter of setting a course that will take the vessel
well to one side of the probable track of the storm, and then
continuing to plot the positions of the storm center as given
in the weather bulletins, revising the course as needed.
However, this is not always possible. If the ship is
found to be within the storm area, the proper action to take
depends in part upon its position relative to the storm center
and its direction of travel. It is customary to divide the cir-
cular area of the storm into two parts.
In the Northern Hemisphere, that part to the right of the
storm track (facing in the direction toward which the storm
is moving) is called the dangerous semicircle. It is consid-
ered dangerous because (1) the actual wind speed is greater
than that due to the pressure gradient alone, since it is aug-
mented by the forward motion of the storm, and (2) the
direction of the wind and sea is such as to carry a vessel into
the path of the storm (in the forward part of the semicircle).
The part to the left of the storm track is called the less
dangerous semicircle, or navigable semicircle. In this
part, the wind is decreased by the forward motion of the
storm, and the wind blows vessels away from the storm
track (in the forward part). Because of the greater wind
speed in the dangerous semicircle, the seas are higher than
in the less dangerous semicircle. In the Southern Hemi-
sphere, the dangerous semicircle is to the left of the storm
track, and the less dangerous semicircle is to the right of the
storm track.
A plot of successive positions of the storm center should
indicate the semicircle in which a vessel is located. However,
if this is based upon weather bulletins, it may not be a reliable
guide because of the lag between the observations upon
which the bulletin is based and the time of reception of the
bulletin, with the ever-present possibility of a change in the
direction of the storm. The use of radar eliminates this lag at
Figure 3609b. Radar PPI presentation of a tropical
cyclone.

TROPICAL CYCLONES
517
short range, but the return may not be a true indication of the
center. Perhaps the most reliable guide is the wind. Within
the cyclonic circulation, a wind shifting to the right in the
northern hemisphere and to the left in the southern hemi-
sphere indicates the vessel is probably in the dangerous
semicircle. A steady wind shift opposite to this indicates the
vessel is probably in the less dangerous semicircle.
However, if a vessel is underway, its own motion should
be considered. If it is outrunning the storm or pulling rapidly
toward one side (which is not difficult during the early stages
of a storm, when its speed is low), the opposite effect occurs.
This should usually be accompanied by a rise in atmospheric
pressure, but if motion of the vessel is nearly along an isobar,
this may not be a reliable indication. If in doubt, the safest ac-
tion is usually to stop long enough to define the proper
semicircle. The loss in time may be more than offset by the
minimizing of the possibility of taking the wrong action, in-
creasing the danger to the vessel. If the wind direction remains
steady (for a vessel which is stopped), with increasing speed
and falling barometer, the vessel is in or near the path of the
storm. If it remains steady with decreasing speed and rising ba-
rometer, the vessel is near the storm track, behind the center.
The first action to take if the ship is within the cyclonic
circulation is to determine the position of his vessel with re-
spect to the storm center. While the vessel can still make
considerable way through the water, a course should be se-
lected to take it as far as possible from the center. If the
vessel can move faster than the storm, it is a relatively sim-
ple matter to outrun the storm if sea room permits. But
when the storm is faster, the solution is not as simple. In this
case, the vessel, if ahead of the storm, will approach nearer
to the center. The problem is to select a course that will pro-
duce the greatest possible minimum distance. This is best
determined by means of a relative movement plot, as shown
in the following example solved on a maneuvering board.
Example: A tropical cyclone is estimated to be moving
in direction 320
°
at 19 knots. Its center bears 170
°
, at an es-
timated distance of 200 miles from a vessel which has a
maximum speed of 12 knots.
Required:
(1) The course to steer at 12 knots to produce the
greatest possible minimum distance between the
vessel and the storm center.
(2) The distance to the center at nearest approach.
(3) Elapsed time until nearest approach.
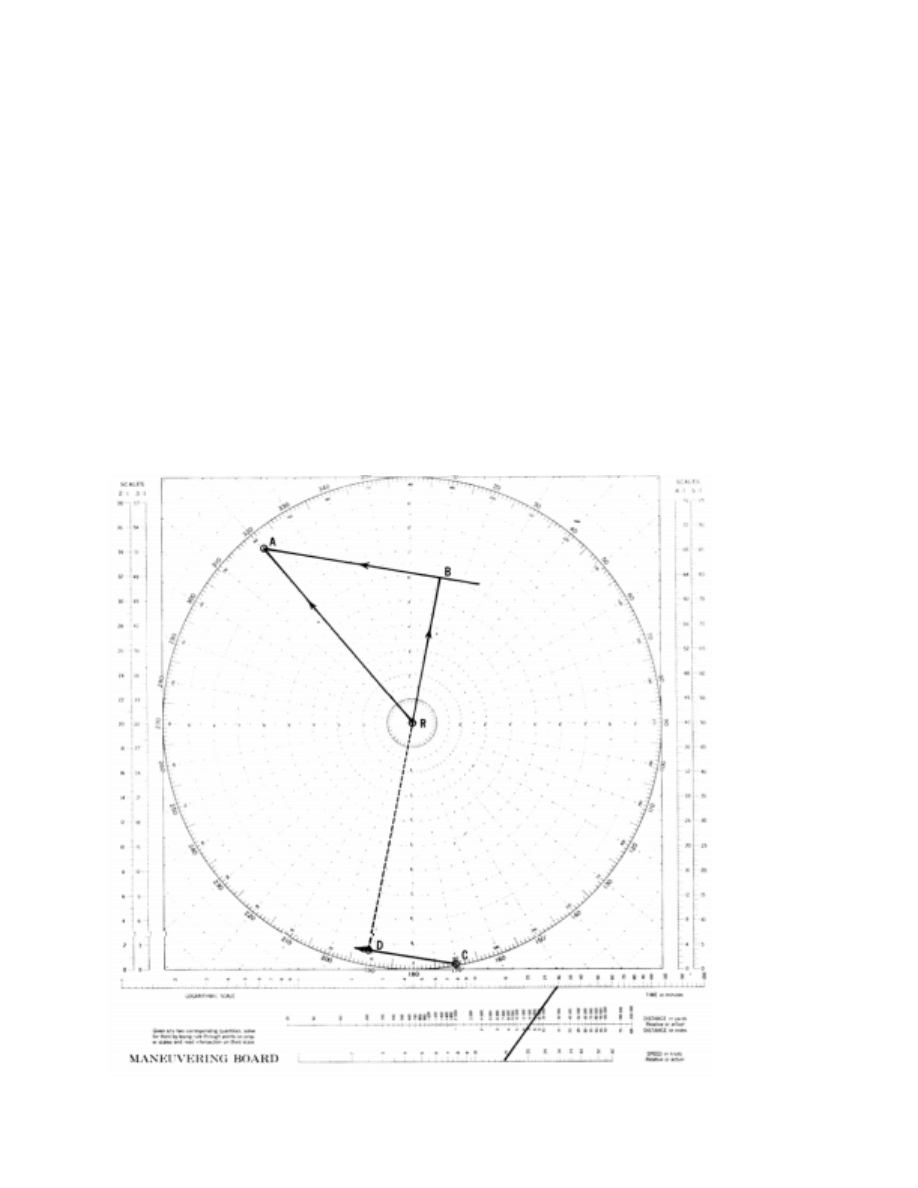
Solution: (Figure 3611) Consider the vessel remaining
at the center of the plot throughout the solution, as on
a radar PPI.
(1) To locate the position of the storm center relative to
the vessel, plot point C at a distance of 200 miles (scale 20:1)
in direction 170
°
from the center of the diagram. From the
center of the diagram, draw RA, the speed vector of the storm
center, in direction 320
°
, speed 19 knots (scale 2:1). From A
draw a line tangent to the 12-knot speed circle (labeled 6 at
scale 2:1) on the side opposite the storm center. From the cen-
ter of the diagram, draw a perpendicular to this tangent line,
locating point B. The line RB is the required speed vector for
the vessel. Its direction, 011
°
, is the required course.
(2) The path of the storm center relative to the vessel will
be along a line from C in the direction BA, if both storm and
vessel maintain course and speed. The point of nearest ap-
proach will be at D, the foot of a perpendicular from the center
of the diagram. This distance, at scale 20:1, is 187 miles.
(3) The length of the vector BA (14.8 knots) is the speed
of the storm with respect to the vessel. Mark this on the lowest
scale of the nomogram at the bottom of the diagram. The rel-
ative distance CD is 72 miles, by measurement. Mark this
(scale 10:1) on the middle scale at the bottom of the diagram.
Draw a line between the two points and extend it to intersect
the top scale at 29.2 (292 at 10:1 scale). The elapsed time is
therefore 292 minutes, or 4 hours 52 minutes.
Answers: (1) C 011
°
, (2) D 187 mi., (3) 4
h
52
m
.
The storm center will be dead astern at its nearest
approach.
As a general rule, for a vessel in the Northern Hemi-
sphere, safety lies in placing the wind on the starboard bow
in the dangerous semicircle and on the starboard quarter in
the less dangerous semicircle. If on the storm track ahead of
the storm, the wind should be put about 160
°
on the star-
board quarter until the vessel is well within the less
dangerous semicircle, and the rule for that semicircle then
followed. In the Southern Hemisphere the same rules hold,
but with respect to the port side. With a faster than average
vessel, the wind can be brought a little farther aft in each
case. However, as the speed of the storm increases along its
track, the wind should be brought farther forward. If land
interferes with what would otherwise be the best maneuver,
the solution should be altered to fit the circumstances.
If the vessel is faster than the storm, it is possible to
overtake it. In this case, the only action usually needed is to
slow enough to let the storm pull ahead.
In all cases, one should be alert to changes in the direc-
tion of movement of the storm center, particularly in the
area where the track normally curves toward the pole. If the
storm maintains its direction and speed, the ship’s course
should be maintained as the wind shifts.
If it becomes necessary for a vessel to heave to, the
characteristics of the vessel should be considered. A power
vessel is concerned primarily with damage by direct action
of the sea. A good general rule is to heave to with head to
the sea in the dangerous semicircle, or stern to the sea in the
less dangerous semicircle. This will result in greatest
amount of headway away from the storm center, and least
amount of leeway toward it. If a vessel handles better with
the sea astern or on the quarter, it may be placed in this po-
sition in the less dangerous semicircle or in the rear half of
the dangerous semicircle, but never in the forward half of
518
TROPICAL CYCLONES
the dangerous semicircle. It has been reported that when the
wind reaches hurricane speed and the seas become con-
fused, some ships ride out the storm best if the engines are
stopped, and the vessel is left to seek its own position, or lie
ahull. In this way, it is said, the ship rides with the storm in-
stead of fighting against it.
In a sailing vessel attempting to avoid a storm center,
one should steer courses as near as possible to those pre-
scribed above for power vessels. However, if it becomes
necessary for such a vessel to heave to, the wind is of great-
er concern than the sea. A good general rule always is to
heave to on whichever tack permits the shifting wind to
draw aft. In the Northern Hemisphere, this is the starboard
tack in the dangerous semicircle, and the port tack in the
less dangerous semicircle. In the Southern Hemisphere
these are reversed.
While each storm requires its own analysis, and fre-
quent or continual resurvey of the situation, the general
rules for a steamer may be summarized as follows:
Northern Hemisphere
Right or dangerous semicircle: Bring the wind on the
starboard bow (045° relative), hold course and
make as much way as possible. If necessary, heave
to with head to the sea.
Left or less dangerous semicircle: Bring the wind on
the starboard quarter (135
°
relative), hold course
and make as much way as possible. If necessary,
heave to with stern to the sea.
On storm track, ahead of center: Bring the wind 2
points on the starboard quarter (about 160
°
rela-
tive), hold course and make as much way as
possible. When well within the less dangerous
semicircle, maneuver as indicated above.
On storm track, behind center: Avoid the center by
Figure 3611. Determining the course to avoid the storm center.

TROPICAL CYCLONES
519
the best practicable course, keeping in mind the
tendency of tropical cyclones to curve northward
and eastward.
Southern Hemisphere
Left or dangerous semicircle: Bring the wind on the
port bow (315
°
relative), hold course and make as
much way as possible. If necessary, heave to with
head to the sea.
Right or less dangerous semicircle: Bring the wind
on the port quarter (225
°
relative), hold course and
make as much way as possible. If necessary, heave
to with stern to the sea.
On storm track, ahead of center: Bring the wind
about 200
°
relative, hold course and make as much
way as possible. When well within the less dan-
gerous semicircle, maneuver as indicated above.
On storm track, behind center: Avoid the center by
the best practicable course, keeping in mind the
tendency of tropical cyclones to curve southward
and eastward.
It is possible, particularly in temperate latitudes after
the storm has recurved, that the dangerous semicircle is the
left one in the Northern Hemisphere (right one in the South-
ern Hemisphere). This can occur if a large high lies north of
the storm and causes a tightening of the pressure gradient in
the region.
The Typhoon Havens Handbook for the Western Pacif-
ic and Indian Oceans is published by the Naval
Oceanographic and Atmospheric Research Lab (NOARL)
Monterey, California, as an aid to captains and command-
ing officers of ships in evaluating a typhoon situation, and
to assist them in deciding whether to sortie, to evade, to re-
main in port, or to head for the shelter of a specific harbor.
CONSEQUENCES OF TROPICAL CYCLONES
3612. High Winds And Flooding
The high winds of a tropical cyclone inflict widespread
damage when such a storm leaves the ocean and crosses
land. Aids to navigation may be blown out of position or de-
stroyed. Craft in harbors, often lifted by the storm surge,
break moorings or drag anchor and are blown ashore and
against obstructions. Ashore, trees are blown over, houses
are damaged, power lines are blown down, etc. The greatest
damage usually occurs in the dangerous semicircle a short
distance from the center, where the strongest winds occur.
As the storm continues on across land, its fury subsides
faster than it would if it had remained over water.
Wind instruments are usually incapable of measuring
the 175 to 200 knot winds of the more intense hurricanes; if
the instrument holds up, often the supporting structure
gives way. Doppler radar may be effective in determining
wind speeds, but may also be blown away.
Wind gusts, which are usually 30 to 50 percent higher
than sustained winds, add significantly to the destructive-
ness of the tropical cyclone. Many tropical cyclones that
reach hurricane intensity develop winds of more than 90
knots sometime during their lives, but few develop winds of
more than 130 knots.
Tropical cyclones have produced some of the world’s
heaviest rainfalls. While average amounts range from 6 to
10 inches, totals near 100 inches over a 4-day period have
been observed. A 24-hour world’s record of 73.62 inches
fell at Reunion Island during a tropical cyclone in 1952.
Forward movement of the storm and land topography have
a considerable influence on rainfall totals. Torrential rains
can occur when a storm moves against a mountain range;
this is common in the Philippines and Japan, where even
weak tropical depressions produce considerable rainfall. A
24-hour total of 46 inches was recorded in the Philippines
during a typhoon in 1911. As hurricane Camille crossed
southern Virginia’s Blue Ridge Mountains in August of
1969, there was nearly 30 inches of rain in about 8 hours.
This caused some of the most disastrous floods in the state’s
history.
Flooding is an extremely destructive by-product of the
tropical cyclone’s torrential rains. Whether an area will be
flooded depends on the physical characteristics of the drain-
age basin, rate and accumulation of precipitation, and river
stages at the time the rains begin. When heavy rains fall
over flat terrain, the countryside may lie under water for a
month or so, and while buildings, furnishings, and under-
ground power lines may be damaged, there are usually few
fatalities. In mountainous or hill country, disastrous floods
develop rapidly and can cause a great loss of life.
There have been occasional reports in tropical cyclones of
waves greater than 40 feet in height, and numerous reports in
the 30- to 40-foot category. However, in tropical cyclones,
strong winds rarely persist for a sufficiently long time or over
a large enough area to permit enormous wave heights to devel-
op. The direction and speed of the wind changes more rapidly
in tropical cyclones than in extratropical storms. Thus, the
maximum duration and fetch for any wind condition is often
less in tropical cyclones than in extratropical storms, and the
waves accompanying any given local wind conditions are gen-
erally not so high as those expected, with similar local wind
conditions, in the high-latitude storms. In hurricane Camille,
significant waves of 43 feet were recorded; an extreme wave
height reached 72 feet.
Exceptional conditions may arise when waves of cer-
tain dimensions travel within the storm at a speed equal to
the storm’s speed, thus, in effect, extending the duration
and fetch of the wave and significantly increasing its height.

520
TROPICAL CYCLONES
This occurs most often to the right of the track in the North-
ern Hemisphere (left of the track in the Southern
Hemisphere). Another condition that may give rise to ex-
ceptional wave heights is the intersection of waves from
two or more distinct directions. This may lead to a zone of
confused seas in which the heights of some waves will
equal the sums of each individual wave train. This process
can occur in any quadrant of the storm, so it should not be
assumed that the highest waves will always be encountered
to the right of the storm track in the Northern Hemisphere
(left of the track in the Southern Hemisphere).
When these waves move beyond the influence of the
generating winds, they become known as swell. They are
recognized by their smooth, undulating form, in contrast to
the steep, ragged crests of wind waves. This swell, particu-
larly that generated by the right side of the storm, can travel
a thousand miles or more and may produce tides 3 or 4 feet
above normal along several hundred miles of coastline. It
may also produce tremendous surf over offshore reefs
which normally are calm.
When a tropical cyclone moves close to a coast, wind
often causes a rapid rise in water level, and along with the
falling pressure may produce a storm surge. This surge is
usually confined to the right of the track in the Northern
Hemisphere (left of the track in the Southern Hemisphere)
and to a relatively small section of the coastline. It most of-
ten occurs with the approach of the storm, but in some
cases, where a surge moves into a long channel, the effect
may be delayed. Occasionally, the greatest rise in water is
observed on the opposite side of the track, when northerly
winds funnel into a partially landlocked harbor. The surge
could be 3 feet or less, or it could be 20 feet or more, de-
pending on the combination of factors involved.
There have been reports of a “hurricane wave,” described
as a “wall of water,” which moves rapidly toward the coastline.
Authenticated cases are rare, but some of the world’s greatest
natural disasters have occurred as a result of this wave, which
may be a rapidly rising and abnormally high storm surge. In In-
dia, such a disaster occurred in 1876, between Calcutta and
Chittagong, and drowned more than 100,000 persons.
Along the coast, greater damage may be inflicted by wa-
ter than by the wind. There are at least four sources of water
damage. First, the unusually high seas generated by the storm
winds pound against shore installations and craft in their
way. Second, the continued blowing of the wind toward land
causes the water level to increase perhaps 3 to 10 feet above
its normal level. This storm tide, which may begin when the
storm center is 500 miles or even farther from the shore,
gradually increases until the storm passes. The highest storm
tides are caused by a slow-moving tropical cyclone of large
diameter, because both of these effects result in greater dura-
tion of wind in the same direction. The effect is greatest in a
partly enclosed body of water, such as the Gulf of Mexico,
where the concave coastline does not readily permit the es-
cape of water. It is least on small islands, which present little
obstruction to the flow of water. Third, the furious winds
which blow around the wall of the eye create a ridge of water
called a storm wave, which strikes the coast and often in-
flicts heavy damage. The effect is similar to that of a seismic
sea wave, caused by an earthquake in the ocean floor. Both
of these waves are popularly called tidal waves. Storm
waves of 20 feet or more have occurred. About 3 or 4 feet of
this wave is due to the decrease of atmospheric pressure, and
the rest to winds. Like the damage caused by wind, damage
due to high seas, the storm surge and tide, and the storm wave
is greatest in the dangerous semicircle, near the center. The
fourth source of water damage is the heavy rain that accom-
panies a tropical cyclone. This causes floods that add to the
damage caused in other ways.
There have been many instances of tornadoes occur-
ring within the circulation of tropical cyclones. Most of
these have been associated with tropical cyclones of the
North Atlantic Ocean and have occurred in the West Indies
and along the gulf and Atlantic coasts of the United States.
They are usually observed in the forward semicircle or
along the advancing periphery of the storm. These torna-
does are usually short-lived and less intense than those that
occur in the midwestern United States.
When proceeding along a shore recently visited by a
tropical cyclone, a navigator should remember that time is
required to restore aids to navigation which have been
blown out of position or destroyed. In some instances the
aid may remain but its light, sound apparatus, or radiobea-
con may be inoperative. Landmarks may have been
damaged or destroyed, and in some instances the coastline
and hydrography may be changed.
Document Outline
- Chapter 36
Wyszukiwarka
Podobne podstrony:
TAB 8 Marine Meteorology Chapter 36 Tropical Cyclones
13 [dzień 5] Kościół tropicieli grzechu
Tropiciele Trzylatek Osiagniecia dziecka kwiecien, Tropiciele trzylatek pakiet, Osiągnięcia
Tropiciele Trzylatek Osiagniecia dziecka luty, Tropiciele trzylatek pakiet, Osiągnięcia
Tropiciele Czterolatek Przewidywane osiagniecia grudzien, Przewodniki metodyczne przedszkole
Tropiciele Trzylatek Zabawy ortofoniczne(1), Przewodniki metodyczne przedszkole
08 [dzień 1] Bóg Tropiciel
Tropiciele Trzylatek Osiagniecia dziecka czerwiec, Tropiciele trzylatek pakiet, Osiągnięcia
Przewodnik metodyczny Tropiciele Roczne przygotowanie przedszkolne Czesc 4
CHAPT37 weather obs
09 1 [dzień 2] Modlitwa na pożegnanie Tropiciela
Tropiciele Czterolatek Szczegolowy rozklad materialu pazdziernik, Przewodniki metodyczne przedszkole
Tropiciele Czterolatek Szczegolowy rozklad materialu listopad, Przewodniki metodyczne przedszkole
Tropiciele Czterolatek plan pracy luty, Przewodniki metodyczne przedszkole
Ogolny rozklad materialu, 5 latki TROPICIELE
więcej podobnych podstron