Arctic sea ice extent small as never before
Alerting message from the Arctic: The extent the the Arctic sea ice has reached on Sep. 8
with 4.240 million km2 a new historic minimum (Figure 1). Physicists of the University of
Bremen now confirm the apprehension existing since July 2011 that the ice melt in the Arctic
could further proceed and even exceed the previous historic minimum of 2007. It seems to be
clear that this is a further consequence of the man-made global warming with global
consequences. Directly, the livehood of small animals, algae, fishes and mammals like polar
bears and seals is more and more reduced.
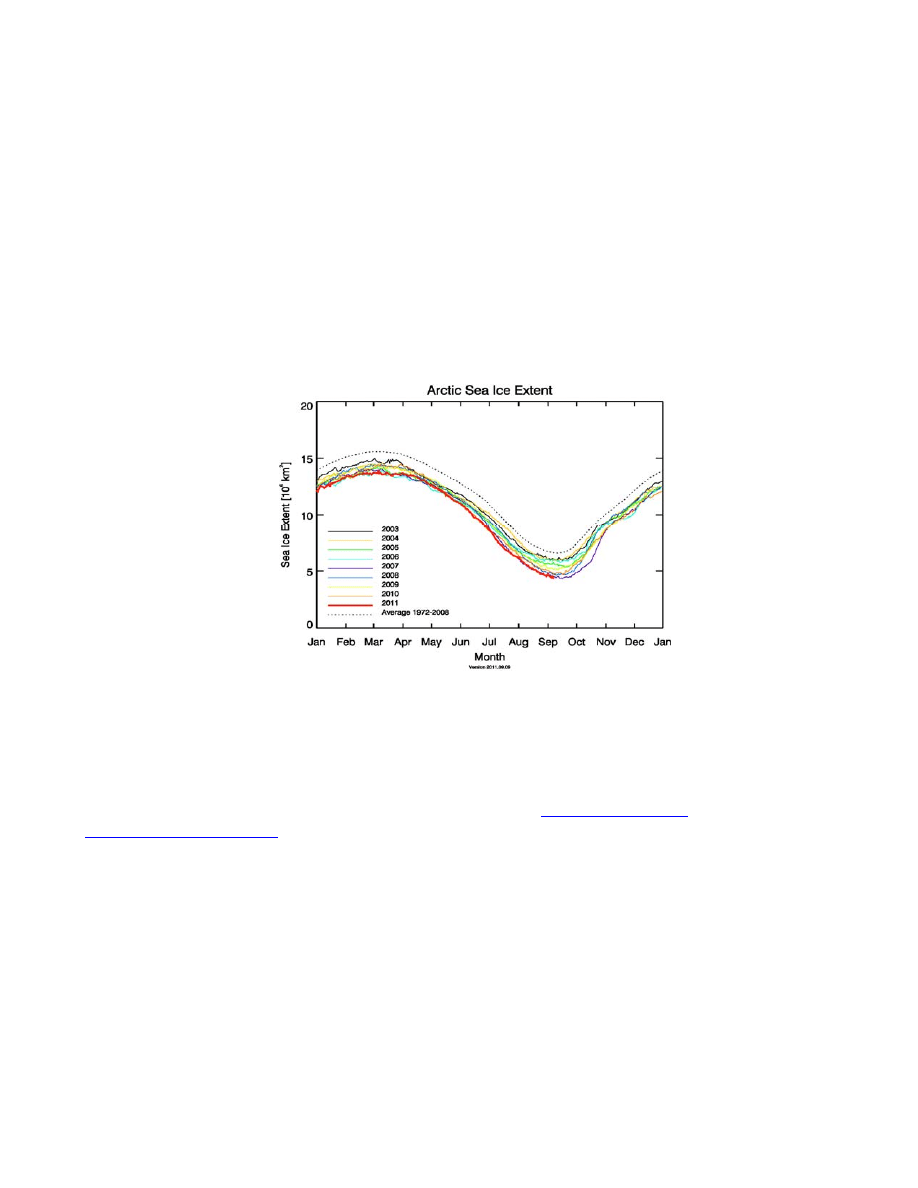
Figure 1: Sea ice extent of the years 2003 to 2011 with minima in September and Maxima in
March.
The work group of Georg Heygster at the University of Bremen has been observing the the
sea ice at both poles for many years. With the support of the ESA/GMES project Polar View,
daily maps of the sea ice extent are publicly provided at
. The retreat of the summer sea ice since 1972 amount to 50%. For
algae and small animals living at the lower side of the ice, less and less living environment
remains since they need a certain time to settle there. They are at the beginning of the food
chain for fishes, mammals and also man.
The extent of the Arctic sea ice shows a pronounced yearly cycle, with about 15 million km2 in
March and five million km2 in September. In 2007 however, it was only 4.267 million km2, the
previous smallest value since start of satellite observations in 1972, and most probably since
the last climate optimum about 8000 years ago. The current value is 27,000 km2 or 0.6%
lower and could even be undercut in the next weeks. The ice maps of the University of
Bremen show also that in this year, the Northwest and Northeast passages are ice free
simultaneously (Figure 2). This had happed for the first time in 2008, and in 2009 the German
shipping company Beluga has traveled it commercially for the first time. Recently, it
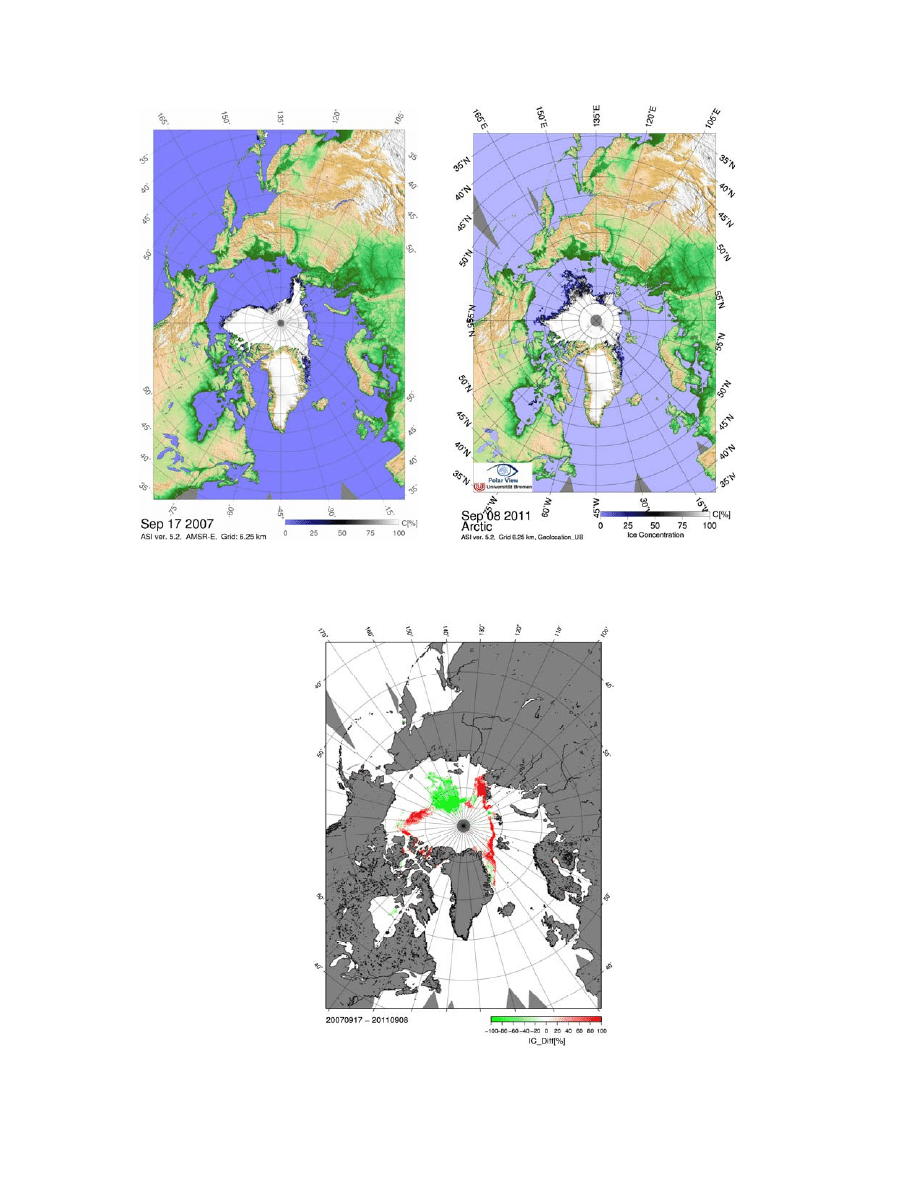
Figure 2: Sea ice concentration maps of the minimum 2007 and of the first day of historic
minimum in 2011. The 2011 sea ice area could reduce further in the next days.
Figure 3: Differences of ice concentrations of the minima in 2007 and 2011. Green: ice
covered in 2011, not in 2007, red vice versa.
was crossed in the record time of only 8 days by a tanker, traveling from Houston, Texas to
Map Ta Phut, Thailand.
Already in July the new record minimum had been expected because in this month the sea
ice extent was minimum, compared with the same month in other years. Due to the high sun
elevation and long days in July, the sea ice extent in this period is climatologically more
important than that of September. The increased insolation into the open water heat it up,
leading to an additional sea ice melt from the bottom and delays formation of new ice in
autumn. Moreover, the sea ice retreat can no more be explained with the natural variability
from one year to the next, caused e.g. by weather influence. Climate models show rather that
the reduction is related to the man-made global warming which, due to the ice albedo effect,
is particularly pronounced in the Arctic: an ice area melted by a small temperature increase
will then as open water have a much darker surface, absorb more solar radiation than before,
which causes additional heating.
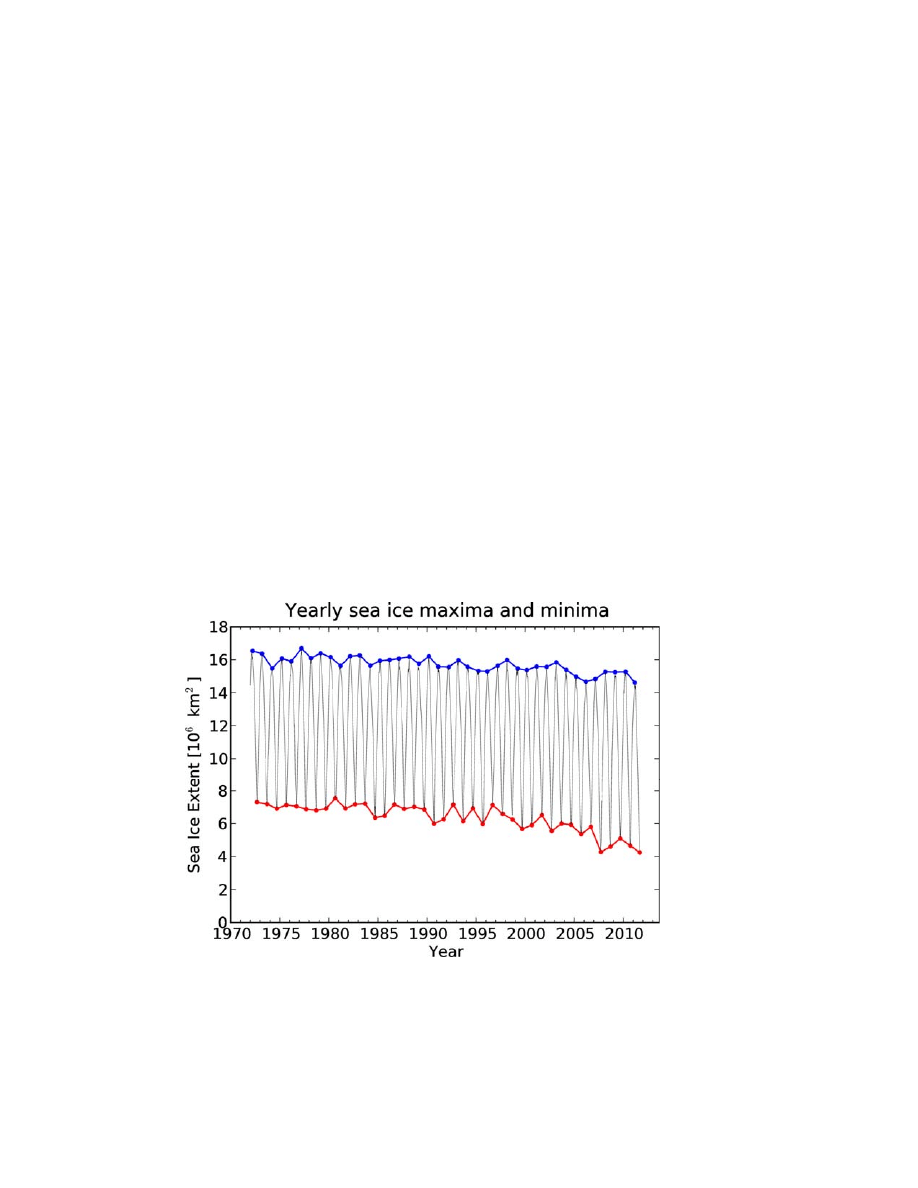
In contrast to the minimum in September, the yearly maximum in March has been decreasing
less rapidly (Figure 4): despite the reduced in in summer, in winter large areas of the arctic
ocean freeze up. However, this first-year ice is clearly thinner than multiyear ice having
survived one summer. Therefore, in summer first-year ice melts much easier than multiyear
ice and after a historic minimum, the ice cover needs several years to fully recover, even in an
unchanged climate. Observation of the last years show further, that the sea ice thickness
reduces, so that the total mass of Arctic sea ice decreases even more drastically than the sea
ice extent.
Figure 4: Yearly Arctic sea ice minima and maxima.
The daily sea ice maps of the University of Bremen are based on observations of the
Japanese microwave sensor AMSR-E, in orbit on board the NASA spacecraft Aqua since
2002. The institute receives the data from two servers in the US and Japan and produces the
maps based on these observations. The sea ice concentration retrieval is based on the ASI

(ARTIST Sea Ice) algorithm using the 89 GHz channels of AMSR-E. Other centers may use
data from other satellite instruments, e.g. the NSIDC uses SSMIS. Both sensors are passive
microwave sensors measuring at similar wavelengths.
Also the retrieval methods are different. While, again as an example, NSIDC uses the NASA
Team algorithm working at 19 and 37 GHz (about 15 and 8 mm wavelength), the University of
Bremen uses the channels at 89 GHz (about 3 mm wavelength). The latter observations have
a higher spatial resolution (about 6 km), but they are more influenced by weather (waver
vapor, clouds).
Different methods may find slightly different sea ice extent values. The difference of the sea
ice extent between the two mentioned data sets is in the order of 2 percent which at the same
time may be considered as an uncertainty margin of the retrieval methods.
Another important aspect of time series analysis is that it is essential to consider consistent
data. Here, this means that all data need to be derived using the same method. But even
then, because of the inherent uncertainty, there may be slight differences in the results. The
sea ice minimum 2011 is such a case. University of Bremen find the minimum 2011 about 1%
lower than that of 2007. But finding the 2011 minimum with another sensor and retrieval
method slightly higher that that of 2007 is just within the statistical variation.
The common and important point to our understanding is that all methods find consistently
that all minima since 2007 have been lower than all minima before, i.e. the last five minima
(2007-2011) are the four lowest on record, see Figure 4.
The data in the time series of Figure 4 cover 32 years. They stem from several different
satellite sensors and have been harmonized carefully based on the overlap periods of the
different sensors.
Further information:
University of Bremen
Institute of Environmental Physics
Dr. Georg Heygster
Tel. +49 (0)421 218 62180
E-Mail:
http://www.iup.uni-bremen.de/eng/
http://www.iup.uni-bremen.de/seaice/amsr
http://www.iup.uni-bremen.de/iuppage/satellite_index.html
Wyszukiwarka
Podobne podstrony:
Summer Arctic Sea Ice Extend
H G Winter Under Arctic Ice
Arctic Fire Fire and Ice 2 Erica Stevens
Barwiński, Marek Lemkos as a Small Relict Nation (2003)
Sheffield, Charles Cold as Ice 1 Cold as Ice(1)
Foreigner Cold As Ice
2 Qaqqaru The earth as opposed to the sea
Diana Palmer White Sand, Wild Sea as Diana Blayne
Never felt like this before Prolog, Rozdział 1
I ve Never Been In Love Before Frank Loesser
PREZENTacja dla as
3 1 Krzywa podazy AS ppt
4 Plant Structure, Growth and Development, before ppt
ArcticIndians
65 Caribbean Sea
PGUE AS
opracowanie cinema paradiso As dur
więcej podobnych podstron