
13. Pfanner, N. & Geissler, A. Versatility of the mitochondrial protein import machinery. Nature Rev. Mol.
Cell. Biol. 2, 339–349 (2001).
14. Winzeler, E. A. et al. Functional characterization of the S. cerevisiae genome by gene deletion and
parallel analysis. Science 285, 901–906 (1999).
15. Bukau, B. & Horwich, A. L. The Hsp70 and Hsp60 chaperone machines. Cell 92, 351–366 (1998).
16. Lill, R. & Kispal, G. Maturation of cellular Fe-S proteins: an essential function of mitochondria. Trends
Biochem. Sci. 25, 352–356 (2000).
17. Hollister, W. S. et al. Development and ultrastructure of Trachipleistophora hominis n.g., n.sp. after in
vitro isolation from an AIDS patient and inoculation into athymic mice. Parasitology 112, 143–154
(1996).
18. Huynen, M. A., Snel, B., Bork, P. & Gibson, T. J. The phylogenetic distribution of frataxin indicates a
role in iron-sulfur cluster protein assembly. Hum. Mol. Genet. 10, 2463–2468 (2001).
19. Akhmanova, A. et al. A hydrogenosome with a genome. Nature 396, 527–528 (1998).
20. van Der Giezen, M. et al. Conserved properties of hydrogenosomal and mitochondrial ADP/ATP
carriers: a common origin for both organelles. EMBO J. 21, 572–579 (2002).
21. Dyall, S. D. & Johnson, P. J. Origins of hydrogenosomes and mitochondria: evolution and organelle
biogenesis. Curr. Opin. Microbiol. 3, 404–411 (2000).
22. Tovar, J., Fischer, A. & Clark, C. G. The mitosome, a novel organelle related to mitochondria in the
amitochondrial parasite Entamoeba histolytica. Mol. Microbiol. 32, 1013–1021 (1999).
23. Mai, Z. et al. Hsp60 is targeted to a cryptic mitochondrion-derived organelle (‘crypton’) in the
microaerophilic protozoan parasite Entamoeba histolytica. Mol. Cell. Biol. 19, 2198–2205 (1999).
24. Canning, E. U. in Handbook of Protoctista (eds Margulis, L., Corliss, J. O., Melkonian, M. & Chapman,
D. J.) 53–72 (Jones and Bartlett, Boston, 1990).
25. Roger, A. J. et al. A mitochondrial-like chaperonin 60 gene in Giardia lamblia: evidence that
diplomonads once harbored an endosymbiont related to the progenitor of mitochondria. Proc. Natl
Acad. Sci. USA 95, 229–234 (1998).
26. Cheney, S. A., Lafranchi-Tristem, N. J. & Canning, E. U. Serological differentiation of microsporidia
with special reference to Trachipleistophora hominis. Parasite 8, 91–97 (2001).
27. Lockhart, P. J., Steel, M. A., Hendy, M. D. & Penny, D. Recovering evolutionary trees under a more
realistic model of sequence evolution. Mol. Biol. Evol. 11, 605–612 (1994).
28. Wilbanks, S. in Guidebook to the Molecular Chaperones and Protein-Folding Catalysts (ed. Gething,
M.-J. H.) 13–18 (Oxford Univ. Press, New York, 1997).
29. Buchberger, A. & Bukau, B. in Guidebook to the Molecular Chaperones and Protein-Folding Catalysts
(ed. Gething, M.-J. H.) 22–25 (Oxford Univ. Press, New York, 1997).
Acknowledgements
We thank E. Canning for the T. hominis culture system and advice on growing
microsporidia; M. Duchen and A. Ball for help with confocal microscopy; C. Thomson for
help with electron microscopy; and C. Danpure and G. Birdsey for comments on the
manuscript and help with heterologous transfection experiments. J.M.L. was supported by
a Wellcome Trust Research Leave Fellowship and Tenovus Scotland. B.A.P.W. was
supported by a Wellcome Trust Biodiversity studentship, R.P.H. was supported by a
Wellcome Trust University award.
Competing interests statement
The authors declare that they have no competing financial interests.
Correspondence and requests for materials should be addressed to T.M.E.
(e-mail: tme@nhm.ac.uk). The sequence of T. hominis mtHsp70 has been deposited in GenBank
under accession code AF492453.
..............................................................
Molecular evolution of FOXP2, a gene
involved in speech and language
Wolfgang Enard*, Molly Przeworski*, Simon E. Fisher†, Cecilia S. L. Lai†,
Victor Wiebe*, Takashi Kitano*, Anthony P. Monaco† & Svante Pa¨a¨bo*
* Max Planck Institute for Evolutionary Anthropology, Inselstrasse 22,
D-04103 Leipzig, Germany
† Wellcome Trust Centre for Human Genetics, University of Oxford,
Roosevelt Drive, Oxford OX3 7BN, UK
.............................................................................................................................................................................
Language is a uniquely human trait likely to have been a
prerequisite for the development of human culture. The ability
to develop articulate speech relies on capabilities, such as fine
control of the larynx and mouth
1
, that are absent in chimpanzees
and other great apes. FOXP2 is the first gene relevant to the
human ability to develop language
2
. A point mutation in FOXP2
co-segregates with a disorder in a family in which half of the
members have severe articulation difficulties accompanied by
linguistic and grammatical impairment
3
. This gene is disrupted
by translocation in an unrelated individual who has a similar
disorder. Thus, two functional copies of FOXP2 seem to be
required for acquisition of normal spoken language. We
sequenced the complementary DNAs that encode the FOXP2
protein in the chimpanzee, gorilla, orang-utan, rhesus macaque
and mouse, and compared them with the human cDNA. We also
investigated intraspecific variation of the human FOXP2 gene.
Here we show that human FOXP2 contains changes in amino-
acid coding and a pattern of nucleotide polymorphism, which
strongly suggest that this gene has been the target of selection
during recent human evolution.
FOXP2 (forkhead box P2) is located on human chromosome
7q31, and its major splice form encodes a protein of 715 amino acids
belonging to the forkhead class of transcription factors
2
. It contains
a glutamine-rich region consisting of two adjacent polyglutamine
tracts, encoded by mixtures of CAG and CAA repeats. Such repeats
are known to have elevated mutation rates. In the case of FOXP2,
the lengths of the polyglutamine stretches differed for all taxa
studied. Variation in the second polyglutamine tract has been
observed in a small family affected with speech and language
impairment, but this did not co-segregate with disorder, suggesting
that minor changes in length may not significantly alter the function
of the protein
4
. If the polyglutamine stretches are disregarded, the
human FOXP2 protein differs at only three amino-acid positions
from its orthologue in the mouse (Fig. 1). When compared with a
collection of 1,880 human–rodent gene pairs
5
, FOXP2 is among the
5% most-conserved proteins. The chimpanzee, gorilla and rhesus
macaque FOXP2 proteins are all identical to each other and carry
only one difference from the mouse and two differences from the
human protein, whereas the orang-utan carries two differences
from the mouse and three from humans (Fig. 1). Thus, although
the FOXP2 protein is highly conserved, two of the three amino-acid
differences between humans and mice occurred on the human
lineage after the separation from the common ancestor with the
chimpanzee. These two amino-acid differences are both found in
exon 7 of the FOXP2 gene and are a threonine-to-asparagine and an
asparagine-to-serine change at positions 303 and 325, respectively.
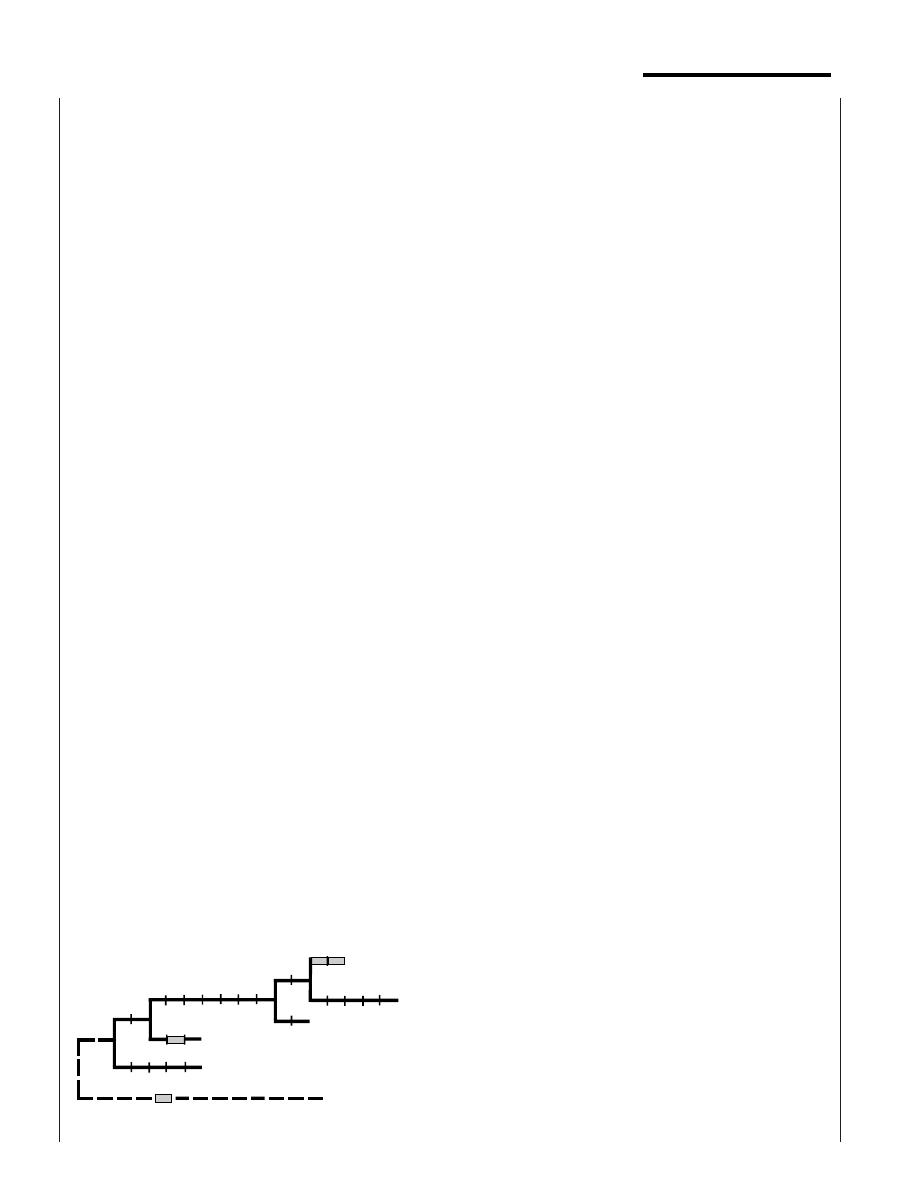
Figure 2 shows the amino-acid changes, as well as the silent changes,
mapped to a phylogeny of the relevant primates.
We compared the FOXP2 protein structures predicted by a
variety of methods
6
for humans, chimpanzees, orang-utans and
mice. Whereas the chimpanzee and mouse structures were essen-
tially identical and the orang-utan showed only a minor change in
secondary structure, the human-specific change at position 325
creates a potential target site for phosphorylation by protein kinase
C together with a minor change in predicted secondary structure.
Several studies have shown that phosphorylation of forkhead
transcription factors can be an important mechanism mediating
transcriptional regulation
7,8
. Thus, although the FOXP2 protein is
extremely conserved among mammals, it acquired two amino-acid
changes on the human lineage, at least one of which may have
functional consequences. This is an intriguing finding, because
Table 1 Variation at the FOXP2 locus in humans
No. of chromosomes sequenced
40
Length covered (double stranded, all individuals)
14,063 bp
Divergence from the chimp sequence*
0.87%
No. of variable positions
47
Singletons (no. of variable sites occurring
at frequency 1 and 39)
31
v
W
(nucleotide diversity based on the no.
of polymorphic sites)
0.079%
v
p
(mean nucleotide diversity)
0.03%
v
H
(nucleotide diversity with more weight given
to alleles at high frequency
17
)
0.117%
D
(P , 0.01)†
22.20
H
(P , 0.05)‡
212.24
.............................................................................................................................................................................
* The corresponding value for the orang-utan is 2.5.
† A negative D
value indicates a relative excess of low-frequency alleles
15
.
‡ A negative H
value indicates a relative excess of high-frequency derived alleles
17
.
letters to nature
NATURE | VOL 418 | 22 AUGUST 2002 | www.nature.com/nature
869
© 2002 Nature Publishing Group
FOXP2 is the first gene known to be involved in the development of
speech and language.
To investigate whether the amino acids encoded in exon 7 are
polymorphic in humans, we sequenced this exon from 44 human
chromosomes originating from all major continents. In no case was
any amino-acid polymorphism found. Further, a study that ana-
lysed the complete coding region of FOXP2 in 91 unrelated
individuals of mainly European descent found no amino-acid
replacements except for one case of an insertion of two glutamine
codons in the second polyglutamine stretch
4
. Because the two
amino-acid variants specific to humans occur in 226 human
chromosomes, this suggests that they are fixed among humans.
The evolutionary lineages leading to humans and mice diverged
about 70 million years (Myr) ago
9,10
. Thus, during the roughly
130 Myr of evolution that separate the common ancestor of humans
and chimpanzees from the mouse, a single amino-acid change
occurred in the FOXP2 protein. By contrast, since the human and
chimpanzee lineages diverged about 4.6–6.2 Myr ago
11
, two fixed
amino-acid changes occurred on the human lineage whereas none
occurred on the chimpanzee and the other primate lineages, except
for one change on the orang-utan lineage. We used a likelihood
ratio
12
to test for constancy of the ratio of amino-acid replacements
over nucleotide changes that do not cause amino-acid changes
among the evolutionary lineages in Fig. 2. Whereas a significant
increase in this ratio was observed on the human lineage
(P , 0.001), no such increase was seen on any other lineage. This
finding is consistent with the action of positive selection on amino-
acid changes in the human lineage. However, the alternative
hypothesis of a relaxation of constraints on FOXP2 specific to the
human lineage cannot be excluded on the basis of these data alone.
If these two changes in amino-acid encoding (or some other
feature of the human FOXP2 gene) were positively selected recently
during human evolution, traces of a selective sweep should be
detectable in the pattern of variation found among humans
13,14
. To
investigate this possibility, we sequenced a segment of 14,063 base
pairs (bp) covering introns 4, 5 and 6 of the FOXP2 gene in seven
individuals from Africa, four from Europe, one from South Amer-
ica, five from mainland Asia and three from Australia and Papua
New Guinea. In addition, we sequenced the same segment in a
chimpanzee from central Africa, a chimpanzee from western Africa
and an orang-utan (Table 1). One hallmark of a recent selective
sweep is that more low-frequency alleles should be observed than
expected under a neutral model of a random-mating population of
constant size. To test this prediction, we calculated Tajima’s D
statistic
15
. The value is 22.20 for our sample, indicating a sharp
excess of rare alleles. Under the standard neutral model outlined
above, the probability of such an excess by chance is 0.002.
Population growth can also lead to negative D values throughout
the genome. However, the value of D at FOXP2 is unusually low
compared with other loci. For example, among 313 human genes
16
Human
MMQESATETI SNSSMNQNGM STLSSQLDAG SRDGRSSGDT SSEVSTVELL HLQQQQALQA ARQLLLQQQT SGLKSPKSSD KQRPLQVPVS VAMMTPQVIT
Chimp
.......... .......... .......... .......... .......... .......... .......... .......... .......... ..........
Gorilla .......... .......... .......... .......... .......... .......... .......... .......... .......... ..........
Orang
.....V.... .......... .......... .......... .......... .......... .......... .......... .......... ..........
Rhesus .......... .......... .......... .......... .......... .......... .......... .......... .......... ..........
Mouse
.......... .......... .......... .......... .......... .......... .......... .........E .......... ..........
Human
PQQMQQILQQ QVLSPQQLQA LLQQQQAVML QQQQLQEFYK KQQEQLHLQL LQQQQQQQQQ QQQQQQQQQQ QQQQ-QQQQQ QQQQQQQQQQ QQHPGKQAKE
Chimp
.......... .......... .......... .......... .......... .......... .......... ....Q..... .......... ..........
Gorilla .......... .......... .......... .......... .......... ....-..... .......... ...--..... .......... ..........
Orang
.......... .......... .......... .......... .......... ....-..... .......... ....-..... .......... ..........
Rhesus .......... .......... .......... .......... .......... ....-..... .......... ....-..... .......... ..........
Mouse
.......... .......... .......... .......... ..........
....-....
. .......... ....Q..... .......... ..........
Human
QQQQQQQQQQ LAAQQLVFQQ QLLQMQQLQQ QQHLLSLQRQ GLISIPPGQA ALPVQSLPQA GLSPAEIQQL WKEVTGVHSM EDNGIKHGGL DLTTNNSSST
Chimp
.......... .......... .......... .......... .......... .......... .......... .......... .......... ..........
Gorilla .......... .......... .......... .......... .......... .......... .......... .......... .......... ..........
Orang
......-... .......... .......... .......... .......... .......... .......... .......... .......... ..........
Rhesus .......... .......... .......... .......... .......... .......... .......... .......... .......... ..........
Mouse
.......-.. .......... .......... .......... .......... .......... .......... .......... .......... ..........
Human
TSSNTSKASP PITHHSIVNG QSSVLSARRD SSSHEETGAS HTLYGHGVCK WPGCESICED FGQFLKHLNN EHALDDRSTA QCRVQMQVVQ QLEIQLSKER
Chimp
...T...... .......... .....N.... .......... .......... .......... .......... .......... .......... ..........
Gorilla ...T...... .......... .....N.... .......... .......... .......... .......... .......... .......... ..........
Orang
...T...... .......... .....N.... .......... .......... .......... .......... .......... .......... ..........
Rhesus ...T...... .......... .....N.... .......... .......... .......... .......... .......... .......... ..........
Mouse
...T...... .......... .....N.... .......... .......... .......... .......... .......... .......... ..........
Human
ERLQAMMTHL HMRPSEPKPS PKPLNLVSSV TMSKNMLETS PQSLPQTPTT PTAPVTPITQ GPSVITPASV PNVGAIRRRH SDKYNIPMSS EIAPNYEFYK
Chimp
.......... .......... .......... .......... .......... .......... .......... .......... .......... ..........
Gorilla .......... .......... .......... .......... .......... .......... .......... .......... .......... ..........
Orang
.......... .......... .......... .......... .......... .......... .......... .......... .......... ..........
Rhesus .......... .......... .......... .......... .......... .......... .......... .......... .......... ..........
Mouse
.......... .......... .......... .......... .......... .......... .......... .......... .......... ..........
Human
NADVRPPFTY ATLIRQAIME SSDRQLTLNE IYSWFTRTFA YFRRNAATWK NAVRHNLSLH KCFVRVENVK GAVWTVDEVE YQKRRSQKIT GSPTLVKNIP
Chimp
.......... .......... .......... .......... .......... .......... .......... .......... .......... ..........
Gorilla .......... .......... .......... .......... .......... .......... .......... .......... .......... ..........
Orang
.......... .......... .......... .......... .......... .......... .......... .......... .......... ..........
Rhesus .......... .......... .......... .......... .......... .......... .......... .......... .......... ..........
Mouse
.......... .......... .......... .......... .......... .......... .......... .......... .......... ..........
Human
TSLGYGAALN ASLQAALAES SLPLLSNPGL INNASSGLLQ AVHEDLNGSL DHIDSNGNSS PGCSPQPHIH SIHVKEEPVI AEDEDCPMSL VTTANHSPEL
Chimp
.......... .......... .......... .......... .......... .......... .......... .......... .......... ..........
Gorilla .......... .......... .......... .......... .......... .......... .......... .......... .......... ..........
Orang
.......... .......... .......... .......... .......... .......... .......... .......... .......... ..........
Rhesus .......... .......... .......... .......... .......... .......... .......... .......... .......... ..........
Mouse
.......... .......... .......... .......... .......... .......... .......... .......... .......... ..........
Human
EDDREIEEEP LSEDLE*
Chimp
.......... .......
Gorilla .......... .......
Orang
.......... .......
Rhesus .......... .......
Mouse
.......... .......
Figure 1 Alignment of the amino-acid sequences inferred from the FOXP2 cDNA sequences. The polyglutamine stretches and the forkhead domain are shaded. Sites that differ from the
human sequence are boxed.
letters to nature
NATURE | VOL 418 | 22 AUGUST 2002 | www.nature.com/nature
870
© 2002 Nature Publishing Group
sequenced in a sample of 164 chromosomes, only one has a more
negative value (22.25). A second prediction for a selective sweep at
a recombining locus is that more derived (that is, non-ancestral)
alleles at high frequency are expected than under the standard
neutral model, a feature reflected in a negative H value
17
. To estimate
H, we inferred the ancestral states of variable positions seen among
the humans by using the chimpanzee and orang-utan DNA
sequences. The H value of 212.24 deviates significantly from the
neutral expectation of zero (P ¼ 0.042) and would be even less likely
by chance under a model with population growth
13
. The strongly
negative D and H reflect an extreme skew in the frequency spectrum
of allelic variants at FOXP2 towards rare and high-frequency alleles.
Because we considered a worldwide sample of humans, population
structure might contribute to the negative D value. However, this
type of sampling scheme is highly unlikely to produce a significantly
negative H value. In contrast to demographic explanations, a
selective sweep affecting the FOXP2 gene can account for both
aspects of the frequency spectrum. We do not observe a reduced
diversity at human FOXP2 relative to its divergence from the
chimpanzee, as expected under a simple selective-sweep model.
However, the magnitude of the reduction in variability expected
after a selective sweep depends crucially on the rate of recombina-
tion. Estimates of recombination between intronic polymorphisms
taken from a study of FOXP2 (ref. 4) suggest that this region of the
gene experiences rates of genetic exchange roughly five times the
genome-wide average. If we assume that a selective sweep at a linked
site does account for the patterns of variability recovered at FOXP2,
it is noteworthy that the next gene is located 286 kilobases (kb) away
from the sequenced segment. A selective sweep is not expected to
lead to an excess of high-frequency derived alleles at sites that are
286 kb distant from the target of selection
13,17
. Thus, the best
candidates for the selected sites are the two amino-acid substi-
tutions specific to humans in exon 7.
Individuals with disruption of FOXP2 have multiple difficulties
with both expressive and receptive aspects of language and gram-
mar, and the nature of the core deficit remains a matter of debate
18–
20
. Nevertheless, a predominant feature of the phenotype of affected
individuals is an impairment of selection and sequencing of fine
orofacial movements
18
, an ability that is typical of humans and not
present in the great apes. We speculate that some human-specific
feature of FOXP2, perhaps one or both of the amino-acid substi-
tutions in exon 7, affect a person’s ability to control orofacial
movements and thus to develop proficient spoken language. If
this speculation is true, then the time when such a FOXP2 variant
became fixed in the human population may be pertinent with
regard to the evolution of human language. We estimated this
time point using a likelihood approach. Under a model of a
randomly mating population of constant size, the most likely date
since the fixation of the beneficial allele is 0, with approximate 95%
confidence intervals of 0 and 120,000 years. Our point-estimate of 0
reflects the fact that high-frequency alleles rapidly drift to fixation,
so an excess is most likely immediately after a selective sweep.
However, if population growth soon succeeds the fixation of the
advantageous allele, the rate of drift will be decreased and high-
frequency alleles may persist longer in the population. Thus, the
inclusion of population growth may push this time estimate back by
at most the time since the onset of human population growth, some
10,000–100,000 years ago
21
. In any case, our method suggests that
the fixation occurred during the last 200,000 years of human history,
that is, concomitant with or subsequent to the emergence of
anatomically modern humans
22
. This is compatible with a model
in which the expansion of modern humans was driven by the
appearance of a more-proficient spoken language
22
. However, to
establish whether FOXP2 is indeed involved in basic aspects of
human culture, the normal functions of both the human and the
chimpanzee FOXP2 proteins need to be clarified.
A
Methods
Isolation of cDNA sequences
For all analysed species, we amplified by polymerase chain reaction (PCR) and sequenced
overlapping fragments of the FOXP2 coding region from first-strand cDNA. Details are
available in Supplementary Information.
Genomic sequencing
Full details are available in Supplementary Information. In brief, we designed primers
from a human bacterial artificial chromosome (BAC) sequence (accession number
AC020606), PCR-amplified fragments of 6–14 kb, re-amplified 2.2-kb fragments from
these products that were then sequenced with internal primers. For each individual, each
nucleotide position was read from both strands. Sequence traces were manually analysed
for polymorphic positions using the program Seqman of the DNAStar package (see also
Supplementary Information).
Data analysis
We aligned sequences with the help of the program ClustalW
23
and calculated most
statistics with DnaSP 3.51 (ref. 24). P values for D and H were obtained by coalescent
simulations implemented for a fixed number of segregating sites, and assuming no
recombination. If we take into account recombination within the 14 kb, the P values
decrease (for example, P , 0.01 for H and P , 10
2
4
for D if one assumes an effective
population size of 10
4
and a recombination rate of 5 centimorgans (cM) per Mb). Because
the chimpanzee and orang-utan do not differ at any polymorphic position compared with
humans, we assumed no back mutations when estimating the P value for H. The likelihood
ratio tests for non-silent and silent substitutions were performed using the PAML
package
12
as described
25
(see Supplementary Information). We predicted the structure of
human, chimpanzee, mouse and orang-utan FOXP2 using the program PredictProtein
(http://www.embl-heidelberg.de/predictprotein/predictprotein.html)
6
, which includes
prediction of sites of protein kinase C phosphorylation by PROSITE
26
. The orang-utan-
specific alanine-to-valine change at position 6 results in the prediction of a b-sheet at
positions 8–10 in the orang-utan, and the human-specific change at position 325 results in
the prediction of a b-sheet in positions 323–326. However, these are not reliable and may
not be relevant. We used the University of California at Santa Cruz Human Genome
Project Working Draft, 22 December 2001 assembly (http://genome.cse.ucsc.edu), to
estimate distances to the closest genes. The middle of the sequenced region is 220 kb away
from the known 59 end and 54 kb away from the 39 end of FOXP2, respectively. The next
gene (supported by the cDNA sequence with GenBank accession number AF054589) is
located 286 kb distant in the 39 direction.
Modelling the selective sweep
A summary likelihood method (compare with ref. 27) was used to estimate the time, T,
since the fixation of the beneficial allele in the population. The polymorphism data was
summarized as v
H
(ref. 17) and p (ref. 28). We then ran coalescent simulations of a
selective sweep with recombination as in ref. 13. These simulations assume that we have
polymorphism data for a neutral locus, at some distance from a selected site, and that
selection acted on a newly arising variant. The likelihood of T is estimated as the
proportion of n simulated data sets, where jv
Hobs
2 v
Hsim
j , 1 and jp
obs
2 p
sim
j , 1
(here, n ¼ 3 £ 10
6
and 1 ¼ 0.2). The likelihood of T was evaluated over a grid of points
spaced every 1,000 generations. We then chose the T value that maximizes the probability
of obtaining the observed (v
H
, p) values. In addition to T, several additional parameters
are in this selective sweep model: the distance to the selected site, the effective population
size of humans, the strength of selection, the mutation rate and the recombination rate. It
is not computationally feasible to co-estimate all of these parameters, and we proceeded by
assuming that the values of most nuisance parameters are known exactly. We hypothesized
that one of the substitutions on the human lineage was the selected site and used a point
estimate of the population mutation rate (assuming 5 Myr to the common ancestor of a
human and chimpanzee DNA sequence). We modelled uncertainty in the recombination
rate per megabase by choosing the rate for each simulation from a g distribution with
parameters (5, 1); the mean was set to the recombination rate estimated from two
polymorphic markers in introns 2 and 16, respectively, of the FOXP2 gene
4
. The effective
0/7
1/2
0/5
1/131
0/5
0/2
0/2
2/0***
0/2
Human
Chimp
Gorilla
Orang-utan
Rhesus
Mouse
Figure 2 Silent and replacement nucleotide substitutions mapped on a phylogeny of
primates. Bars represent nucleotide changes. Grey bars indicate amino-acid changes.
letters to nature
NATURE | VOL 418 | 22 AUGUST 2002 | www.nature.com/nature
871
© 2002 Nature Publishing Group

population size was taken to be 10
4
, on the basis of estimates for other loci
29
. We tried three
different values for the selection coefficient: s ¼ 5%, 1% and 0.5%. For these parameters,
an s of 1% resulted in the highest likelihoods, so we reported the results for s ¼ 1%. If we
use the chi-squared approximation with one degree of freedom for the log-likelihood ratio
statistic 2lnðLikð ^
TÞ=LikðTÞÞ, we obtain an approximate 95% confidence interval for T of
[0, 4,000 generations]. However, this approximation may not be appropriate in this
context. Thus, we also ran 100 simulations to examine the distribution of T
ˆ when the true
T is equal to our maximum likelihood estimate of T ¼ 0 (here, n ¼ 5 £ 10
5
and 1 ¼ 0.2).
These simulations suggested an approximate 95% confidence interval of [0, 6,000
generations]. We assumed a generation time of 20 years for converting T into years.
Received 11 November 2001; accepted 29 July 2002; doi:10.1038/nature01025.
Published online 14 August 2002.
1. Liebermann, P. The Biology and Evolution of Language (Harvard Univ. Press, Cambridge,
Massachusetts, 1984).
2. Lai, C. S. L., Fisher, S. E., Hurst, J. A., Vargha-Khadem, F. & Monaco, A. P. A forkhead-domain gene is
mutated in a severe speech and language disorder. Nature 413, 519–523 (2001).
3. Fisher, S. E., Vargha-Khadem, F., Watkins, K. E., Monaco, A. P. & Pembrey, M. E. Localisation of a gene
implicated in a severe speech and language disorder. Nature Genet. 18, 168–170 (1998).
4. Newbury, D. F. et al. Foxp2 is not a major susceptibility gene for autism or specific language
impairment. Am. J. Hum. Genet. 70, 1318–1327 (2002).
5. Makalowski, W. & Boguski, M. S. Evolutionary parameters of the transcribed mammalian genome:
An analysis of 2,820 orthologous rodent and human sequences. Proc. Natl Acad. Sci. USA 95,
9407–9412 (1998).
6. Rost, B. Phd: Predicting one-dimensional protein structure by profile-based neural networks. Methods
Enzymol. 266, 525–539 (1996).
7. Kops, G. J. et al. Control of cell cycle exit and entry by protein kinase b-regulated forkhead
transcription factors. Mol. Cell. Biol. 22, 2025–2036 (2002).
8. Brunet, A. et al. Akt promotes cell survival by phosphorylating and inhibiting a forkhead transcription
factor. Cell 96, 857–868 (1999).
9. Kumar, S. & Hedges, S. B. A molecular timescale for vertebrate evolution. Nature 392, 917–920 (1998).
10. Eizirik, E., Murphy, W. J. & O’Brien, S. J. Molecular dating and biogeography of the early placental
mammal radiation. J. Hered. 92, 212–219 (2001).
11. Chen, F. C. & Li, W. H. Genomic divergences between humans and other hominoids and the effective
population size of the common ancestor of humans and chimpanzees. Am. J. Hum. Genet. 68, 444–456
(2001).
12. Yang, Z. Paml: A program package for phylogenetic analysis by maximum likelihood. Comput. Appl.
Biosci. 13, 555–556 (1997).
13. Przeworski, M. The signature of positive selection at randomly chosen loci. Genetics 160, 1179–1189
(2002).
14. Simonsen, K. L., Churchill, G. A. & Aquadro, C. F. Properties of statistical tests of neutrality for DNA
polymorphism data. Genetics 141, 413–429 (1995).
15. Tajima, F. Statistical method for testing the neutral mutation hypothesis by DNA polymorphism.
Genetics 123, 585–595 (1989).
16. Stephens, J. C. et al. Haplotype variation and linkage disequilibrium in 313 human genes. Science 293,
489–493 (2001).
17. Fay, J. C. & Wu, C. I. Hitchhiking under positive darwinian selection. Genetics 155, 1405–1413 (2000).
18. Vargha-Khadem, F., Watkins, K., Alcock, K., Fletcher, P. & Passingham, R. Praxic and nonverbal
cognitive deficits in a large family with a genetically transmitted speech and language disorder. Proc.
Natl Acad. Sci. USA 92, 930–933 (1995).
19. Gopnik, M. & Crago, M. B. Familial aggregation of a developmental language disorder. Cognition 39,
1–50 (1991).
20. Watkins, K. E., Dronkers, N. F. & Vargha-Khadem, F. Behavioural analysis of an inherited speech and
language disorder: Comparison with acquired aphasia. Brain 125, 452–464 (2002).
21. Wall, J. D. & Przeworski, M. When did the human population size start increasing? Genetics 155,
1865–1874 (2000).
22. Klein, G. The Human Career, Human Biological and Cultural Origins (Univ. Chicago Press, Chicago,
1989).
23. Thompson, J. D., Higgins, D. G. & Gibson, T. J. ClustalW: Improving the sensitivity of progressive
multiple sequence alignment through sequence weighting, position-specific gap penalties and weight
matrix choice. Nucleic Acids Res. 22, 4673–4680 (1994).
24. Rozas, J. & Rozas, R. Dnasp version 3: An integrated program for molecular population genetics and
molecular evolution analysis. Bioinformatics 15, 174–175 (1999).
25. Yang, Z. Likelihood ratio tests for detecting positive selection and application to primate lysozyme
evolution. Mol. Biol. Evol. 15, 568–573 (1998).
26. Bairoch, A., Bucher, P. & Hofmann, K. The prosite database, its status in 1997. Nucleic Acids Res. 25,
217–221 (1997).
27. Jensen, M. A., Charlesworth, B. & Kreitman, M. Patterns of genetic variation at a chromosome 4 locus
of Drosophila melanogaster and D. simulans. Genetics 160, 493–507 (2002).
28. Tajima, F. Evolutionary relationship of DNA sequences in finite populations. Genetics 105, 437–460
(1983).
29. Harpending, H. & Rogers, A. Genetic perspectives on human origins and differentiation. Annu. Rev.
Genom. Hum. Genet. 1, 361–385 (2000).
30. Watterson, G. A. On the number of segregating sites in genetical models without recombination.
Theor. Popul. Biol. 7, 256–276 (1975).
Supplementary Information accompanies the paper on Nature’s website
(http://www.nature.com/nature).
Acknowledgements
We thank F. Heissig for help with the cDNA sequencing; A. von Haeseler, G. Weiss and
S. Zo¨llner for help with the data analysis on an earlier version of the manuscript;
J. Wickings at the Centre International de Recherches Medicales for DNA samples of
central chimpanzees; and the Bundesminsterium fu¨r Bildung und Forschung, the Max
Planck Society and the Wellcome Trust for financial support. M.P. was supported by a
National Science Foundation postdoctoral research fellowship in bioinformatics. S.E.F. is a
Royal Society Research Fellow and A.P.M. is a Wellcome Trust Principal Research Fellow.
Competing interests statement
The authors declare that they have no competing financial interests.
Correspondence and requests for materials should be addressed to S.P.
(e-mail: paabo@eva.mpg.de). FOXP2 cDNA sequences of the mouse, rhesus macaque,
orang-utan, gorilla, chimpanzee and human have GenBank accession numbers AY079003,
AF512950, AF512949, AF512948, AF512947 and AF337817, respectively. Accession numbers for
genomic sequences for the twenty humans, two chimpanzees and one orang-utan are
AF515031–AF515050, AF515051–AF515052 and AF515053, respectively.
..............................................................
A corollary discharge maintains
auditory sensitivity during sound
production
James F. A. Poulet & Berthold Hedwig
Department of Zoology, University of Cambridge, Downing Street, Cambridge
CB2 3EJ, UK
.............................................................................................................................................................................
Speaking and singing present the auditory system of the caller
with two fundamental problems: discriminating between self-
generated and external auditory signals and preventing desensi-
tization. In humans
1
and many other vertebrates
2–7
, auditory
neurons in the brain are inhibited during vocalization but little is
known about the nature of the inhibition. Here we show, using
intracellular recordings of auditory neurons in the singing
cricket, that presynaptic inhibition of auditory afferents and
postsynaptic inhibition of an identified auditory interneuron
occur in phase with the song pattern. Presynaptic and postsyn-
aptic inhibition persist in a fictively singing, isolated cricket
central nervous system and are therefore the result of a corollary
discharge from the singing motor network. Mimicking inhibition
in the interneuron by injecting hyperpolarizing current sup-
presses its spiking response to a 100-dB sound pressure level
(SPL) acoustic stimulus and maintains its response to sub-
sequent, quieter stimuli. Inhibition by the corollary discharge
reduces the neural response to self-generated sound and protects
the cricket’s auditory pathway from self-induced desensitization.
We have examined auditory information processing in the sing-
ing cricket, Gryllus bimaculatus. Males attract females or warn off
rival males with songs that are generated by rubbing their forewings
together. Calling song can be produced for many hours on end with
a sound intensity greater than 100 dB SPL measured 50 mm from
the ear
8
. It consists of a 250-ms series of chirps that is separated by a
300-ms chirp interval (Fig. 1a). A chirp itself comprises four
syllables of 21-ms duration, which are generated by the closing
movements of the forewings. Crickets’ ears are located on their
forelegs and are therefore exposed fully to the self-generated sounds.
About 60 auditory afferent neurons project from the ear along the
fifth prothoracic nerve and terminate in the auditory neuropile of
the prothoracic ganglion
9
. Two local, mutually inhibitory omega 1
neurons (ON1s) are located in the prothoracic ganglion
10
. This
identified pair of bilaterally symmetrical interneurons receives
auditory information from the ear ipsilateral to their soma. These
interneurons are most sensitive to the carrier frequency (4.5 kHz) of
the male calling song.
Crickets must maintain auditory sensitivity during bouts of
singing because they respond behaviourally to auditory stimulation
letters to nature
NATURE | VOL 418 | 22 AUGUST 2002 | www.nature.com/nature
872
© 2002 Nature Publishing Group
Wyszukiwarka
Podobne podstrony:
Genolevures comparative genomics and molecular evolution of yeast
Blanchard European Unemployment The Evolution of Facts and Ideas
Hume A Treatise of Human Nature
Multistage evolution of the gra Nieznany
ostrom collective action and evolution of social norms
Molecular analysis of C glabrata
Becker The quantity and quality of life and the evolution of world inequality
Evolution of Profanity
Geodynamic evolution of the European Variscan fold belt
QUATERNARY EVOLUTION OF A CARPATHIAN FOOTHILLS - OSADY CZWARORZĘDOWE, Geologia GZMiW UAM 2010-2013,
Buss The evolution of self esteem
evolution of near extremal black holes
Corballis The Evolution of Language formatted
Geim The rise of graphene Nature Mater 6 183 191 March 2007
Lord of the Flies Analysis of Primitive Nature of Humanity
A History of the Evolution of E Nieznany (2)
Evolution of the Microstructure of Dynamically Loaded Materials
więcej podobnych podstron