
Journal of Chromatography A, 984 (2003) 89–96
www.elsevier.com / locate / chroma
E
valuation of headspace solid-phase microextraction for the analysis
of volatile carbonyl compounds in spirits and alcoholic beverages
*
´
Waldemar Wardencki , Piotr Sowinski, Janusz Curyl«o
´
Department of Analytical Chemistry
, Chemical Faculty, Technical University of Gdansk, 11 /12 Narutowicz Str.,
´
80-952 Gdansk, Poland
Received 2 August 2002; received in revised form 21 October 2002; accepted 21 October 2002
Abstract
A method was developed for the determination of C –C carbonyl compounds in alcoholic solutions using pentafluoro-
1
6
benzoxymation followed by headspace sampling solid-phase microextraction and subsequent analysis by GC with electron-
capture detection. Experimental conditions—alcohol content, exposure time, temperature and sample agitation were
optimised. In this method, a spirit or distilled alcoholic beverage is first adjusted to 20% (v / v) alcohol. Detection limits for
particular aldehydes and ketone varied from 0.05 to 0.5 mg / l and relative standard deviation was between 2.3 and 20%.
Generally, the method showed good linearity for the tested concentration range 8 mg / l–0.32 mg / l with regression
coefficients ranging between 0.9434 and 0.9983. The method was applied to the analysis of real alcoholic beverages
(vodkas).
2002 Published by Elsevier Science B.V.
Keywords
: Food analysis; Derivatisation, GC; Carbonyl compounds; Aldehydes
1
. Introduction
responsible for unpleasant organoleptic properties of
alcoholic drinks. Furthermore, they can bind in vivo
There is still a great demand for reliable and
to biological nucleophiles (proteins, DNA, cellular
sensitive methodology for determination of individ-
membranes, enzymes) resulting in toxic mutagenic
ual carbonyl compounds (aldehydes and ketones) in
and carcinogenic effects.
different foodstuffs and drinks due to their potential
Problems with carbonyl compounds determina-
adverse health effects [1,2].
tions are caused by: (a) their low concentrations and
In spirits and alcoholic beverages, low molecular
complex matrices (in alcoholic matrices up to 15
mass carbonyls (C –C ) are present as by-products
carbonyls may be present), (b) wide range of their
1
6
of yeast fermentation, intermediates in the formation
concentration (from mg / l to ng / l levels) and (c) by
of fusel oil and as a result of alcohol oxidation at
their high reactivity, especially in the case of unsatu-
various stages of beverage production. Their pres-
rated constituents.
ence is undesirable because some of them are
Carbonyl species can be determined by several
methods (titrimetric, colorimetric, enzymatic) but
HPLC and GC are the most convenient techniques.
*Corresponding author. Fax: 148-58-347-2694.
E-mail address
:
(W. Wardencki).
The application range of these techniques may be
0021-9673 / 02 / $ – see front matter
2002 Published by Elsevier Science B.V.
P I I : S 0 0 2 1 - 9 6 7 3 ( 0 2 ) 0 1 7 4 1 - 7

90
W
. Wardencki et al. / J. Chromatogr. A 984 (2003) 89–96
expanded by transformation of these compounds into
of 37% aqueous solution. Dimethylketone and hexa-
appropriate derivatives and using selective detection.
nal were obtained from POCH (Gliwice, Poland).
Four common derivatization agents, i.e. 2,4-dinitro-
Stock standard solutions of each carbonyl compound
phenylhydrazine
(DNPH)
[3,4],
2,4,6-trichloro-
were prepared in 10 ml of methanol (J.T. Baker,
phenylohydrazine (TCPH) [5], cysteamine (2-amino-
Deventer, Netherlands) and then diluted to the
ethanethiol)
[6,7]
and
O-(2,3,4,5,6-pentafluoro-
required concentration with neutral ethanol in the
benzyl)hydroxyamine (PFBHA) [8–12] have been
concentration range of 8 and 320 mg / l. The de-
found useful for this purpose. The derivatives formed
rivatizing reagent PFBHA (Sigma–Aldrich) was
(hydrazones, thiazolidines and oximes) prior to chro-
dissolved in doubly distilled water at a concentration
matographic analysis are usually extracted using
of 10 mg / ml.
appropriate solvents.
There are many papers on the determination of
2
.2. Instrumentation
carbonyl compounds in aqueous solutions but little
work has been done on their determination in
Gas chromatographic analyses were carried out
alcoholic solutions. Recently, the procedure recom-
with a Perkin-Elmer Auto System XL GC instrument
mended for the determination of aldehydes and
63
equipped with a
Ni ECD system and a split /
ketones, based on their derivatization with PFBHA
splitless injector. The column used was a Rtx-5
and GC with electron capture detection (ECD) has
capillary column (30 m30.32 I.D., 3 mm film
been adapted for alcoholic solutions [13]. Liquid–
thickness). The split / splitless injector and detector
liquid extraction (LLE) with subsequent GC–ECD
temperatures were set at 280 and 250 8C, respective-
permits to determine the C –C
carbonyls at the
1
6
ly. The initial oven temperature was kept at 100 8C
ng / ml level in different spirits and alcoholic bever-
for 1 min, which was increased to 160 8C at 3 8C /
ages.
min, then raised to 220 8C at 5 8C / min and finally to
Solid–phase microextraction (SPME) constitutes a
280 8C at 20 8C / min. The total time run was 36 min.
convenient alternative to commonly used extraction
techniques (especially LLE) because is a simple,
solvent-free, inexpensive, reliable and easily auto-
2
.3. Derivatisation procedure
mated technique [14]. This technique has been
successfully applied for the determination of a wide
PFBHA
reacts
with
the
carbonyl
species
spectrum of analytes in a large variety of matrices
(R COR ) to produce two oxime isomers (Z, E )
1
2
[15–19].
when the alkyl groups R
and R
are different.
1
2
In this work, the possibility of using headspace
Usually, the two isomers can be chromatographically
SPME sampling of oximes formed from corre-
separated [13]. The derivatisation process was car-
sponding carbonyl compounds in reaction with the
ried out in ethanol–water solutions. First, 10 ml of
PFBHA in alcoholic solutions to prior their chro-
an alcoholic solution of carbonyl compounds was
matographic determination has been studied.
placed in a 16-ml vial and then 0.1 ml of PFBHA
solution (10 mg / ml) was added. The vial was
capped with PTFE-faced silicone membrane and
2
. Experimental
heated using a water bath at 45 8C for 1.5 h. After
derivatisation, the sample was cooled to room tem-
2
.1. Reagents and standards
perature and two drops of concentrated sulfuric acid
were added to adjust to pH 2. After shaking, the
The standards of methanal, ethanal, propanal,
sample was ready for SPME experiments. The
propenal (acrolein), butanal, isotutanal (isobutylral-
relatively long time needed for derivatisation in-
dehyde),
pentanal
(valeraldehyde),
2-butenal
fluences the total time for analysis. Recently, a new
(crotonaldehyde), isopentanal (isovaleraldehyde) (all
derivatisation methodology with PFBHA using a
except methanal 97–99%) were purchased from
microwave oven was proposed reducing the reaction
Sigma–Aldrich. Methanal was provided in the form
time by a factor of 50–100 [20].
W
. Wardencki et al. / J. Chromatogr. A 984 (2003) 89–96
91
2
.4. SPME procedure
3
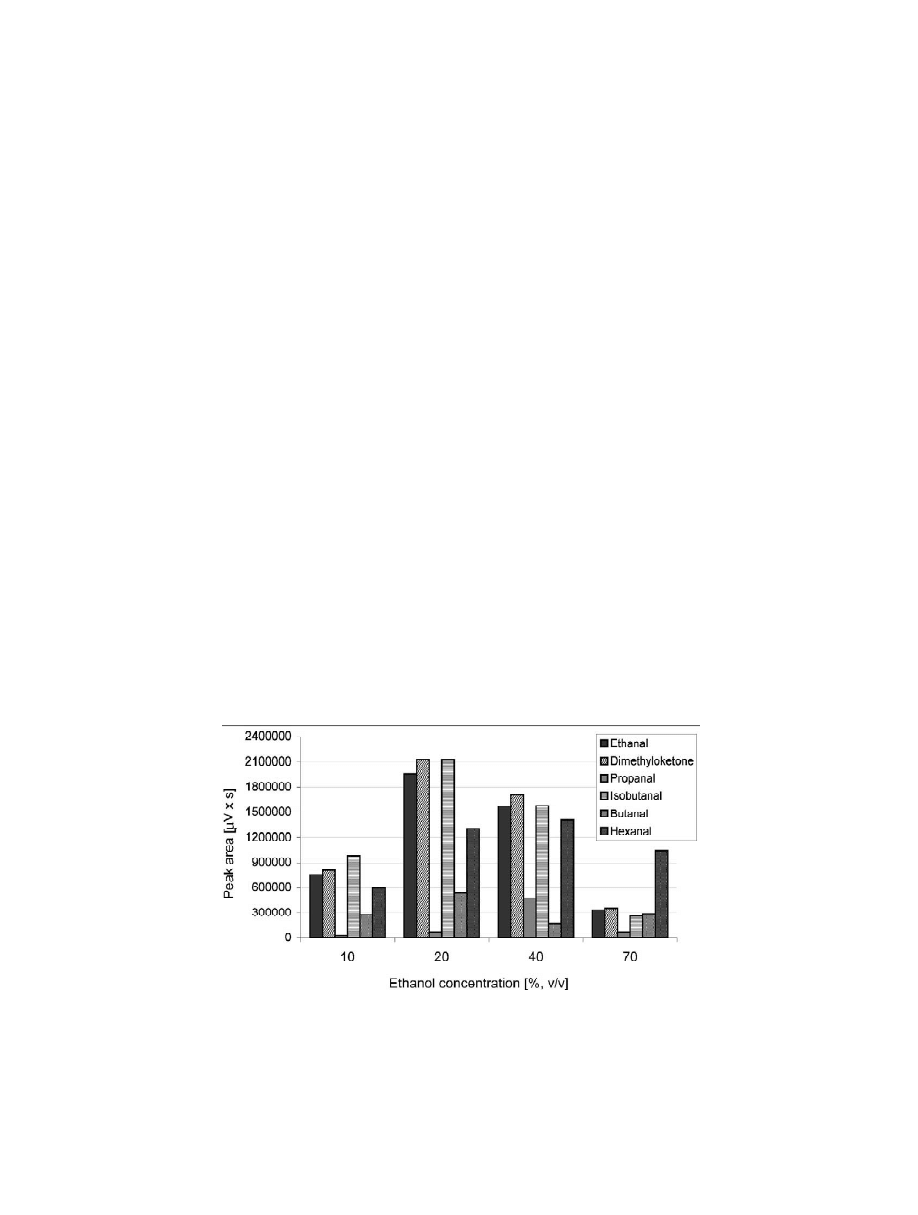
.1. Selection of optimal concentration of alcohol
A SPME holder for manual use and 100 mm
The presence of alcohol (methanol or ethanol) in
PDMS (polydimethylsiloxane) was purchased from
the investigated solutions may act as a co-solvent for
Supelco. This fiber was selected on the basis of
partitioning of carbonyl compounds in the phases
previous experiments with direct SPME of oximes
involved [21,22]. Therefore, the first step was to
from alcoholic solutions [13]. During extraction, the
check the effect of alcohol concentration on ex-
sample was agitated using a magnetic stirrer. Imme-
traction efficiency. The exposure was carried out for
diately after extraction, the fiber was introduced into
the samples with the same amount of carbonyl
the GC injector for 5 min in split mode (1:20). By
compounds (60 mg / l) but with different alcohol
exposing the fiber to the carrier gas stream, the
content (10, 20, 40 and 70%, v / v). Each experiment
analytes were thermally desorbed at 250 8C and
was carried out three times and results were aver-
transferred onto the GC column. Optimal desorption
aged. Fig. 1 presents the peak area of oximes versus
time was found to be 5 min. This time was enough to
ethanol concentration. It may be seen that the
ensure total desorption and no memory effects were
efficiency decreases with an increase in alcohol
observed which was confirmed by desorbing the
content. This suggests that alcohol competes with
same fiber a second time after the initial desorption.
absorption in PDMS film which was suggested
earlier [23–25]. Furthermore, higher concentrations
of alcohol in solution favour the conditions for
forming acetals and hemiacetals. On the other hand,
3
. Results and discussion
it should be noted that high dilution may decrease
the limit of detection for particular aldehydes and
The effects of the main parameters that can affect
acetone. Similar results were obtained when metha-
the SPME process from headspace, i.e. temperature,
nol was used [26]. The direct immersion of the fiber
extraction time, agitation and ionic strength were
in alcoholic solutions also confirmed this conclusion
evaluated. In the case of a solution containing
[26]. As a compromise between efficiency and limit
alcohols, it was also necessary to check the effect of
of detection, an ethanol–water (20:80) solution was
alcohol content for extraction efficiency.
assumed to be optimal.
Fig. 1. Effect of ethanol concentration on extraction efficiency of the oximes at 35 8C from headspace SPME of ethanol–water solutions
(100 mm PDMS fiber, 30 min exposure time, desorption time 5 min at 250 8C).
92
W
. Wardencki et al. / J. Chromatogr. A 984 (2003) 89–96
3
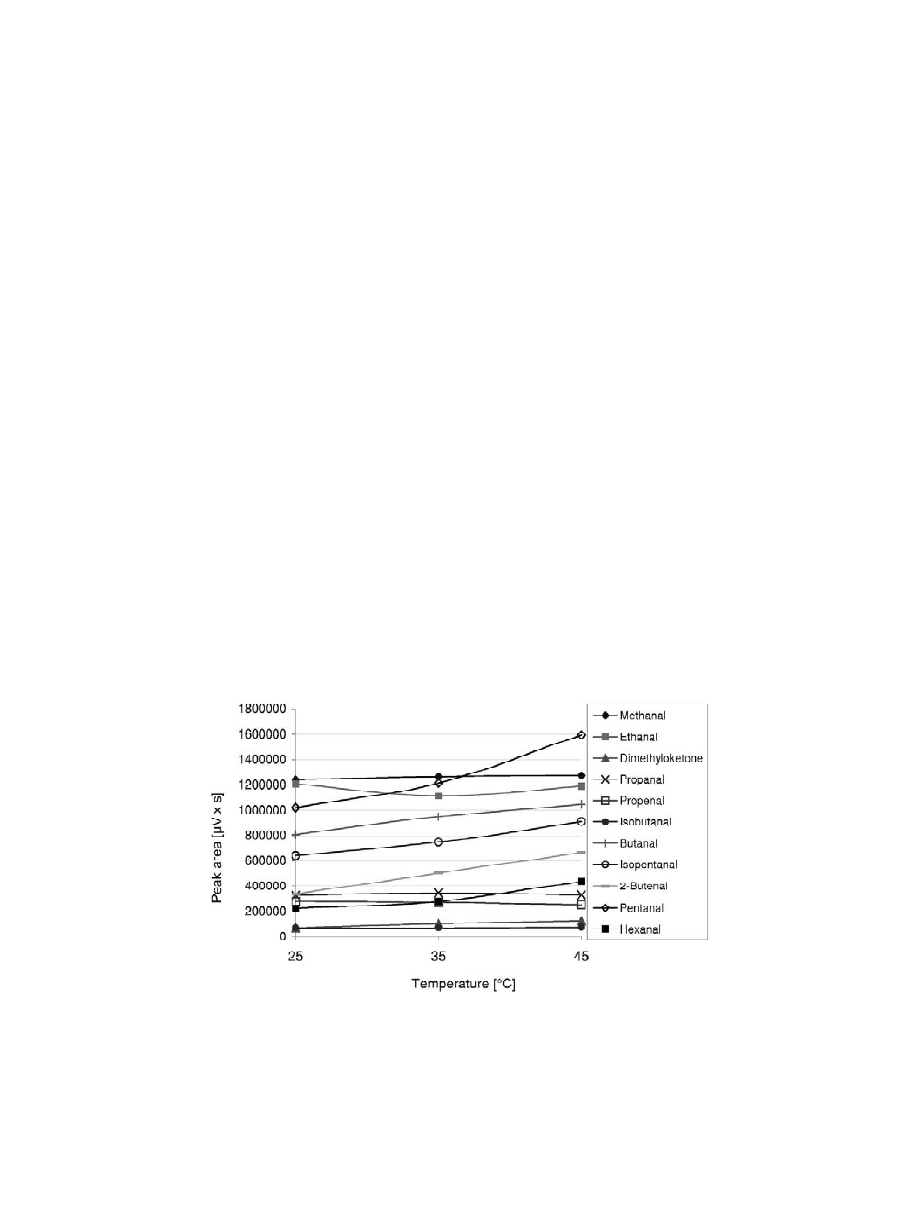
.2. Effect of temperature
constant temperature, all SPME experiments were
conducted at 35 8C.
Extraction temperature controls the diffusion rate
of analytes into the coating. An increase in extraction
3
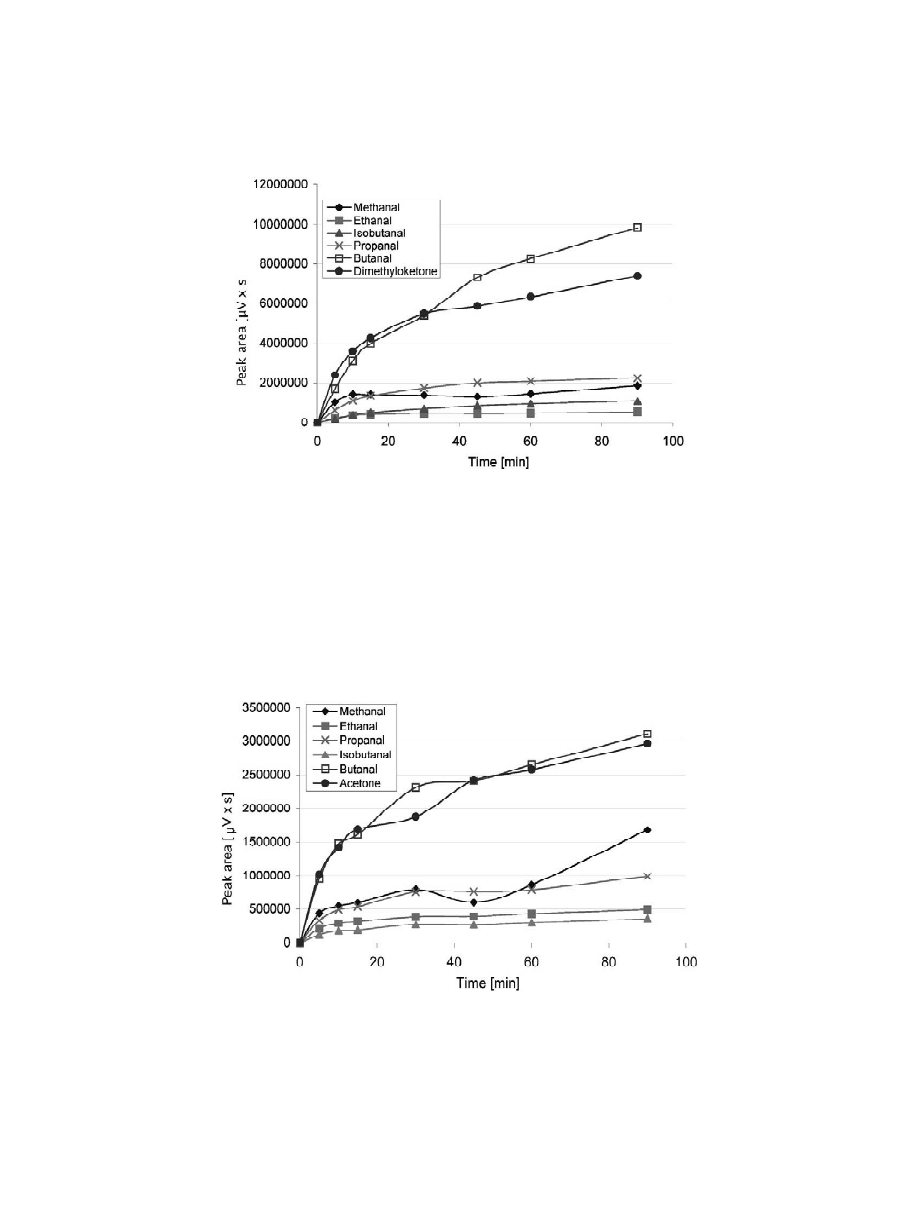
.3. Effect of extraction time and agitation
temperature causes an increase in the extraction rate
and a simultaneous decrease in the distribution
It is not required to reach the equilibrium by the
constant between the analytes and the fiber. Optimi-
SPME analysis. But exposure time strongly influ-
sation of extraction temperature is generally more
ences the extraction efficiency and eventually affects
important with headspace SPME than when working
the detection limit. Usually the exposure time is a
with direct immersion of the fiber in the liquid
compromise between the analysis time and required
sample. Bao et al. [8] and Cancho et al. [12] used
detection limit. Absorption–time profiles on PDMS
headspace extraction of oximes from aqueous solu-
100-mm fiber in headspace extraction mode were
tions at room temperature. Room temperature is also
generated for each carbonyl compound and are
recommended in the method proposed by the US
presented in Fig. 3. Each data point is the average of
Environmental Protection Agency (EPA) [9].
three independent measurements. For methanal,
The effect of temperature in the extraction was
ethanal, propanal and isobutanal, equilibrium was
investigated varying the temperature between 25 and
reached in 30 min. Higher-chain aldehydes and
45 8C with a constant extraction time. As is shown in
acetone needed longer exposure times. Considering
Fig. 2 an increase in temperature generally improves
this conclusion and duration time for analysis, an
the mobility of carbonyl species through liquid and
extraction time of 30 min was chosen for subsequent
gas phase and better efficiencies were obtained. In
analyses.
the case of acrolein, a decrease in the extraction
Agitation is an important parameter that affects the
yield was observed. This may be caused by instabili-
time profiles. For the analytes that are less volatile,
ty of this unsaturated aldehyde at elevated tempera-
the extraction efficiency is usually notably enhanced
ture. Considering the influence of temperature on the
by stirring because the transfer of the compounds
extraction efficiency (ambient temperature is usually
from liquid solutions to headspace could conceivably
variable in the range of 5 8C) to keep the vials at
be speeded up by agitation. This was confirmed by
Fig. 2. Influence of temperature on detector response area of the oximes formed from carbonyl compounds (concentration level 90 mg / l)
and headspace SPME extraction (30 min) with the 100 mm PDMS fiber from ethanol–water (20:80) solutions.
W
. Wardencki et al. / J. Chromatogr. A 984 (2003) 89–96
93
Fig. 3. Extraction-time profiles (magnetic stirring) for the oximes of carbonyl compounds in 20% ethanol–water solutions by headspace
SPME (100 mm PDMS fiber, 60 mg / l carbonyl compounds concentration, 30 min exposure time, desorption time 5 min at 250 8C).
our experiments, both for direct [26] and headspace
two agitation systems were observed [26]. Therefore,
SPME. Comparing Figs. 3 and 4, it is clear that
a magnetic stirrer was used in the following experi-
extraction efficiently was notably enhanced using a
ments.
magnetic stirrer, especially for higher-chain com-
ponents. In spite of the fact that ultrasonic agitation
3
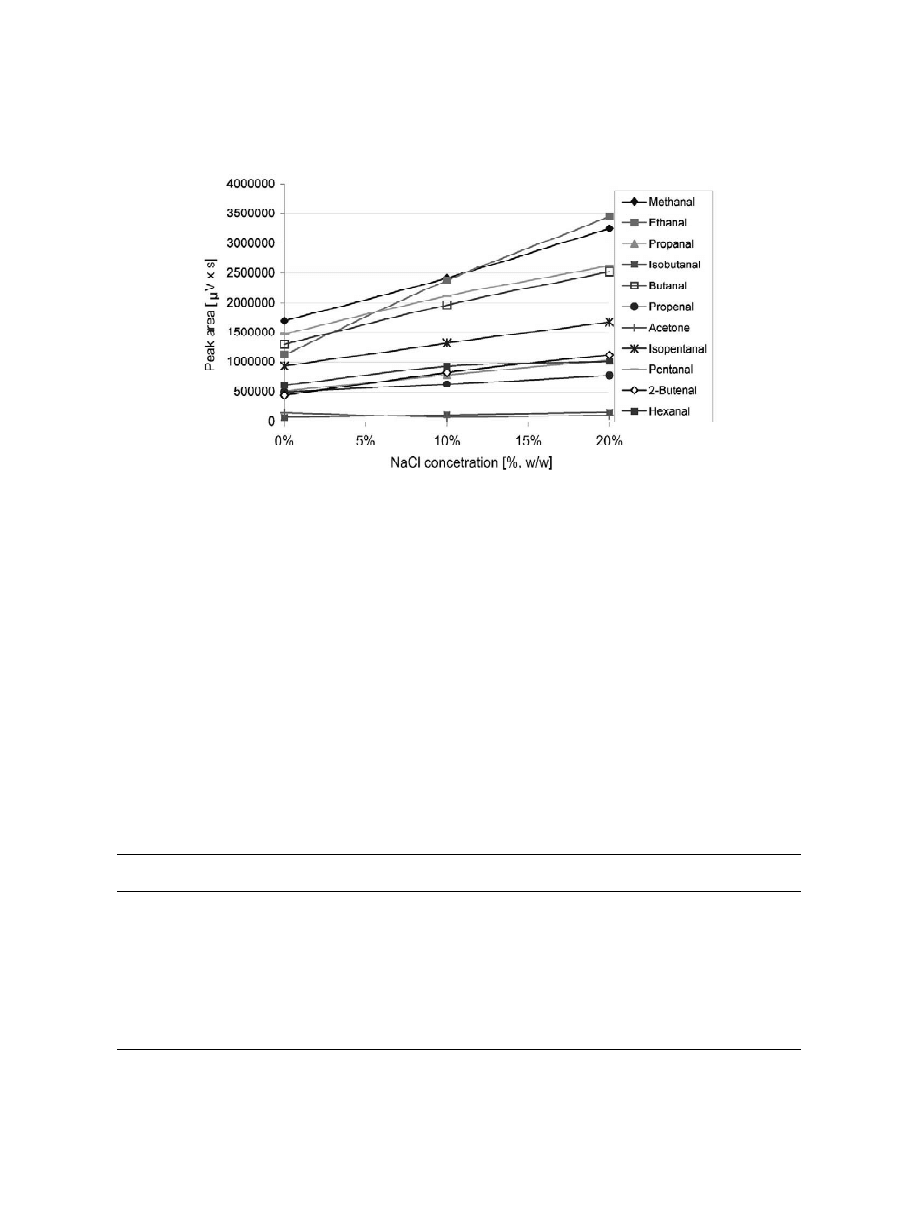
.4. Salt effect
of the sample should be more effective, because the
two phases are mixed, small differences between the
The addition of salting-out agents improved ex-
Fig. 4. Extraction-time profiles (without stirring) for the oximes of carbonyl compounds in ethanol–water (20:80) solutions by headspace
SPME (100 mm PDMS fiber, 60 mg / l carbonyl compounds concentration, 30-min exposure time, desorption time 5 min at 250 8C).
94
W
. Wardencki et al. / J. Chromatogr. A 984 (2003) 89–96
Fig. 5. Influence of sodium chloride content on detector response area of the oximes (100 mm PDMS fiber, 60 mg / l carbonyl compounds
concentration, 30-min exposure time, desorption time 5 min at 250 8C).
traction efficiency for many analytes in different
3
.5. Calibration
samples. The presence of dissociated ions decreases
the solubility of analytes, which then partition more
Calibration have to be carried out for each com-
readily into the headspace. Furthermore, a salt alters
pound in order to achieve accurate quantitative
the phase boundary enhancing the volatilisation into
results.
the headspace of analytes dissolved in liquid phase.
The linearity of the calibration graphs was tested
The effect of ionic strength on extraction ef-
with at least five calibration points over the expected
ficiency was evaluated by analysing the amount of
concentration range of carbonyl species in alcoholic
carbonyl compounds extracted in sample solutions
beverages. For each concentration level, five in-
containing 0, 10 and 20% (w / v) of sodium chloride
dependent measurements were made. Table 1 pre-
(20% alcohol solutions). These results are shown in
sents the equations for calibration curves and correla-
Fig. 5. As can be seen, the response of oximes
tion coefficients (r) and the relative standard devia-
increased in proportion to the added amount of NaCl.
tions (RSDs) for the compounds tested. The weak
Table 1
Parameters of calibration curves for selected carbonyl compounds in the concentration range from 8 mg / l to 0.32 mg / l using headspace
SPME extraction
Compound
Equation of calibration
Correlation
RSD (%,
curve
coefficient
n53)
Methanal
y514 327 282x24394
0.99825
10.5
Ethanal
y55 743 203x15992
0.99412
13.5
Dimethylketone
y52 403 352x128 727
0.99448
6.6
Propanal
y511 973 054x130 960
0.98917
15.4
Propenal
y59 463 557x120 842
0.97991
5.5
Butanal
y524 311 503x214 208
0.99761
9.8
Isopentanal
y541 180 319x2357 586
0.94337
13.7
2-Butenal
y56 645 899x1141 035
0.89896
11.1
Pentanal
y525 679 309x1206 671
0.96088
14.7
Hexanal
y517 739 371x2126 481
0.99401
11.1
W
. Wardencki et al. / J. Chromatogr. A 984 (2003) 89–96
95
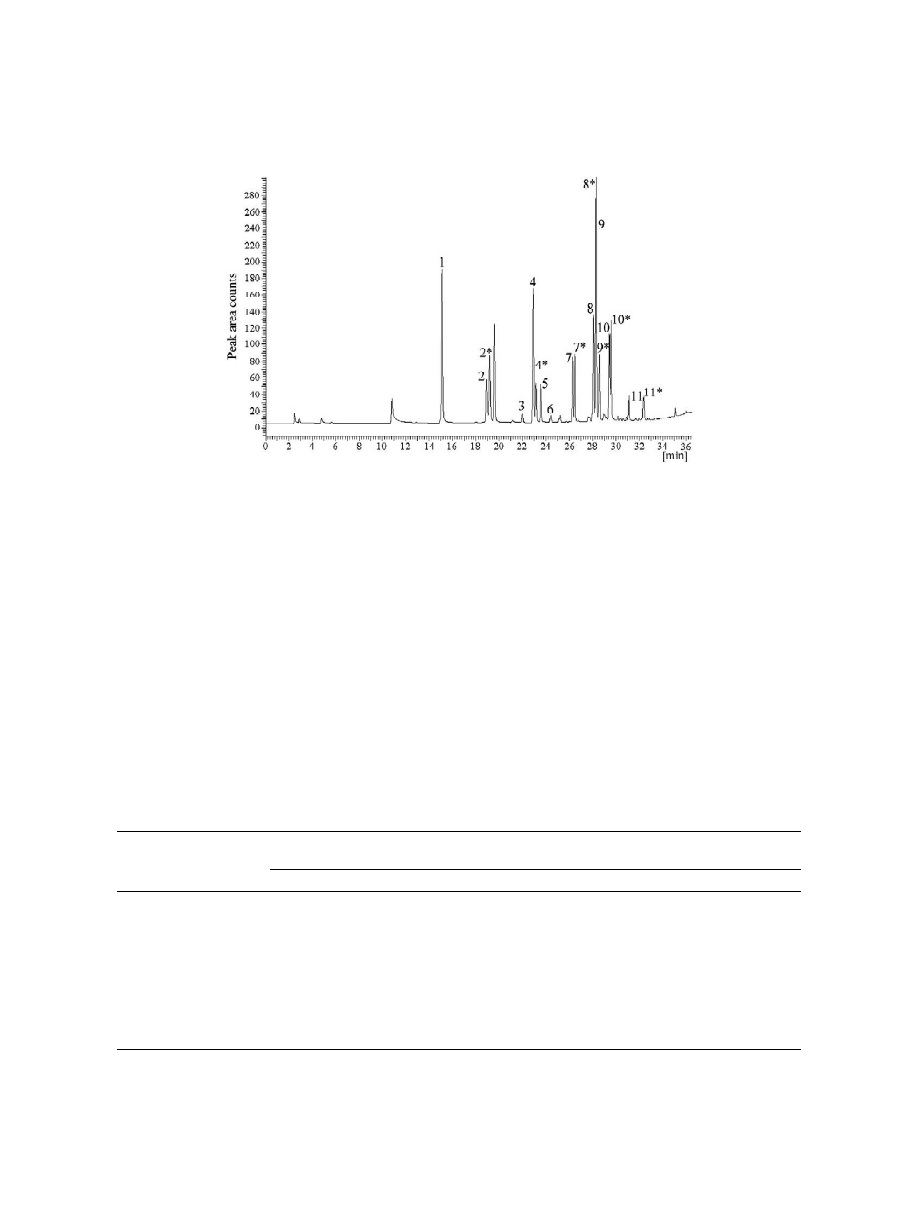
Fig. 6. GC–ECD chromatogram after headspace SPME extraction of oximes after derivatization of carbonyl compounds with PFBHA of
real sample (sample No. 1, vodka, 40%) diluted to 20% ethanol. 15Methanal; 2, 2*5ethanal; 35dimethylketone; 4,4*5propanal;
5,5*5propenal; 6,6*5isobutanal; 7,7*5butanal; 8,8*5isopentanal; 9,9*52-butenal; 10,10*5pentanal; 11,11*5hexanal. Numbers with and
without asterisks: E and Z isomers.
correlation for 2-butenal and isopentanal may be
distilled alcoholic beverages (vodkas) were analysed.
explained by the overlapping of corresponding oxime
Fig. 6 shows a chromatogram of oximes extracted
isomers and using only one peak for quantification.
under optimised conditions described above from
The detection limits were estimated as three times
alcoholic beverages (40%). The initial sample was
the standard deviation of the baseline noise and
diluted to 20% ethanol before the derivatisation and
ranged from 0.05 to 0.5 mg / l of 100% alcohol.
extraction steps. The content of particular com-
pounds was calculated for 1 liter of the 100% spirit
and is given in Table 2. The results obtained showed
3
.6. Real samples
that acetaldehyde was the most abundant aldehyde in
all samples of vodkas, ranging from 0.1 to 0.9 mg / l.
The head space SPME method developed was
It confirms that ethanol oxidation is a dominant
applied to real alcoholic samples. Four samples of
process in beverage production.
Table 2
Content of carbonyl compounds in distilled beverage (vodka, 40% ethanol) determined by the headspace SPME–GC–ECD procedure
Carbonyl
Concentration of carbonyl compounds in distilled alcoholic beverages
compound
(mg / l 100%, n53)
No. 1
No. 2
No. 3
No. 4
Methanal
0.010060.002
0.013060.002
0.010060.002
0.02260.004
Ethanal
0.102060.007
0.183060.013
0.070060.005
0.91360.062
Dimethylketone
0.006060.0006
0.014060.001
0.017060.002
0.11460.004
Propanal
0.001060.0002
0.001060.0002
–
0.08460.008
Propenal
–
–
–
0.11460.004
Butanal
0.005060.0005
0.005060.0005
0.002060.0002
0.008060.0007
Isopentanal
0.015060.002
0.012060.002
0.01060.002
0.03560.004
2-Butenal
0.034060.005
–
–
–
Pentanal
0.006060.0008
0.006060.0008
–
0.03760.005
Hexanal
0.027060.001
0.030060.001
0.019060.001
0.07260.012

96
W
. Wardencki et al. / J. Chromatogr. A 984 (2003) 89–96
[6] A. Yasuhara, T. Shibamoto, J. Chromatogr. 547 (1991) 291.
4
. Conclusions
[7] M.N. Lau, J.D. Ebeler, S.E. Ebeler, Am. J. Enol. Vitic. 50
(1999) 324.
The feasibility of SPME for the analysis of
[8] M. Bao, V. Pantani, O. Griffini, D. Burrini, D. Santiani, K.
carbonyl compounds in different distilled alcoholic
Barbieri, J. Chromatogr. A 809 (1998) 75.
beverages is demonstrated. First, a sample of spirit or
[9] EPA Method 556, Determination of Carbonyl Compounds in
Drinking Water by Pentafluorobenzylohydroxylamine De-
distilled alcoholic beverage is diluted to 20% (v / v)
rivatization and Capillary Gas Chromatography with Elec-
alcohol and carbonyls are derivatised with PFBHA.
tron Capture Detection, EPA, Office of Research and De-
Next, the corresponding oximes are extracted using
velopment National Exposure Research Laboratory, Cincin-
100 mm PDMS fiber by direct immersion into
nati, OH, USA, 1998.
solution at room temperature or from headspace at
[10] J. Nawrocki, I. Kalkowska, A. D©abrowska, J. Chromatogr. A
749 (1996) 157.
35 8C. The analytical characteristic of the headspace
[11] P.A. Martos, J. Pawliszyn, Anal. Chem. 70 (1998) 2311.
SPME method: linearity, precision and limit of
[12] B. Cancho, F. Ventura, M. Galceran, J. Chromatogr. A 943
detection is comparable with direct SPME [26]. But
(2002) 1.
it was proved that the headspace SPME sampling is
´
[13] W. Wardencki, J. Orlita, J. Namiesnik, Fresenius J. Anal.
less sensitive to the matrix effects and prolongs the
Chem. 369 (2001) 661.
[14] J. Pawliszyn, Solid Phase Microextraction: Theory and
life time of the fiber used. Total analysis time is
Practice, Wiley–VCH, New York, 1997.
about 2 h (1.5 h for derivatisation and 30 min for
[15] M. Correia, C. Delerue-Matos, A. Alves, Fresenius J. Anal.
chromatographic analysis).
Chem. 369 (2001) 646.
[16] G. Fitzgerald, K.J. James, K. MacNamara, M.A. Stack, J.
Chromatogr. A 896 (2000) 351.
[17] M. Fernandez, C. Padron, L. Marconi, S. Ghini, R. Colombo,
A
cknowledgements
A.G. Sabatini, S. Girotti, J. Chromatogr. A 922 (2001) 257.
´
[18] T. Gorecki, X. Yu, J.B. Pawliszyn, Analyst 124 (1999) 643.
This research was financially supported by the
[19] N.P. Brunton, D.A. Cronin, F.J. Monahan, R. Durcan, Food
Polish Scientific Committee (Grant 3 TO9A 141
Chem. 68 (2000) 339.
180).
[20] S. Strassnig, T. Wenzl, E.P. Lankmayr, J. Chromatogr. A 891
(2000) 267.
[21] M. Correia, C. Delerue-Matos, A. Alves, J. Chromatogr. A
889 (2000) 59.
R
eferences
[22] R. Eisert, K. Levsen, Fresenius J. Anal. Chem. 351 (1995)
555.
[1] D. Kitts, C. Wu, H. Stich, J. Agric. Food Chem. 41 (1993)
[23] S.E. Ebeler, M.B. Terrien, C. Butzke, J. Sci. Food Agric. 80
2353.
(2000) 625.
[2] V.J. Feron, H.P. Til, F. de Vrijer, R.A. Woutersen, F.R.
[24] D. De la Calle Garcia, S. Maguaghi, M. Reichenbacher, K.
Cassee, P.J. Van Bladeren, Mutat. Res. 259 (1991) 363.
Danzer, J. High Resolut. Chromatogr. 19 (1996) 257.
[3] M. Possanzini, V. DiPalo, Chromatographia 40 (1995) 134.
[25] A.L. Simplicio, L. Vilas Boas, J. Chromatogr. A 833 (1999)
¨
[4] M. Vogel, A. Buldt, U. Karst, Fresenius J. Anal. Chem. 366
35.
(2000) 781.
[26] W. Wardencki, in: Proceedings of the Aldehydes 2001
¨
[5] D.W. Lehmpuhl, J.W. Birks, J. Chromatogr. A 740 (1996) 71.
Conference, Munster, 6–8 June, 2001, p. 16.
Document Outline
- Evaluation of headspace solid-phase microextraction for the analysis of volatile carbonyl co
Wyszukiwarka
Podobne podstrony:
SPME for the analysis of short chain chlorinated paraffins i
Sexual behavior and the non construction of sexual identity Implications for the analysis of men who
SPME for the identification of MVOCs from moldy
Solid phase microextraction for the analysis of biological s
Rapid Preconcentration Enrichment Techniques for the Analysi
SHS, SPME and HS SPME for BTEX determination in aqueous samp
HS SPME procedures for gas chromatographic analysis of biolo
Analysis of virgin olive oil VOC by HS SPME coupled to GC MS
Analysis of chlorobenzenes in soils by HS SPME and GC MS
Energetic and economic evaluation of a poplar cultivation for the biomass production in Italy Włochy
Reading Price Charts Bar by Bar The Technical Analysis of Price Action for the Serious Trader Wiley
The American Society for the Prevention of Cruelty
[Pargament & Mahoney] Sacred matters Sanctification as a vital topic for the psychology of religion
Illiad, The Analysis of Homer's use of Similes
International Convention for the Safety of Life at Sea
61 881 892 Evaluation of PVD Coatings for Industrial Applications
51 721 736 Evaluation of the Cyclic Behaviour During High Temperature Fatique of Hot Works
Victory, The Analysis of the Poem
więcej podobnych podstron