
1
Cash flow forecasts
and managing cash
Chapter
24
2
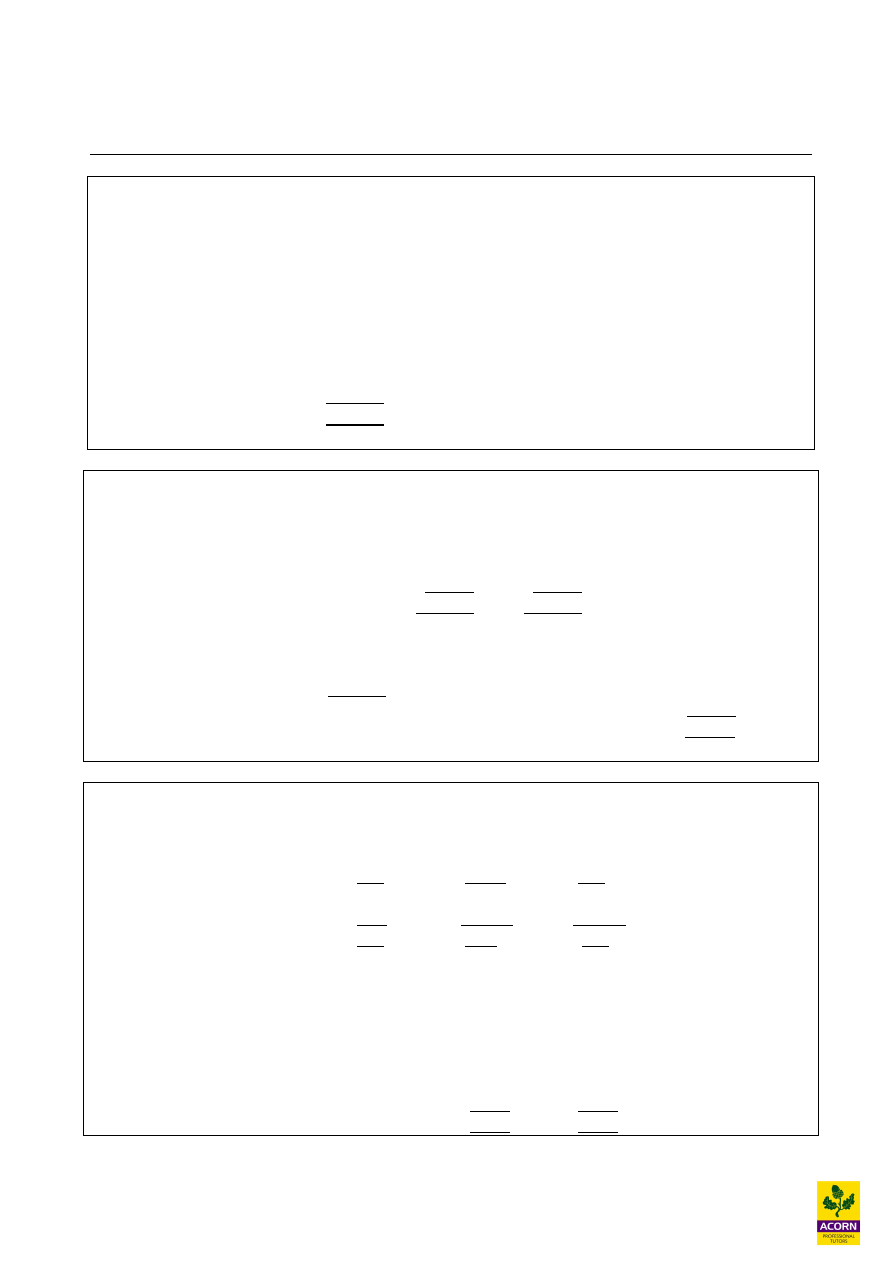
24.1 The link between cash, profit and balance sheet (statement of financial position)
Cash is the life blood of a business, allowing it to trade and purchase resources e.g. pay for
inventory, staff, overhead, capital expenditure and taxation. Cash receipts will be generated by the
organisation selling a product or service, therefore earning profit and generating positive cash-flow.
Good financial management of cash flow is the key to maintaining good liquidity for an
organisation.
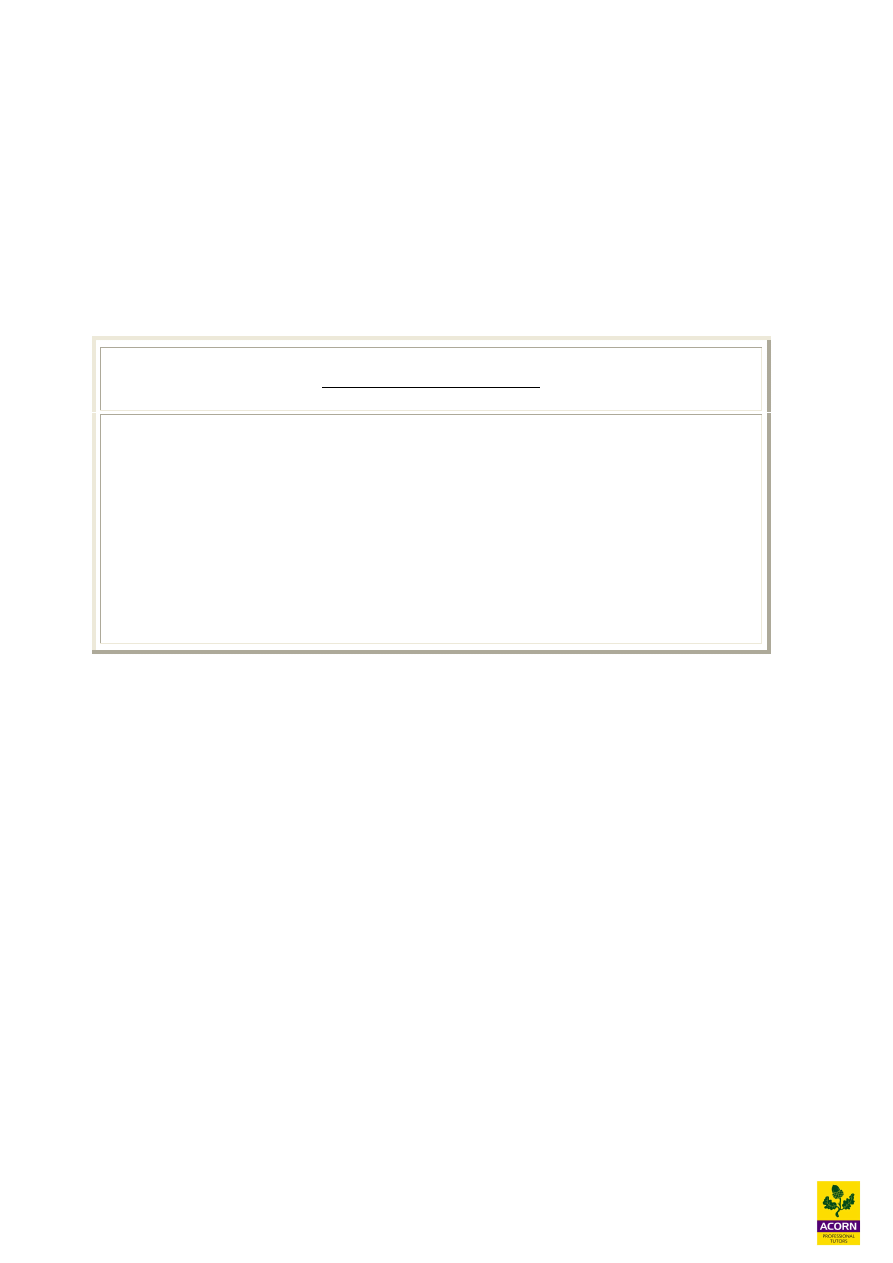
Cash flows of a company will not be the same as the profit figure, as the profit figure is arrived at
using the accruals basis, and not all cash items are reported in the income statement.
Income
statement
Balance
sheet (statement of
financial position)
Impact on
cash flow
Issue of shares or debt
No
Yes
Increase in cash
Increase in
bank overdrafts
No
Yes
Increase in cash
Purchase of
non current assets
No
Yes
Decrease in cash
Depreciation
Yes
Yes
No impact on cash
Disposal of
non current assets
Yes
Yes
Only the proceeds from
disposal will increase cash
Cash received is
not equal to sales
No
Yes impact
on trade receivables
Cash received from trade
receivables will increase cash
Cash paid is
not equal cost of sales
No
Yes impact
on trade payables
Cash paid to trade payables will
decrease cash
To calculate the operational cash flow from the profit, adopt IAS 7 Cash flow statements, as this
will make it easier.
3
Example 24.1
Operational cash flows
Nags Head Ltd had the following profit for year ending 20X2: -
£
Sales
800,000
Cost of sales
540,000
Operating profit
260,000
Opening balances
Closing balances
Inventories
24,000
42,000
Trade receivables
30,000
48,000
Trade payables
22,000
28,000
What is the operational cash flow resulting from the year’s trading?
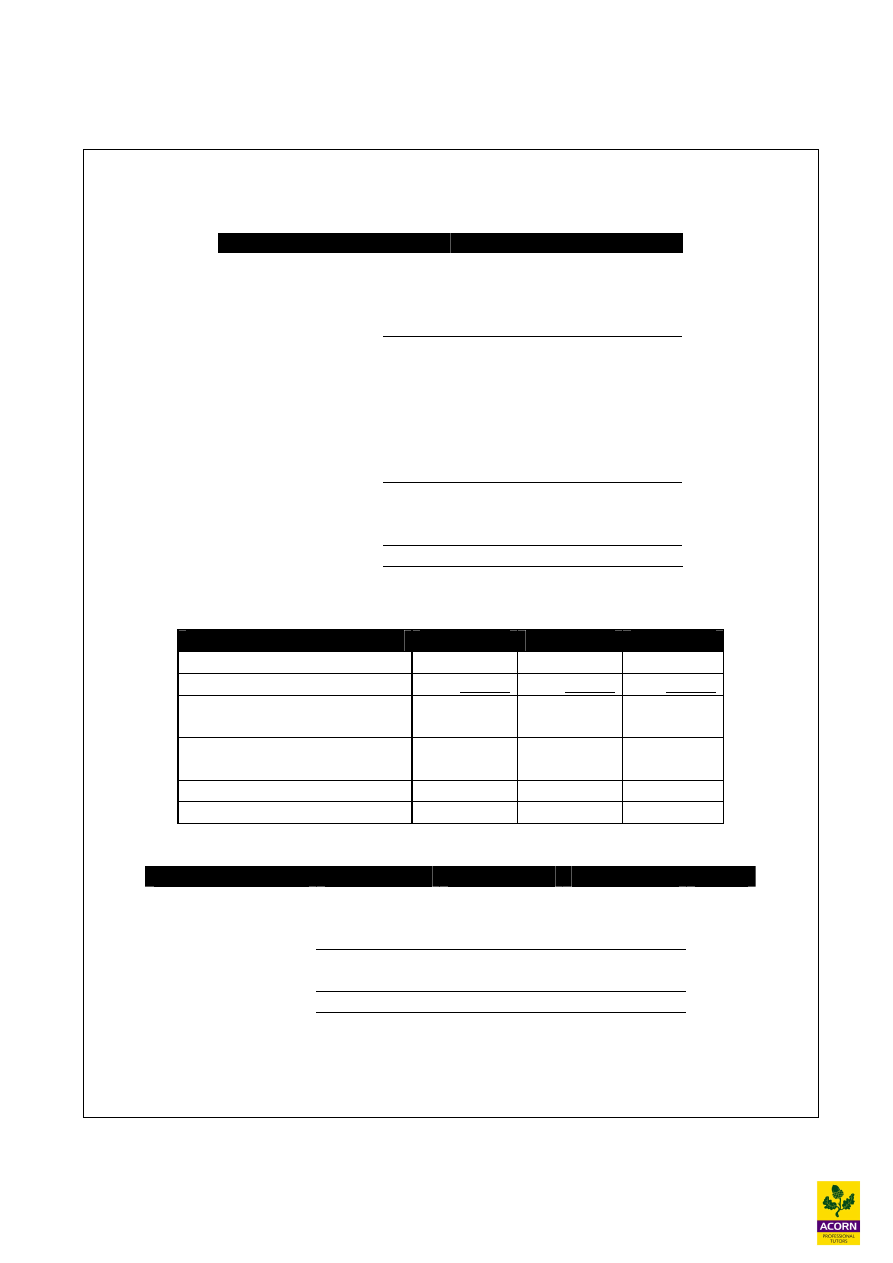
24.2 Cash flow forecasts
Cash budgets or forecasts allow a business to plan for liquidity in the future. A cash budget will
show the level of liquidity required over future financial periods and allow the business to improve
liquidity by more effective cash planning for cash surpluses or deficits.
A cash-flow forecast is an estimate of when and how much money will be received and paid out of
a business. Cash flow reporting is normally on a month-by-month basis, typically for one financial
year.
Examples of how to improve cash-flow
· Decrease payment terms given to customers e.g. reduce trade receivables (debtors) by
getting paid earlier e.g. by offering discounts to customers for early settlement.
· Increase payment terms to suppliers e.g. increase trade payables (creditors) e.g. paying
suppliers later than normal or not paying them at all will delay cash outflows, but supplier
goodwill maybe lost.
· Purchase fewer inventories during periods of insufficient cash-flow.
· Delay cash investment in non-current assets during periods of insufficient cash-flow e.g.
capital expenditure on fixed assets such as plant, equipment or vehicles.
· Arrange finance for cash deficits e.g. a bank overdraft or business loan during periods of
insufficient cash-flow.
· Invest cash surpluses into short-term higher interest investments e.g. high interest bank
accounts or other money market investments.

4
Note: Cash budgets never include non-cash items such as bad debts, discounts given, or the
depreciation of non-current assets.
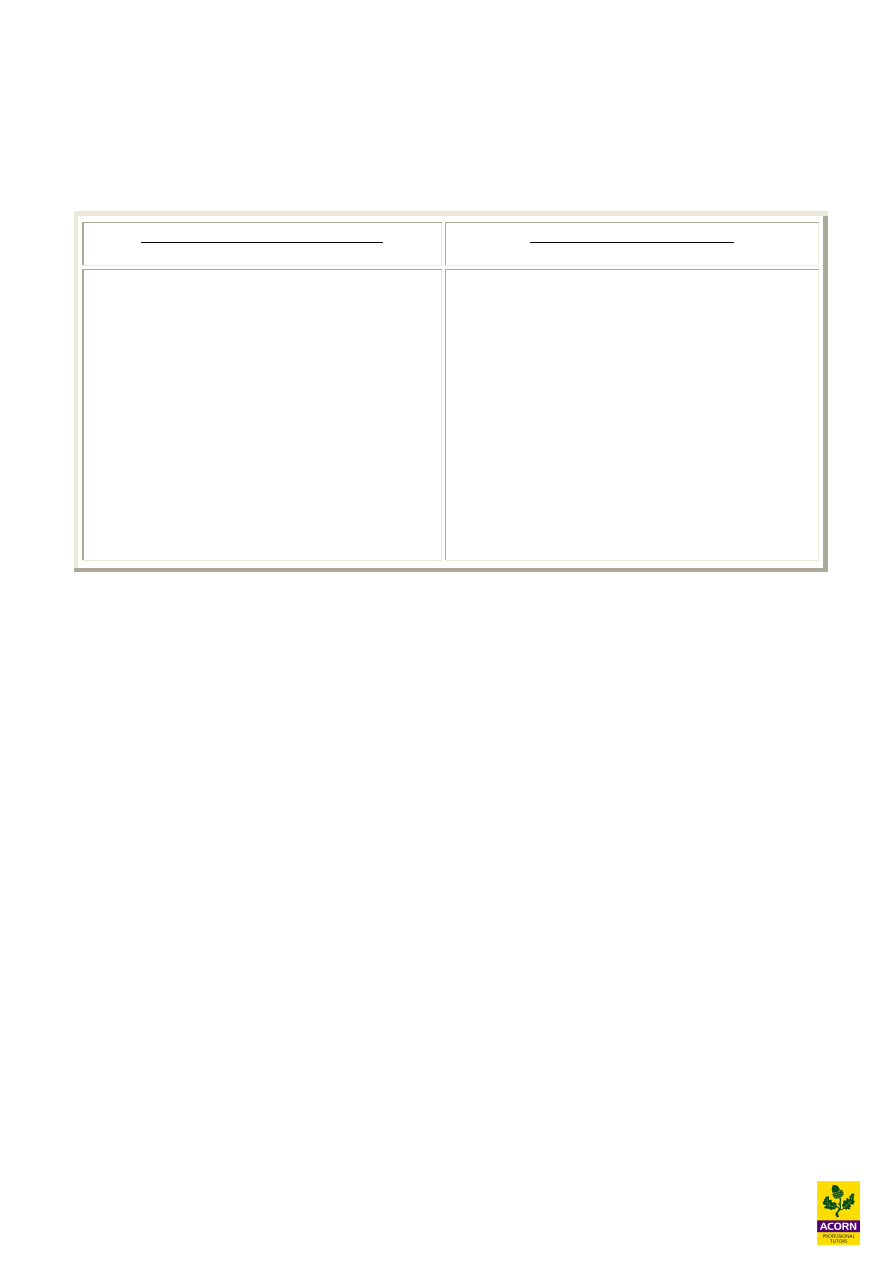
Proforma cash budget
JAN FEB…………….. column for each month
Cash inflow (receipts)
Cash sales
X
X
Debtors (trade receivables)
X
X
Sale of non-current assets
X
Loan or share issues
X
X
Total Receipts
X
X
JAN FEB…………….. column for each month
Cash outflow (payments)
Creditors (trade payables)
X
X
Expenses
X
X
Salaries
X
X
Purchase of non-current assets
X
Loan repayments X
X
Taxation paid
X
Dividends paid
X
X
Total Payments
X
X
Opening balance brought forward
X
X
Monthly net cash inflow/(outflow) X (X) (receipts less payments for the month)
Closing balance carried forward*
X (X)
* The closing bank balance at the end of a period becomes the opening balance for the start
of the next period.
5
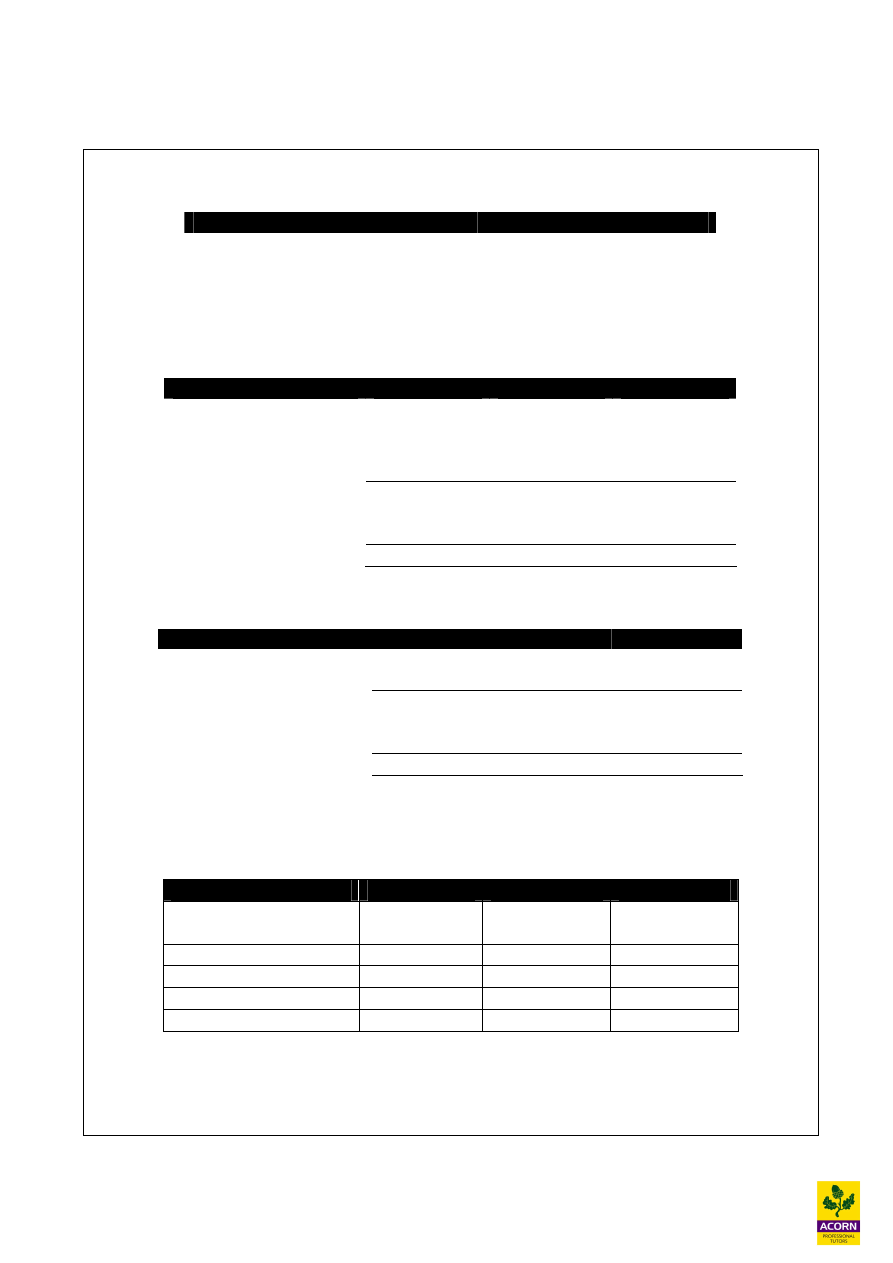
Example 24.2 – Worked example
The following details have been extracted from the debtor collection records of S Plc
Invoice paid in the month after sale
60%
Invoice paid in the second month after sale
20%
Invoice paid in the third month after sale
10%
Bad debts
10%
Customers paying in the month after sale are entitled to receive a 15% discount.
Credit sales for January to April are budgeted as follows:
Jan
Feb
Mar
Apr
£40,000
£45,000
£50,000
£60,000
Calculate the amount forecast to be received from debtors in April.
March sales £50,000 x 0.6 x 0.85 =
£25,500
February sales £45,000 x 0.2 =
£9,000
January sales £40,000 x 0.1 =
£4,000
April cash received £38,500
Example 24.3
Trade receivables receipts
Sales (£)
April 2005
100.000
May 2005
120,000
June 2005
250,000
July 2005
300,000
Sales are received on an average basis of 40% deposit in the month of order, of the remaining debt
outstanding, 70% pay in the following month of sale and are therefore entitled to a 5% discount.
The remaining receivables left pay in the second month after sale, with 20% of these receivables
not paying at all.
Work out the receipts into the bank for the month of June and July 2005?

6
Example 24.4
Trade payables payments
Opening stock 1 July 2005 was £80,000 and this is to increase in value by 20% each month. Cost
of sales for next 3 months is as follows;
July
£480,000
August
£540,000
September
£600,000
Suppliers are paid 20% during the month of purchase as deposit, and the remainder payable one
month later. Calculate the cash amount paid to suppliers in August and September 2005?
7
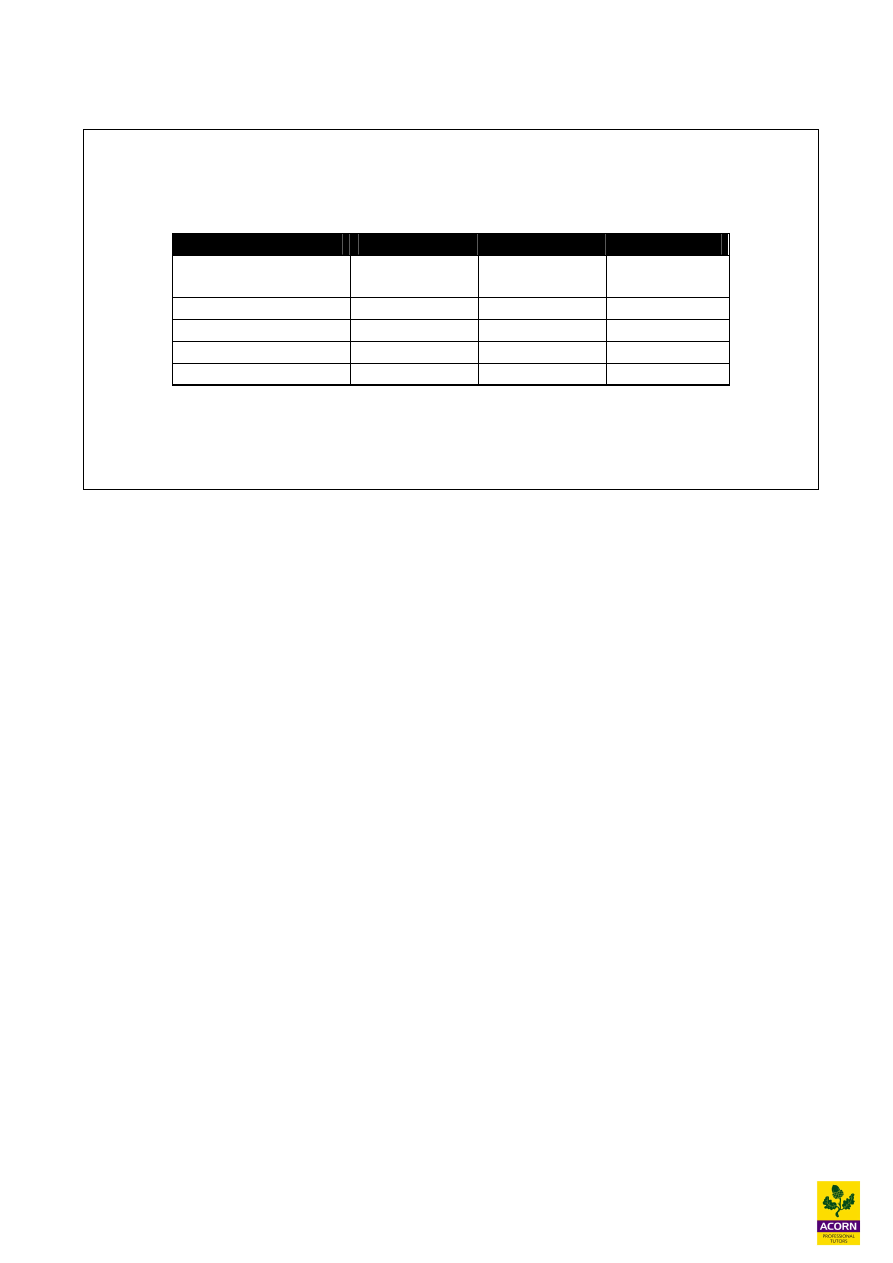
Example 24.5 – (Past CIMA question)
RF Ltd is a new company which plans to manufacture a specialist electrical component. The
company founders will invest £16,250 on the first day of operations, that is, Month 1. They will
also transfer fixed capital assets to the company.
The following information is available:
Sales
The forecast sales for the first four months are as follows:
Month
Number of
components
1
1,500
2
1,750
3
2,000
4
2,100
The selling price has been set at £10 per component in the first four months.
Sales receipts
Time of payment
% of customers
Month of sale
20*
One month later
45
Two months later
25
Three months later
5
The balance represents anticipated bad debts.
*A 2% discount is given to customers for payment received in the month of sale.
Production
There will be no opening inventory of finished goods in Month 1 but after that it will be policy for
the closing inventory to be equal to 20% of the following month’s forecast sales.
Variable production cost
The variable production cost is expected to be £6·40 per component.
Time of payment
£
Direct materials
1·90
Direct wages
3·30
Variable production overheads
1·20
Total variable cost
6·40

8
Notes:
Direct materials: 100% of the materials required for production will be purchased in the month of
production. No inventory of materials will be held. Direct materials will be paid for in the month
following purchase.
Direct wages will be paid in the month in which production occurs.
Variable production overheads: 60% will be paid in the month in which production occurs and
the remainder will be paid one month later.
Fixed overhead costs
Fixed overhead costs are estimated at £75,000 per annum and are expected to be incurred in
equal amounts each month. 60% of the fixed overhead costs will be paid in the month in which
they are incurred and 30% in the following month. The balance represents depreciation of fixed
assets.
Calculations are to be made to the nearest £1.
Ignore VAT and Tax.
Required:
(a) Prepare a cash budget for each of the first three months and in total.
(b) There is some uncertainty about the direct material cost. It is thought that the direct
material cost per component could range between £1·50 and £2·20.
Calculate the budgeted total net cash flow for the three month period if the cost of the direct
material is:
(i) £1.50 per component; or
(ii) £2.20 per component.
9
24.3 Sensitivity analysis
Sensitivity analysis is a modelling and risk assessment procedure in which changes are made to
significant variables in order to determine the effect of these changes on the planned outcome.
Spreadsheets are a great tool for sensitivity analysis as they allow us to view the financial impact of
changes in variables.
Sensitivity analysis can be used in cash flow forecasting to see what the risk is to the company if
certain variables changed and the impact it will have on their cash balances.
Sensitivity analysis can also be done through expected cash flows. This is where probabilities are
assigned to cash flows showing their likely hood of occurring. The result is not the actual cash
flows that will occur but the expected:
For example a receipt of £50,000 is expected next month, but there is 20% chance that the
customer may not pay on time, then the expected cash flow will be £50,000 x 80% = £40,000
Significant variables include
Changes in capacity (i.e. more or less production of goods).
Material or labour costs – increases in prices.
Labour availability – staff shortage, meaning higher costs.
Sales volume.
Interest rates and inflation rate changes.
10
24.4 Cash flow problems
When a company highlights its cash flow problems (through using cash flow forecasts), it needs to
put a plan in place to overcome the problem.
Reasons for cash flow problems
Easing cash flow problems
Business is not doing due to a downturn in the
economy and as a result operating losses are
being made.
A program of asset replacements to take place
over the next year.
One- off large expenditures.
Seasonal business fluctuations.
Postponing or delaying capital expenditure.
Getting cash in quicker from trade receivables.
Disposal of assets that are not being used.
Requesting longer credit period from suppliers.
Not paying dividends
Raising more cash from new shares issue or
loans.
An organisation that has surplus cash could implement the following financial strategies to reduce
the level of surplus cash:
§ Seek further investments opportunities by doing detailed analyses and ensuring they
choose ones which yield them the highest rate of return. They could diversify into other
areas of business.
§ Increase their current sales by advertising heavily.
§ Repaying their debt and therefore reducing their gearing. Although debt finance does
have tax advantages and also reduces the cost of capital.
§ Increasing their level of dividends to their current shareholders as part of a long term
strategy.
§ Make generous donations to charities or do something to help the local community. This
in the long term will improve the organisation’s image as a caring organisation. There has
been a huge increase in ethical investors in the past 2 decades.
11
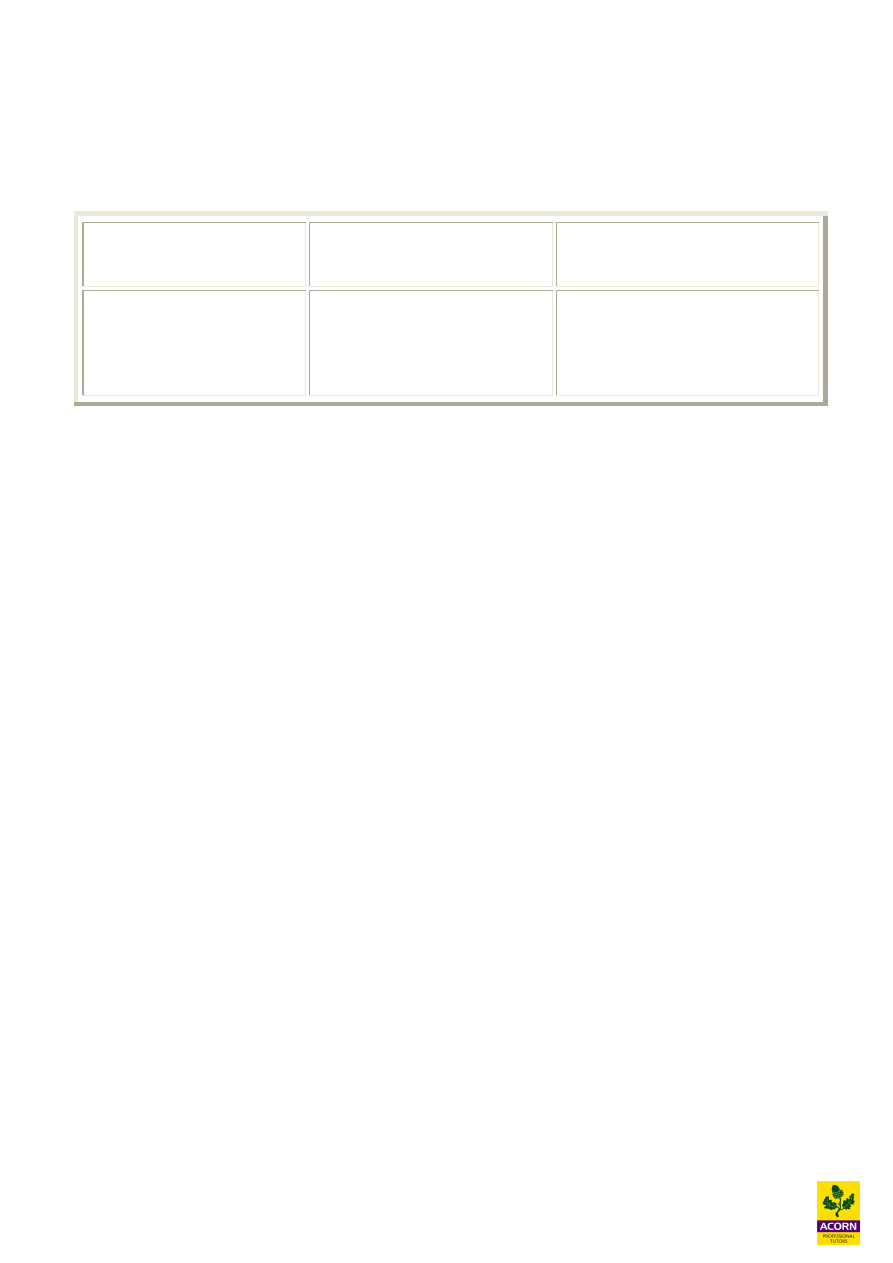
24.5 Cash management motives
There are various reasons why cash and other liquid assets are held, mainly for transactional,
precautionary and speculative motives.
Transaction motive
Precautionary motive
Speculative motive
Cash needed for normal
business, paying suppliers,
wages etc
Cash held for unexpected
purposes like increase in a
liability (taxation).
Cash held for opportunities,
which may arise, like a
takeover of another company.
Holding cash carries a cost, the opportunity cost of lost interest or other return of investing cash
elsewhere. Therefore maintaining the right level of cash is important, and the balance between
liquidity (holding too much cash) and illiquidity (holding too little cash) needs to be established.
12
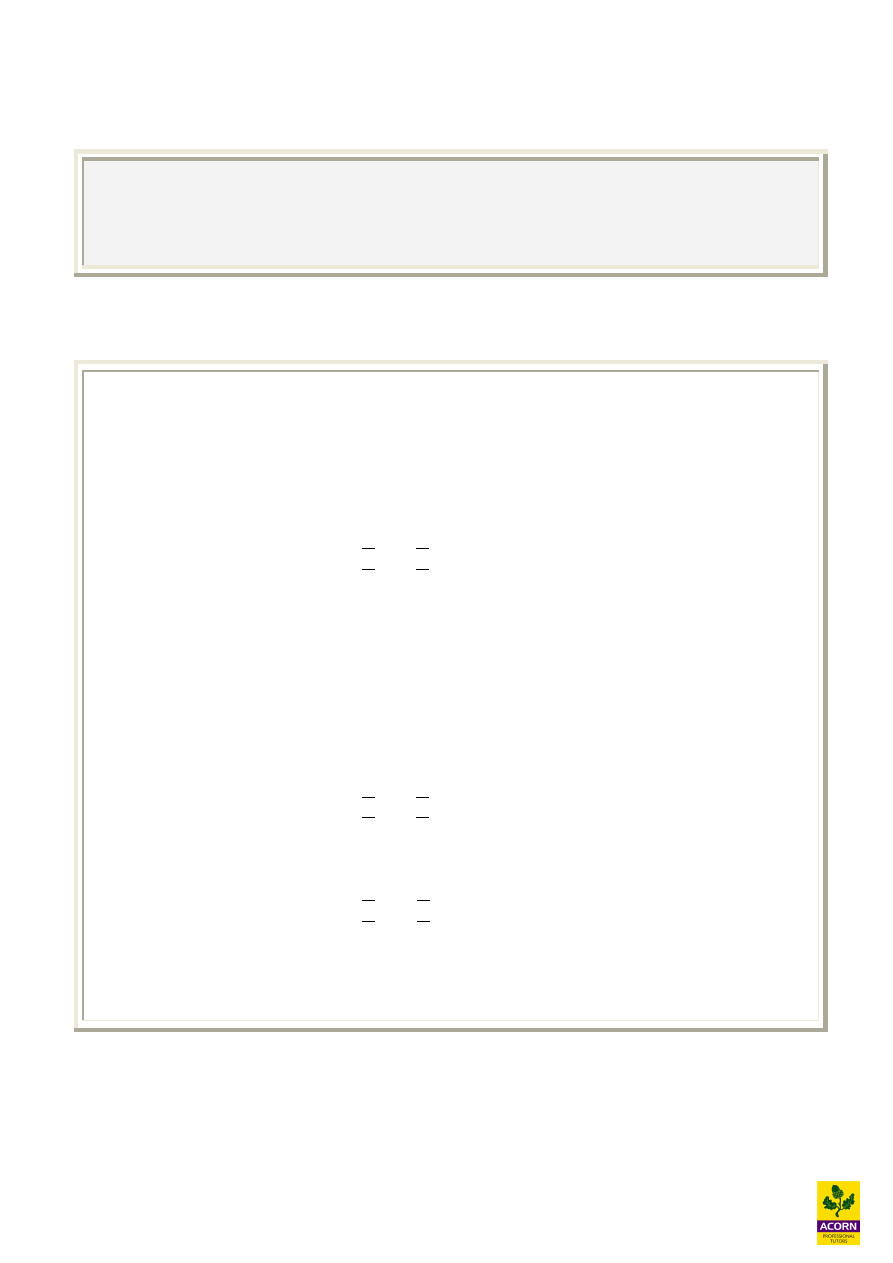
Key summary of chapter
A cash-flow forecast is an estimate of when and how much money will be received and paid out of
a business. Cash flow reporting is normally on a month-by-month basis, typically for one financial
year.
Note: Cash budgets never include non-cash items such as bad debts, discounts given, or the
depreciation of non-current assets.
Proforma cash budget
JAN FEB…………….. column for each month
Cash inflow (receipts)
Cash sales
X
X
Debtors (trade receivables)
X
X
Sale of non-current assets
X
Loan or share issues
X
X
Total Receipts
X
X
JAN FEB…………….. column for each month
Cash outflow (payments)
Creditors (trade payables)
X
X
Expenses
X
X
Salaries
X
X
Purchase of non-current assets
X
Loan repayments X
X
Taxation paid
X
Dividends paid
X
X
Total Payments
X
X
Opening balance brought forward
X
X
Monthly net cash inflow/(outflow) X (X) (receipts less payments for the month)
Closing balance carried forward*
X (X)
* The closing bank balance at the end of a period becomes the opening balance for the start of the
next period.

13
Cash management motives
There are various reasons why cash and other liquid assets are held, mainly for transactional,
precautionary and speculative motives.
Transaction motive
Precautionary motive
Speculative motive
Cash needed for normal
business, paying suppliers,
wages etc
Cash held for unexpected
purposes like increase in a
liability (taxation).
Cash held for opportunities,
which may arise, like a
takeover of another company.
14
Solutions to Lecture Examples
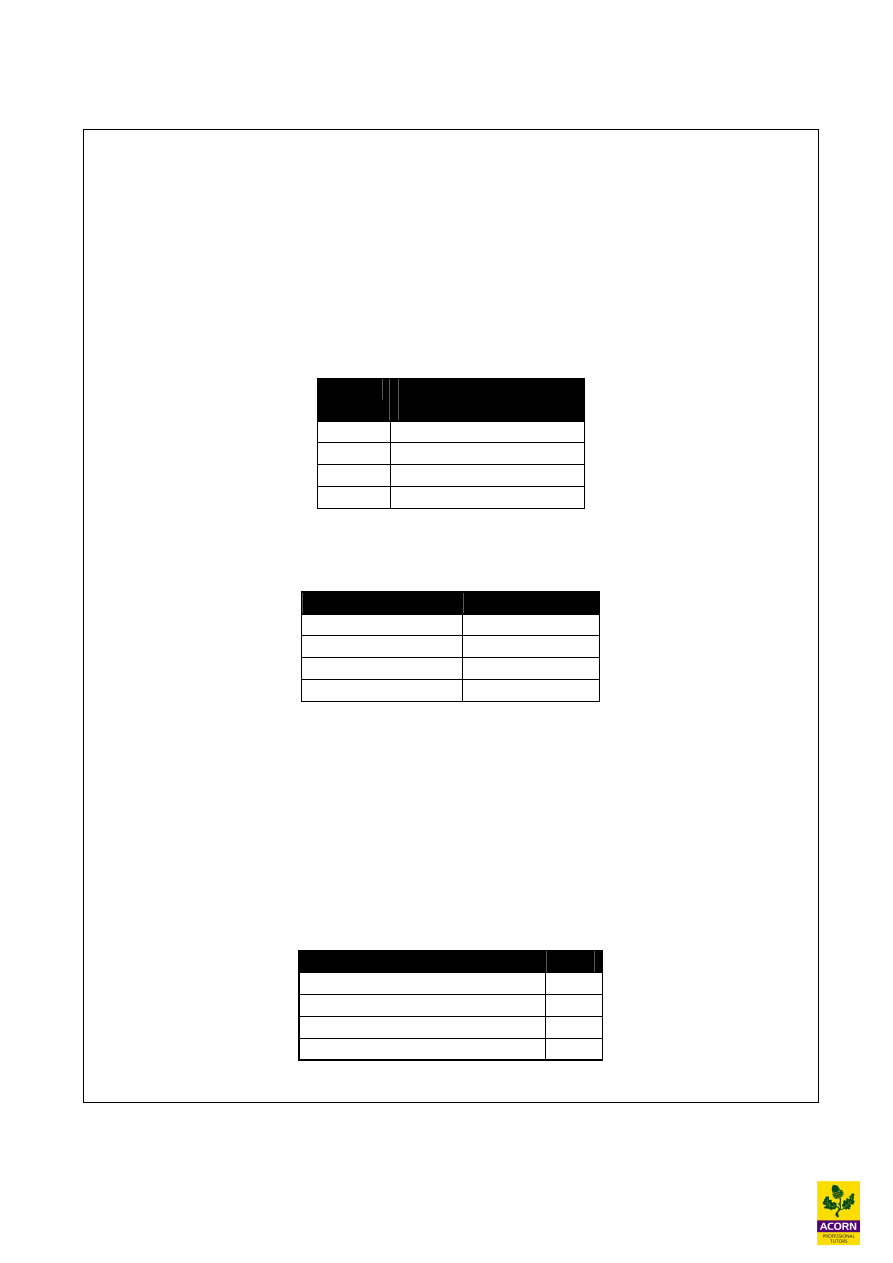
Example 24.1
Operational cash flows
Reconciliation of operating profit to operating cash flow
£
Operating profit
260,000
Inc/Dec in inventories (24-42) (18,000) - More money spent on inventories = cash outflow
Inc/Dec in receivables (30-48) (18,000) - More money tied up in receivables = cash outflow
Inc/Dec in payables (22-28) 6,000 - Less payments made to creditors = cash inflow
Operating cash flow
230,000
Example 24.3
June
July
Cash
100,000
120,000
Debtors one month after sale
47,880
99,750
Debtors two months after sale
14,400 17,280
Total receipts
162,280
237,030
Example of calculation of June cash receipts
Cash 0.4 x June sales 250,000 = 100,000
Debtors 1 month after sale paying in June 0.6 x May sales 120,000 x 0.7 x 0.95 = 47,880
Debtors 2 months after sale paying in June 0.6 x April sales 100,000 x 0.3 x 0.8 = 14,400
Example 24.4
July
Aug
Sept
Opening stock
80
96
115.2
Purchases (balance figure)
496
559.2
623
576
655.2
738.2
Closing stock
(96)
(115.2) (138.2)
Cost of sales
480
540 600
August payments will be 20% August purchases and 80% of July purchases
September payments will be 20% September purchases and 80% of August purchases
Aug Sept
Cash payments
111.8
124.6
Creditor payments after 1 month
396.8
447.4
508.6
572.0
15
Example 24.5
(a)
Mth1
Mth 2
Mth 3
Total
£
£
£
£
RECEIPTS
Sales (W1)
2,940
10,180
15,545
28,665
Capital
16,250
16,250
Total receipts
19,190
10,180
15,545
44,915
PAYMENTS
Material (W2)
0
3,515
3,420
6,935
Labour (W3)
6,105
5,940
6,666
18,711
Variable O/H (W4)
1,332
2,184
2,318
5,834
Fixed O/H (W5)
3,750
5,625
5,625
15,000
Total payments
11,187
17,264
18,029
46,480
Net cashflow
8,003
(7,084)
(2,484)
(1,565)
Bal b/f
0
8,003
919
0
Bal c/f
8,003
919 (1,565) (1,565)
Workings
(W1) Sales
Mth 1
Mth 2
Mth 3
£
£
£
Sales (units x selling price)
15,000
17,500
20,000
Receipts in 1
st
month (20%)
and 2% discount given
3,000 – 60
= 2,940
3,500 – 70
= 3,430
4,000 – 80
= 3,920
Receipts in 2
nd
month (45%)
6,750
7,875
Receipts in 3rd month (25%)
3,750
Total
2,940
10,180
15,545
(W2) Material
Mth 1
Mth 2
Mth 3 Mth 4
Units
Units
Units
Units
Forecast sales
1,500
1,750
2,000
2,100
Opening inventory
0
(350)
(400)
1,500
1,400
1,600
Closing inventory
350
400
420
Production
1,850
1,800
2,020
Material cost
(£1.90 x units)
£1.90 x 1,850
= £3,515
£1.90 x 1,800
= £3,420
£1.90 x 2,020
= £3,838
Material payments
£3,515
£3,420
16
(W3) Labour
Mth 1
Mth 2
Mth 3
Production units
1,850
1,800
2,020
Labour cost
(£3.30 x units)
£3.30 x 1,850
= £6,105
£3.30 x 1,800
= £5,940
£3.30 x 2,020
= £6,666
(W4) Variable O/H
Mth 1
Mth 2
Mth 3
Production units
1,850
1,800
2,020
Variable O/H cost
(£1.20 x units)
£1.20 x 1,850
= £2,220
£1.20 x 1,800
= £2,160
£1.20 x 2,020
= £2,424
Payments
£
£
£
60% in 1
st
month
1,332
1,296
1,454
40% in 2
nd
month
888
864
Variable O/H payments
1,332
2,184
2,318
(W5) Fixed O/H
Mth 1
Mth 2
Mth 3
£
£
£
Fixed costs (£75,000 / 12)
6,250
6,250
6,250
Payments
60% in 1
st
month
3,750
3,750
3,750
30% in 2
nd
month
1,875
1,875
Fixed O/H payments
3,750
5,625
5,625
(b) (i)
If the cost was £1.50 there would be saving of £0.40 per unit.
Mth 1
Mth 2
Mth 3
Production cost savings
1,850 x £0.40
= £740
1,800 x £0.40
= £720
2,020 x £0.40
= £808
Savings received
£740
£720
Total saving
£1,460
New total budget cash flow = Savings received + Current total budget cash flow
£1,460 + -£1,565 = (£105)
17
(b) (ii)
If the cost was £2.20 there would be an extra cost of £0.30 per unit.
Mth 1
Mth 2
Mth 3
Production extra cost
1,850 x £0.30
= £555
1,800 x £0.30
= £540
2,020 x £0.30
= £606
Extra costs to pay
£555
£540
Total extra cost
£1,095
New total budget cash flow = Extra costs to pay + Current total budget cash flow
-£1,095 + -£1,565 = (£2,660)
Wyszukiwarka
Podobne podstrony:
F1 Cash flow statements for single company
3 OPENING AND MANAGING CASUALTY'S AIRWAY POLok
F1 Short term borrowing and investing
F1 Share capital transactions and financial instruments
Detecting Metamorphic viruses by using Arbitrary Length of Control Flow Graphs and Nodes Alignment
Understanding and Managing Polymorphic Viruses
Client Fee and Cash Flow Projection
A Comparison Of Dividend Cash Flow And Earnings Approaches To Equity Valuation
Analiza finansowa AZF, ANSF03, ˙wiatowe standardy dopuszczaj˙ stosowanie metody bezpo˙redniej i po˙r
Zadanie 2 cash flow (wykład)
przyklady cash flow
Cash flow
Analiza wskaznikowa cash flow
Cash flow
cash flow
cash flow
#0668 – Having Cash Flow Problems
ANALIZA CASH FLOW
Cash flow
więcej podobnych podstron