
Stock Liquidity and the Value of a Designated Liquidity Provider: Evidence
from Euronext Paris
∞
Steve Mann *
Kumar Venkataraman **
Andy Waisburd *
Current Draft: October 2002
* Neeley School of Business, Texas Christian University, Box 298530, Fort Worth, Texas 76129
** Cox School of Business, Southern Methodist University, PO Box 750333, Dallas, Texas 75275
Contact information: e-mail address of Steve Mann is
smann@tcu.edu
, Kumar Venkataraman is
kumar@mailcox.smu.edu
, and Andy Waisburd is
a.waisburd@tcu.edu
∞ We thank Venkatesh Panchapagesan, Christopher Barry, and Rex Thompson for valuable comments
and discussion. We are grateful to Loic Choquet, Socheat Chhay and Lourent Fournier of Euronext Paris
for information on market structure in Paris, and to Pascal Samaran for providing us with the data. Mann
and Waisburd thank the Charles Tandy American Enterprise Center, and the Luther King Center for
Research in Financial Economics.

Stock Liquidity and the Value of a Designated Liquidity Provider: Evidence
from Euronext Paris
Abstract
This paper studies the value of a designated liquidity provider (DLP) in an electronic limit order
book. We conduct a natural controlled experiment by examining a sample of Euronext Paris
securities that trades both with and without the assistance of a market maker. We find that less
liquid stocks experience a statistically significant cumulative abnormal return of four percent
around the introduction of the DLP. For this sample, the DLP enhances market quality by
reducing the frequency of market failure, providing strong empirical support for Glosten (1989).
Liquid stocks are generally unaffected. Overall, these findings support the joint hypothesis that
liquidity is priced and that the services of the designated liquidity provider are an important
factor in this premium. We thus present compelling evidence of a link between market
microstructure and asset pricing.
Key Words: Liquidity provider; Market maker; Trading cost; Electronic limit order book

1
1. Introduction
The worldwide proliferation of automated trading systems has spurred a debate over the
role of financial intermediaries in the trading process. Although recent advances in technology
have significantly reduced the intermediation needs for mundane tasks such as order submission
or information dissemination, the role of a designated liquidity provider (DLP), such as the
NYSE specialist, as the central pillar of an order-driven market remains contentious. The
liquidity provider is most easily understood as a provider of immediacy. However, it is argued
that public limit orders can be stored in an electronic limit order book and can supply
immediacy. Glosten (1989) emphasizes an alternate rationale that the DLP may prevent market
failures by supplying liquidity during periods when the limit order book is thin.
1
This paper
measures the value of introducing a designated liquidity provider for a sample of stocks in the
Paris Bourse, an automated order driven market, and adds to our understanding on this debate.
Several empirical papers have documented the beneficial role of a DLP.
2
For example,
studies of the NYSE show that the specialist helps maintain narrow spreads and plays a
beneficial role in price formation by anticipating future order imbalances and reducing transitory
volatility. However, extant literature has mainly focused on traditional floor-based order driven
markets, such as the NYSE. This paper provides insight regarding the previously unstudied
value of a DLP in an automated order driven market.
The trading protocols in floor-based and automated markets differ considerably. More
specifically, the specialist at the NYSE has a privileged position vis-à-vis the market, due to
1
Theoretical expositions on the relative merits of order driven markets are also provided in Benveniste et al. (1992),
Glosten (1994), and Seppi (1997), besides others.
2
See, for example, Hasbrouck and Sofianos (1993), Madhavan and Smidt (1993), Madhavan and Sofianos (1998),
Kavajecz (1999), and Madhavan and Panchapegesan (2000) for evidence at the NYSE, Kehr et al. (2001) at the
Frankfurt Stock Exchange, and Mayhew (2002) and Anand and Weaver (2002) at the CBOE.

2
monopolistic access to order flow information. Given informational advantages, the specialist
may discern better than most traders time-variations in the composition of order flow and use
this information to enhance price discovery. NYSE regulations, in turn, require the specialist to
maintain a fair and orderly market and stabilize prices more often that he would on his own. In
contrast, the privileges and obligations of the DLP are more modest in automated trading
systems. The DLP has no informational advantage over other traders and passively provides
liquidity by posting limit orders in the book.
3
In turn, he has no obligation to stabilize the market,
though he is required to maintain market presence by quoting prices. Given these differences and
the global trend towards automated order driven markets, an important question is whether a
DLP adds value in such a market structure?
To address this question, we study a sample of 19 firms of medium-to-high liquidity
(“Liquid”) and 37 firms of low liquidity (“Illiquid”) for which a DLP was introduced by the Paris
Bourse between 1995 and 1998. First, we conduct an event study to analyze cumulative
abnormal returns around the introduction of the DLP. The liquidity premium hypothesis (see
Amihud and Mendelson (1986)) predicts that improvements in market liquidity lower the risk-
adjusted return required by investors.
4
Therefore, if the DLP enhances market quality, then we
expect an increase in stock price around the event. Further, theoretical models (e.g., Grossman
and Miller (1988), Glosten (1989)) predict that the DLP’s role assumes greater prominence for
less liquid stocks. As less liquid stocks suffer from higher information asymmetry (see Easley et
3
Madhavan and Sofianos (1997) say “Besides occasionally acting as a dealer, the (NYSE) specialists also supervise
the trading process, match buyers and sellers, act as agents for other brokers, and exercise crowd control to ensure
price and time priority and efficient order representation.” In automated trading systems, all the above functions are
either unnecessary or have been assigned to the central computer.
4
Brennan and Subrahmanyam (1996), Eleswarapu (1997), and Brennan et al. (1998), among others, present
evidence of cross-sectional relationship between expected returns and firm liquidity. Amihud et al. (1997),
Muscarella and Piwowar (2001), and Kalay et al. (2002)) examine stocks that transferred from call to continuous
markets and also find empirical support for the liquidity hypothesis.

3
al (1996)), the ability of the DLP to average profits across trades, consistently provide liquidity,
and prevent market failure becomes more valuable. In support of these predictions, we find that
the introduction of the DLP has created positive value, on average, for our sample of Illiquid
firms but not for our sample of Liquid firms. We estimate cumulative abnormal returns (CAR)
over an event window that begins five days before the DLP announcement date and ends 10 days
after the stocks started trading with a DLP. For the Illiquid sample, we find a statistically
significant CAR of 4.4% during the event window; however, for the liquid sample, the CAR is
not different from zero.
Next, in order to identify those attributes that are enhanced by DLP participation, our
investigation examines changes in various measures of market quality. The DLP does not
enhance traditional market quality measures such as trading volume, market depth or executions
cost. However, DLP introduction is associated with significant reductions in the likelihood of
market failure for the Illiquid sample, providing strong empirical support for Glosten (1989).
Finally, in support of the liquidity premium hypothesis, our cross-sectional analysis finds that
firms that experienced a larger improvement in market quality after DLP introduction also
experienced larger CARs.
This study is also particularly well suited to test theoretical predictions on the differential
value of a DLP in electronic call and continuous markets. The Liquid sample in our study trade
in a continuous, electronic limit order market (ELOB), while the Illiquid sample trade in a twice-
daily electronic call market. Glosten (1994) predicts that a continuous ELOB inherently has the
ability to handle extreme adverse selection and prevent market failures – the benefit of a DLP,
therefore, is likely to be modest. Furthermore, Economides and Schwartz (1995) propose that an

4
electronic call market is the only suitable type of market in which substantial capital can be
committed to enhancing liquidity. Our results find strong support for both these predictions.
In summary, this paper’s contribution is threefold. First, we perform a controlled
experiment to present the first empirical evidence regarding valuation and liquidity benefits of
introducing a DLP in an automated trading system. Second, we test several theoretical
predictions regarding the value of a DLP using data from the Paris Bourse, which closely
resembles the markets envisioned by theorists. Third, and most notably, we present evidence of
another unique and important link between market microstructure and asset pricing.
The remainder of the paper proceeds as follows. The next section reviews the relevant
institutional features of the Paris Bourse and describes the data. Event study results reported in
section 3 document the marginal value of designated liquidity provision. In section 4, we
examine the liquidity provider’s impact on market quality. Section 5 analyzes the cross-sectional
correlation between changes in stock price and liquidity. We conclude with a discussion of the
implications and limitations of the analysis.
2. Institutional background and sample selection
A. Market structure
The Paris Bourse is an automated order driven market.
5
Limit orders supply liquidity to
immediacy demanding market orders, both of which are submitted, processed, and displayed
through a transparent ELOB. Generally, trade takes place continuously for the more liquid
5
See Biais et al. (1995,1999), Harris (1996), Demarchi and Foucault (1999), Venkataraman (2001), Muscarella and
Piwowar (2001), and Pagano and Schwartz (2002) for detailed descriptions of the Paris Bourse market structure. On
September 22, 2000, the Paris Bourse, the Amsterdam Stock Exchange, and the Brussels Stock Exchange merged to
form Euronext. In this section, we document the institutional details in place during our sample period (Source: The
Paris Bourse Users Guide).

5
securities and via twice-daily call auctions for less actively traded stocks.
6
During the
continuous trading session, orders are executed according to strict price, exposure and time
priority. Executions in the call auction are based on the single price that maximizes the trading
volume.
In 1992, the Paris Bourse implemented a program to allow designated liquidity providers,
known as animateurs, to facilitate trade in certain less liquid firms. In 1994, the program was
extended such that more actively traded securities were also eligible. According to exchange
officials, the introduction decision is made solely by the Paris Bourse and is not influenced by
the firm’s management or by the firm’s future prospects, which mitigates the self-selection bias
that is inherent in this type of analysis.
In Paris, the DLP’s primary function is to maintain a regular market presence: to quote a
maximum bid-ask spread and a minimum depth, and to execute, up to a certain extent, orders
partially or totally unmatched at the opening price. A Paris Bourse surveillance team monitors
the market maker’s performance and may terminate the DLP’s contract should he fail to meet his
obligations. In return for his liquidity services, the market maker receives free access to the
trading facilities; he is recognized as an exclusive dealer for the security and as the focal point
for block trades. The DLP also benefits indirectly from his market-making role, as he is often the
executor of the listed firm’s investment banking business. In contrast to the NYSE specialist, the
Paris DLP does not possess an informational advantage over public orders nor does he have the
opportunity to condition his price schedule on the arriving order flow. In turn, he is charged with
6
All continuously traded stocks, which fall into trading categories Continu A and Continu B, open with a call
auction at 10 a.m., and medium-activity continuously traded stocks, Continu B, close with a call auction at 5 p.m.
Less active stocks are classified as Fixing A and trade in a twice per day call auction at 11:30 a.m. and 4 p.m.

6
fewer responsibilities. In particular, he is not obliged to maintain price continuity or to trade in a
stabilizing manner.
7
B. Data and sample selection
The trade, order and quote data used in this study are obtained from the Paris Bourse
BDM database (1995-1998). The exchange provided a list of firms for which a DLP was
introduced, the member firm acting as the DLP, and the date of introduction. Between January 1,
1995 and December 31, 1998, DLPs were introduced for 155 securities. We verify the
introduction dates on Avis, an official publication of the exchange, and we designate the
announcement date of the LP introduction as the date of the Avis notification. The DLP may be
introduced shortly after a security is listed. To avoid misclassifying any unusual activity around
the security’s listing as being caused by the introduction of a liquidity provider, we exclude the
ten trade days immediately subsequent to stock listing. To remain in our sample, securities must
meet the following criteria: (1) the security must be an exchange traded French common stock in
the BDM database (eliminates 16 securities); (2) the DLP announcement must be available in
Avis (eliminates 1 stock); (3) intraday data must be available prior to the introduction of the DLP
(eliminates 37 stocks) (4) there must be no mention of a DLP in Avis prior to the official
announcement (eliminates 37 stocks) (5) the stock must trade exclusively in either the
continuous or the call auction throughout the analysis period (eliminates 8 stocks). The final
sample consists of 56 stocks. Of these, 37 are less liquid issues that trade in the call auction, and
19 are more liquid securities that trade continuously. We refer to these two subsamples as the
‘Illiquid’ sample and as the ‘Liquid’ sample, respectively.
7
Hasbrouck and Sofianos (1993) and Cao, Choe, Hatheway (1997) offer a detailed discussion of the NYSE
specialist performance criteria. The stabilization role of the specialist is analyzed in Goldstein and Kavacejz (2002).

7
For the Liquid stocks, we analyze activity during the continuous trading session only.
During this time, a large marketable limit order to buy (sell) may exhaust the depth on the inside
quote and walk up (down) the limit order book. Such orders are reported in the BDM database
as multiple trades occurring at the same time. We classify these simultaneous trades as a single
transaction. For the less liquid stocks that trade in a call auction, we analyze orders in addition to
trades and quotes. The order data suffers from two drawbacks for the purposes of this study.
First, it is not possible to observe when orders are executed. Therefore, we classify a buy (sell)
order as having been executed during the auction for which it was submitted if the order price is
greater (less) than or equal to the price at which the auction cleared. Second, it is not possible to
observe when orders are cancelled. Although we are unable to correct explicitly for this in our
analysis, Biais, Hillion, and Spatt (1999) find that relatively few orders are cancelled in the pre-
call-auction.
Summary statistics are presented in Table 1. DLPs are typically introduced on a stock-
by-stock basis. However, as many as four firms begin facilitated trading on the same day. On
average, liquidity providers are introduced approximately two trading days after their pending
introductions are announced. These results are generally consistent for both the Liquid and
Illiquid firms. As implied by our subsample nomenclature, differences in liquidity between the
two subsamples are pronounced. For the more liquid stocks, the median daily volume is 767,000
French francs (FF), eight times that of the less liquid sample. Additionally, Liquid firms tend to
be much larger. The median market capitalization of the illiquid sample is 202 million FF. The
median firm size for the more liquid stocks is nearly 1.3 billion FF. Differences in firm size,
trading activity and price are statistically significant at reasonable levels.

8
3. Event Study
We conduct an event study to analyze the extent to which the presence of a designated
liquidity provider increases firm value and, more specifically, whether the marginal benefit of
the DLP is greater for the Illiquid sample. We denote the DLP introduction day by ‘I’ and the
announcement day by ‘A’. The event window extends from A-5 to I+10. The days between
announcement and introduction, which varied, were combined. The market model is estimated
from I+23 through I+154 employing Scholes-Williams betas to adjust for infrequent trading and
using the value-weighted SBF120 Index as a proxy for the market portfolio. Since DLPs may be
announced for multiple securities on a single calendar date, cross-sectional correlation in returns
could bias the results. Therefore, we form equally weighted portfolios of securities that have
identical announcement dates and treat the portfolio returns as those of a single security. Test
statistics are calculated as in Brown and Warner (1985).
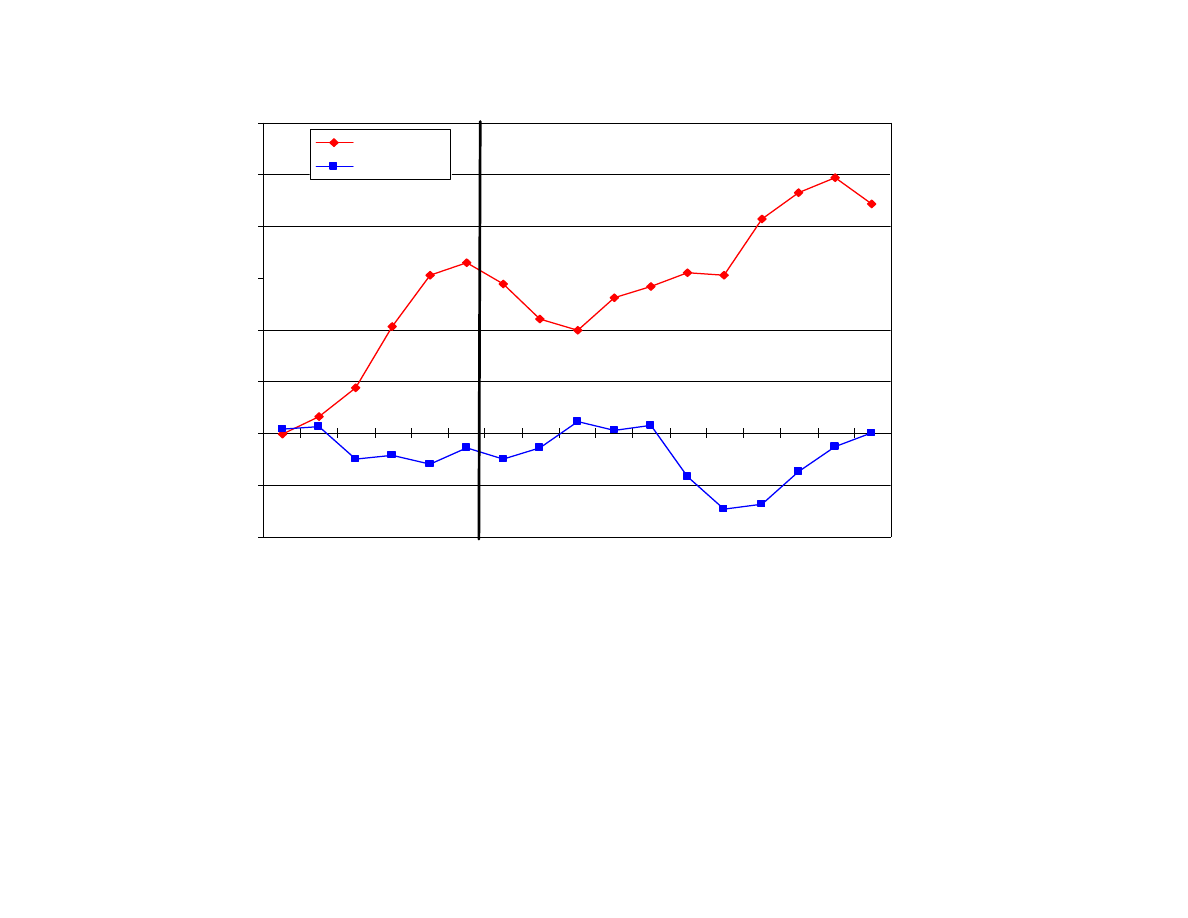
Figure 1 reveals distinct patterns in the cumulative average abnormal returns (CAARs)
for the Liquid and Illiquid subsamples. For the less liquid stocks, the announcement that a DLP
is to be introduced yields an immediate and positive average increase in price of more than three
percent. The effect persists over the next 10 trading days during which time prices drift upward
by an additional one percent. In contrast, the announcement appears to have little price effect for
more liquid securities. For trade days A-5 through I+10, the CAARs hover about zero.
Table 2 provides statistical tests of the results presented in Figure 1. For the less liquid
sample, the CAAR of 3.06 percent just prior to the announcement is statistically significant at the
one percent level. The price increase is driven, in large part, by the average abnormal returns of
1.25 percent (t-statistic=2.80) and 1.09 percent (t-statistic=2.44) on the days immediately prior to
the announcement. The CAAR at day t+10 of 4.43 percent is also significant at the one percent

9
level. The results strongly support the existence of a positive price effect due to the introduction
of the DLP that is permanent and economically meaningful. Statistical tests confirm the absence
of an observable price effect for the Liquid sample. The CAARs of –0.60 percent just prior to
announcement and 0.33 percent on the announcement day are not significantly different from
zero. The CAAR continues to remain insignificant on day I+10. For both subsamples, similar
results are obtained when we test the hypothesis that the proportion of firms with positive returns
is greater than one half. Statistical results are robust when measured over longer event windows.
These results offer strong support for the joint hypothesis that liquidity is priced [Amihud
and Mendelson (1986)] and that the services provided by the DLP are an important source of
liquidity. The findings are consistent with economic arguments that DLPs are more valuable for
less liquid stocks [Grossman and Miller (1988) and Glosten (1989)] and for stocks that trade in a
call auction [Economides and Schwartz (1995)], and are less valuable for stocks that trade in a
continuous ELOB [Glosten(1994)].
4. Market Quality
A. Stock liquidity and transactions costs
In this section, we examine changes in market quality around the introduction of the
designated liquidity provider. The pre-DLP period is defined as day A-6 through A-35 and the
post-DLP period is defined as day I+6 through I+35. We consider several measures of market
quality. For both the Liquid and Illiquid samples, we compute the change in activity as the
difference in the average daily number of trades and the average daily trading volume. We
compute the log difference of two additional measures presented in Amihud et al. (1997). The
average daily relative trading volume (RV) is the ratio of the average daily trading volume for a

10
given stock relative to the market. The liquidity ratio measures the number of shares that can be
traded for a unit change in stock price:
LR
i
=
∑
V
it
/
∑
|R
it
|,
(1)
where V
it
and R
it
are, respectively, the volume and return for stock i on day t, and the summation
is over the days in the event period. An increase in the LR ratio is consistent with an increase in
market depth. The results presented in Table 3 suggest that the DLP does not increase trading
volume or market depth for either sample.
For the liquid sample, we examine the changes in the quoted bid-ask spread and the
quoted depth. If the DLP enhances liquidity by placing buy (sell) limit orders that are above
(below) the best bid (ask) price, or by placing additional orders at the inside quote, then we
expect a decrease in percentage quoted spreads and/or an increase in the quoted depth after DLP
introduction. Studies of the NYSE have typically found that the NYSE specialist narrows the
inside spreads and improves on the best prices. In contrast, we find no statistically significant
change in time-weighted quoted spreads and depths, suggesting that the DLP in Paris does not
improve this dimension of market quality.
Additionally, for the Liquid sample, we estimate the change in effective spreads and price
impact. As the Paris Bourse is an automated market, the DLP cannot offer price improvement
like the NYSE specialist. However, the effective spread also captures the effect of large orders
that walk up the ELOB or upstairs trades that execute within the quotes. The price impact of
trades measures the degree of asymmetric information. Evidence on the NYSE suggests that the
specialist has the ability to identify the informed order flow and reduce information asymmetry
[see Benveniste et al. (1992) for theory and Chakravarty (2001) for empirical evidence].

11
Following Huang and Stoll (1996) and Bessembinder and Kaufman (1997), we measure
percentage effective spreads and percentage price impacts as follows:
Percentage effective spread
it
= 200*D
it
*(Price
it
- Mid
it
) / Mid
it
and
(2)
Percentage price impact
it
= 200* D
it
*(V
i(,t+30)
- Mid
it
) / Mid
it
,
(3)
where Price
it
is the transaction price for security i at time t, Mid
it
is the mid-point of the quoted
ask and bid prices, D
it
is a binary variable that equals 1 for buyer-initiated trades and -1 for
seller-initiated trades, and V
i,(t+30)
is the mid-point of the first quote reported at least 30 minutes
after the trade. In contrast to studies of the NYSE, we find no change in effective spreads or price
impact, suggesting that the DLP neither reduces execution costs nor resolves information
asymmetry. These findings are consistent, however, with the lack of discretion granted to the
DLP on the Paris Bourse.
B. Market Failure
The preceding results are consistent with the absence of price effects for the Liquid
sample. However, we also fail to observe an improvement in market quality that is implied by
the event study results for the Illiquid sample. The latter finding may be explained in two ways.
First, the semi-strong form of the efficient market hypothesis is violated. More likely, volume
and depth measures may not capture the benefit of designated liquidity provision. In this section,
we explore an alternative. In particular, Glosten (1989) argues that, when the level of adverse
selection risk is substantial, stocks may experience market failure in the absence of a DLP. The
less liquid sample may be predisposed to such breakdown as it is composed of relatively small
firms for which information asymmetries may be extreme [see Easley et al. (1996)].
One observable measure of market failure is the extent to which auctions do not clear.
Auction clearing frequency is calculated as the proportion of sessions for which a transaction

12
price is realized. For each stock, the clearing frequency is computed before and after the
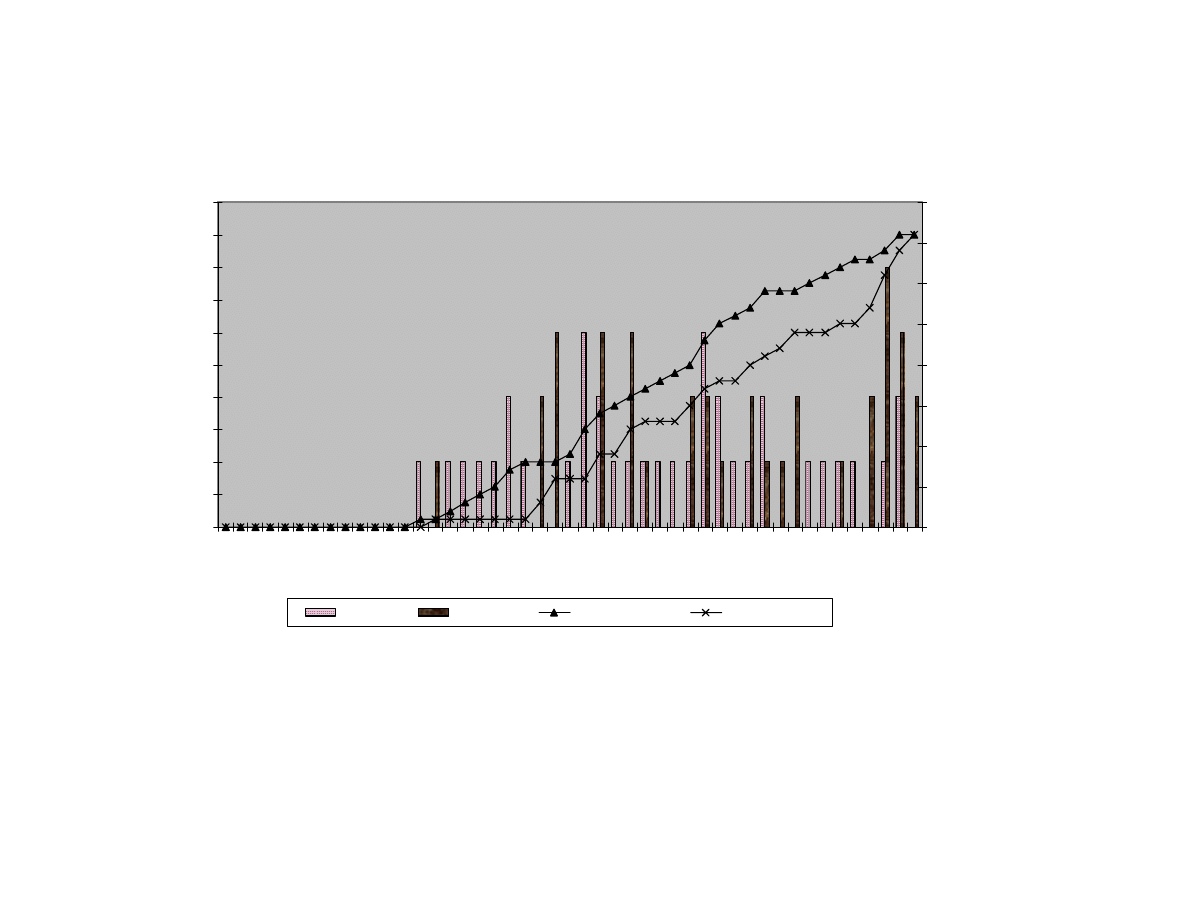
introduction of the liquidity provider. Figure 2 plots the cross-sectional distribution of clearing
frequencies in each period. The mass of the pre-DLP distribution is weighted more heavily in the
left tail. In the presence of the market maker, the distribution shifts right. In fact, based on
cumulative frequency plots, it is clear that the post-DLP distribution first order dominates. In
this sense, the presence of the DLP is beneficial.
Panel A of Table 4 reports auction clearing frequency statistics. Adverse selection risk is
potentially greatest in the morning due to the accumulation of information during the non-trading
period. Therefore, statistics are computed for all sessions, as well as by morning and afternoon
sessions. On average, 79.2 percent of all auctions clear prior to the introduction of the liquidity
provider. Once DLPs begin to trade, the clearing frequency increases significantly (p-value =
0.01) to more than 85 percent. The pattern persists for both morning and afternoon sessions.
The average morning auction clearing frequency increases from 86.5 percent to 93.5 percent (p-
value=0.00). In the afternoon, clearing increases by 5.2 percent, but is insignificant.
The decline in auction failures may reflect non-DLP-related changes in market
conditions. In particular, the market may clear more frequently because there is greater interest
to trade or because the interest to trade is more evenly distributed among buyers and sellers.
8
To
control for such factors, we estimate the following logit regression model with pooled time
series, cross section data:
(
)
(
)
+
+
+
×
+
+
+
=
∑
=
+
36
1
i
t,
i
5
i
t,
i
5
t,
i
4
t,
i
t,
i
3
t,
i
2
t,
i
1
0
t,
i
F
ow
NetOrderFl
Flow
TotalOrder
Morning
DLP
Morning
DLP
Clear
Pr
β
β
β
β
β
β
β
Λ
,
(4)
8
The DLP may produce information (e.g., analyst reports) and increase trading interest in a stock. To the extent that
this is true, this analysis understates the value of a DLP.

13
where
Λ
is the logistic cumulative distribution function,
t,
i
Clear equals 1 if auction t for firm i
clears and 0 otherwise,
t,
i
DLP equals 1 if auction t for firm i occurs in the presence of a market
maker and 0 otherwise,
t,
i
Morning equals 1 if auction t for firm i occurs in the morning and 0
otherwise,
t,
i
Flow
TotalOrder
is the total quantity of new shares submitted for stock i during
session t (in 1000’s),
t,
i
ow
NetOrderFl
is the total signed quantity of new shares submitted for
stock i during session t (in 1000’s), and
t,
i
F equals 1 if auction t is for firm i and 0 otherwise.
Regression results for full and reduced forms of the model are presented in Panel B of
Table 4 (firm dummies are omitted for brevity). Coefficients are significant at reasonable levels.
Intuitively, clearing frequency is positively correlated with the level of order flow and inversely
related to demand asymmetry. Controlling for these factors, DLPs increase the likelihood that
the market clears. For instance, in specification (1), the DLP coefficient equals 0.42 (p-
value=0.00). Significantly positive
1
β and
3
β
coefficients in specifications (2) and (3) indicate
that the benefits of designated liquidity provision are evident in both morning and afternoon
sessions but are more pronounced at the open. Consistent with the notion that information
asymmetry is more extreme in the morning, the market maker seems best able to reduce the
likelihood of market failure at the open.
As an alternative measure of (inverse) market failure, we consider order execution. We
estimate the following logit regression model with pooled time series, cross section data:
(
)
(
)
+
+
+
+
×
+
+
+
=
∑
=
+
36
1
i
t,
i
6
i
t,
i
6
t,
i
5
t,
i
4
t,
i
t,
i
3
t,
i
2
t,
i
1
0
t,
i
F
ness
Aggressive
balance
Im
ion
TimetoAuct
Morning
DLP
Morning
DLP
Execute
Pr
β
β
β
β
β
β
β
β
Λ
,
(5)

14
where
t,
i
Execute equals 1 if order t for firm i executes in the auction in which it is submitted and
0 otherwise.
t,
i
ion
TimetoAuct
is the number of trade hours between order submission and auction
time.
9
t,
i
balance
Im
measures the extent to which an order competes for execution. It equals the
signed ratio of
t,
i
ow
NetOrderFl
to
t,
i
Flow
TotalOrder
, where the ratio’s sign is positive if order
direction is the same sign as
t,
i
ow
NetOrderFl
and is negative otherwise.
t,
i
ness
Aggressive
is an
indicator variable that reflects the relative aggressiveness of the order submission price. For a
buy (sell) order,
t,
i
ness
Aggressive
equals 1 if the order price is more than one percent lower
(higher) than the previous auction price, equals 2 if the order price is within one percent of the
prior auction price, and equals 3 if the order price is more than one percent higher (lower) than
the previous auction price. All other variables are as defined earlier.
Panel C reports the results. Observations are share weighted such that the regression
coefficients reflect the likelihood that a given share executes. All coefficients are significant at
reasonable levels.
t,
i
balance
Im
and
t,
i
ness
Aggressive
coefficients are intuitive. A share is more
likely to execute if submitted as part of a more aggressive order, and it is less likely to execute as
the competition for liquidity increases. Biais, Hillion, and Spatt (1999) document time variation
in order execution rates for Paris Bourse call auctions. Consistent with this possibility, a share is
more likely to execute in the call auction as the order submission time approaches auction
clearing time. Most importantly, the DLP coefficient for specification (1) is significantly
positive. A share is more likely to execute when submitted in the presence of a market maker.
Consistent with expectations, specifications (2) and (3) indicate that designated liquidity
providers increase the likelihood that a share submitted in the morning executes. As
9
If the auction does not clear, the scheduled auction time is used.

15
(
)
t,
i
t,
i
Morning
DLP
×
coefficients are positive (0.29 and 0.40), we reject the null hypothesis that
0
3
1
=
+
β
β
(tests are not reported). However, post-LP, a share submitted in the afternoon is
less likely to execute;
t,
i
DLP coefficients for the two models are -0.08 and –0.29, respectively.
One potential explanation is that the increase in the morning execution rate reduces the available
supply of public limit orders on the ELOB in the afternoon such that the likelihood of execution
later in the day declines. On the whole, these findings suggest that a given share is more likely to
execute in the presence of a DLP.
5. Cross-sectional tests
The results thus far suggest that the introduction of the DLP has no effect for the Liquid
sample. In contrast, the event has created positive value for our sample of Illiquid stocks by
reducing the likelihood of market failure. It is likely that the impact of the DLP varied across
stocks in both samples. The liquidity premium hypothesis predicts that, assuming market
efficiency, firms that experience larger improvement in market quality due to DLP introduction
should also experience larger cumulative abnormal return. To test this proposition, we estimate
the following cross-sectional model:
CAR
i
=
α
+
β
* DMQ
i
+
ε
i
,
(6)
where CAR
i
is the cumulative abnormal return on stock i from day A-5 to day I+5, and DMQ
i
is
the change in market quality. Change in market quality is either measured as the change in
market liquidity (RV or LR), or as the change in execution costs for the Liquid sample and the
extent of market failure for the Illiquid sample.
Table 5 presents the results. For the Liquid sample (Panel A), we find that the
coefficients for average daily trading volume (1) and relative trading volume (2) are 0.047 (p-

16
value=0.02) and 0.053 (p-value=0.01), respectively. Despite the small sample size (N=18), the
adjusted-R
2
statistics are 28 percent and 26 percent, respectively, which suggests that substantial
cross-sectional variation in the CAR can be explained by changes in trading volume. The
relationship is weaker for DLR (3): the regression coefficient is 0.028 (p-value=0.08) and the
adjusted-R
2
drops to 12 percent. Finally, execution costs coefficients ((4) and (5)) are
insignificant and the adjusted-R
2
s are negative.
For the Illiquid sample (Panel A), the findings are consistent with the results in Table 3:
changes in trading volume ((1) and (2)) and market depth (3) do not explain the cross-sectional
variations in the CAR. In contrast, we find (in Panel B) that the market views the reduction in
auction failures favorably. The cross-sectional variation in the change in morning session
clearing (6) and afternoon session clearing (7) explain 7 percent and 9 percent of the variation in
CARs, respectively. Across all sessions (8), the coefficient is 0.002 (p-value=0.02), with a
corresponding increase in adjusted-R
2
to 12 percent. Finally, if we proxy the benefit of DLP
introduction for each stock as the logit regression coefficient from the call auction clearing
specification (see model 1 in Panel B of Table 4) estimated on a stock-by-stock basis, the
coefficient of DMQ is highly significant at 0.036 (p-value=0.00). These cross-sectional results
are consistent with the liquidity premium hypothesis for both samples: firms that experienced a
larger improvement in market quality after DLP introduction also experienced larger cumulative
abnormal returns. The results also provide strong empirical support for the Glosten (1989)
prediction that a DLP may enhance liquidity by preventing market failures, rather than by
increasing overall trading volume or by reducing executions costs in the traditional sense.

17
6. Conclusions
This paper studies the value of a non-strategic specialist. We conduct a natural controlled
experiment examining a sample of Paris Bourse securities that trades both with and without the
assistance of a market maker. Following the introduction of a designated liquidity provider into
a purely order driven market, less liquid stocks experience a statistically significant increase in
price that is permanent and economically meaningful; actively traded issues are generally
unaffected. These findings are consistent with a liquidity premium in asset prices.
Results are obtained despite the fact that the Paris Bourse liquidity provider is a passive
player in the market who simply quotes a maximum spread and a minimum depth. The more
complex role of the NYSE specialist often requires active intervention in the trading process.
Assessing the value of such discretion is beyond the scope of this analysis. Here, the more
modest objective is an improved understanding of the benefits (if any) to maintaining a regular
market presence, the single responsibility shared by agents of the NYSE and the Paris Bourse.
The evidence suggests that, while patient limit order traders may provide an adequate supply of
liquidity for actively traded securities, participation by a market maker reduces the likelihood of
market failure for less liquid stocks. Market presence alone neither reduces execution costs nor
increases market depth. The fact that the NYSE specialist is able to improve these dimensions of
market quality suggests that granting the designated liquidity provider some powers to direct the
trading process may further improve the terms of trade in an electronic order driven market.
Selection bias is an inherent problem in this analysis. Since market makers tend to be
assigned to stocks that are likely to benefit from their presence, our findings may overstate the
advantages of designated liquidity provision for a randomly selected firm. At least for the event
study, this problem may largely resolve itself. If market makers are more likely to be introduced

18
for certain issues, it follows that an efficient market should anticipate their arrival. As a result,
announcement abnormal returns are attenuated and the upward bias is, at least in part, offset.
A second important limitation of this study concerns the interpretation of the results. We
emphasize that the value of the specialist tends to be greater for more thinly traded assets. This
explanation is consistent with both economic theory and extant empirical research. However, an
alternative interpretation may be that the benefits to delegated market making vary by trading
mechanism. Consistent with the data, Glosten (1994) suggests that augmenting the limit order
book with the services of a designated liquidity provider will not improve the terms of trade in an
automated continuous market, and Economides and Schwartz (1995) suggest that a market
maker can only enhance liquidity in an electronic call market. Our results may therefore reflect
both the liquidity properties of the sample stocks and the mechanisms in which they are
exchanged, as these alternatives are not mutually exclusive. Unfortunately, the data do not easily
lend themselves to disentanglement of the two effects. Future research may continue to explore
why some stocks benefit from professional liquidity services while others do not.

19
REFERENCES
Amihud, Yakov, and Haim Mendelson, 1986, Trading mechanisms and stock returns: An
empirical investigation, Journal of Finance 42, 533-553.
Amihud, Yakov, Haim Mendelson, and Beni Lauterbach, 1997, Market microstructure and
securities value: Evidence from Tel Aviv stock exchange, Journal of Financial Economics
45, 365-390.
Anand, Amber and Daniel Weaver, 2002, The value of a specialist: empirical evidence from the
CBOE, working paper, Syracuse University.
Benveniste, Lawrence M., Alan J. Marcus, and William J. Wilhelm, 1992, What's special about
the specialist? Journal of Financial Economics 32, 61-86.
Bessembinder, Hendrik, and Herbert M. Kaufman, 1997, A comparison of trade execution costs
for NYSE and Nasdaq-listed stocks, Journal of Financial and Quantitative Analysis 32, 287-
310.
Biais, Bruno, Pierre Hillion, and Chester Spatt, 1995, An empirical analysis of the limit order
book and the order flow in the Paris Bourse, Journal of Finance 50, 1655-1689.
Biais, Bruno, Pierre Hillion, and Chester Spatt, 1999, Price discovery and learning during the
pre-opening period in the Paris Bourse, Journal of Political Economy 107, 1218-1248.
Brennan, Michael J., and Avanidhar Subrahmanyam, 1996, Market microstructure and asset
pricing: On the compensation of illiquidity in stock returns, Journal of Financial Economics
41, 441-464.
Brennan, Michael J., Tarun Chordia and Avanidhar Subrahmanyam, 1998, Alternative factor
specifications, securities characteristics, and the cross-section of expected stock returns,
Journal of Financial Economics 49, 345-373.
Brown, Stephen J., and Jerold B.Warner, 1985, Using daily stock returns: the case of event
studies, Journal of Financial Economics 14, 3-31.
Cao, Charles, Hyuck Choe, and Frank Hatheway, 1997, Does the specialist matter? Differential
execution costs and intersecurity subsidization on the New York Stock Exchange, Journal of
Finance 52, 1615-40.
Chakravarty, Sugato, 2001, Stealth-trading: Which traders’ trades move stock prices?, Journal of
Financial Economics 61, 289-307.
Demarchi, Marianne, and Thierry Foucault, 1999, Equity trading systems in Europe – A survey
of recent changes, Working paper, SBF-Bourse de Paris and CETFI – University of Aix-
Marseille III.

20
Demsetz, Harold, 1968, The cost of transacting, Quarterly Journal of Economics, 33-53.
Eleswarapu, Venkat, 1997, Cost of transacting and expected returns in the NASDAQ stock
market, Journal of Finance 52, 2113-2127.
Easley, David, Nicholas M. Keifer, Maureen O’Hara, and Joseph B. Paperman, 1996, Liquidity,
information, and infrequently traded stocks, Journal of Finance 51, 1405-1436.
Economides, Nicholas and Robert A. Schwartz, 1995, Electronic call market trading, Journal of
Portfolio Management 21, 10-18.
Glosten, Lawrence, 1989, Insider trading, liquidity, and the role of the monopolistic specialist,
Journal of Business 62, 211-236.
Glosten, Lawrence, 1994, Is the electronic open limit order book inevitable? Journal of Finance
49, 1127-1161.
Glosten, Lawrence, and Paul Milgrom, 1985, Bid, ask and transaction prices in a specialist
market with heterogeneously informed traders, Journal of Financial Economics 14, 71-100.
Goldstein, Michael, and Kenneth Kavajecz, 2000, The anatomy of liquidity provision during
circuit breakers and extreme market movements, working paper, University of Pennsylvania.
Grossman, Sanford J., and Merton H. Miller, 1988, Liquidity and market structure, Journal of
Finance 43, 617-633.
Harris, Lawrence E., 1996, Does a large minimum price variation encourage order exposure?
NYSE Working Paper 96-05.
Hasbrouck, Joel, and George Sofianos, 1993, The trades of market makers: An analysis of NYSE
specialist, Journal of Finance 48, 1565-1594.
Huang, Roger, and Hans Stoll, 1996, Dealer versus auction markets: A paired comparison of
execution costs on Nasdaq and NYSE, Journal of Financial Economics 41, 313-357.
Kalay, Avner, Li Wei, and Avi Wohl, 2002, Continuous trading or call auctions: Revealed
preferences of investors at the Tel Aviv Stock Exchange, Journal of Finance 57, 523-542.
Kavajecz, Kenneth A., 1999, A specialist's quoted depth and the limit order book. Journal of
Finance 54, 747-771.
Kehr Carl-Heinrich, Jan P. Krahnen, and Erik Theissen, 2001, The anatomy of a call market:
evidence from Germany, Journal of Financial Intermediation 10, 249-270.

21
Madhavan, Ananth, and Venkatesh Panchapagesan, 2000, Price discovery in auction markets: A
look inside the black box, Review of Financial Studies, forthcoming.
Madhavan, Ananth, and Seymour Smidt, 1993, An analysis of changes in specialist quotes and
inventories, Journal of Finance 48, 1595-1628.
Madhavan, Ananth, and George Sofianos, 1998, An empirical analysis of NYSE specialist
trading, Journal of Financial Economics 48, 189-210.
Mayhew, Stewart, 2002, Competition, market structure and bid-ask spreads in stock options
markets, Journal of Finance 57, 931-958.
Muscarella, Chris, and Michael S. Piwowar, 2001, Market microstructure and securities values,
Evidence from the Paris Bourse, Journal of Financial Markets 4, 209-229.
Pagano, Michael S., and Robert A. Schwartz, 2002, A closing call’s impact on market quality at
Euronext Paris, forthcoming, Journal of Financial Economics.
SBF Bourse De Paris, 1995, BDM – The Paris Bourse Database (SBF Bourse De Paris, Paris).
The Paris Bourse Users Guide 1996.
Seppi, Duane, 1997, Liquidity provision with limit orders and a strategic specialist, Review of
Financial Studies 10, 103-150.
Venkataraman, Kumar, 2001, Automated versus floor trading: An analysis of execution costs on
the Paris and New York exchanges, Journal of Finance 4, 1445-1485.

22
Table 1: Sample summary statistics
Reported are summary statistics of the sample of 19 firms of medium-to-high liquidity (Liquid sample)
and 37 firms of low liquidity (Illiquid sample) on Euronext Paris where a liquidity provider (LP) was
introduced between 1995 to 1998. Stocks per introduction represent the total number of stocks introduced
on each LP introduction day. Days until introduction represent the number of trading days between the LP
announcement date (A) and the LP introduction date (I). Market capitalization is the market size in FF
millions on the LP introduction day. Daily trading volume is the average daily trading volume (in 000’s
of FF) in the pre-LP period (Days[A-35,A-5]) while stock price is the first market price in the pre-LP
period. All sample measures are cross sectional averages across sample firms within liquidity groups.
Mean
Median
Std. Dev
Min
Max
Panel A: Liquid Sample (N=19)
Stocks per introduction
1.06
1.00
0.24
1.00
2.00
Days until introduction
1.53
2.00
0.61
0.00
2.00
Market Capitalization (in millions)
1,550
1,273
1,183
220
4,751
Daily trading volume (in 000's of FF)
981
767
1,070
15
5,077
Price
315
265
186
129
898
Panel B: Illiquid Sample (N=37)
Stocks per introduction
1.23
1.00
0.68
1.00
4.00
Days until introduction
1.70
2.00
0.66
1.00
4.00
Market Capitalization (in millions)
253
202
229
63
1,423
Daily trading volume (in 000's of FF)
205
92
254
0
1,301
Price
211
198
110
65
600

23
Table 2: Cumulative abnormal returns around introduction of the Liquidity Provider
Average abnormal returns (AAR) and cumulative average abnormal returns (CAAR) around the
introduction of a Liquidity Provider (LP) of 19 firms of medium-to-high liquidity (Liquid sample) and 37
firms of low liquidity (Illiquid sample) on Euronext Paris from 1995 to 1998. The event window extends
from five days before the announcement day (A) to 10 days after the LP introduction day (I). Event day I
aggregates the period through A to I (the number of days in this period varies). The market model is
estimated over a 132 days period that begins 23 days after the introduction date. Scholes-Williams betas
are computed using the value-weighted SBF120 Index as a proxy for the market. Daily returns are
calculated from closing prices (adjusted for dividends, splits, and other corporate actions). Stocks with
identical introduction dates are formed into equally weighted portfolios.
Day
AAR
t
CAAR
t
AAR
t
CAAR
t
-5
0.08
0.14
0.08
0.14
-0.02
-0.04
-0.02
-0.04
-4
0.04
0.06
0.12
0.14
0.33
0.75
0.32
0.50
-3
-0.63
-1.11
-0.51
-0.52
0.59
1.33
*
0.88
1.14
-2
0.08
0.14
-0.43
-0.38
1.25
2.80
***
2.05
2.29
**
-1
-0.17
-0.31
-0.60
-0.48
1.09
2.44
***
3.06
3.07
***
A
0.33
0.58
-0.28
-0.20
0.25
0.55
3.29
3.01
***
I
-0.22
-0.39
-0.50
-0.33
-0.44
-1.00
2.88
2.44
***
1
0.21
0.38
-0.29
-0.18
-0.75
-1.67
**
2.21
1.75
**
2
0.51
0.91
0.22
0.13
-0.24
-0.53
1.98
1.48
*
3
-0.17
-0.29
0.06
0.03
0.62
1.40
*
2.61
1.85
**
4
0.09
0.16
0.15
0.08
0.22
0.50
2.83
1.91
**
5
-1.05
-1.86
**
-0.84
-0.43
0.29
0.65
3.11
2.01
**
6
-0.67
-1.19
-1.47
-0.72
-0.05
-0.12
3.06
1.90
**
7
0.11
0.20
-1.36
-0.64
1.08
2.42
***
4.14
2.48
***
8
0.62
1.10
-0.74
-0.34
0.51
1.15
4.65
2.69
***
9
0.50
0.89
-0.26
-0.12
0.28
0.62
4.93
2.76
***
10
0.29
0.51
0.01
0.00
-0.51
-1.15
4.43
2.41
***
***
,
**
, and
*
: Significant at the 1, 5, and 10 percent respectively (one-tailed)
Liquid Sample (N=19 firms)
Illiquid Sample (N=37 firms)

24
Table 3: Changes in Market Quality with introduction of a Liquidity Provider
Reported are trading volume and transactions cost measures around the introduction of a Liquidity
Provider (LP) for 19 firms of medium-to-high liquidity (Liquid sample) and 36 firms of low liquidity
(Illiquid sample) on Euronext Paris from 1995 to 1998. Market quality measures are obtained using trade
and quote data from the BDM database. Relative trading volume is the logarithm of the average trading
volume of stock normalized by the average daily trading volume of the market. The market depth (LR)
measures the trading volume associated with a unit change in the stock price. Percentage quoted spread is
computed as [200*(Ask-Bid)/mid], where mid is the midpoint of the bid-ask quotes. Percentage effective
spread is computed as [200
×
dummy
×
(Price-mid)/mid], where the dummy equals one for a market buy
and negative one for a market sell, price is the transaction price. Percentage price impact is computed as
[200
×
dummy
×
(Qmid30 - mid)/mid], where Qmid30 is the midpoint of the first quote observed after 30
minutes. All market quality measures are cross sectional averages across sample firms during 30 day
trading window in the pre-LP period (Days[A-35,A-5]) and post-LP period (Days[I+5,I+35], where A is
the LP announcement date and I is the LP introduction date. The p-value tests the null that market quality
measures are equal.
Pre-LP
Post-LP p-val of Diff.
Pre-LP
Post-LP p-val of Diff.
Panel A: Liquid Sample
Trading Volume
Daily number of trades
17
21
(0.42)
14
15
(0.80)
Daily trading volume
1,504,900
3,485,400
(0.41)
901,900
1,245,100
(0.25)
Relative trading volume
-9.04
-8.98
(0.67)
-8.93
-8.95
(0.86)
Market depth (LR ratio)
1,287,500
2,476,200
(0.66)
663,351
752,358
(0.28)
Quotations
Quoted spreads (%)
0.74
0.82
(0.46)
0.59
0.62
(0.77)
Quoted depth (Ask)
194
198
(0.25)
160
177
(0.51)
Quoted depth (Bid)
190
184
(0.54)
144
138
(0.49)
Transactions Cost
Effective spreads (%)
1.45
1.60
(0.47)
1.33
1.25
(0.89)
Price impact (%)
0.36
0.35
(0.53)
0.31
0.35
(0.82)
Panel B: Illiquid Sample
Trading Volume
Daily trading volume
210,600
198,800
(0.73)
318,800
349,800
(0.88)
Relative trading volume
-10.77
-10.82
(0.81)
-10.62
-10.84
(0.47)
Market depth (LR ratio)
269,400
263,800
(0.87)
167,000
148,500
(0.71)
Mean
Median

25
Table 4: Changes in Call Auction Market Quality with introduction of a Liquidity Provider
Reported are call auction market quality measures around the introduction of a Liquidity Provider (LP)
for 36 firms of low liquidity (Illiquid sample) on Euronext Paris from 1995 to 1998. Market quality
measures are obtained using trade, quote and order data from the BDM database during a 30 day trading
window in the pre-LP period and post-LP period. Panel A presents the average proportion of morning,
afternoon and overall sessions that cleared before and after the introduction of the LP. The p-value tests
the null that market quality measures are equal. Panel B presents MLE estimates of a pooled logit
regression of the likelihood that a session clears. The dependent variable is dummy variable that takes the
value of one when the session clears and zero otherwise. The LP variable takes the value of one in the
Post-LP period and zero in the Pre-LP period. Morning variable takes the value of one for morning
sessions and zero otherwise. Total order flow is the total number of new shares submitted during the
session (in 1000s). Net order flow is the total signed quantity of new shares submitted during the session
(in 1000s). Also included are 36 firm dummy variables that take on a value of one for the firm in question
and zero otherwise. Panel C presents the MLE estimates of a pooled logit regression of the likelihood that
an order executes. The dependent variable is one when the order executes and zero otherwise. Time-to-
auction variable measures the number of hours between the time when an order is submitted and the next
scheduled auction. Imbalance is the signed ratio of |Net order flow| to Total order flow. The ratio's sign is
positive if the direction of the order equals the sign of the Net order flow. Aggressiveness is one for the
least aggressive orders, two for the more aggressive orders, and three for the most aggressive orders.
Panel B: Logistical analysis of likelihood of call auction clearing
(1)
(2)
(3)
Intercept
1.34
(0.00)
0.89
(0.00)
0.10
(0.65)
LP
0.42
(0.00)
0.32
(0.00)
0.29
(0.01)
Morning
1.08
(0.00)
1.02
(0.00)
LP * Morning
0.38
(0.04)
0.35
(0.07)
Total order flow
0.36
(0.00)
|Net order flow|
-0.33
(0.00)
Firm Dummies
Yes
Panel C: Logistical analysis of likelihood of order execution
(1)
(2)
(3)
Intercept
-0.08
(0.00)
0.46
(0.00)
-1.25
(0.00)
LP
0.13
(0.00)
-0.08
(0.00)
-0.29
(0.00)
Morning
-0.86
(0.00)
-0.82
(0.00)
LP * Morning
0.29
(0.00)
0.40
(0.00)
Time to auction
-0.23
(0.00)
Imbalance
-1.07
(0.00)
Aggressiveness
1.70
(0.00)
Firm Dummies
Yes
Panel A: Proportion of call auction clearing
Pre-LP
Post-LP
p-val
Pre-LP
Post-LP
p-val
Morning sessions (%)
86.50
93.50
(0.00)
90.00
96.70
(0.00)
Afternoon sessions (%)
71.90
77.10
(0.16)
73.03
80.00
(0.14)
Overall sessions (%)
79.20
85.30
(0.01)
81.30
85.80
(0.02)
Mean
Median

26
Table 5: Cross-sectional regressions of CAR on changes in market quality
Reported are coefficients of cross-sectional regressions of CAR on changes in market quality around the introduction of a Liquidity Provider (LP)
for 19 firms of medium-to-high liquidity (Liquid sample) and 36 firms of low liquidity (Illiquid sample) on Euronext Paris from 1995 to 1998.
Market quality measures are obtained using trade, quote and order data from the BDM database during a 30 day trading window in the pre-LP
period and post-LP period. In Panel A, relative trading volume is the logarithm of the average trading volume of stock normalized by the average
daily trading volume of the market. The market depth (LR) measures the trading volume associated with a unit change in the stock price.
Percentage quoted spread is computed as [200*(Ask-Bid)/mid], where mid is the midpoint of the bid-ask quotes. Percentage price impact is
computed as [200
×
dummy
×
(Qmid30 - mid)/mid], where Qmid30 is the midpoint of the first quote observed after 30 minutes. In Panel B, call
auction market quality is measures by the change in the average proportion of morning, afternoon and overall sessions that cleared. In Model (9),
the CARs are regressed on the LP coefficient of the firm-specific logit analysis of model (1) in Panel B of Table 4.
Panel A: Regression of CAR [-5,+5] on change in market quality
(1)
(2)
(3)
(4)
(5)
Diff. in
Diff. in relative
Diff. in
Diff. In
Diff. In
Trading Volume
trading volume
market depth
quoted spread
price impact
Liquid Sample (N=18)
Intercept
-0.016
-0.012
-0.012
-0.008
-0.011
(0.21)
(0.32)
(0.39)
(0.61)
(0.47)
Slope
0.047
0.053
0.028
-0.019
0.009
(0.02)
(0.01)
(0.08)
(0.53)
(0.68)
Adjusted R
2
28%
26%
12%
-4%
-5%
Illiquid Sample (N=35)
Intercept
0.028
0.028
0.028
(0.07)
(0.07)
(0.07)
Slope
0.001
0.001
0.002
(0.92)
(0.93)
(0.85)
Adjusted R
2
-3%
-3%
-3%
Panel B: Regression of CAR [-5,+5] on change in call auction market quality
(6)
(7)
(8)
(9)
Diff. in morning
Diff. in afternoon
Diff. in overall
LP coefficient - Table 4
session clearing
session clearing
session clearing
Panel B - Model (1)
Intercept
0.011
0.021
0.014
0.005
(0.51)
(0.16)
(0.37)
(0.70)
Slope
0.002
0.001
0.002
0.036
(0.06)
(0.04)
(0.02)
(0.00)
Adjusted R
2
7%
9%
12%
20%
27
Figure 1:
Cumulative abnormal returns around the introduction of a Liquidity Provider (LP) of 37 firms of low liquidity (Illiquid firms) and 19
firms of medium-to-high liquidity (Liquid firms) on Euronext Paris from 1995 to 1998. The event window extends from five days before the
announcement day (A) to 10 days after the LP introduction day (I). Event day I aggregates the period through A to I (the number of days in this
period varies). The market model is estimated over a 132 days period that begins 23 days after the introduction date. Scholes-Williams betas are
computed using the value-weighted SBF120 Index as a proxy for the market. Daily returns are calculated from closing prices (adjusted for
dividends, splits, and other corporate actions). Stocks with identical introduction dates are formed into equally weighted portfolios.
-2
-1
0
1
2
3
4
5
6
-5
-4
-3
-2
-1
A
I
1
2
3
4
5
6
7
8
9
10
Event Day
C
um
ul
at
ive
A
bnor
m
al
R
et
ur
ns
(%
)
Illiquid Firms
Liquid Firms
28
Figure 2:
Reported are the average proportion of call auctions that clear around the introduction of a Liquidity Provider (LP) for 36 firms of low
liquidity (Illiquid sample) on Euronext Paris from 1995 to 1998. Market quality measures are obtained using trade, quote and order data from the
BDM database during a 30 day trading window in the pre-LP period (Days[A-35,A-5]) and post-LP period (Days[I+5,I+35], where A is the LP
announcement date and I is the LP introduction date. The left axis and right axis represent the number of firms and the cumulative number of firms
in each call clearing frequency.
Call Auction Clearing Frequency
0
0.5
1
1.5
2
2.5
3
3.5
4
4.5
5
0.0
17.0
33.0
56.7
68.3
76.7
81.5
86.8
92.9
98.3
Proportion of Call Auctions Clearing
Fr
e
que
nc
y
0
5
10
15
20
25
30
35
40
C
u
m
u
la
ti
ve
Fr
e
que
nc
y
Pre-LP
Post-LP
Pre-LP_Cum
Post-LP_Cum
Wyszukiwarka
Podobne podstrony:
Introduction Blocking stock in warehouse management and the management of ATP
pacyfic century and the rise of China
Pragmatics and the Philosophy of Language
Haruki Murakami HardBoiled Wonderland and the End of the World
drugs for youth via internet and the example of mephedrone tox lett 2011 j toxlet 2010 12 014
Osho (text) Zen, The Mystery and The Poetry of the?yon
Locke and the Rights of Children
Concentration and the Acquirement of Personal Magnetism O Hashnu Hara
K Srilata Women's Writing, Self Respect Movement And The Politics Of Feminist Translation
86 1225 1236 Machinability of Martensitic Steels in Milling and the Role of Hardness
Becker The quantity and quality of life and the evolution of world inequality
The World War II Air War and the?fects of the P 51 Mustang
The Manhattan Project and the?fects of the Atomic Bomb
All the Way with Gauss Bonnet and the Sociology of Mathematics
Zen and the Art of Motorcycle Maintenance
Classical Translation and the Location of Cultural Authority
pharr homer and the study of greek
CONTROL AND THE MECHANICS OF START CHANGE AND STOP
więcej podobnych podstron