
The acoustical influence of balcony depth
and parapet form: experiments and simulations
H. Hossam El Dien
*
, P. Woloszyn
CERMA, UMR CNRS 1563, Ecole dArchitecture de Nantes, Rue Massenet, BP 81931,
44319 Nantes Cedex 3, France
Received 1 March 2004; received in revised form 31 August 2004; accepted 17 September 2004
Available online 13 November 2004
Abstract
The influence of balcony depth and parapet form on the acoustical performance of building
facades close to roadways have been investigated. Various depths and two inclinations of par-
apet have been modeled on an eight floor building. Pyramid ray-tracing simulations and scale
model measurements have been carried out. The predicted and measured A-weighted sound
pressure level reductions over the balcony back wall and in free field conditions have been
compared. The results have been used to derive empirical equations for predicting protection
as a function of geometrical parameters. The protection obtained by various parapet depths
ranges between 4 and 8 dB(A), while an additional protection of between 0.5 and 4 dB(A)
can be obtained by inclining the parapets.
2004 Elsevier Ltd. All rights reserved.
Keywords: Environmental noise; Balcony; Pyramid tracing; Traffic noise
1. Introduction
It is known that surrounding landscape, natural or artificial barriers and soil com-
position can reduce the sound propagation when the distance between the sound
0003-682X/$ - see front matter
2004 Elsevier Ltd. All rights reserved.
doi:10.1016/j.apacoust.2004.09.004
*
Corresponding author. Tel.: +33 2 40 59 43 24; fax: +33 2 40 59 11 77.
E-mail address:
(H. Hossam El Dien).
Applied Acoustics 66 (2005) 533–551
www.elsevier.com/locate/apacoust

source and the observer is in the vicinity of approximately a hundred meters
.
When that distance is between 5 and 50 m (as is the case in high density cities),
the building envelope influences the noise levels from the nearby roadway.
A balcony is one of building envelope elements that can provide acoustic protec-
tion. A previous paper
discussed the benefits gained from the balcony ceiling. In
this paper of the sound level reduction due to various balcony forms is investigated.
Previous studies have investigated sound levels reductions due to balcony depth
by experimental and numerical models, and field measurements. Mohsen and Old-
ham
concluded that a first floor open balcony with 1 m depth, without a ceiling,
could provide L
10
insulation of
6 dB(A). Field measurements by May
did not
give any information about the reduction obtained by isolating balconys parapet
surface. The numerical study of Hothersall et al.
discussed the effect of treating
parapet surfaces with absorbing materials for 1 m-balcony depth and for four floors.
It was found that these treatments can provide 3.9 dB(A) of reduction at the first
floor and between 1 and 1.9 dB(A) reduction for the other floors. Hammad and
Gibbs
evaluated the effect of four depths and two types of parapet forms (splitter
and thnadner), for a five floor building with closed balconies. It was found that the
protection increase by 2 dB(A) per floor level for lower levels, and the protection ob-
tained by parapet forms range between 2 and 6 dB(A). Hossam El-dien and Wol-
oszyn
, have investigated the use of an inclined form to increase the
shielding effect to protect the balcony back wall from the traffic noise nuisance in
a free field conditions.
In this study, the effects of three balcony depths and two parapet inclinations on
an 8-floor building near to a road are investigated by means of model experiments
and numerical simulations. As in many references
the general screening ef-
fects are expressed in terms of A-weighted sound levels.
2. Prediction methodology and geometric parameters
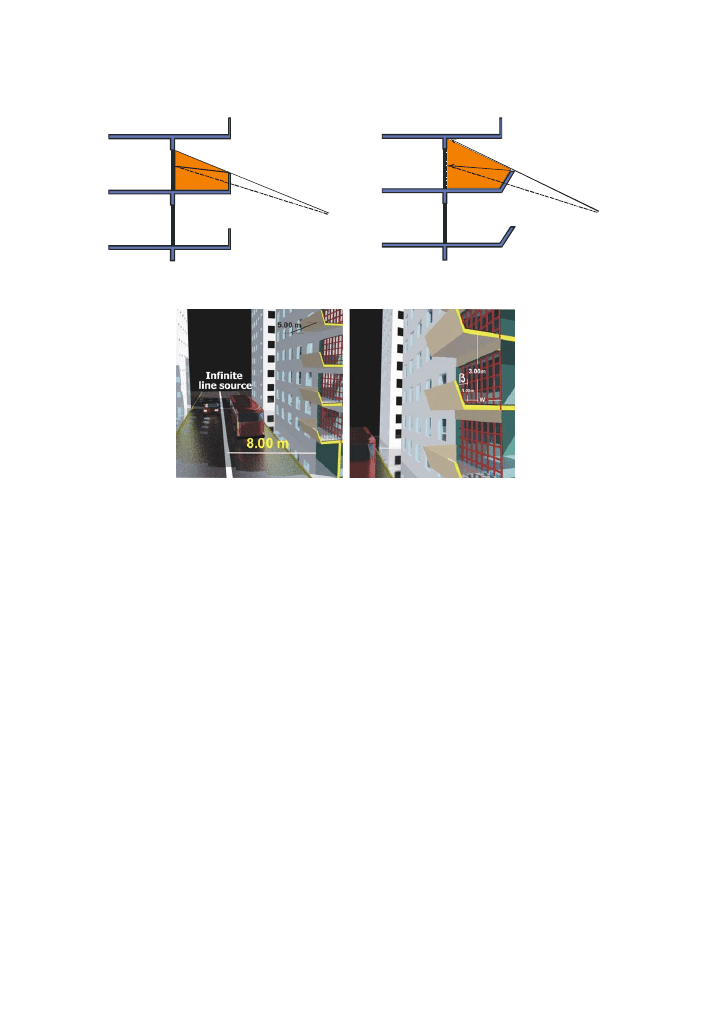
The model experiments have used an equivalent to an infinite coherent line source
parallel to the building facade. All the surfaces in the model are initially defined as
quasi-specular surfaces (painted concrete block and varnished wood with absorption
coefficient a = 0.07 at 1 kHz) (see
).
Reverberation has not been taken into account in either the simulations or the
experiments. Moreover the effects of atmospheric absorption have not been scaled
in the experiments since they have been carried out in the same atmospheric condi-
Table 1
Sound absorption coefficient in octave bands
125 Hz
250 Hz
500 Hz
1 kHz
2 kHz
4 kHz
Painted concrete block
0.1
0.05
0.06
0.07
0.09
0.08
Varnished wood
0.15
0.1
0.1
0.07
0.06
0.07
534
H. Hossam El Dien, P. Woloszyn / Applied Acoustics 66 (2005) 533–551

tions (20
C temperature and 60% humidity). The corresponding atmospheric atten-
uation A
atm
values are presented in
The atmospheric attenuation reduction has been calculated for various reception
points (
). Its effect is between 0.3 and 0.7 dB(A).
The basic idea of increasing balconys depth and inclining balconys parapet is to
decrease the contributions of the reflected and diffuse energy components by increas-
ing the shielding zones as shown in
. The inclined parapet increases the shield-
ing zone over the balcony back wall in comparison with the classical parapet form.
This is due to the screening of that surface from direct rays and the increasing of the
path between the source and the reception points.
The protection provided by these configurations are calculated by the following
steps:
Firstly, the sound pressure reference level (SPL
f
), in A-weighted scale, was calcu-
lated in free condition over the surface of the facade. The protection level due to the
balcony depth is defined as the difference in noise level at an assessment point with
and without balcony and calculated by the following relation:
L
w
¼ SPL
f
SPL
w
dB
ðAÞ;
ð1Þ
while the protection level obtained by the inclined parapet is calculated according to
L
b
¼ SPL
w
SPL
b
dB
ðAÞ;
ð2Þ
Table 2
Atmospheric attenuation on dB/1 m for the scale model measurements
Frequency
1250 Hz
2500 Hz
5000 Hz
10 kHz
20 kHz
A
atm
(dB/1 m)
0.007309
0.012712
0.030384
0.098938
0.359031
Table 3
Atmospheric attenuation on dB/10 m for full-size simulation
Frequency
125 Hz
250 Hz
500 Hz
1 kHz
2 kHz
A
atm
(dB/10 m)
0.000292
0.001056
0.003069
0.006186
0.010399
Table 4
Atmospheric attenuation in dB(A) at various distances: (a) scale model; (b) full-size simulation
Distance (m)
Attenuation dB(A)
(a)
1.5
4.8
2.25
5.2
3
5.7
(b)
15
4.5
22.5
4.7
30
5.0
H. Hossam El Dien, P. Woloszyn / Applied Acoustics 66 (2005) 533–551
535
where SPL
b
is the sound pressure level obtained by a balcony with inclined parapet
at the same reception point, SPL
w
is the sound pressure level after the insertion of a
balcony with different depths.
As shown in
, the simulation has been carried out with the following
variables:
1. The horizontal projection depth (W = 1, 2, and 3 m).
2. The balconys parapet inclined angle (b = 15
and 30).
Including the fixed parameters:
1. Sound source (infinite).
2. Distance to road (8.00 m).
3. Front wall height (1.00 m).
4. Balconys length (L = 5.00 m).
5. Number of floors (8 floors).
3. Numerical model
The simulation process is carried out through a pyramid tracing numerical mode-
ling technique
. The main advantage of pyramid tracing over other diverging
Fig. 2. Geometric parameters.
Reception point
(R)
Shadow zone
S
S
Reception point
(R)
Shadow zone
Fig. 1. Schematic representation the shielding effect before and after changing balcony parapet form.
536
H. Hossam El Dien, P. Woloszyn / Applied Acoustics 66 (2005) 533–551
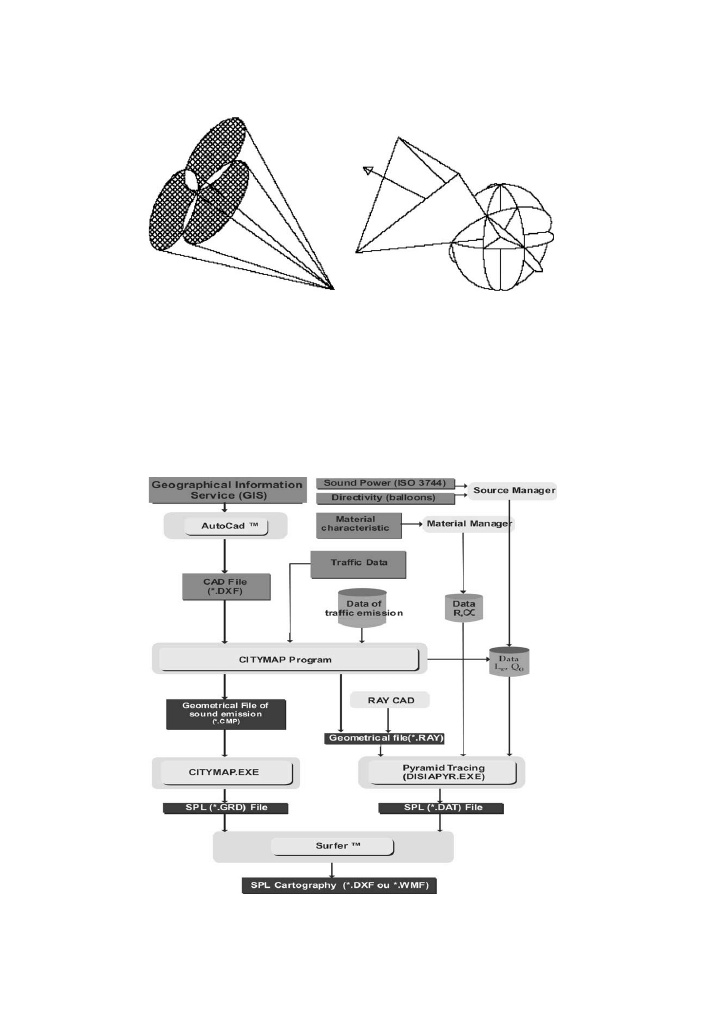
beam tracers (cone tracing
, circular Gaussian beam tracing
) is the fact that
pyramids perfectly cover the surface of a spherical source, while cones cause overlap-
ping or uncovered zones (
).
In the pyramid tracing scheme, triangular beams are generated at the sound
source, as shown in
. The central axis of each pyramid is traced being specu-
larly reflected when it hits on a surface. The three corners of the pyramid follow
the axis, being reflected from the same plane where it hits (see
).
Fig. 3. Comparison between cone tracing and pyramid tracing
.
Fig. 4. Schematic representation of the pyramid tracing model (DISIPAYR
)
H. Hossam El Dien, P. Woloszyn / Applied Acoustics 66 (2005) 533–551
537
One of pyramid tracing models, DISIAPYR
, is used to simulate the acoustical
environment. This algorithm allows the simulation of outdoor sound propagation
with a complex urban form and the evaluation of sound passing through insulated
panels, taking into account the edge diffraction over the boundaries, the shielding ef-
fects, the excess attenuation, the scattering of sound from the finite surfaces edges,
and the surface diffusion coefficient
Using the programs CITYMAP
and Source Manager
, an infinite line
source was simulated with 2.00 m between its point sources. The sound pressure level
was calculated through 3000 reception points over the balcony back wall. The system
of simulation is fully described in
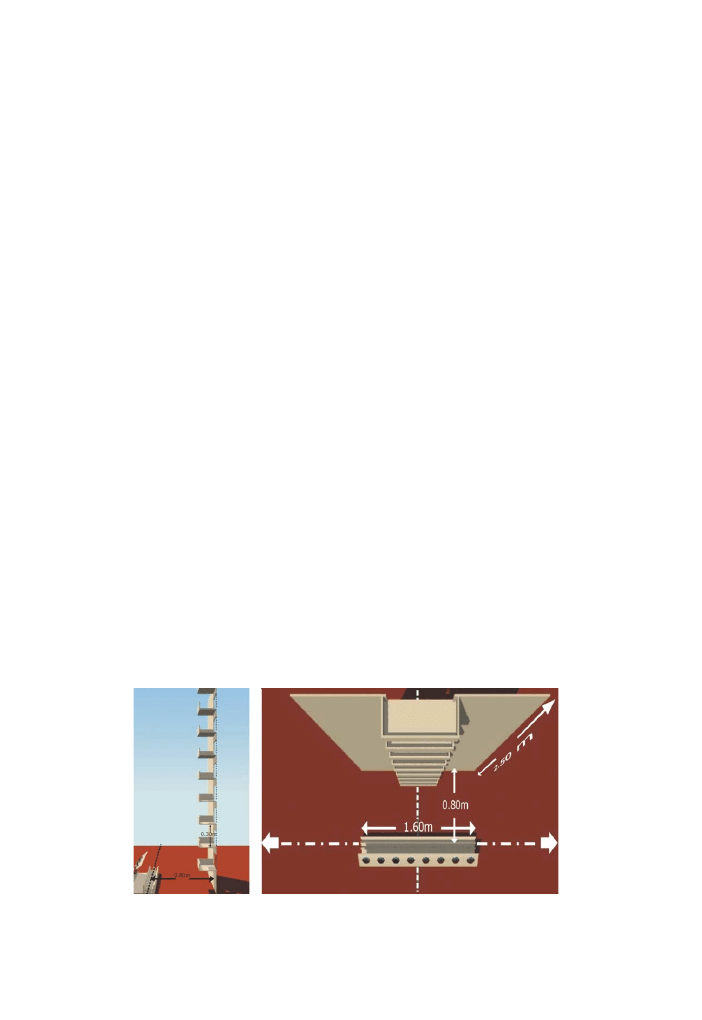
4. Experimental model
4.1. Scale model
A 1:10 scale model of building fac¸ade with 2.50 m height and 1.60 m length (
) was carried out. The building fac¸ade was simulated by varnished wood (absorp-
tion coefficient a = 0.07 at 1 kHz) in order to satisfy the laws of acoustic similarity
for the sound absorption by the building fac¸ade. The road is simulated by a reflecting
surface (PVC tiles over concrete floor).
4.2. Line sound source
As shown in
, a line source was simulated with 8 tweeters AUDAX (TW
034X0), filtered to obtain a frequency response from 1.6 to 25 kHz. The source
has also been weighted by a full-size equivalent normalised traffic noise spectrum
according to the French standard NF EN 1793-3 (1997). The tweeters were directed
towards a quadratic residue diffusor in order to provide a quasi quarter-cylindrical
propagation in front of the building facade.
Fig. 5. Scale model dimensions.
538
H. Hossam El Dien, P. Woloszyn / Applied Acoustics 66 (2005) 533–551
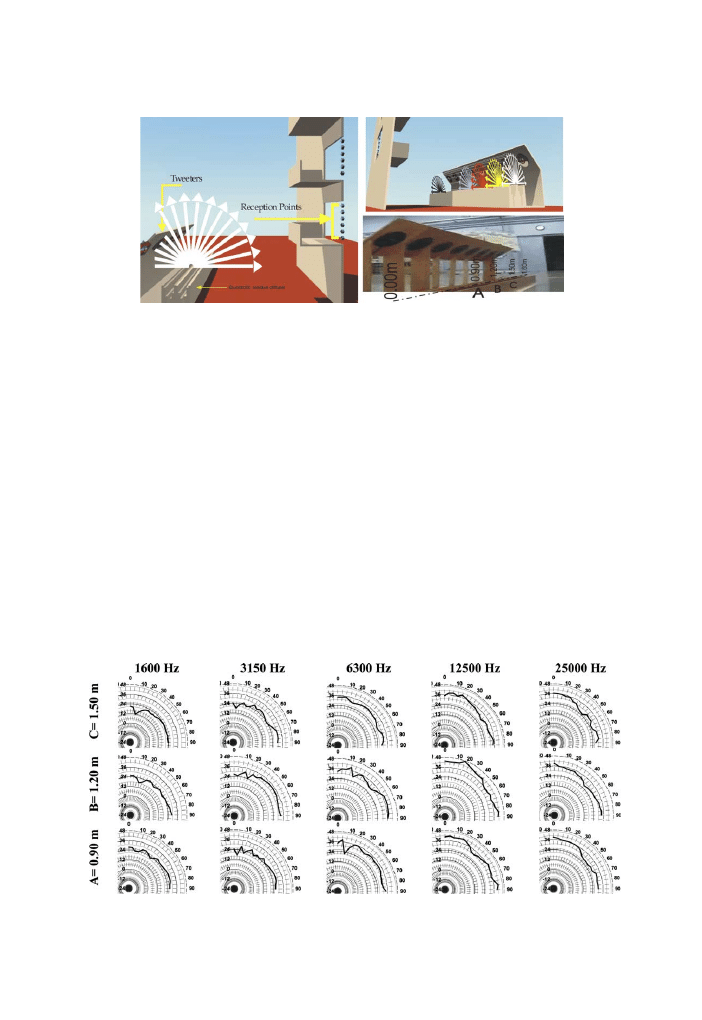
The tweeters were fixed in a varnished wooden frame with 1.60 m length and the
distance between the tweeters centers is 0.20 m, corresponding to the full scale model
(16.00 m line source with 2.00 m between its points).
By this diffusing system based upon Schro¨ders quadratic residue diffusor mode-
ling
, the line source directivity (
) is made quasi-uniform in the aperture an-
gle of interest (from 40
to 80). The line source directivity measurements were made
using a 1/4
00
microphone Larson Davis type 2530. The sequence of the quadratic res-
idue diffusor is calculated following the Schro¨ders modulo formula
and with
1.60 m length, 0.14 m height, and 0.11 m width.
4.3. Acquisition system
As shown in
, the experimental results were obtained using a measurement
exploiting maximum-length sequence stimulus (MLS). The A-weighted sound pres-
sure levels are measured with a 1/2 inch free field microphone (GRAS – type 40 AE)
Fig. 6. Line source with a quadratic residue diffusor.
Fig. 7. Line source directivity measurements at A, B, and C sections.
H. Hossam El Dien, P. Woloszyn / Applied Acoustics 66 (2005) 533–551
539
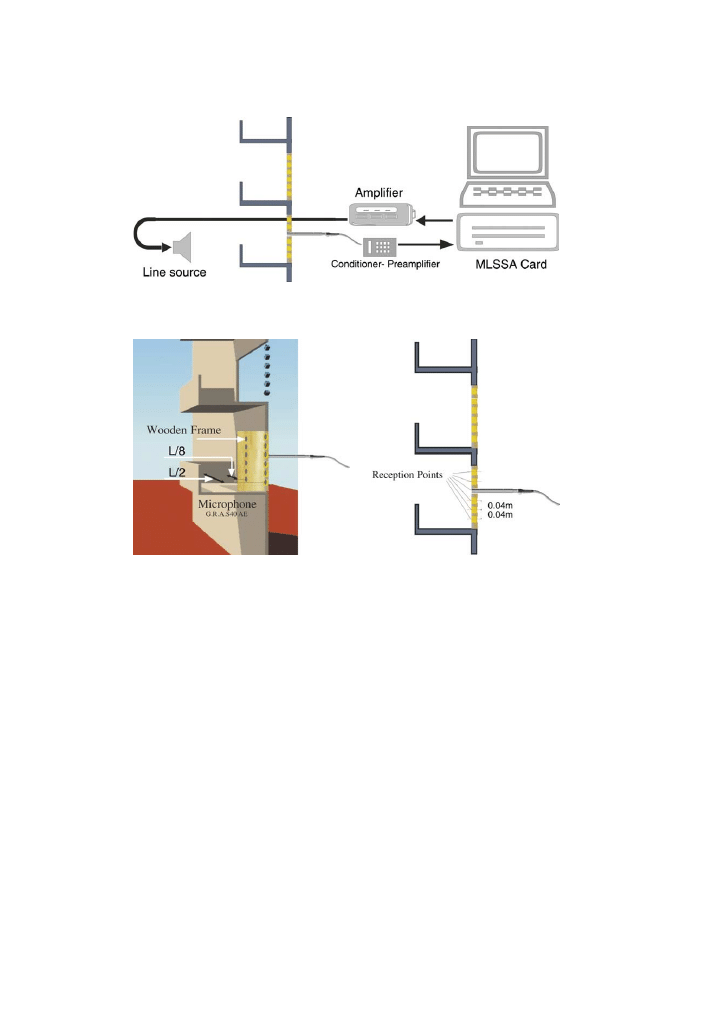
connected to a MLSSA card via a preamplifier-conditioner (01dB – PRE12S). The
sound pressure level in A-weighted scale was calculated through 18 reception points
(
) over the balcony back wall (6 points at the centre and 6 points at every side
with a horizontal distance equal to L/8 from parapet side). The finite size of the
microphone diaphragm means that, in the full scale every point covers 0.0156 m
2
area (microphone area in full scale) and represents the average of 5 measurements
at the numerical model. The effects due to directivity of the microphone have not
been considered in the analysis since the changes in the incidence angle due to bal-
cony modifications were small.
5. Results and discussion
5.1. Balcony width (W)
Firstly, the average of measured reduction are obtained (by 3000 reception points)
and compared with the average of predicted reduction (by 18 reception points).
Fig. 8. Schematic representation of measurement system.
Fig. 9. Reception points and microphone position.
540
H. Hossam El Dien, P. Woloszyn / Applied Acoustics 66 (2005) 533–551
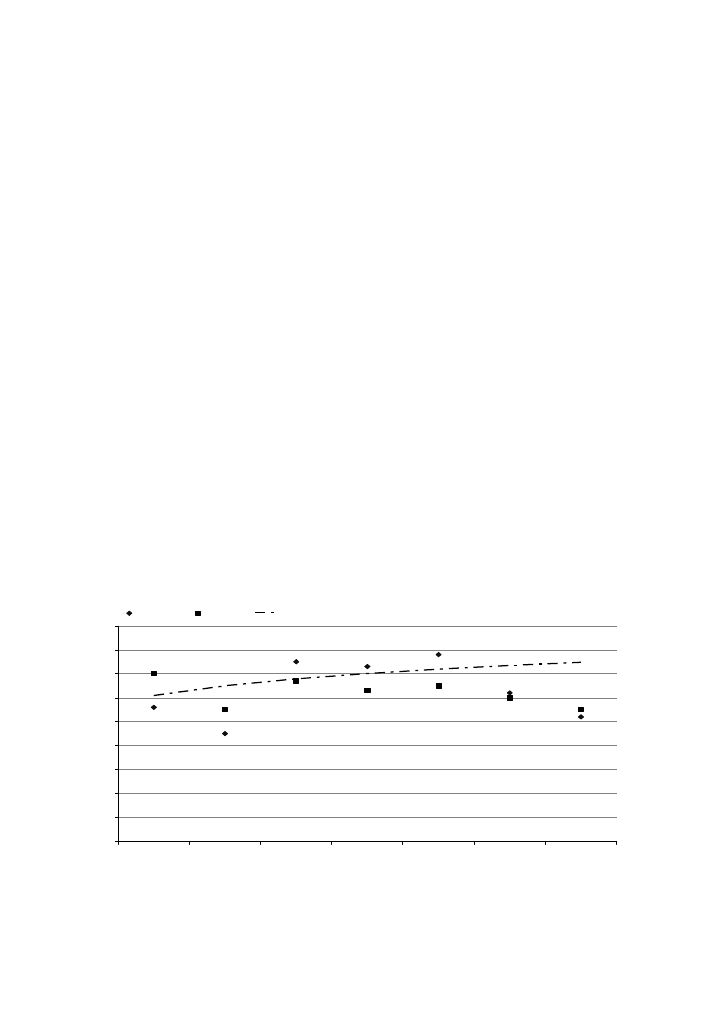
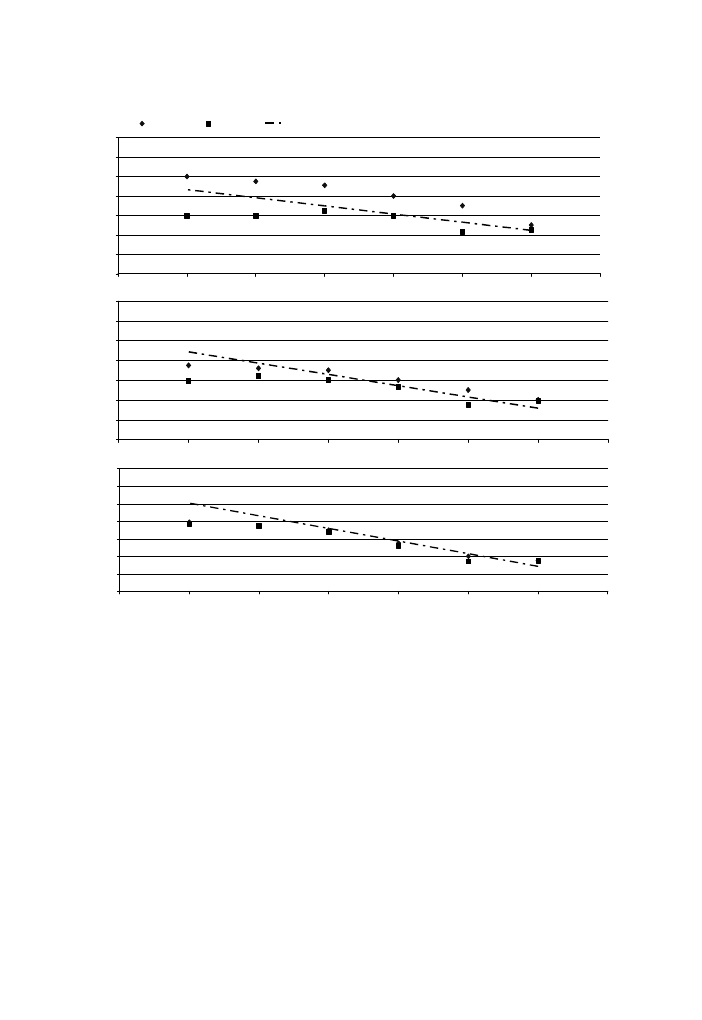
In
we present the reduction average in SPL as a function of building
floor level for a 1 m-balcony depth. It has been noted that predicted reduction
average is often greater than the measured one, with differences range between
0.5 and 1.5 dB(A). Balconies at high floors can give better reduction than those
at lower floors. This is due to the fact that receiver is subjected to strong direct
and diffracted components at lower floors and the path deference of the diffracted
and direct rays increases relatively with the balcony height. Generally, reduction
average increases with floor level and can be calculated by the following empirical
equation:
R
1m
¼ LnðN Þ þ 5:4 dBðAÞ;
ð3Þ
where N is floor level (N = 2,3, . . . ,8).
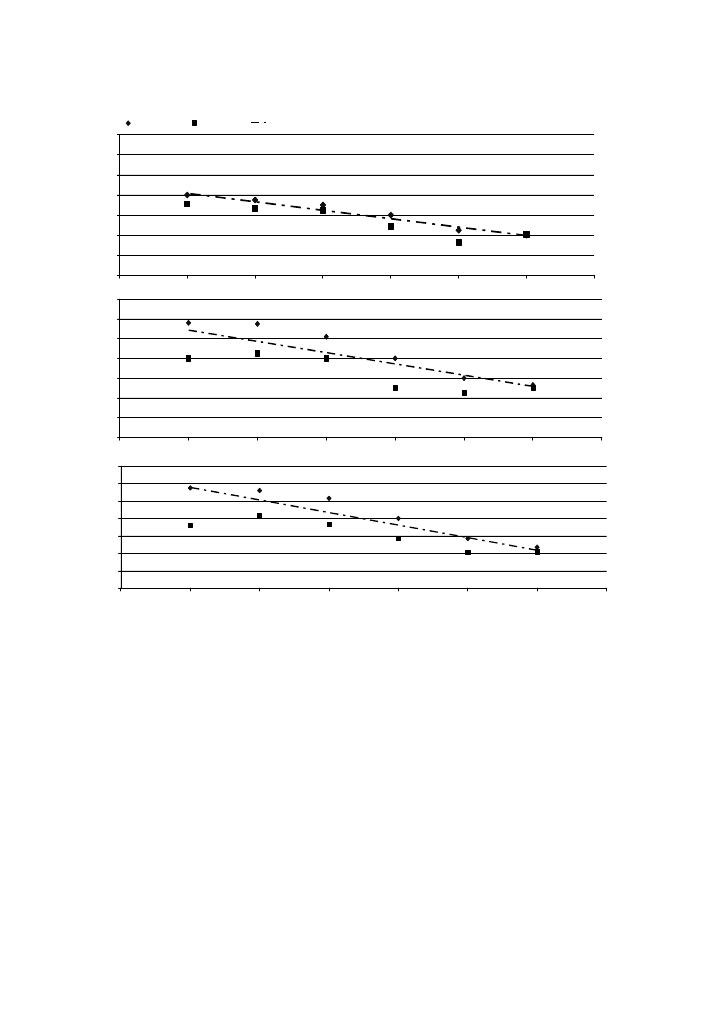
At the second step, the measurements protection levels are obtained at the centre
of a balcony back wall and compared with the predicted protection levels at the same
assessment points.
displays the measured and the predicted protection results for a 1 m-bal-
cony depth at the centre of its back wall. These figures demonstrate that protection
levels values at lower points are greater than those of higher points. This is due to the
location of those points at the shadow zone and the sound reflection from balcony
ceiling at the highest reception points.
From the prediction results and by using the least-square method (or regression
model), we found that the protection level values obtained by these configurations
can be calculated according to the following linear equation and with correlation
coefficient R = 0.87:
L
1m
ðhÞ
¼ 0:50N ðh 1Þ 6:80h þ 15 dBðAÞ;
ð4Þ
0
1
2
3
4
5
6
7
8
9
2nd
3rd
4th
5th
6th
7th
8th
Floor level
Average of reduction in SPL dB(A)
1m-Sim
1m-Exp
1m/ Em-Eq.
Fig. 10. Reduction average for a 1 m-balcony depth,
¤ simulation results, n measurement results, and –Æ–
empirical equation results.
H. Hossam El Dien, P. Woloszyn / Applied Acoustics 66 (2005) 533–551
541
where h represents the height of reception points above the balcony floor, and N is
the floor level (N = 2, 3, . . . ,8).
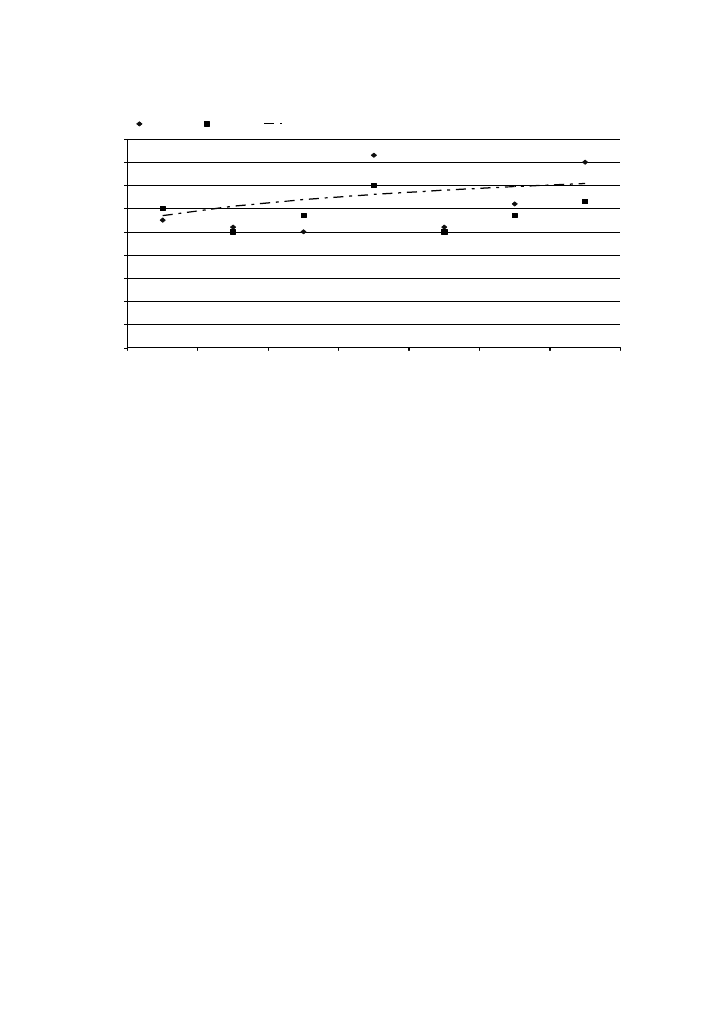
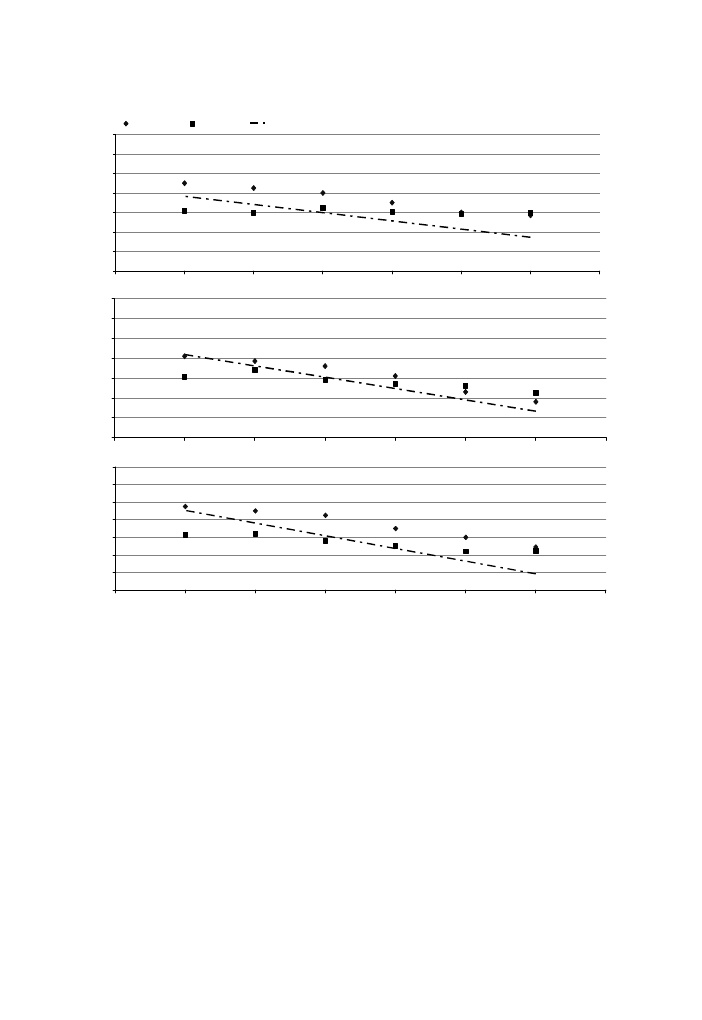
As demonstrated in
, the average reduction in sound pressure level for a 2
m-balcony depth ranges between 5 and 8 dB(A), while the difference between the
measured and predicted results is between 0.5 and 2 dB(A).
The average reduction obtained by this configuration is lower than that ob-
tained by a 1 m-balcony depth and this is due to the increase of ceilings reflected
surfaces.
As the previous configuration, it is found that the average reduction increases
with floor level and can be calculated by the following empirical equation:
R
2m
¼ LnðN Þ þ 5:0 dBðAÞ;
ð5Þ
where N is floor level (N = 2, 3, . . . ,8).
0
2
4
6
8
10
12
14
0
2
4
6
8
10
12
14
Protection Level L
w
- dB(A)
0
2
4
6
8
10
12
14
0
0.3
0.6
0.9
1.2
1.5
1.8
2.1
0
0.3
0.6
0.9
1.2
1.5
1.8
2.1
0
0.3
0.6
0.9
1.2
1.5
1.8
2.1
Height above balcony floor-m
Sim
Exp
Em. Eq.
(a)
(b)
(c)
Fig. 11. Protection level for a 1 m-balcony depth at the centre of its back wall,
¤ simulation results, n
measurement results, and –Æ– empirical equation results for the (a) 8th, (b) 6th, and (c) 4th floors.
542
H. Hossam El Dien, P. Woloszyn / Applied Acoustics 66 (2005) 533–551
In
, we can notice that the difference between the measured and predicted
protection levels provided by this configuration is almost negligible at the 4th floor
(
(c)) while it is between 0.5 and 2 dB(A) at the 8th and the 6th floors (
(a) and (b)).
Generally, it is found that the protection is 1.5 dB(A) less than that offered by the
previous type and can be calculated according to a linear empirical equation with
correlation coefficient R = 0.81
L
2m
ðhÞ
¼ 0:50N ðh 1Þ 6:80h þ 13:5 dBðAÞ;
ð6Þ
where h represents the height of reception points above the balcony floor, and N is
the floor level (N = 2, 3, . . . ,8).
In
, we show the reduction average provided by a 3 m-balcony depth. It is
obvious that the average reduction decreases (from 4 to 8 dB(A)). This is mainly due
to the increase in reflecting and diffracting surfaces (Ceiling, floor, and parapet) than
the previous types.
Following these results, we found that the average of reduction obtained by a 3 m-
balcony depth can be calculated by the following empirical equation:
R
2m
¼ LnðN Þ þ 4:6 dBðAÞ;
ð7Þ
where N is floor level (N = 2, 3, . . . ,8).
demonstrates that the differences between the measured and predicted pro-
tection levels provided by this type of balconies are approximately negligible for the
most of reception points.
0
1
2
3
4
5
6
7
8
9
2nd
3rd
4th
5th
6th
7th
8th
Floor level
Average of reduction in SPL dB(A)
2m / Sim
2m / Exp
2m / Em-Eq.
Fig. 12. Average reduction for a 2 m-balcony depth,
¤ simulation results, n measurements results, and –Æ–
empirical equation results.
H. Hossam El Dien, P. Woloszyn / Applied Acoustics 66 (2005) 533–551
543
Generally, the protection level values is less than the 1 m balcony depth by 3
dB(A) and can be also calculated following a linear empirical equation with correla-
tion coefficient R = 0.75:
L
3m
ðhÞ
¼ 0:50N ðh 1Þ 6:80h þ 12 dBðAÞ;
ð8Þ
where h represents the height of reception points above the balcony floor, and N is
the floor level (N = 2, 3, . . . ,8).
Eqs.
, show that the reduction average obtained by balconies with
1, 2, and 3 m depths can be calculated by an empirical equation and as a function of
geometrical parameters
0
2
4
6
8
10
12
14
0
2
4
6
8
10
12
14
Protection Level L
w
- dB(A)
0
2
4
6
8
10
12
14
0
0.3
0.6
0.9
1.2
1.5
1.8
2.1
0
0.3
0.6
0.9
1.2
1.5
1.8
2.1
0
0.3
0.6
0.9
1.2
1.5
1.8
2.1
Height above balcony floor - m
Sim
Exp
Em. Eq.
(a)
(b)
(c)
Fig. 13. Protection level for a 2 m-balcony depth at the centre of its back wall,
¤ simulation results, n
measurements results, and –Æ– empirical equation results for the (a) 8th, (b) 6th, and (c) 4th floors.
544
H. Hossam El Dien, P. Woloszyn / Applied Acoustics 66 (2005) 533–551
R
w
¼ LnðN Þ 0:4W þ 5:8 dBðAÞ;
ð9Þ
where N is floor level (N = 2, 3, . . . ,8), and W is the balcony depth (W = 1, 2, and 3 m).
Furthermore, Eqs.
leads to calculate the protection level at the
centre of the balcony back wall by an empirical equation and also as a function of
geometrical parameters
L
w
ðhÞ
¼ 0:50N ðh 1Þ 6:80h 1:50W þ 16:50 dBðAÞ;
ð10Þ
where h represents the height of reception points above the balcony floor, and N is
the floor level (N = 2, 3, . . . ,8).
5.2. Balcony inclined parapet (b)
The second set of results concerns the effect of a balcony with an inclined parapet.
Two inclined angles are tested (b = 15
and 30).
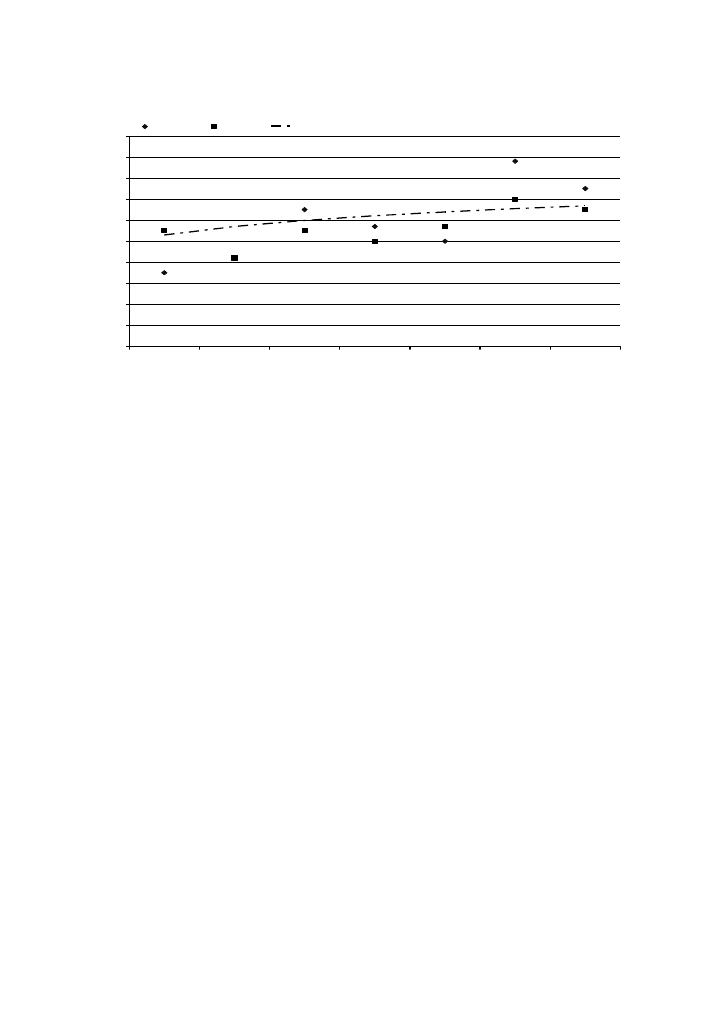
presents the reduction aver-
age obtained from that configuration and for a 1 m-balcony depth. We can notice
that the inclined parapet with 15
is more effective at higher floor levels where we
can gain an additional reduction (from 0.5 to 2 dB(A)).
displays the protection level as a function of the reception point heights at
the centre of balcony back wall at the 8th floor and for an angle (b = 30
) corre-
sponding to the maximum effect. It demonstrates that the protection levels at higher
points are greater than those at the lower points. This is due to the increase of sha-
dow zone as explained in Section 2.
For the 2 m-balcony depth, the average reduction is greater than that obtained
with 1 m depth, and the inclined angle (b = 30
) is more effective at the higher levels.
0
1
2
3
4
5
6
7
8
9
10
2nd
3rd
4th
5th
6th
7th
8th
Floor level
Average of reduction in SPL dB(A)
3m-Sim
3m-Exp
3m / Em-Eq.
Fig. 14. Reduction average for a 3 m-balcony depth,
¤ simulation results, n measurements results, and –Æ–
empirical equation results.
H. Hossam El Dien, P. Woloszyn / Applied Acoustics 66 (2005) 533–551
545
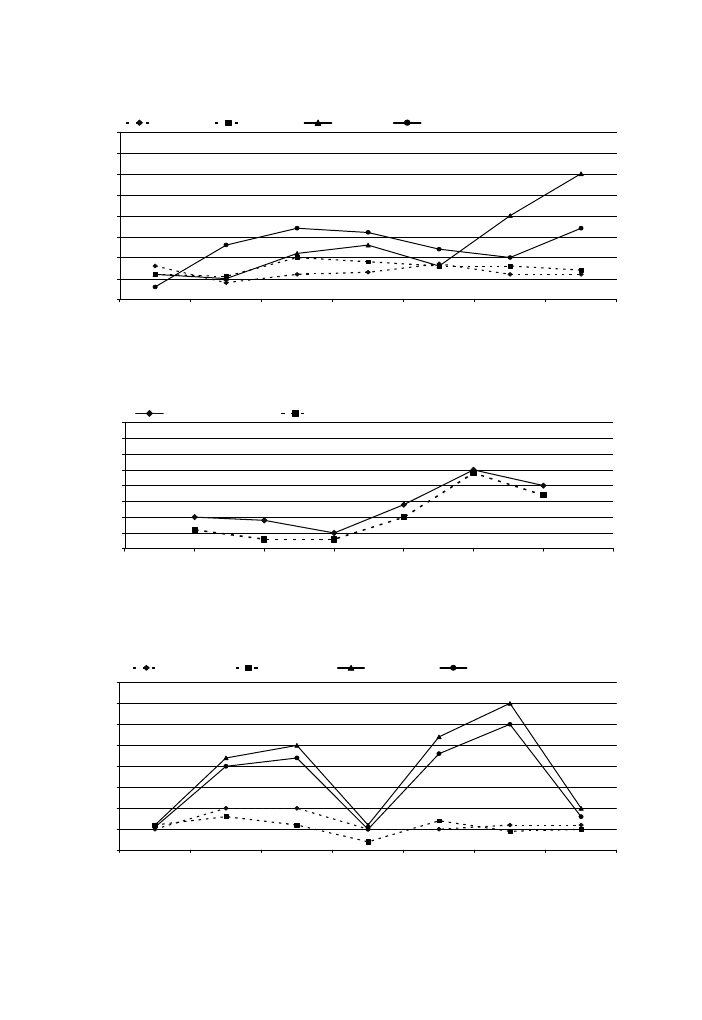
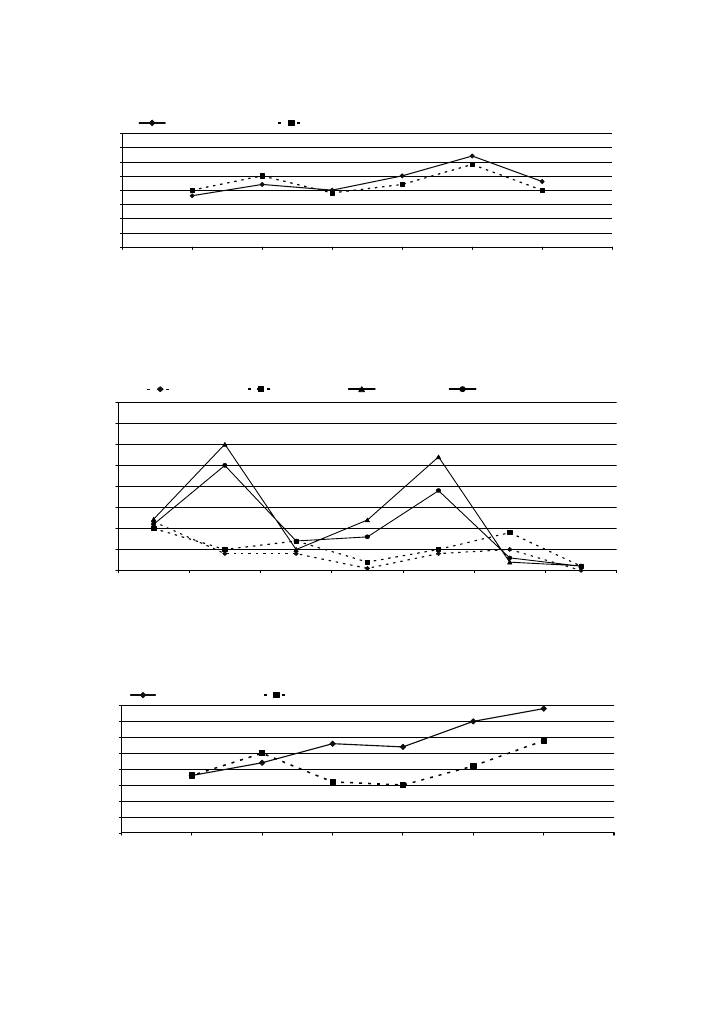
In
, we can notice that of the average reductions are divided into two se-
quences: The first is located from the 2nd to the 5th floors, and the second is located
from the 5th to the 8th floors.
As shown in
, the negative effect of the balcony ceiling and balcony floor
appears clearly at the 5th floor, where the ceiling and floor reflection surfaces are
greater than those at the 4th and 6th floors. This effect causes a lower reduction
at the lower reception points at the 4th floor, and at the majority of reception points
at the 5th floor (this cause the dip in the average reduction at the 5th floor). On the
other hand the reflected floor surfaces are negligible from the 6th floor because the
ceiling surfaces are totally screened by the parapet form. This explains the dip in
average reduction at the 5th floor.
0
2
4
6
8
10
12
14
0
2
4
6
8
10
12
14
Protection Level L
w
- dB(A)
0
2
4
6
8
10
12
14
0
0.3
0.6
0.9
1.2
1.5
1.8
2.1
0
0.3
0.6
0.9
1.2
1.5
1.8
2.1
0
0.3
0.6
0.9
1.2
1.5
1.8
2.1
Height above balcony floor - m
Sim
Exp
Em. Eq.
(a)
(b)
(c)
Fig. 15. Protection level for a 3 m-balcony depth at the centre of its back wall,
¤ simulation results,
n
measurements results, and –Æ– empirical equation results for the (a) 8th, (b) 6th, and (c) 4th
floors.
546
H. Hossam El Dien, P. Woloszyn / Applied Acoustics 66 (2005) 533–551
0
0.5
1
1.5
2
2.5
3
3.5
4
2nd
3rd
5th
6th
7th
8th
Floor level
Average of reduction in SPL dB(A)
Sim / ß=15˚
Exp / ß=15˚
Sim / ß=30˚
Exp / ß=30˚
4th
Fig. 16. Average reduction provided by inclined parapets (b = 15
and 30) for a 1 m-balcony depth, (Sim)
simulation results, and (Exp) measurements results.
0
0.5
1
1.5
2
2.5
3
3.5
4
0
0.3
0.6
0.9
1.2
1.5
1.8
2.1
Height above balcony floor- m
Protection Level L
ß
- dB(A)
Sim / ß=30˚
Exp / ß=30˚
Fig. 17. Protection level provided by an inclined parapet (b = 30
) for a balcony with 1 m and at the centre
of its back wall (8th floor),
¤ straight line represents the simulation results, n dashed line represents the
measurements results.
0
0.5
1
1.5
2
2.5
3
3.5
4
2nd
3rd
4th
5th
6th
7th
8th
Floor level
Average of reduction in SPL dB(A)
Sim / ß=15˚
Exp / ß=15˚
Sim / ß=30˚
Exp / ß=30˚
Fig. 18. Average reduction average provided by inclined parapets (b = 15
and 30) for a 2 m-balcony
depth, (Sim) simulation results, and (Exp) measurements results.
H. Hossam El Dien, P. Woloszyn / Applied Acoustics 66 (2005) 533–551
547
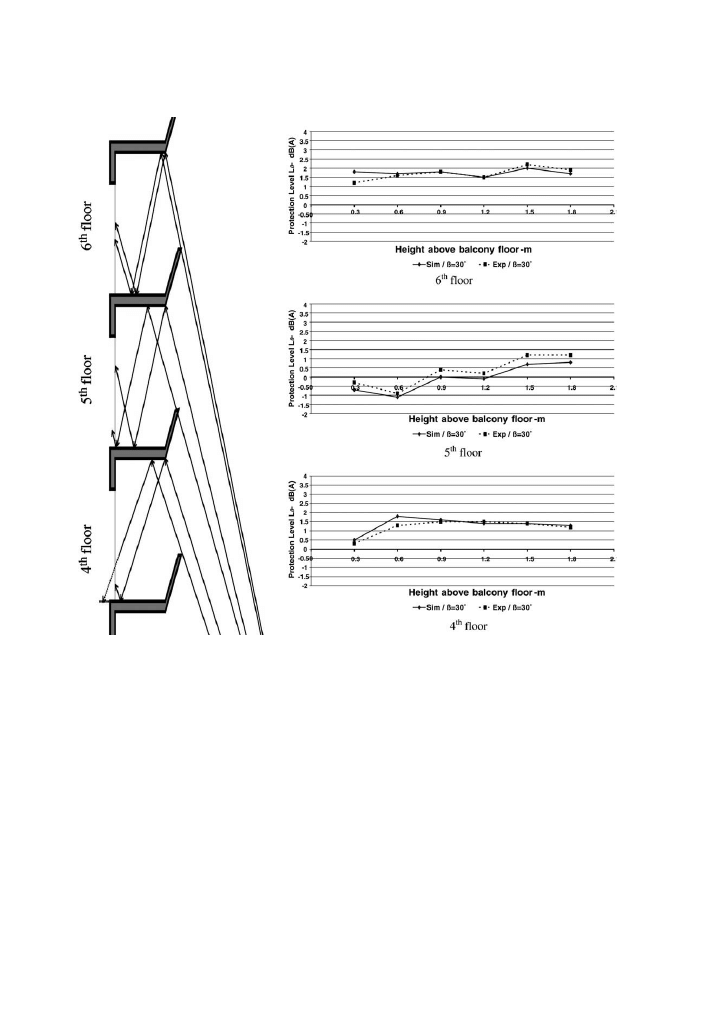
The maximum protection from inclined balconies is at the 7th floor where 3.5
dB(A) additional protection is obtained. As shown in
, the higher points
are more protected, and there is a good agreement between the measured and the
predicted protection level values.
For the 3 m-balcony depth, the inclined angle (b = 30
) is more effective than the
inclined angle (b = 15
).
As the previous type, the average reductions are divided into two sequences: The
first is located from the 2nd to the 5th floors/The maximum reduction is at the 3rd
floor and the minimum reduction is at the 4th and 5th floors. The second sequence of
values is between the 5th and 8th floors (see
demonstrates that the higher reception points are more protected at the
3rd floor corresponding to the maximum protection level for that configuration
(3.0 dB(A)).
Fig. 19. Floors and ceiling reflection effects at the 4th, 5th, and 6th floors for a 2 m-balcony depth with
inclined parapet (b = 30
).
548
H. Hossam El Dien, P. Woloszyn / Applied Acoustics 66 (2005) 533–551
0
0.5
1
1.5
2
2.5
3
3.5
4
0
0.3
0.6
0.9
1.2
1.5
1.8
2.1
Height above balcony floor - m
Protection Level L
ß
- dB(A)
Sim / ß=30˚
Exp / ß=30˚
Fig. 20. Protection level provided by an inclined parapet (b = 30
) for a balcony with 2 m and at the centre
of its back wall (7th floor),
¤ straight line represents the simulation results, n dashed line represents the
measurements results.
0
0.5
1
1.5
2
2.5
3
3.5
4
2nd
3rd
4th
5th
6th
7th
8th
Floor level
Average of reduction in SPL dB(A)
Sim / ß=15˚
Exp / ß=15˚
Sim / ß=30˚
Exp / ß=30˚
Fig. 21. Reduction average provided by inclined parapets (b = 15
and 30) for a 3 m balcony 3 m depth,
(Sim) simulation results, and (Exp) measurements results.
0
0.5
1
1.5
2
2.5
3
3.5
4
0
0.3
0.6
0.9
1.2
1.5
1.8
2.1
Height above balcony floor- m
Protection Level L
β
- dB(A)
Sim / ß=30˚
Exp / ß=30˚
Fig. 22. Protection level provided by an inclined parapet (b = 30
) for a balcony with 3 m and at the centre
of its back wall (3rd floor),
¤ straight line represents the simulation results, n dashed line represents the
measurements results.
H. Hossam El Dien, P. Woloszyn / Applied Acoustics 66 (2005) 533–551
549

6. Conclusion
Experimental measurements and numerical simulations have been used to eval-
uate the acoustical influence of balcony projection depth and parapet. The concept
of protection level has been used to quantify the noise reduction effect due to these
configurations. Projection depths provide average reductions between 4 and 8
dB(A) and inclined parapets provide additional reduction values between 0.5 and
4 dB(A), with differences of between 0.5 and 2 dB(A) between the measured and
predicted results.
Compared with the other results [4, 5 and 6], the reduction obtained by inclined
parapets is approximately equivalent to that obtained by insulation treatments. Fur-
thermore, the empirical equations have been derived to provide a simple prediction
of protection level over the building fac¸ade for proposed conditions. Hence the re-
sults of this investigation will hopefully provide practical information to the architect
who wishes to design self-protected facades with respect to the external acoustic envi-
ronment. Furthermore, it will be seen that a slight modification of existing building
envelope design can provide additional sound protection without compromising
other environmental requirements.
References
[1] Calarco A, Tripodi D. Passive acoustic requirements of buildings. In: 7th REHVA world congress,
Naples; 2001.
[2] Hossam El-dien H, Woloszyn Ph. Prediction of the sound field into high-rise building facades due to
its balcony ceiling form. Appl Acoust 2004;65/4:431–40.
[3] Mohsen EA, Oldham DJ. Traffic noise reduction due to the screening effect of balconies on a building
fac¸ade. Appl Acoust 1977;10:243–57.
[4] May DN. Freeway noise and high-rise balconies. J Acoust Soc Am 1979;65(3):699–704.
[5] Hothersall DC, Horoshenkov KV, Mercy SE. Numerical modelling of the sound field near a tall
building with balconies near a road. J Sound Vib 1996;198(4):507–15.
[6] Hammad RNS, Gibbs BM. The acoustic performance of building facades in hot climates: Part2 –
closed balconies. Appl Acoust 1983;16/2:441–54.
[7] Hossam El-dien H. Acoustic performance of high-rise building facades due to its balconies form. In:
Fifth European conference on noise control, Naples. Euronoise 2003.
[8] Hossam El-dien H, Woloszyn Ph. Balcony form; an approach to reduce sound pressure level into the
building fac¸ade. In: Third international conference on modelling and experimental measurements in
acoustics, Cadiz. Acoustics 2003; 349–58.
[9] Hossam El-dien H. Forme architecturale; une approche de protection sonore (Application a` la forme
du balcon). 2e`me Journe´es GDR, Marseille; 2004.
[10] Hossam El-dien H, Woloszyn Ph. Acoustical effect evaluation of balconies ceiling form in protecting
building facades against traffic noise. In: CIB-2004 world building congress, Toronto; 2004.
[11] Method for the calculation of the absorption of sound by the atmosphere, Proposed ANSI standard
S1 26/ASA23; 1978.
[12] Farina A. Validation of the Pyramid Tracing algorithm for sound prediction outdoors: comparison
with experimental measurements and with the ISO/DIS 9613 standards. Adv Eng Software 2000;31/
4:241–50.
[13] Naylor GM. ODEON-Another hybrid room acoustical model. Appl Acoust 1993;38:131.
[14] Maercke D, van Martin J. The prediction of echograms and impulse responses within the Epidaure
software. Appl Acoust 1993;38:93.
550
H. Hossam El Dien, P. Woloszyn / Applied Acoustics 66 (2005) 533–551

[15] Farina A. Modeli numerici per il rumore de traffico stradale e ferroviario in aree urbane. In: Atti del
Convegno Rumore? Ci stiamo muovendo – Secondo seminario sullInquinamento Acustico, Rome;
1998. p. 26–7.
[16] Farina A, Brero G. Computer code based on experimental results for acoustical mapping of urban
areas. In: Proceedings of the noise and planning, Pisa; 1996.
[17] Schro¨eder MR. Binaural dissimilarity and optimum ceiling for concert halls: more lateral sound
diffusion. J Acoust Soc Am 1979;65.
H. Hossam El Dien, P. Woloszyn / Applied Acoustics 66 (2005) 533–551
551
Document Outline
Wyszukiwarka
Podobne podstrony:
84 1199 1208 The Influence of Steel Grade and Steel Hardness on Tool Life When Milling
The influence of British imperialism and racism on relationships to Indians
Howard, Robert E El Borak The Lost Valley of Iskander
The?onomic Emergence of China, Japan and Vietnam
Nukariya; Religion Of The Samurai Study Of Zen Philosophy And Discipline In China And Japan
Robert Stevenson The Strange Case of Dr Jekyll and Mr Hyde
AN Increased Osteoprotegerin Serum Release Characterizes The Early Onset of Diabetes Mellitus and Ma
The United Kingdom of Great Britain and Northern Ireland
Goel, Dolan The Functional anatomy of H segregating cognitive and affective components
01 Aramaic (The Ancient Languages of Syria Palestine and Arabia)
Influence of extraction parameters and medium on efficiency
The New Age of Russia Occult and Esoteric Dimensions ed by B Menzel & M Hagemeister & BG Rosenthal
Dr Gary L Glum Calling Of An Angel The True Story Of Rene Caisse And An Indian Herbal Medicine Cal
Ecumeny and Law 2015 Vol 3 Welfare of the Child Welfare of Family Church and Society
Nazi Spatial Theory; The Dark Geographies of Carl Schmitt and Walter Christaller
Julius Fast The Body Language of Sex, Power, and Aggression
więcej podobnych podstron