
The economics of short rotation coppice in Germany
Rouven Jonas Faasch, Genevieve Patenaude
School of Geosciences, The University of Edinburgh, Drummond Street, Edinburgh EH8 9XP, UK
a r t i c l e i n f o
Article history:
Received 4 January 2012
Received in revised form
27 March 2012
Accepted 9 April 2012
Available online 3 July 2012
Keywords:
Short rotation coppice
Germany
Economics
Poplar
Willow
Energy crops
a b s t r a c t
Short Rotation Coppice (SRC), which entails managing wood plantations as perennial
energy crops on agricultural land, has the potential to contribute significant amounts of
wooden biomass to Europe’s energy mix. Yet, uncertainty prevails about the future of key
economic variables determining the viability of SRC cultivations. Consequently, agricul-
turists face challenges when conducting ex-ante economic analyses of SRC projects and
measuring performance against the alternative, agricultural crops. This paper scrutinises
five key determinants of SRC economic viability: yield level, woodchip market price,
subsidies, cost level and opportunity costs for conventional agricultural crops. By utilising
site-specific conditions and different future scenarios we provide a comprehensive
economic appraisal of SRC plantations for agriculturists. We focus our analysis on
Germany. Our results show that SRC plantations are less profitable under the medium
scenario when compared with agricultural crops. Notwithstanding, favourable political
and economic conditions such as subsidies, lower costs and higher woodchip prices can
lead to SRC’s superior profitability. If the German government is serious about improving
investments conditions for commercial SRC plantations, we recommend introducing
sufficient, efficient and consistent subsidies.
ª 2012 Elsevier Ltd. All rights reserved.
1.
Introduction
Europe faces the threefold challenge of meeting increasing
energy demands while reducing its dependency on fossil fuels
and mitigating climate change. To effectively address these
challenges, the European Union (EU) aims to support the
development of renewable energy sources. This is embodied
in Directive 2009/29/EC, which states that at least 20% of total
energy consumption should be met by renewables by 2020.
(10% in the transport sector)
.
This target still requires ample efforts from Member States.
In 2009, only 9% of EU’s gross inland energy consumption was
from renewable sources, of which biomass contributed the
largest share (68.6%)
. Given its high-energy content and
versatile use for electricity and heat generation, wood is
a preferred source of biomass. Most wooden biomass is
sourced from conventional forestry or directly derived from
existing wood residues or industrial by-products.
An alternative option for wood biomass sourcing is Short
Rotation Coppice (SRC). This entails managing wood planta-
tions as perennial energy crops. Common plants suitable for
SRC include poplar (populus spp.), willow (salix ssp.) and mis-
canthus (miscanthus spp.). These are planted on agricultural
land and harvested in 2
e5-year rotation cycles. The total
operation length varies between 20 and 30 years concluding
with a re-cultivation of the planted land
. SRC offers
a number of advantages relative to competing agricultural
crops: it requires less operational efforts; provides soil
protection against wind and water erosion; limits nutrient
leaching and requires reduced fertilisation. As a result, it has
* Corresponding author. The University of Edinburgh, School of Geosciences, Rottha¨user Weg 18a, Du¨sseldorf 40629, NRW, Germany.
Tel.:
þ49 177 560290; fax: þ49 211 5235100.
E-mail address:
(R.J. Faasch).
Available online at
http://www.elsevier.com/locate/biombioe
b i o m a s s a n d b i o e n e r g y 4 5 ( 2 0 1 2 ) 2 7
0961-9534/$
e see front matter ª 2012 Elsevier Ltd. All rights reserved.

been argued that SRC improves the sustainability of agricul-
tural production
.
Despite these advantages, plantations managed under SRC
are still marginal in Europe. Sweden is the largest SRC oper-
ator (16,000 ha) followed by Poland (9000 ha), UK (6000 ha),
Italy (5000 ha), Germany (5000 ha) and France (3000 ha)
. The
lack of commercially driven SRC establishment is partially due
to operators seldom achieving economically attractive yield
levels under current woodchip prices
Furthermore, much uncertainty prevails about the future
of key economic variables determining the viability of SRC
cultivations, such as woodchip prices or subsidies. Conse-
quently, agriculturists face challenges when conducting ex-
ante economic analyses of SRC projects and measuring
performance against the alternative, annual agricultural
crops, with an investment horizon of one year or less
.
An additional merit of agricultural crop plantations in
contrast to SRC is that agriculturists can choose what crops to
grow from year to year based on their current market prices.
SRC sites as long-term investments limit the opportunity to
benefit from attractive agricultural crop prices.
Despite increased interest in SRC as a potentially viable
economic activity, the existing literature falls short of
providing reliable economic benchmarks for individual SRC
agriculturists. Below, we review existing literature along the
five key determinants of SRC economic viability: yield level,
woodchip market price, subsidies, cost level and opportunity
costs. This paper aims to enhance the assessment of these key
variables in order to facilitate a comprehensive economic
appraisal of the competitiveness of SRC. The applied meth-
odology considers site-specific conditions and conducts
scenario analysis.
We focus our SRC analysis on Germany. The reason for this
is that future political and economic developments are likely to
turn SRC operations more attractive: First, a governmental
scenarios analysis predicts that 450,000 ha could be planted
with SRC by 2020
. In order to achieve this, subsidies as well
as governmental funding to private research initiatives for SRC
might be necessary. In addition, increasing demand for wooden
biomass can be expected
. Finally, large energy suppliers
have recently started to develop commercial SRC projects as
a means to supply their combined heat and power plants.
In the following, the five key economic variables for SRC
operations will be introduced.
1.1.
Yield level
The yield level significantly affects revenues of SRC planta-
tions. Yield estimation depends on both managerial decisions
and site-specific conditions. To avoid destructive sampling,
empirical non-destructive SRC yield models are commonly
used
. Model design and application are however often
country-specific. For instance, Mola-Yudego & Aronsson’s
model
is based on a district-specific agro-climatic index in
Sweden and Evans et al.’s model
requires the provision of
UK grid references. In Germany, Wael
and Murach et al.
developed SRC yield estimators, yet these suffer from
a number of limitations for the applications considered in our
study. While Wael’s model is adapted for different poplar
genotypes, varying rotation lengths and site-specific data (soil
quality, temperature and water supply), it only generates yield
forecasts for the first harvest. The effect of increasing biomass
production levels in subsequent rotations as a result of
increased SRC rooting systems is neglected
. The same
shortcoming applies to Murach et al.’s model. In addition,
Murach et al.’s model exclusively forecasts yield depending on
available water supply while assuming site conditions and
genotype choice to be optimal.
In response to this, we propose a new yield estimator that
predicts long-term yield levels for three poplar and one willow
species in 3-year rotation cycles. Differing site conditions and
planting densities are integrated as parameters to the
estimator.
1
1.2.
Woodchips market price
The second key determinant impacting SRC revenue is
woodchips market price. Between 2003 and 2010, real wood-
chip prices in Germany have increased by 56% (from 14.9
V =MWh to 23.2 V =MWh). This is a result of soaring demand
and rising heating oil prices, advances in bioenergy technol-
ogies and political support for renewables. Price growth is
expected to continue, albeit at lower pace. This would imply
higher revenues for a given amount of produced biomass.
Agriculturists are moreover interested in price developments
of agricultural crops in relation to woodchip. The OECD and
FAO for instance expect cereal prices to decline until 2020
which would turn SCR sites economically more attractive
There is high uncertainty about both future woodchip and
agricultural crop prices: key forces driving price volatility
entail the evolution of the oil price, climate change legislation,
improvements in yield levels and the adaptation of agriculture
to climate change.
Despite the importance of woodchip and agricultural crop
price volatility on SRC profitability, this impact has not been
fully considered in the literature. In this study, woodchip
prices were forecasted based on different heating oil price
scenarios derived from the Energy Information Administra-
tion (EIA)
1.3.
Subsidies
The third determinant considered is subsidies for SRC plan-
tations. For instance, the Federal State of Saxony reimburses
up to 30% of initial SRC investments (expenditure related to
site preparation, cuttings plantation and fencing)
. The
Energy Crop Scheme in England provides a similar subsidy,
which covers 50% of all eligible SRC expenses
. Subsidies
can also be granted in the form of fixed area payments, as in
Sweden
. In this case, operators are given a payment per
hectare of planted SRC. Both subsidy designs and their impact
on SRC profitability are explored in this paper.
1.4.
Cost levels
Cost related estimates to SRC operations vary widely and are
not comprehensively reviewed in the literature. This creates
1
It should be noted that the estimator can also be applied in
countries outside Germany. This will be shown in 2.1.
b i o m a s s a n d b i o e n e r g y 4 5 ( 2 0 1 2 ) 2 7
28

risks of costs over or underestimation. In addition, cost levels
for SRC sites might alter in the future: an increasing number of
commercial plantations are likely to result in decreasing
planting and harvesting costs due to learning effects while
higher energy prices are likely to lift fertiliser and trans-
portation costs.
Hence, to provide a thorough picture, cost data was
retrieved from 14 recent sources to determine full costs. The
median, minimum and maximum values for all relevant cost
pools were derived from this compilation. Based on these, we
provide different cost scenarios and an assessment of their
impact on SRC profitability.
1.5.
Opportunity costs
Finally, the economic performance of SRC must be measured
against the main alternative investment: agricultural crops
. A benchmark annuity (annual gross margin) for agricul-
tural crops was therefore created for poor, medium and good
site conditions. This provides agriculturists with an approxi-
mate estimate of opportunity costs.
2.
Methodology
In the next sections, we present the methodology for assess-
ing the impact of the key determinants introduced above on
the economic viability of SRC. It should be noted that the yield
estimator is based on secondary field data from pilot projects
managed by SRC experts. The estimations should therefore be
considered as yield levels to be achieved under optimal
managerial decisions.
2.1.
Yield estimator
The estimator (a non-destructive statistical yield model ) forecasts
yield based on four key variable categories: species [poplar
and willow]; rotation sequence [3-year rotation cycles]; site
characteristics [average annual temperature (T ), average
annual precipitation (P), average water capacity (WC), capil-
lary moisture rise (CMR) and soil quality index (SQI)]
; and
plant densities (5000 to 20,000 cuttings per hectare). All data
are derived from SRC pilot projects in Germany.
2.1.1.
Data collection
Yield data were collected from 7 pilot sites derived from 4
studies. All sites and their respective conditions, planting
densities and planted clones are summarised in
. P
varies between 532 mm in Gu¨lzow and 820 mm in Krum-
menhennersdorf. Soil textures were predominantly sandy
loam explaining SQI values below 50. Solely Dornburg and
Mu¨hllheim have better soil qualities with SQIs of 60 and 81
respectively. The lowest and highest Ts are found in Krum-
menhennersdorf (7.2
C) and Mu¨hllheim (9.5
C). Planting
densities ranges from 6900 plants per hectare in Bad Salzun-
gen to 13,300 plants per hectare in Gu¨lzow and Vipperow. All
studies provide yield data for at least 2 consecutive harvests in
3-years rotation cycles.
2.1.2.
Categorising and constraining yields
The yield data was categorised along key yield determinants
as follows: Firstly, for all pilot sites the yield rates were cat-
egorised based on species composition and rotation sequence.
The considered species were P. trichocarpa x P. deltoids,
P. maximowiczii x P.nigra, P. maximowiczii x P. trichocarpa and S.
viminalis. As yield data were only available for up to 4 rotation
sequences (12 operation years in 3-years rotation cycles), we
assumed an average yield decrease by a factor 0.91 from the
5th to the 7th rotation
inclusively. From the 8th rotation,
yield further decreased by a factor 0.74. These factors were
derived from Kro¨ber et al.
Secondly, yields were further characterised with site-
specific biological and geographical conditions. A Site Suit-
ability Index (SSI) was developed. SSI considers temperature,
soil and rainfall water supply as well as soil quality (3).
Measures and units are as follows: average annual tempera-
ture (T in
C); average water capacity (WC in mm) and capil-
lary rising moisture rate (CRM in mm) are used to determine
the average water amount provided by the soil (W in mm);
average annual precipitation (P in mm) and Soil Quality Index
(SQI ) for the soil quality. T, W, P and SQI were each given
Table 1
e Overview pilot projects (P[Precipitation, T [ Temperature, SQI [ Site quality index, N[Number).
Source
Location
P
mm
T
C
SQI Plant density
(N/ha)
Selected poplar clones
Selected willow clones
Werner et al.
Dornburg
578
7.5
60
11,000
Unal, Raspalje, Beaupre´, Donk,
Androscoggin, Max
722/51
Langen
wetzendorf
650
8.8
42
11,000
Unal, Boelare, Beaupre´, Donk,
Androscoggin, Max
722/51
Bad Salzungen
586
8.1
32
6900
Androscoggin, Max, NE 42
Tora
Boelcke
Gu¨lzow
532
8.2
48
13,330
Rap, Max, 10/85
Zieverich, Ko¨nigshanfweide,
78-021, 78-101, 78-183, 57/57,
Bjo¨rn, Rapp, Ulv
Vipperow
640
8.0
30
13,330
Max
Weide 10
Grunert
Krummenhennersdorf
820
7.2
45
11,850
Max, Hybrid 275
Jorr
Maier & Vetter
Mu¨hllheim
650
9.5
81
10,000
Only species is defined
Only species is defined
2
In Germany, the unified index “Ackerzahl” (Soil Quality Index)
signifies the average soil quality of distinct arable lands. Deter-
mining the SQI is conducted by compounding soil texture,
productivity, geological origins, water supply and climatic
conditions.
3
5th rotation being from year 12
e15.
b i o m a s s a n d b i o e n e r g y 4 5 ( 2 0 1 2 ) 2 7
29

a weight of 25%. Total water supply therefore explains 50% of
SSI, a value consistent with Murach et al.
and Wael
.
For each variable (yield determinants), both a minimum and
maximum values were defined. If site values transgress these
boundaries, the set minimum or maximum value is assigned.
The computation of SSI (0
< SSI<10) for a rotation period t is
shown in
.
SSI
t
¼ 0:25 10
T
t
Min T
t
Max T
t
Min T
t
þ
W
t
Min W
t
Max W
t
Min W
t
þ
P
t
Min P
t
Max P
t
P
t
þ
SQI
t
Min SQI
t
Max SQI
t
Min SQI
t
(Form. 1)
Based on Landgraf, Johne & Ro¨hle
, DEFRA
and Wael
, the minimum and maximum values for the respective
yield determinants are as follows: 5
C
T 10
C ; 60mm
W
300 mm ; 400mm P 1000mm ; 20 SQI 60 .
A site with a T of 7.5
C, a W of 180 mm, a P of 700 mm and
a SQI of 40 would be classified as average with a SSI of 5. A
linear relation between yield and SSI is assumed
. An
increase in SSI from 5 to 10 for a given species and same
planting density would thus double the SRC yield.
Thirdly, consistent with Murach et al.
and Hartmann
, it was assumed that yield increases linearly by factor 1.5
when planting density doubles. Minimum and maximum
planting densities were set to 5000 and 20,000 plants per
hectare respectively. A crop shortfall rate of 6% was also
assumed
.
2.1.3.
Statistical testing
After categorising and constraining the yields, statistical
testing was conducted to identify significant outliers which
might be the result of flaws in biomass estimation or irregular
biological/geographical conditions in a particular rotation
sequence. A cross-sectional parametric t-test was applied
under the assumption that the adjusted yields
(AdY) were
normally distributed.
- The null hypothesis H
0
is: The adjusted yield does not differ
significantly from the species’ average
- The alternative hypothesis H
A
is: The adjusted yield differs
significantly from the species’ average
The applied statistics for a distinct species in rotation
period t is:
t
t AdY
¼
ffiffiffi
n
p
ðAdY
t
AdYÞ
S
ðAdYÞ
(Form. 2)
where
S
ðAdYÞ ¼
ffiffiffiffiffiffiffiffiffiffiffiffiffiffiffiffiffiffiffiffiffiffiffiffiffiffiffiffiffiffiffiffiffiffiffiffiffiffiffiffiffiffiffiffiffiffiffiffiffiffiffiffi
1
n
1
X
n
i
¼1
ðAdY
t
AdYÞ
2
s
and
AdY
¼
1
n
X
n
i
¼1
AdY
t
AdY with t-values above the 99%-level of significance were
eliminated from the sample.
2.1.4.
Exemplary yield estimations
We tested the approach by forecasting hypothetical yields for
a 24 year SRC site with 3-year rotation cycles. Poplar and
willow species were planted at a 12,000 and 17,500 plants per
hectare density, respectively.
The results were then validated
with findings from the literature.
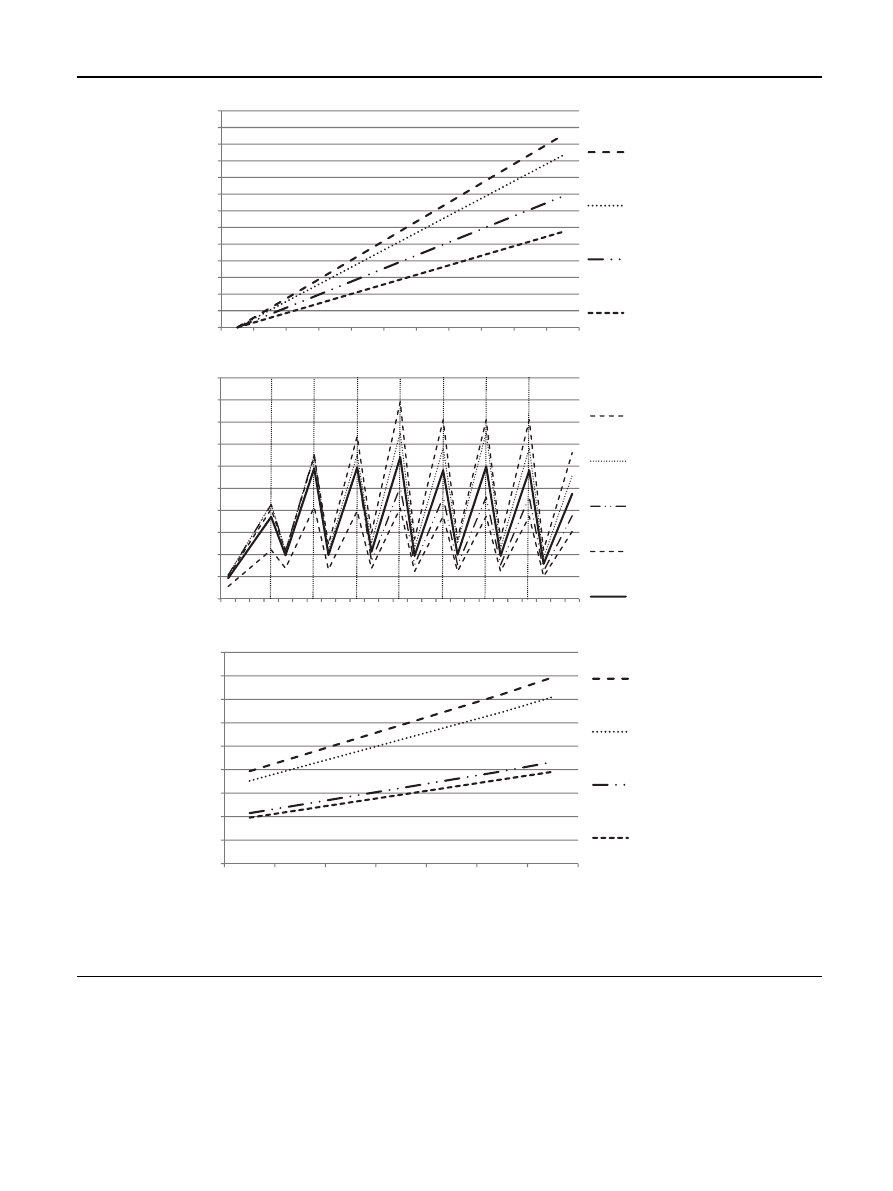
a shows the yield levels for different species with
respect to the SSI. Sites of SSI 5 yield between 5.7 t
atro
ha
1
a
1
for P. trichocarpa x P. deltoides and 11.5 t
atro
ha
1
a
1
for
P.maximowiszi x P.nigra. The species P.maximowiszi x P. tricho-
carpa also provides high-yield rates of 10.3 t
atro
ha
1
a
1
, while
S. Viminalis only achieve to reach levels of 7.8 t
atro
ha
1
a
1
.
Under optimal sites conditions (SSI 10), yields amount to
23.1 t
atro
ha
1
a
1
for the strongest species P.maximowiszi x
P.nigra. The weakest species, P. trichocarpa x P. deltoides, ach-
ieves a yield level of 11.5 t
atro
ha
1
a
1
. On the poorest sites (SSI
1), P.maximowiszi x P.nigra plants reach a yield level of
2.3 t
atro
ha
1
a
1
. These forecasts are consistent with those
found in the literature. Scholz et al.
, estimated average
yield levels for poplar and willow under medium site condi-
tion. His results ranged between 8 and 12 t
atro
ha
1
a
1
and
5
e9 t
atro
ha
1
a
1
respectively. The poplar species P.nigra x P.
maximowiczii and P. maximowiczii x P.trichorpa are also found to
yield the highest productivity
.
b illustrates yield levels throughout 8 rotation
sequences for different species when the SSI amounts to 5.
Due to stronger rooting systems, the average yield more
than doubles between the 1st and the 4th rotation
sequences (4.6
e10.7 t
atro
ha
1
a
1
, respectively). For the
remaining operation length, yield growth factors were
derived from Kro¨ber et al. (11) (see section
). Yield
growth rates reach an average 2.5 after the first harvest for
P.maximowiszi x P.nigra while lower yield rates are obtained
for P. trichocarpa x P. deltoides and P.maximowiszi x P. tricho-
carpa (2.3 and 2.1 respectively). S. Viminalis in contrast,
has the lowest rates of all, averaging 1.6 after the first
rotation.
Yields as a function of planting densities and for SSI 5 are
shown
in
c.
To
achieve
a
yield
level
above
10 t
atro
ha
1
a
1
, poplar sites must planted at a density above
10,000 plants per hectare. Willow species requires an even
greater planting density to achieve similar yield rates as
poplar. Even at densities of 20,000 plants per hectare, S. Vim-
inalis plants only yield 8.6 t
atro
ha
1
a
1
.
2.2.
Woodchips market price forecast
Two main approaches are eligible to forecast woodchips
market price: time series analysis (e.g. moving average,
exponential smoothing) or econometric forecasting (regres-
sion analysis). The first one relies on historic pricing which is
a poor basis for woodchip price forecasts. First, woodchip
prices need to be forecasted for the entire operation length of
SRC projects, that is to say 20
e30 years. However, historic
woodchip price data is only available for the period 2003 to
2010 which is insufficient to guarantee a reliable long-term
forecast. Secondly, real price levels in 2010 were 58% higher
4
It can be noted that the SSI can be used for countries outside
Germany by fixing SQI levels depending on respective soil
textures.
5
Adjusted yield is derived from categorising and constraining
yields (2.1.2).
6
Due to higher accretion rates and lower average yields, wil-
lows require higher planting densities.
b i o m a s s a n d b i o e n e r g y 4 5 ( 2 0 1 2 ) 2 7
30
than in 2003. Such price increases are unlikely to be repre-
sentative of future prices, as one can assume that technolo-
gies and markets will mature.
In contrast, econometric forecasting enables the consid-
eration of surrogate variables determining pricing. In this
study, the pricing of substitute products is used to predict
woodchip price. If the explanatory power is statistically
significant, the forecast can be based on the independent
variable through regression analysis.
The following variables were tested for co-integration with
woodchip prices to determine the level of explanatory power:
(a) Heavy heating oil price for industrial at maximum sulphur
rates of 1% for deliveries in excess of 15 tons in Germany
(b) Light heating oil price for deliveries in excess of 500 tons
0
2
4
6
8
10
12
14
16
18
20
22
24
26
0
1
2
3
4
5
6
7
8
9
10
A
ver
age
Y
ie
ld in
t at
ro
h
a
-1
a
-1
SSI
P. maximowiczii x
P.nigra
P. maximowiczii x
P. trichocarpa
S. Viminalis
P. trichocarpa x P.
deltoides
0
5
10
15
20
25
30
35
40
45
50
0
2
4
6
8
10
12
14
16
18
20
22
24
Cum
u
la
ted
Yield
in
t a
tr
o
ha
-1
a
-1
Age
P. maximowiczi x
P.nigra
P. maximowiczii x
P. trichocarpa
S. Viminalis
P. trichocarpa x P.
deltoides
Average
1. Rot
2. Rot
7. Rot
6. Rot
5. Rot
4. Rot
3. Rot
8. Rot
0
2
4
6
8
10
12
14
16
18
5,000
7,500
10,000
12,500
15,000
17,500
20,000
Ave
rage
Yi
eld
in
t
atr
o ha
-1
a
-1
Planting Density
P. maximowiczi x
P.nigra
P. maximowiczii x
P. trichocarpa
S. Viminalis
P. trichocarpa x P.
deltoides
a
b
c
Fig. 1
e aec Results of the yield estimator for P. maximowiczii x P. nigra, P. maximowiczii x P. trichocarpa, P. trichocarpa x P.
deltoides and S. viminalis depending on site conditions (
a); rotation sequence at medium site suitability (SSI
[ 5)
b) and planting densitiy at medium site suitability (SSI
[ 5) (
c).
b i o m a s s a n d b i o e n e r g y 4 5 ( 2 0 1 2 ) 2 7
31
(wholesale) in Germany
; and (c) European Emission
Allowance prices (in
V per tonne CO
2
) traded on the European
Energy Exchange
Only heavy heating oil prices showed good explanatory
power at 95%-level of significance with a r
2
¼ 0:97. Woodchip
prices were predicted using ordinary least square method
(OLS) (2.2.2).
2.2.1.
Co-integration testing and regression line
To test for co-integration, a simple Engle-Granger 2-step test was
applied. By this means, it is tested if the residuals are stationary.
If they are, it follows that woodchip prices per t
atro
(W
t
Þ
and
heating oil prices per ton (Z
t
) are co-integrated
.
- The null hypothesis H
0
is: W
t
and Z
t
are not co-integrated
- The alternative hypothesis H
A
is: W
t
and Z
t
are co-
integrated
The null hypothesis can be rejected at the 95% significance
level. The test statistic is
2.59, i.e. lower than the critical
value of
1.96. It can therefore be concluded that there exists
a long-run relationship in the historic price evolution of W
t
and Z
t
. By running regression of W
t
on Z
t
, the following
regression line could be derived.
W
t
¼ a þ b Z
t
¼ 45:6 þ 0:15 Z
t
(Form. 3)
The projection values will be derived from the oil
price forecast published in the Annual Energy Outlook
2011 by the U.S. Energy Information Administration (EIA)
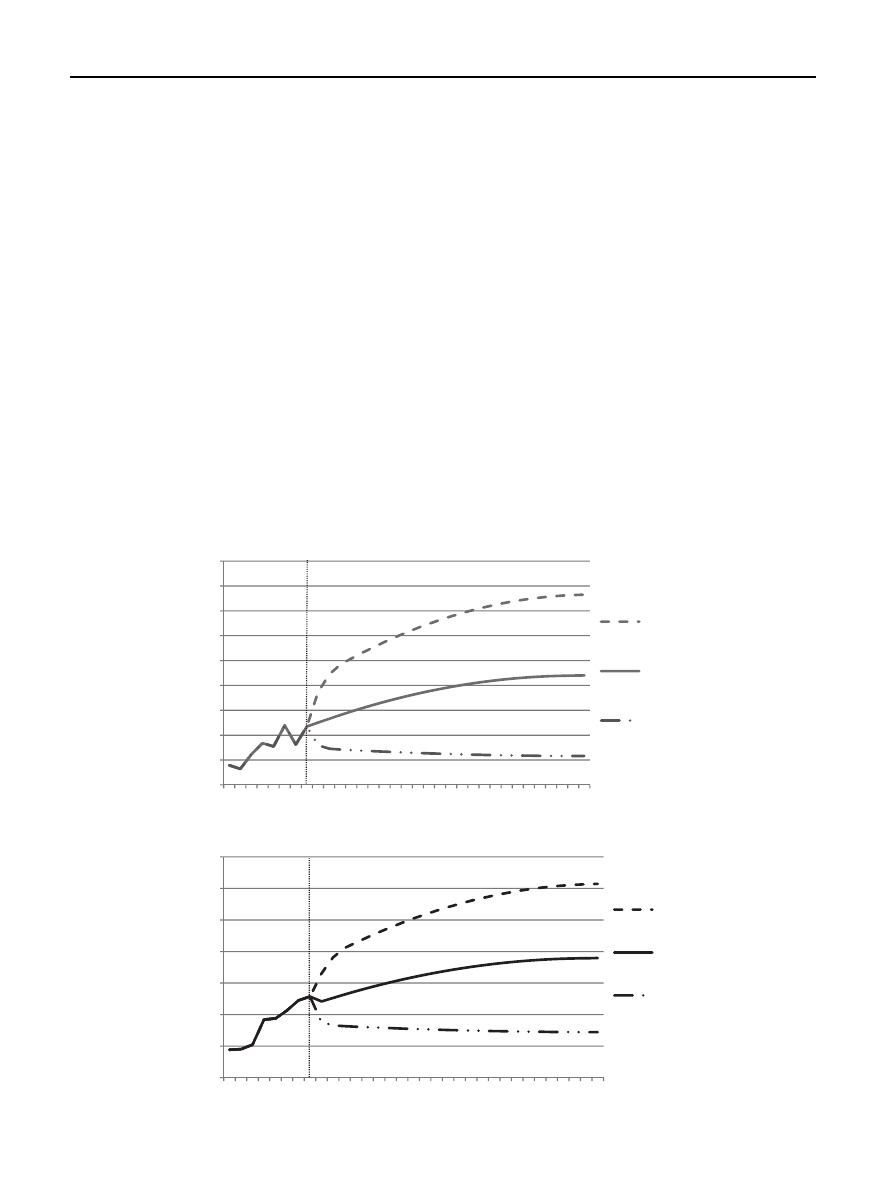
2.2.2.
Results of the woodchip price forecast
shows the forecasts for heavy heating oil and woodchip
prices. Up to 2035, the real woodchip price is projected to
grow by 26.7% and 78.1% under the reference and high oil
price scenario respectively and decrease by 26.4% under the
low oil price scenario. This translates in final prices of 29
V
per MWh, 40.7
V per MWh and 17.2 V per MWh. The growth
and decline rates for woodchips are weaker compared to the
heating oil prices due to the relatively low level of sensitivity
reflected in
b in
. This result is reasonable: In the
past, woodchips have not been a complete substitute for
fossil fuels due to the secondary use of wood for material
applications.
10
20
30
40
50
60
70
80
90
100
2003 2006 2009 2012 2015 2018 2021 2024 2027 2030 2033
€€
/ MWh
HEAVY HEATING OIL MAX 1% SULPHUR CONTENT
High Price
Scenario
Reference
Scenario
Low Price
Scenario
10
15
20
25
30
35
40
45
2003 2006 2009 2012 2015 2018 2021 2024 2027 2030 2033
€
/ MWh
WOODCHIPS AT 0% MOISTURE RATE
High Price
Scenario
Reference
Scenario
Low Price
Scenario
Fig. 2
e Heavy heating oil and woodchip price forecast for 2011 to 2035 (in 2010 V real) (21,32).
b i o m a s s a n d b i o e n e r g y 4 5 ( 2 0 1 2 ) 2 7
32

2.3.
Cost estimator
The cost calculator is based on full cost calculation and retrieves
data from 14 literature sources. For each cost pool and cost
type the median,
minimum and maximum values have been
determined in order to investigate the economic impact of
different cost levels on SRC plantations. For the “medium”
cost scenario, the median values are taken and so on and so
forth.
illustrates the relevant cost pools and their
estimates expressed in their appropriate unit. Preparation,
plantation and re-cultivation costs solely occur once while
harvest costs obviously occur with every rotation. Running
costs arise annually throughout the whole operation life cycle.
2.4.
Economic appraisal
The decision to operate a SRC site depends on its economic
prospects (return, net benefits and/or amortisation length).
These dimensions are measured against the economic
performance of annual crop cultivations. Both cultivation
forms require the application of different evaluation tech-
niques due to their differences in cash flow structures and
project lifespan. Unlike agricultural crops, SRC are charac-
terised by high initial costs, long-term irregular revenues and
costs and operation lengths of 20
e30 years. In this section, we
therefore describe both the evaluation technique for agricul-
tural crops and that for SRC. The decision criteria are the
annuities for both crop types (for SRC, the annuity is referred
to as NPV annuity and for agricultural crops, benchmark
annuity). All monetary values are expressed in 2010
V per
hectare.
2.4.1.
Agricultural crops
Conventional agricultural crops are annual and have the same
revenue and cost structures from year to year. Hence a static
appraisal is used. Total annual revenues are deducted from
total annual costs.
shows average yield, price and
costs given specific site conditions for winter wheat, winter
barley, winter rye and winter oilseed rape for 2011. These are
crops most likely to be substituted by SRC
. By
applying static appraisal, it is assumed that the benchmark
annuity amounts to 230
V for sites with a SSI between 1 and
3.9; 460
V for sites with a SSI between 4 and 6; 710 V on sites
with a SSI between 6.1 and 10.
2.4.2.
Dynamic appraisal for SRC sites
For SRC, cash-flows (CF) occur in the future thus need to be
discounted (37). A dynamic appraisal (
) is therefore
used. The denominator represents the discount factor for year
t with the discount rate i (operation length of the SRC site from
t
¼ 0 to t ¼ n):
Net Present Value
ðNPVÞ ¼ Initial Investment Costs
t
¼0
þ
X
n
t
¼1
Future Revenues
Future Costs
ð1 þ iÞ
n
(Form. 4)
Through multiplication by the annuity factor, the Net
Present Value (NPV) is transformed into a constant annual
profit/loss value.
Net Present Value Annuity
t
¼0 to n
¼ NPV
ðn þ iÞ
n
i
ðn þ iÞ
n
1
(Form. 5)
Table 2
e Overview of median, minimum and maximum cost estimates. Note that there was not sufficient data available to
determine the min and max costs for “poplar own plantation” and “willow own plantation” source [5,11,19,24,27,36
Cost estimates
Cost Pool
Min
Median
Max
Unit
Preparation Costs
Ploughing
47,0
85,0
137,0
V/ha
Soil Preparation
27,0
50,0
V/ha
Weedcontrol (Flexidor
0,3 l
þ Fusilade 1 l)
Roundup 3l
50,3
70,3
72,9
V/ha
Flexidor 0,3 l
51,1
62,4
73,7
V/ha
Fusilade 1 l
25,9
37,1
38,2
V/ha
Plantation Costs
Cuttings
ePoplar Market
0,15
0,20
0,27
V/piece
ePoplar Own Plantation
0,15
V/piece
eWillow Market
0,06
0,08
0,11
V/piece
eWillow Own Plantation
0,04
V/piece
Machinery Cuttings
Plantation
0,04
0,09
V/piece
Harvest Costs
Harvesting & Logistics
(incl. Transport)
20,4
25,0
V/t
atro
Drying
15,0
15,1
15,1
V/t
atro
Storage
5,0
5,3
6,1
V/t
atro
Fertilisers after Harvest
155,5
273,0
V/ha/rotation
Re
ecultivation
750,0
1023,0
1920,0
V/ha
Additional Costs
Lease
105,0
170,0
250,0
V/ha
Overheads
100,0
139,5
154,0
V/ha
Fencing
724
740
756
V/ha
7
The median was chosen instead of the mean value in order to
minimise deviation bias.
8
Benchmark values are estimates only: yields, prices and costs
vary not only throughout time but also between regions.
b i o m a s s a n d b i o e n e r g y 4 5 ( 2 0 1 2 ) 2 7
33

A NPV annuity exceeding the annuity of agricultural crops
implies that the decision maker should opt for cultivating SRC
and vice versa.
3.
Results
First we present the economic performance of the strongest
SRC species under different site conditions (3.1). We then
discuss how different subsidy (3.2), cost (3.3) and woodchip
price scenarios (3.4) affect the NPV annuity. Our assumptions
are as follows
- Species P.maximowiszi x P.nigra are planted at a density of
12,000 cuttings per hectare
- Total operation length is 24 years with 3-year rotation cycles
- A discount rate of 6%is assumed (10,11)
3.1.
The economic performance of SRC under different
site conditions
The site conditions were categorised as poor, medium and
good (SSIs of 3, 5 and 7 respectively). Costs and woodchip price
levels were assumed to be medium. No subsidies for SRC were
considered.
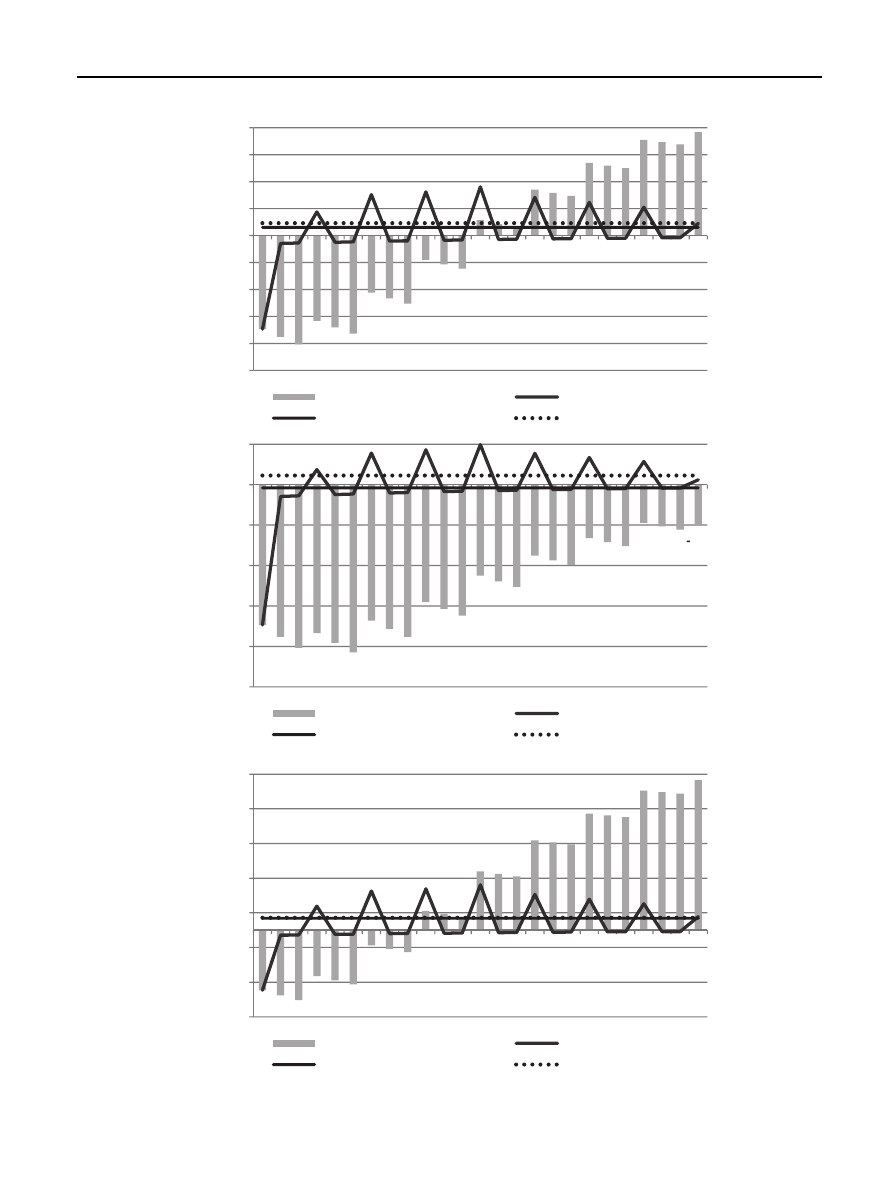
a
ec show the annual discounted cash flows (DCF); the
cumulated DCFs; the NPV annuity and finally the benchmark
crop annuity depending on site conditions. Under medium
site conditions, the SRC site generates a NPV of 3830
V per
hectare (see
a). The NPV annuity amounts to 310
V per
hectare and amortisation takes place in year 12. When
assessed against the benchmark, the SRC site underperforms
by 150
V. On poor sites, the SRC operator would incur a nega-
tive NPV of 990
V per hectare (see
b). The SRC NPV
annuity is clearly lower than the benchmark (difference of 310
V). On good sites, NPV reaches 8660 V per hectare. Amor-
tisation occurs in year 9 and the annuity difference decreases
to 20
V.
To conclude, SRC sites planted with the high-yield species
P.maximowiszi x P.nigra deliver net benefits when site conditions
are at least medium. Furthermore, SRC becomes increasingly
profitable with improved site conditions comparatively to
agricultural crops. This is due to differences in cost structures
whereas SRC plantations have a lower proportion of variable
costs.
3.2.
Woodchip price scenarios
The results presented in section
show that SRC NPV
annuities do not reach the benchmark values. In this section,
we assess the impact of woodchip price based on forecasts by
the EIA (21) on this outcome. Under the EIA’s medium oil
price scenario (21), real woodchip prices are predicted to
increase by 60% from 2010 to 2035. In contrast, the low oil
price scenario assumes higher supply and lower demand
levels relative to the medium scenario resulting in decrease
in prices by 36% for the same period. The reverse applies to
the high oil price scenario which assumes a price increase of
158%. Moreover, agricultural crop prices are also increasingly
linked to the oil price in the long run. The OECD and FAO
estimate that a 25% price increase of crude oil prices results
in a 5% price increase for coarse grains, a 4% price increase
for wheat and a 3% price increase for oilseed
. This would
also improve the economic competitiveness of agricultural
crops and is reflected in the high oil price benchmark values.
Further, we assume medium cost levels and the absence of
subsidies.
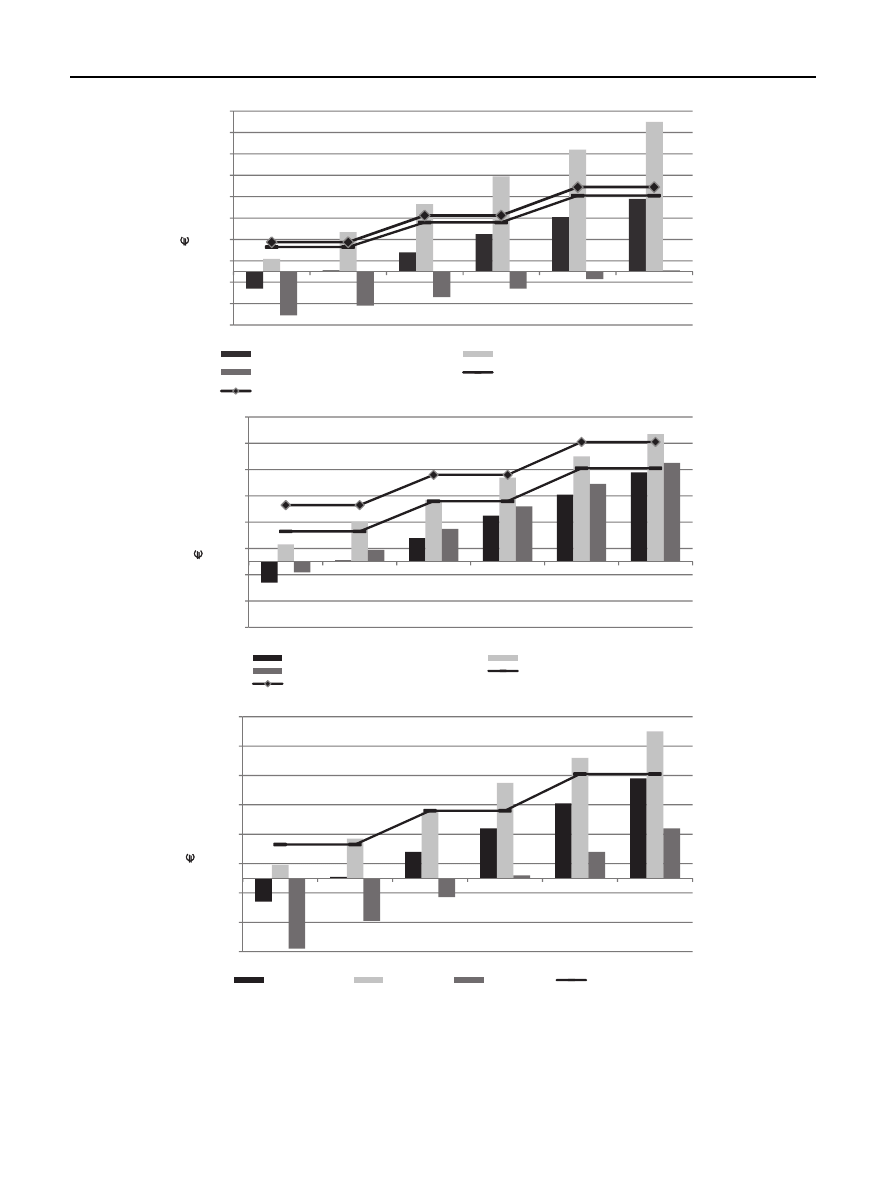
a displays the respective annuities depending on yield
and woodchip price scenario. In the case of low a woodchip
price development, the NPV annuity is only slightly positive
on very good sites. A high woodchip price development
implies that SRC cultivations outperform agricultural crops
(even at higher prices) when the yield level transgresses
8 t
atro
ha
1
a
1
. Moreover, the annuity is entirely positive
irrespective of the site conditions with values ranging from
120
V at 6 t
atro
ha
1
a
1
to 1400
V at 16 t
atro
ha
1
a
1
.
3.3.
Subsidy scenarios
Three different scenarios are discussed. Cost and woodchip
prices levels are both assumed medium. The “no subsidy”
scenario assumes no available SRC grants. Under the “low
subsidy” scenario, an initial investment subsidy of 30% is
assumed. For the “high subsidy” scenario, the 30% subsidy as
well as an area payment of 200
V per hectare per annum are
Table 3
e Overview yields, prices and costs for annual crops, source [45]:
Benchmark annuity for market Fruit cultivation depending on site conditions
Site
Conditions
Winter
Wheat
Winter
Barley
Winter
Rye
Winter
Oilseed Rape
Average
Yield (t
atro
ha
1
a
1
)
Low
6
6
6
3
4
Medium
8
8
7,5
4
7
High
10
10
9
5
10
Price (
V/t
atro
)
210
175
180
395
240
Variable Costs (
V/ha)
Low
650
610
640
700
650
Medium
725
690
690
750
714
High
800
720
740
790
763
Fixed Costs (
V/ha)
327
327
327
327
327
Annuity (
V ha
1
a
1
)
Low
368
184
114
238
226
Medium
629
384
334
504
462
High
890
634
554
780
714
b i o m a s s a n d b i o e n e r g y 4 5 ( 2 0 1 2 ) 2 7
34
3,830
310
460
-5,000
-4,000
-3,000
-2,000
-1,000
0
1,000
2,000
3,000
4,000
0
2
4
6
8
10
12
14
16
18
20
22
24
€€
ha
-1
a
-1
Years
Cumulated DCF (SRC)
Annual DCF (SRC)
Annuity (SRC)
Benchmark Annuity
990
--80
230
-5,000
-4,000
-3,000
-2,000
-1,000
0
1,000
0
2
4
6
8
10
12
14
16
18
20
22
24
Years
Cumulated DCF (SRC)
Annual DCF (SRC)
Annuity (SRC)
Benchmark Annuity
8,660
690
710
-5,000
-3,000
-1,000
1,000
3,000
5,000
7,000
9,000
0
2
4
6
8
10
12
14
16
18
20
22
24
Years
Cumulated DCF (SRC)
Annual DCF (SRC)
Annuity (SRC)
Benchmark Annuity
€
ha
-1
a
-1
€
ha
-1
a
-1
a
b
c
Fig. 3
e aec: Dicounted SRC cash flows and benchmark anuity for medium site conditions (SSI [ 5) (
a); poor site
conditions (SSI
[ 3) (
b) and good site conditions (SSI
[ 7) (
b i o m a s s a n d b i o e n e r g y 4 5 ( 2 0 1 2 ) 2 7
35
assumed. We further illustrate the benchmark annuity with
an area payment of 200
V per hectare.
It should be noted that CO
2
allowances, as a market-based
instrument, are an economically efficient alternative subsidy
to area payments. This is because allowances provide incen-
tives to produce higher levels of biomass, as each saved ton of
CO
2
is remunerated. A supposed CO
2
allowance price of 14
V
per ton and a SRC yield level of 10 t
atro
ha
1
a
1
(which saves
370
630
890
1,140
1,400
230
230
460
460
710
710
275
275
525
525
790
790
-500
-300
-100
100
300
500
700
900
1,100
1,300
1,500
6
8
10
12
14
16
ha
-1
ha
-1
t atro per hectare per annum
Medium Woodprice
High Woodprice
Low Woodprice
Benchmark Annuity (constant oil price)
Benchmark Annuity (high oil price)
300
470
640
800
970
750
230
230
460
460
710
710
430
430
660
660
910
910
-500
-300
-100
100
300
500
700
900
1,100
6
8
10
12
14
16
t atro per ha per annum
No subsidy
High Subsidy
Low Subsidy
Benchmark Annuity (without subsidy)
Benchmark Annuity (with subsidy)
270
450
650
820
1,000
230
230
460
460
710
710
-500
-300
-100
100
300
500
700
900
1,100
6
8
10
12
14
16
t atro per ha per annum
Medium Cost
Low Cost
High Cost
Benchmark Annuity
ha
-1
a
-1
ha
-1
a
-1
a
b
c
Fig. 4
e aec: SRC annuity depending on woodchip price/yield level (
a); subsidies/yield level (
b) and cost level/yield
level (
b i o m a s s a n d b i o e n e r g y 4 5 ( 2 0 1 2 ) 2 7
36

14.7 CO
2
tons per hectare
) would equal an area payment of
roughly 200
V per hectare.
b shows the impact of the distinct scenarios on the
SRC annuity for different yield levels. Under the low
subsidies scenario, the NPV annuity remains below the
benchmark for the considered yield range except at yield
level 16 t
atro
ha
1
a
1
. This result changes when high
subsidies are assumed. At a yield level of 10 t
atro
ha
1
a
1
, the
benchmark value without subsidy can be surpassed by 10
V
(benchmark annuity without subsidy). Above this level, SRC
sites are always to be preferred over annual cultivations.
However, when the area payment is also granted to annual
crops (benchmark annuity with subsidy), SRC sites solely
outperform the benchmark at yield level 16 t
atro
ha
1
a
1
.
3.4.
Cost scenarios
This section scrutinises the economic impact of low, medium
and high cost levels. The respective values were derived from
. The woodchip price scenario is assumed medium and
subsidies are not available.
Investigating cost scenarios is very relevant as most cost
items for SRC sites are likely to decrease with increasing
commercial practises, i.e. the supply chain develops which
results in price decreases for crop cuttings or learning effects
cause decreasing plantation and harvesting cost levels.
Future costs therefore largely depend on the commercial
success of SRC in Germany. The low cost scenario provides
reasonable estimates for such a development. It should also
be noted that other cost items such as transportation
expenses and fertilisers that are linked to energy prices
might become more expensive (see results of high cost
levels).
c shows the SRC annuity per cost scenarios and yield
levels. When high costs are assumed, the SRC plantations
perform below agricultural crops. To break even, SRC must
reach yields near 12 t
atro
ha
1
a
1
. Under maximum yield
(16 t
atro
ha
1
a
1
) the NPV annuity amounts to 340
V. In
contrast, under a low costs scenario, NPV annuities are
entirely positive, ranging from 90
V to 1000 V (6 t
atro
ha
1
a
1
to
16 t
atro
ha
1
a
1
) . The benchmark annuity can be out-
performed at a yield level as low as 8 t
atro
ha
1
a
1
.
3.5.
Comparing the economic results to other studies
The economics of SRC have already been assessed in Sweden
, Poland
, UK
and Northern Ireland
. A
comparison of findings is however challenging given differing
assumptions, evaluation methods and publication dates.
Nevertheless, two studies were selected as they provide
economic estimates under different assumptions by applying
the dynamic appraisal technique (see 2.4.2). The studies
assessed the economics of SRC in Poland
and Northern
Ireland
.
offers an overview on profitability under
exemplary assumptions in Germany, Poland and Northern
Ireland.
The NPV annuity amounts to 570
V per hectare in
Germany, 390
V per hectare in Northern Ireland and 260
V per hectare in Poland. This discrepancy can be mainly
attributed to different woodchip prices. While German
agriculturists can expect prices of 130
V per t
atro
, average
woodchip price in Northern Ireland amounts to 96
V per
t
atro
while they average 71
V per t
atro
in Poland. Moreover,
there exist significant cost differences among the countries.
The cost level is the lowest in Poland with a value of 38
V
per t
atro
. In Germany and Northern Ireland, in contrast,
production costs are 58
V per t
atro
and 51
V per t
atro
respectively.
However, it is important to remark that Ericsson et al.
and Dawson
published their papers in 2006 and
2007 respectively where woodchip prices were still at a lower
level.
4.
Conclusions
SRC plantations on agricultural land can contribute a signifi-
cant source of wooden biomass to Europe’s energy mix and
therefore help Member States meet their CO
2
and renewable
energy targets
. Yet, limited practical experience and
uncertainties about key economic variables impede a reliable
economic assessment of commercial SRC sites. This is
aggravated by SRC’s unfavourable cash-flow structure which
is characterised by high initial investments and late amor-
tisation. SRC plantations, relative to traditional agricultural
crop, present greater investment risks, which need to be
compensated by superior economics.
In order to facilitate the economic feasibility of SRC, as well
as to appraise risks and opportunity costs, this study deter-
mines the profitability of SRC plantations in Germany. Under
Table 4
e Comparison of the economics of SRC in Germany, Poland and Northern Ireland. Lease and overheads are
excluded.
Assumptions & Results
Germany
Poland
Northern
Ireland
NPV Annuity (Annual
Gross Margin)
V ha
1
a
1
570
259
386
Production Costs
V/t
atro
58
38
51
Woodchip price
V/t
atro
130
71
96
Lifespan
Years
21
22
22
Yield
t
atro
ha
1
a
1
11.6
10
12
Discount Rate
%
6%
6%
6%
9
All monetary values are in 2010
V. The relevant exchange
rates were retrieved directly from the source. Lease and over-
heads are excluded.
b i o m a s s a n d b i o e n e r g y 4 5 ( 2 0 1 2 ) 2 7
37

the medium scenario (medium woodchip market price;
absence of subsidies and medium cost level) we show that
SRC plantations are profitable when site conditions are at
least moderate. Notwithstanding, SRC is always outperformed
by agricultural crops irrespective of the site conditions. A
more detailed analysis revealed that SRC viability however
increases with improved site conditions (as a result of a lower
proportion of variable costs relative to that associated with
traditional
crops).
Favourable
policy
instruments
and
economic conditions, such as high subsidies, lower costs and
higher woodchip prices can lead to SRC’s superior profitability
(above agricultural crops).
Finally, we show that SRC profit-
ability is greatest in Germany if compared to Poland and
Northern Ireland contexts, mainly as a result of higher
woodchip prices.
In conclusion, under current investment conditions in
Germany, SRC are not a viable alternative. In order to reach
a SRC plantation area of 450,000 ha by 2020, as predicted in
governmental scenarios analysis
, we recommend to
improve subsidy sufficiency, efficiency and consistency.
Subsidies are currently insufficient: even under the most
attractive subsidy scheme (Saxony’s 30% establishment
payment) agricultural crops economically outperform SRC.
Subsidies are also inefficient in that they currently take the
form of fixed payments irrespective of the produced biomass.
To address this, the introduction of market-based CO
2
allowances for commercial SRC projects could contribute to
alleviating this challenge and provide an additional incentive
to optimise operational efforts. This could be accompanied by
increased government funding for private and public SRC
research with particular focus on breeding and cultivation
projects to generate higher biomass levels for a given area.
Finally, subsidies are inconsistent as they vary between
Federal States. The legal framework for SRC is fragmented due
to partly different agricultural and forestry legislations in
Germany’s Federal States. The alignment of regulations and
guidelines is therefore crucial to improve transparency,
reduce administration costs and facilitate economies of scale
for operators.
Acknowledgements
We would like to express our gratitude to Mr Carl Philipp
Riedel, Mathieu Baudier and Emma van Dam who provided
valuable feedback and stimulated new ideas throughout the
entire writing process.
r e f e r e n c e s
[1] European Parliament and Council of the European Union.
Directive 2009/28/EC of 23 April on the promotion of the use of
energy from renewable sources and amending and
subsequently repealing Directives 2001/77/EC and 2003/30/EC.
[2] AEBIOM-European Biomass Association. 2011 Annual
statistical report on the contribution of biomass
to the energy system in the EU27. Brussels: AEBIOM;
2011.
[3] Department for Environment, Food and Rural Affairs
(DEFRA). Growing short rotation coppice: best practice
guidelines for applicants to Defra’s energy crops scheme.
London: DEFRA Publications; 2004.
[4] Aylott MJ, Casella E, Tubby I, Street NR, Smith P, Taylor G.
Yield and spatial supply of bioenergy poplar and willow
short-rotation coppice in the UK. New Phytol 2008;178(4):
358
e70.
[5] Boelcke B. Schnellwachsende Baumarten auf
landwirtschaftlichen Fla¨chen. Schwerin: Ministerium fu¨r
Erna¨hrung, Landwirtschaft, Forsten und Fischerei; 2006.
[6] Bo¨rjesson P. Environmental effects of energy crop cultivation
in Sweden: Identification and quantification. Biomass
Bioenerg 1999;16(2):137
e54.
[7] Bemmann A, Knust C. Agrowood: Kurzumtriebsplantagen in
Deutschland und europa¨ische Perspektiven. Berlin:
Weissensee Verlag; 2010.
[8] Mola-Yudego B, Aronsson P. Yield models for commercial
willow biomass plantations in Sweden. Biomass Bioenerg
2008;32(9):829
e37.
[9] Wilkinson JM, Evans EJ, Bilsborrow PE, Wright C, Hewison WO,
Pilbeam DJ. Yield of willow cultivars at different planting
densities in a commercial short rotation coppice in the North
of England. Biomass Bioenerg 2007;31(7):469
e74.
[10] Ericsson K, Rosenqvist H, Ganko E, Pisarek M, Nilsson L. An
agro-economic analysis of willow cultivation in Poland.
Biomass Bioenerg 2006;30(1):16
e27.
[11] Kro¨ber M, Heinrich J, Wagner P, Schweinle J. O¨konomische
Betrachtung und Einordnung von Kurzumtriebsplantagen in
die gesamtbetriebliche Anbaustruktur. In: Bemmann A,
Knust C, editors. Agrowood-Kurzumtriebsplantagen in
Deutschland und europa¨ische Perpektiven. Berlin:
Weissensee Verlag; 2010. p. 217
e29.
[12] Nitsch J. Leitstudie 2008: Weiterentwicklung der
Ausbaustrategie Erneuerbarer Energien vor dem Hintergrund
der aktuellen Klimaschutzziele Deutschlands und Europas.
Bonn: Bundesministerium fu¨r Umwelt, Naturschutz und
Reaktorsicherheit (BMU); 2008.
[13] Matala J, Hynynen J, Miina J, Ojansuu R, Peltola H,
Sieva¨nen R, et al. Comparison of a physiological model and
a statistical model for prediction of growth and yield in
borael forests. Ecol Modell 2003;161(1
e2):95e116.
[14] Hartmann KU. Entwicklung eines Ertragsscha¨tzers fu¨r
Kurzumtriebsbesta¨nde aus Pappel [dissertation]. Dresden:
Technische Universita¨t Dresden; 2010.
[15] Evans S (coordinator), Baldwin M, Henshall P, Matthews R,
Morgan G, Poole J, Taylor P, Tubby I. Final Report: yield
models for energy coppice of poplar and willow. DTI; 2007.
Contract Number: B/W2/00624/00/00.
[16] Wael A. Modelling of biomass production potential of poplar
in short rotation plantations on agricultural lands of Saxony,
Germany [dissertation]. Dresden: Technische Universita¨t
Dresden; 2009.
[17] Murach D, Hartmann H, Walotek P. Ertragsmodelle fu¨r
landwirtschaftliche Dendromasse. In: Murach D, Knur L,
Schultze M, editors. DENDROM
e Zukunftsrohstoff
Dendromasse. Remagen-Oberwinter: Verlag Dr. Norbert
Kessel; 2008. p. 93
e117.
[18] Willebrand E, Ledin S, Verwijst T. Willow coppice systems in
short rotation forestry: effects of plant spacing, rotation
length and clonal composition on biomass production.
Biomass Bioenerg 1993;4(5):323
e31.
10
Based on the assumptions of high subsidies, we also con-
ducted an exemplary Geo Information System (GIS) analysis to
identify the economic potential of SRC on agricultural land in the
Federal State of Saxony. The results showed that roughly 35% of
the agricultural land could be planted with SRC contributing to
almost 50,000 PJ of wooden biomass to Saxony’s energy supply.
b i o m a s s a n d b i o e n e r g y 4 5 ( 2 0 1 2 ) 2 7
38

[19] Werner A, Vetter A, Reinhold G. Leitlinie zur effizienten und
umweltvertra¨glichen Erzeugung von Energieholz. Jena:
Thu¨ringer Ministerium fu¨r Landwirtschaft, Naturschutz und
Umwelt; 2002.
[20] OECD- FAO. Agricultural Outlook 2011-2020. Paris: OECD
Publishing; 2011.
[21] U.S. Energy Information Administration (EIA). Annual energy
Outlook 2011 with projections to 2035. Washington DC: EIA;
2011.
[22] Natural England. Energy crops scheme [Internet] [cited 2011
Nov 2]. Available from:
http://www.naturalengland.org.uk/
ourwork/farming/funding/ecs/default.aspx
; 2011.
[23] Helby P, Rosenqvist H, Roos A. Retreat from Salix-Swedish
experience with energy crops in the 1990s. Biomass Bioenerg
2006;30(5):422
e7.
[24] Grunert M. Kurzumtriebsplantagen-Anbauverfahren und
gesetzlichen Rahmenbedingungen. Biomassebereitstellung
aus der Landwirtschaft. Fachveranstaltung
“Biomassebereitstellung aus der Landwirtschaft“; 2001 Jan
21; Leipzig, Germany. [Internet] [cited 2011 Oct 4]. Available
from:
http://www.bioenergie-portal.info/fileadmin/
bioenergie-beratung/sachsen/dateien/Vortraege/
enertec2011/Grunert_2011_01_26.pdf
[25] Maier J, Vetter R. Ertra¨ge und Zusammensetzung von
Kurzumtriebs-Geho¨lzen (Weide, Pappel, Bauglockenbaum).
In: Energieholzproduktion in der Landwirtschaft: Potenzial,
Anbau, Technologie, O
¨ kologie und O¨konomie. Potsdam-
Bornim: Institut fu¨r Agrartechnik Bornim e.V.; 2004. p. 87
e92.
[26] Landgraf D, Johne A, Ro¨hle H. Ertragspotential von Pappeln
im Kurzumtrieb: Studie auf landwirtschaftlichen Fla¨chen in
Su¨dbrandenburg. AFZ Der Wald 2009;64(22):1203
e5.
[27] Hofmann M. Energieholz vom Feld: Sorten, Anbau, Ernte,
o¨konomische Aspekte. Nordwestdeutsche Forstliche
Versuchsanstalt (NW FVA) [Internet] [cited 2011 Nov 2].
Available from: HYPERLINK ",
; 2011,
http://www.nw-fva.de/fileadmin/user_upload/
Sachgebiet/Waldzustand_Boden/Bildungsprogramm_2007/
Hofmann_Energieholz%20vom%20Feld.pdf
; 2011.
[28] Scholz V, Boelcke B, Burger F, Hofmann M, Hohm C,
Lohrbacher FR, et al. Produktion von Pappeln und Weiden auf
landwirtschaftlichen Fla¨chen. Darmstadt: Kuratorium fu¨r
Technik und Bauwesen in der Landwirtschaft (KTBL); 2008.
[29] Petzold R, Feger KH, Ro¨hle H. Stando¨rtliche Voraussetzungen
fu¨r Kurzumtriebsplantagen. In: Bemmann A, Knust C,
editors. Agrowood Kurzumtriebsplantagen in Deutschland
und europa¨ische Perspektiven. Berlin: Weissensee Verlag;
2010. p. 44
e51.
[30] Statistisches Bundesamt Deutschland (DESTATIS).
HYPERLINK "
http://www.destatis.de/jetspeed/portal/cms/
" \o "Datei-Download Lange Preisreihen fu¨r Leichtes und
Schweres Heizo¨l, Motorenbenzin und Dieselkraftstoff -
November 2011" Lange Preisreihen fu¨r Leichtes und
Schweres Heizo¨l, Motorenbenzin und Dieselkraftstoff -
August 2011 ; 2011 [Internet] [cited 2011 Aug 22 ]. Available
from:
http://www.destatis.de/jetspeed/portal/cms/Sites/
[31] European Energy Exchange AG (EEX). Handelsdaten EU
Emission allowances [Internet] [cited 2011 Aug 23]. Available
from:
; 2011,
de/Marktdaten/Handelsdaten/Emissionsrechte/EU%
20Emission%20Allowances%20%7C%20Spotmarkt/spot-eua-
table/2011-11-23
; 2011.
[32] CARMEN e.V. Energie-Holz Index Grafiken [Internet] [cited
2011 Aug11]. Available from:
energie/hackschnitzel/hackschnitzelpreis_grafiken.html
2011.
[33] Yaffee RA. Stata 10 (Time series and forecasting). J Stat Softw
2007;Vol. 23(1):1
e18.
[34] Schaffer M. EGRANGER: Stata module to perform Engle-
Granger cointegration tests and 2-step ECM estimation.
Boston: Boston College [Internet] [cited 2011 Aug 17].
Available from:HYPERLINK ",
; 2010,
econpapers.repec.org/scripts/search/search.asp?
ft
; 2010.
[35] MacKinnon JG. Critical values for cointegration Tests.
Queen’s economics Department working paper No. 1227
[working paper]. Kingston (Canada): Queen’s University;
2010.
[36] Ro¨hricht C, Ruscher K, Kiesewalter S. Feldstreifenanbau.
Dresden: Sa¨chsische Landesanstalt fu¨r Landwirtschaft; 2007.
[37] Kiesewalter S, Ro¨hricht C. Nutzung von kontaminierten
Bo¨den. Dresden: Landesamt fu¨r Umwelt, Landschaft und
Geologie; 2008.
[38] Vetter A, Ba¨rwolff M, Biertu¨mpfel A. Energieholz aus
Plantagen oder Agroforstsystemen-Eine vergleichende
Betrachtung [Internet] [cited 2011 Aug 18]. Available
from:HYPERLINK ". Thu¨ringer Landesanstalt fu¨r
Landwirtschaft,
http://www.tll.de/ainfo/pdf/afs/afs18_09.
; 2009,
http://www.tll.de/ainfo/pdf/afs/afs18_09.pdf
; 2009.
[39] Eckhard F. Wirtschaftlichkeit von Kurzumtriebsplantagen.
Lohnt sich der Anbau von Energieholz?. Fachagentur fu¨r
nachwachsende Rohstoffe e.V. (FNR) [Internet] [cited 2011
Aug 18]. Available from:HYPERLINK ",
; 2010,
http://www.bioenergie-portal.info/
fileadmin/bioenergie-beratung/sachsen/dateien/Vortraege/
2010_11_18_Eckhard_KUP_Oekonomie.pdf
; 2010.
[40] Stu¨rmer B, Schmid E. Wirtschaftlichkeit von Weide und
Pappel im Kurzumtrieb unter o¨sterreichischen
Verha¨ltnissen. La¨ndlicher Raum [Internet] [cited 2011 Aug 1].
Available from:HYPERLINK ",
; 2007.
[41] Berens S. Kurzumtriebsplantagen mit schnellwachsenden
Ho¨lzern. Landwirtschaftkammer Nordrhein Westfalen
[Internet] [cited 2011 Aug 19]. Availabe from:HYPERLINK ",
http://www.duesse.de/znr/dokumentation/2009-06-18-
kurzumtriebsplantagen.htm
; 2009,
znr/dokumentation/2009-06-18-kurzumtriebsplantagen.
htm
; 2009.
[42] Kuratorium fu¨r Technik und Bauwesen in der
Landwirtschaft e.V. (KTBL). Kostenrechner Energiepflanzen
[Internet] [cited 2011 Aug 21]. Available from:
ktbl.de/energy/postHv.html#start
; 2011.
[43] von Engelbrechten HG. Ackerbauliche Grundlagen von KUP.
Bioenergie-Region Wendland-Elbetal [Internet] [cited on 2011
Aug 24]. Available from:HYPERLINK ",
; 2009,
http://www.bioenergie-region-we.
de/fileadmin/downloads/Vortr%C3%A4ge/Engelbrechten_
KUP_8.12._Gartow__Kompatibilit%C3%A4tsmodus_3.pdf
2009.
[44] Wagner K. Kurzumtriebsplantagen als Alternative zu
herko¨mmlichen Ackerbau-Fruchtfolgenein
betriebswirtschaftlicher Vergleich. Praxistag
b i o m a s s a n d b i o e n e r g y 4 5 ( 2 0 1 2 ) 2 7
39

Kurzumtriebsplantagen in Bo¨rsborn; 2011 Feb 23. Bo¨rsbonn,
Germany.
[45] Landwirtschaftlicher Informationsdienst Zuckerru¨be (LIZ).
Erlo¨se, Kosten Deckungsbeitra¨ge [Internet] [cited 2011 Aug 2].
Availabe from:
http://www.liz-online.de/gi/bw/
deckungsbeitrag/deckungsbeitrag.htm
; 2011.
[46] Landeskammer fu¨r Land- und Forstwirtschaft Steiermark.
Kurzumtrieb: Energieholz vom Acker; 2009.
[47] Swedish Energy Agency. Uppdrag att utva¨rdera
fo¨rutsa¨ttningarna fo¨r fortsatt marknadsintroduktion av
energiskogsodling (Mission to evaluate the preconditions for
continued market introduction of energy forest cultivation.
Eskilstuna (Sweden): Statens Energimyndighet; 2003.
[48] Mitchell CP, Stevens EA, Watters MP. Short rotation
forestry-operations, productivity and costs based on
experience gained in the UK. For Ecol Manage 1999;
121(1
e2):123e36.
[49] Rosenqvist H, Dawson M. Economics of willow growing in
Northern Ireland. Biomass Bioenerg 2005;28(1):7
e14.
[50] Dawson M. Short rotation coppice willow: best practice
guidelines. Teagasc, AFBI; 2007.
[51] Bemmann A, Gerold D, Mantau U. Perspektiven von
Kurzumtriebsplantagen fu¨r den Holzmarkt. In: Bemmann A,
Knust C, editors. Agrowood: Kurzumtriebsplantagen in
Deutschland und europa¨ische Perspektiven. Berlin:
Weissensee Verlag; 2010. p. 243
e55.
b i o m a s s a n d b i o e n e r g y 4 5 ( 2 0 1 2 ) 2 7
40
Document Outline
- The economics of short rotation coppice in Germany
Wyszukiwarka
Podobne podstrony:
Economics of poplar short rotation coppice plantations on marginal land in Germany 2013 Biomass and
Economic, energetic and environmental impact in short rotation coppice harvesting operations Włochy
Growing short rotation coppice on agricultural land in Germany 2012
From Small Beginnings; The Euthanasia of Children with Disabilities in Nazi Germany
Efficient harvest lines for Short Rotation Coppices (SRC) in Agriculture and Agroforestry Niemcy 201
pobłocki the economics of nostalgia
The algorithm of solving differential equations in continuous model of tall buildings subjected to c
Dane Rudhyar THE PRACTICE OF ASTROLOGY AS A TECHNIQUE IN HUMAN UNDERSTANDING
Good Capitalism, Bad Capitalism, and the Economics of Growth and Prosperity
SPME for the analysis of short chain chlorinated paraffins i
The Presentation of Self and Other in Nazi Propaganda
In the context of globalization, Calligraphy’s function in poetic dwelling
Role of the Structure of Heterogeneous Condensed Mixtures in the Formation of Agglomerates
[Форекс] The Cost of Technical Trading Rules in the Forex Market
Suke Wolton Lord Hailey, the Colonial Office and the Politics of Race and Empire in the Second Worl
Sociology The Economy Of Power An Analytical Reading Of Michel Foucault I Al Amoudi
RÜDIGER SCHMITT The Problem of Magic and Monotheism in The Book of Leviticus
Kałuska, Angelika The role of non verbal communication in second language learner and native speake
Ehrman; The Role Of New Testament Manuscripts In Early Christian Studies Lecture 1 Of 2
więcej podobnych podstron