

Harmonic Trading: Volume One

This page intentionally left blank

Harmonic Trading: Volume One
Profiting from the Natural Order of the Financial Markets
Scott M. Carney

Vice President, Publisher: Tim Moore
Associate Publisher and Director of Marketing: Amy Neidlinger
Executive Editor: Jim Boyd
Editorial Assistant: Pamela Boland
Operations Manager: Gina Kanouse
Senior Marketing Manager: Julie Phifer
Publicity Manager: Laura Czaja
Assistant Marketing Manager: Megan Colvin
Cover Designer: Chuti Prasertsith
Managing Editor: Kristy Hart
Senior Project Editor: Lori Lyons
Copy Editor: Geneil Breeze
Proofreader: Water Crest Publishing
Indexer: Cheryl Lenser
Senior Compositor: Gloria Schurick
Manufacturing Buyer: Dan Uhrig
© 2010 by HarmonicTrader.com, LLC
Pearson Education, Inc.
Publishing as FT Press
Upper Saddle River, New Jersey 07458
This book is sold with the understanding that neither the author nor the publisher is engaged in rendering legal, accounting,
or other professional services or advice by publishing this book. Each individual situation is unique. Thus, if legal or finan-
cial advice or other expert assistance is required in a specific situation, the services of a competent professional should be
sought to ensure that the situation has been evaluated carefully and appropriately. The author and the publisher disclaim
any liability, loss, or risk resulting directly or indirectly, from the use or application of any of the contents of this book.
FT Press offers excellent discounts on this book when ordered in quantity for bulk purchases or special sales. For more information,
please contact U.S. Corporate and Government Sales, 1-800-382-3419, corpsales@pearsontechgroup.com. For sales outside the
U.S., please contact International Sales at international@pearson.com.
Company and product names mentioned herein are the trademarks or registered trademarks of their respective owners.
All rights reserved. No part of this book may be reproduced, in any form or by any means, without permission in writing from the
publisher.
Printed in the United States of America
First Printing April 2010
ISBN-10: 0-13-705150-6
ISBN-13: 978-0-13-705150-2
Pearson Education LTD.
Pearson Education Australia PTY, Limited.
Pearson Education Singapore, Pte. Ltd.
Pearson Education North Asia, Ltd.
Pearson Education Canada, Ltd.
Pearson Educatión de Mexico, S.A. de C.V.
Pearson Education—Japan
Pearson Education Malaysia, Pte. Ltd.
Library of Congress Cataloging-in-Publication Data
Carney, Scott M., 1969-
Harmonic trading / Scott M. Carney.
v. cm.
Contents: v. 1. Profiting from the natural order of the financial —
ISBN-13: 978-0-13-705150-2 (v. 1 : pbk. : alk. paper)
ISBN-10: 0-13-705150-6 (v. 1 : pbk.)
1. Investment analysis. 2. Investments. 3. Portfolio management. I. Title.
HG4529.C368 2010
332.63’2042—dc22
2009051044

It is with the sincerest honor that I dedicate this book to my parents.
Without their never-ending love and support,
none of this would be possible.

This page intentionally left blank

Fibonacci Numbers . . . . . . . . . . . . . . . . . . . . . . . . . . . . . . . . . . . . . . . . 11
The AB=CD Pattern . . . . . . . . . . . . . . . . . . . . . . . . . . . . . . . . . . . . . . . 41
The Ideal Butterfly Pattern . . . . . . . . . . . . . . . . . . . . . . . . . . . . . . . . . 149
Price Action in the Potential Reversal Zone (PRZ) . . . . . . . . . . . . . 185
The Harmonic Trade Management System . . . . . . . . . . . . . . . . . . . . 203
Contents

Acknowledgments
I want to thank my family. They have been there for me through it all. I am truly grateful for their
love, support, and encouragement.
My good friend and colleague, Jim Kane of KaneTrading.com, has been integral in the develop-
ment of the Harmonic Trading techniques. He and I have collaborated on many strategies, and
he has unselfishly provided tremendous insight to further this approach.
I would like to thank Mark Baker for his tremendous contribution to the Harmonic Trading
methodology. Thanks, Mark. You facilitated this entire endeavor, making it possible for a
multitude of traders to succeed.
I would like to thank Paul Desmond of Lowry’s Reports for his encouragement, insight, and
friendship. It means a great deal that someone of his caliber has taken the time to show an
interest in new trading ideas and, more importantly, to know me as a person. Thank you, Paul.
I would like to thank Greg Morris of Stadion Capital. You are a remarkably accomplished
individual who also has taken the time to show an interest in new market ideas and, more
importantly, to know me as a person. Thank you, Greg.
Lawrence Roche of Battalion Capital has been a friend and a brother to me throughout the
years. I don’t think you realize how much I learned on all those trips to the Natural Gas pit at
the New York Mercantile Exchange. These experiences and your incredibly positive attitude
have made a tremendous difference in my own mental trading game and my life. There’s always
action. So let the games begin!
Gustave Calderon. Just thanks, G. As a friend and a brother and for everything, you have been
there and reminded me of what is possible.

Scott Carney, President and Founder of HarmonicTrader.com, has defined a system of price
pattern recognition and Fibonacci measurement techniques that comprise the Harmonic
Trading approach. He has named and defined harmonic patterns such as the Bat pattern, the
ideal Gartley pattern, and the Crab pattern. He is the author of three books:
The Harmonic
Trader (1999), Harmonic Trading of the Financial Markets: Volume One (2004), and Harmonic
Trading of the Financial Markets: Volume Two (2007). In 2005, Carney joined A.I.G. Financial
Advisors as a Registered Investment Advisor. He has since left A.I.G. Financial Advisors after
two years to start his own firm. In addition, Carney is a full member of the Market Technicians
Association (www.mta.org) and the American Association of Professional Technical Analysts
(www.aapta.us). He has been a regular columnist on several well-known websites, such as
StockCharts.com, TradingMarkets.com, and eSignal.com. Carney is a featured guest on CNNfn,
and he presents seminars nationally.

This page intentionally left blank

Harmonic Trading: Volume One represents an important advancement of the gamut of technical
trading strategies that seek to define opportunities in the financial markets through the
identification of price patterns and the analysis of market structure. This analysis employs a
foundation of several existing price-based measurement approaches to the markets, while
adding many unprecedented strategies that create a synergistic system of rules to optimize
the decision-making process of trading. Price pattern analysis provides precise and effective
information regarding potential future trends. Most important, Harmonic Trading possesses
unique and effective technical measurement strategies that define critical new patterns and
expound upon the existing knowledge base of general Fibonacci and price pattern theories to
establish precise guidelines and extremely effective predictive tools to define and analyze
market trends.
As in any literary work, it is important to cite all appropriate references and original ideas
that are discussed. I have researched extensively most of the relevant reference material that
applies to the ideas covered in this book. I believe it is necessary to emphasize the preparation
required to outline the Harmonic Trading concepts and the lengths that I have pursued to
distinguish the origins of these ideas. Technical methods from Elliott, Gann, Hurst, Gartley,
and others have been thoroughly cited as the foundation for many of the advanced concepts
within the Harmonic Trading approach. However, it is important to note that most of these
measurement techniques and analytical assumptions have not been presented previously.
Therefore, the Harmonic Trading methodology may challenge previous technical theories and
prove to be controversial. The ends do justify the means, as the strategies that comprise
Harmonic Trading represent time-proven ideas that have served as reliable analytical guidelines
in even the most volatile of market climates.
The Evolution of
The Harmonic Trader
I want to thank the thousands of people who have bought my first book,
The Harmonic Trader.
It has been a rewarding experience for me to share this information. The response has been
overwhelmingly positive, and I never could have imagined that it would have been so well
received. I hope you find the material in this book as enriching and educational.
1

My first book,
The Harmonic Trader (HarmonicTrader.com, L.L.C. Nevada; 1999), was a
compilation of ideas based on several general technical approaches that incorporated new
applications of existing analytical tools.
The Harmonic Trader and the Harmonic Trading
techniques evolved from a collection of individual strategies into an entire methodology to
analyze price action in the financial markets over the course of many years. These techniques
coalesced to define a unique system of rules for every step of the trading process. From the
identification of a potential opportunity to exiting a trade, these techniques were designed to
guide every decision from start to finish.
The Harmonic Trading approach offers pertinent technical information regarding the state of
potential future price and specific levels of support and resistance. In fact,
The Harmonic Trader
distinguished itself from the outset by offering strategies that identified areas of potential sup-
port and resistance in ways that no other technical method had previously measured. The
eventual evolution of years of experience culminated in the categorization of an entire system
of pattern recognition of specific price structures based upon prescribed alignments of
Fibonacci ratios.
The writing of
The Harmonic Trader was a gradual evolution of many years of work that
essentially arose from a great deal of trial and error. The book came together smoothly,
however, as most of the initial work focused on precisely defining each of the basic patterns.
Although the actual writing was no small task, the real work was organizing the file cabinets of
charts, notes, trade journals, and the like into an effective and comprehensive “how-to” manual.
In fact, most of the unprecedented ideas outlined in the book were the result of lessons learned
from actual trades. I refined the strategies to devise a system of the most effective techniques
to identify harmonic patterns. In doing so, several new strategies were presented that identified
and defined new price patterns unlike ever before.
The system utilized new technical measures that proved consistently reliable and effective in
determining potential future price action. In the development stages of this approach, I never
stopped to question why such Fibonacci phenomenon was occurring. Rather, I continually
strived to find the methods that were reliable and perfect the rules to define these situations. As
the best relationships were identified, I classified distinct areas of specific price behavior that
commonly developed in these specific situations. Essentially, I went with the techniques that
worked! After compiling hundreds of charts and notes, I started to write
The Harmonic Trader.
Initially, I compiled a list of Fibonacci strategies that repeated and the technical events that
were consistently occurring within the framework of price patterns. Focusing on the peculiarity
of exact combinations of Fibonacci pattern alignments, much of my initial work attempted to
define the best situations among multitudes of possibilities. I realized early in my research into
the best harmonic patterns that each setup was not the same. Although many potential pattern
structures appeared to be similar, I realized that the alignment of points was a critical factor in
differentiating potential trading opportunities and in providing vital information regarding the
potential state of future price action.
2
Harmonic Trading: Volume One

After this discovery regarding price structures, I succeeded in defining the best alignments
of Fibonacci measurements that validated each pattern. In the process, several unique
concepts were outlined in
The Harmonic Trader that shed new light on the measurement
of price movements with respect to Fibonacci analysis. It is important to emphasize that
Harmonic Trading is different from all other Fibonacci-related market approaches. Harmonic
Trading techniques define potential trading opportunities with extensive precision and detail.
Every price movement must be analyzed for possible information regarding the state of future
price action. In addition, this approach utilizes unique rules and measurement techniques to
generate valid trading signals.
As I have mentioned previously, others long before me have utilized Fibonacci ratios with
price patterns. Robert Prechter and A. J. Frost in their book
Elliott Wave Principle advanced
the original writings of R. N. Elliott and clearly outlined Fibonacci applications with respect to
their measurements of price movements. In fact, Elliott Wave analysis was probably the first
comprehensive application of Fibonacci measurements to price pattern movements in the
financial markets. Although Charles Dow utilized standard retracements (1/3, 2/3) in his tenets
of Dow Theory long before Elliott, the aspect of relating Fibonacci measurements differentiates
these methods and possesses greater technical implications beyond simple estimation.
Regardless of the differences, various predecessors have applied similar tools and
measurement techniques in previous literary efforts.
I would like to take a moment to discuss the material presented in
The Harmonic Trader. The
following list represents a few of the unprecedented ideas outlined in
The Harmonic Trader that
must be distinguished:
• Potential Reversal Zone (PRZ). Although many have discussed the use of simple
Fibonacci measurements,
The Harmonic Trader was the first comprehensive work that
specifically outlined the concept of three or more Fibonacci calculations of a specific
price structure converging at a defined price level as a potential zone for a change in
trend. Essentially, the Potential Reversal Zone (PRZ) calculates resistance and support
targets based upon the Harmonic Trading measurement techniques. In the years since
this concept was introduced, it has been referred to groupings, clusters, Target Reversal
Zone, and so on. Whatever the term, the concept was initially presented in
The
Harmonic Trader.
• Distinguishing
all points within the pattern. The Harmonic Trader specified and
differentiated every aspect of 5-point reversal structures by examining each Fibonacci
point within the pattern, proving that not all patterns are the same. One of the most
notable developments from this differentiation was the creation of the ideal Gartley
pattern—a setup that required a 0.618 B point and a 0.786 D point retracement as the
only valid alignment for the structure. After
The Harmonic Trader was released, this
alignment has become the industry standard for the structure.
• The Mid-Point (B) as the defining element of 5-point price structures. Another
unique concept outlined in
The Harmonic Trader was the significance of the mid-point
(B) in 5-point price structures as the critical determining element for all harmonic
patterns. For example, the B point distinguishes Bat patterns from Gartley structures.
Introduction
3

4
Harmonic Trading: Volume One
• Alignment of Fibonacci numbers defines the pattern structure. After differentiating
each of the patterns,
The Harmonic Trader and Harmonic Trading techniques
emphasized the importance of the alignment of Fibonacci ratios to differentiate
each price structure. This discovery proves that similar structures are not the same.
Furthermore, each alignment requires specific strategies that are common to each
structure.
• Alternate AB=CD pattern. Among many of the unique technical measurements
discussed in
The Harmonic Trader, the Alternate AB=CD pattern was a vital
advancement of the basic AB=CD theory, and it is a critical element within the
Potential Reversal Zone of many harmonic structures.
In this book, the material reviews each of these concepts extensively and offers many new
strategies to expand the arsenal of tools within the Harmonic Trading approach. It is important
to note that the new ideas presented in this material build upon several existing technical
approaches, such as Elliot Wave. These established technical principles are cited thoroughly
to serve as a foundation for the numerous unprecedented strategies that are outlined in the
Harmonic Trading approach. From this foundation, the techniques discussed in this book
incorporate the best synergies of several Fibonacci-related strategies to define specific
situations for potential trading opportunities.
HarmonicTrader.com
After the release of
The Harmonic Trader, I launched HarmonicTrader.com. As the Internet
became mainstream in the 1990s, I saw a website as a phenomenal opportunity to display the
Harmonic Trading concepts as applied to real-time situations. Because most of the price meas-
urement strategies were entirely new to the field of Technical Analysis, it was essential to define
current market opportunities and maintain a consistently accurate record of predictive analysis.
Therefore, the website was a vital forum to substantiate the unprecedented ideas outlined in
The Harmonic Trader, and it was critical for me to prove that these methods worked—in any
market.
At that time, the predominant bull market of the 1990s was about to turn and the Harmonic
Trading concepts were about to be thoroughly tested. The website became an established track
record that solidly reflected the ability of Harmonic Trading techniques to decipher price action
in any market. For example, the monthly market reports consistently outlined numerous har-
monic patterns that identified critical turning points in the major market indices. Specifically,
distinct Bearish Gartley and Bullish Bat patterns in September 2000 and March 2003,
respectively, were the defining harmonic patterns that pinpointed the critical turning points of
the markets consistently for many years.
In the years that followed, the rally from the 2003 bear market low eventually led to yet more
distinct long-term harmonic patterns that pinpointed another devastating market top. As difficult
as the bear market of 2000–2003 seemed, the events of 2007–2008 financial markets were
some of the most challenging conditions of the past 100 years. Through it all, the new
measurement strategies enabled the Harmonic Trading approach to consistently define the
most important technical levels in an unprecedented fashion.

In the past few years, the emergence of long-term bull markets in commodities such as
energy, precious metals, and agricultural products shifted the trading focus away from nearly
two decades of predominantly stocks to a more diverse palette of vehicles to consider. Not to
mention, burgeoning currency market traders have fueled a new generation of online traders
on an unprecedented international scale to expand the overall appeal of trading. Such diverse
cross-market appeal has furthered the need for trading strategies to maintain a stringent
unbiased perspective and analyze price behavior without favor. For these reasons, the
Harmonic Trading approach has emerged as a reliable and effective system of rules to
navigate any market.
Harmonic Trading: Volume Two
Since this book is titled
Harmonic Trading: Volume One, the obvious question is “Will there be
a
Volume Two?” Yes, and relatively soon. Volume Two will contain advanced concepts that
refine Harmonic Trading techniques to an extremely specialized degree.
It is important to note that
Volume One is not a rehash of The Harmonic Trader. This
book addresses several new patterns and trade management techniques that have not been
discussed previously.
The Harmonic Trader covered an extensive gamut of trade identification
techniques. Admittedly, the other two aspects of Harmonic Trading, trade execution and trade
management, were not sufficiently addressed. This material will cover the other two aspects of
Harmonic Trading more extensively.
This book updates the foundation established in
The Harmonic Trader and dramatically
advances the application of the entire methodology. Several concepts, such as the Bat pattern,
the 0.886 retracement, and the trade management rules, that have not been discussed outside
my work on HarmonicTrader.com and other financial-related websites and organizations.
However, several strategies, such as trend channel Fibonacci retracement trading and the
Three Drives pattern, are important within the realm of this methodology but discussed only in
The Harmonic Trader. This book advances the initial collection of strategies proposed in The
Harmonic Trader and defines the primary principles of the Harmonic Trading approach.
Fibonacci and Harmonic Trading
The measurement strategies within the Harmonic Trading approach employ the somewhat
controversial use of Fibonacci ratios. The recent popularity of the mystique of ancient codes
has led to an unfortunate distortion of the true value that these methods inherently possess.
In fact, it is almost hilarious that there are now numerous financial websites and publications
claiming to possess the “Fibonacci Secrets,” the Gann version of the Harmonic Trader, the quick
Harmonic Trader, or the proper Fibonacci node levels that attempt to mimic the Harmonic
Trading methodology. I say almost hilarious because most of it is not. The blatant borrowing of
these techniques without proper citation and credit has become the standard in this industry,
Introduction
5

I am sorry to say. In fact, most of the Fibonacci-related material on trading the markets is mis-
leading and frequently cite only the well-chosen examples to demonstrate their techniques.
It is important to emphasize that Harmonic Trading is clearly different from other
Fibonacci-related methods. Although others have utilized Fibonacci ratios to quantify various
price patterns to identify potential trading opportunities, their application has been vague and
not precise enough for actual trading situations. This was an initial frustration of mine when I
first worked with these patterns, and it was a motivating factor to be as specific as possible in
my analysis. Such specification led to the classification of
harmonic patterns and even the
defining of an entire analytical system that I coined as Harmonic Trading.
Essentially, I have been trading harmonic patterns longer than anyone. Period. End of
story. How can I say this? Because there was not anything as specialized as the harmonic
patterns until
The Harmonic Trader was released. Furthermore, the other ideas presented on
HarmonicTrader.com and other websites, such as StockCharts.com, eSignal, and others,
furthered the basic concepts established in
The Harmonic Trader. These unprecedented
strategies have evolved into an entire methodology that I have termed
Harmonic Trading.
Harmonic Trading is a sophisticated and comprehensive approach that utilizes specific and
consecutive Fibonacci alignments unlike any other methodology. I am not trying to claim to
invent the Fibonacci wheel. In addition, it is essential to me that all relevant original work be
cited properly and thoroughly. From W. D. Gann to H. M. Gartley, I have credited all pertinent
sources. However, Harmonic Trading utilizes many techniques and specific measurements that
have not been presented previously in this manner. Furthermore, the strict approach of the
interpretation of market price action from the perspective of harmonic price patterns is not the
same as other Fibonacci-related Technical Analysis.
Although not exclusive in its analysis of price movements, these methods offer precise and
accurate trading strategies that utilize unprecedented technical measures. From the 0.886
rertracement to the Bat and the Crab patterns, this approach is the most specialized and
effective Fibonacci trading strategy. The Harmonic Trading methodology
is a distinct
perspective, and I assure you that “You will never look at the financial markets the same
way again.”
6
Harmonic Trading: Volume One

What Is Harmonic Trading?
Harmonic Trading is a methodology that utilizes the recognition of specific structures that
possess distinct and consecutive Fibonacci ratio alignments that quantify and validate harmonic
patterns. These patterns calculate the Fibonacci aspects of these price structures to identify
highly probable reversal points in the financial markets. This methodology assumes that
harmonic patterns or cycles, like many patterns and cycles in life, continually repeat. The key
is to identify these patterns and to enter or to exit a position based upon a high degree of
probability that the same historic price action will occur.
Harmonic Trading is based upon the principles that govern natural and universal growth
cycles. In many of life’s natural growth processes, Fibonacci numeric relationships govern
the cyclical traits of development. This “natural progression” has been debated for centuries
and has provided evidence that there is some order to life’s processes. When applied to the
financial markets, this relative analysis of Fibonacci measurements can define the extent of
price action with respect to natural cyclical growth limits of trading behavior.
Trading behavior is defined by the extent of buying and selling and influenced by the fear
or greed possessed by the market participants. Generally, price action moves in cycles that
exhibit stages of growth and decline. From this perspective, the
collective entity of all buyers
and sellers in a particular market follow the same universal principles as other natural
phenomena exhibiting cyclical growth behavior.
In an attempt to learn the origins of this analysis, many get lost in the need to understand
why these relationships exist. The basic understanding required to grasp this theory should
not move beyond the simple acceptance that natural growth phenomena can be quantified by
relative Fibonacci ratio measurements. Applied to the financial markets, Fibonacci ratios can
quantify specific situations where repeating growth cycles of buying and selling exist. It is the
understanding of these types of growth cycle structures (patterns) that provides pertinent
technical information regarding price action that no other approach offers.
The evidence of harmonic patterns in the financial markets can be found in price charts. A
chart is nothing more than the collective record of buying and selling over time. Patterns that
7

form over a particular period of time reflect a signal or technical “signpost” that can indicate
the state of potential future price action. Furthermore, these situations have been historically
proven to repeat and can identify significant potential trading opportunities with favorable
risk-to-reward considerations.
After learning the basic requirements for each structure, it will take some time to develop the
experience necessary to differentiate which price structures are valid trading opportunities.
Although price structures can vary with respect to their Fibonacci alignments, Harmonic Trading
techniques identify common elements of each situation that identify opportunities and maximize
trading decisions.
Order within the Chaos
Many have argued that the financial markets are a random entity. According to the Random
Walk Theory, popularized in the book
The Random Character of Stock Market Prices by Paul
H. Cootner (ed., MIT press, 1964), price action is “serially independent.” This means that price
history is not a reliable indicator of future price action. Although this theory does possess
validity, since anything can happen in the financial markets, history has proven that within
this randomness there is a degree of repetition.
Many events in the markets have repeated historically through the years. Significant
corrections have occurred in October, which are usually preceded by a late summer peak. In
addition, many common events such as defined levels of support and resistance or trend lines
define repeating market action on a daily basis. Harmonic Trading techniques capitalize on
such repeating market events by identifying specific price patterns within the randomness of the
markets. Correctly identifying these situations is the key to profiting from these opportunities.
The identification of historically repetitive price patterns is the primary means that
these techniques utilize to interpret the market’s signals. It is in this effective price pattern
identification ability that Harmonic Trading possesses its greatest advantages. The precision
and accuracy of the specific pattern alignments define a consistent and effective approach
that can be easily applied. Furthermore, each distinct pattern acts as a model for the basis
of all trading decisions. Once a potential pattern is identified, the trading opportunity can be
managed according to a defined set of rules that are particular for each situation. Although
each pattern possesses different elements, Harmonic Trading identifies specific repetitive
situations within the chaos of the financial markets.
Three Stages of Harmonic Trading
Harmonic Trading utilizes an enormous array of effective Fibonacci alignment combinations to
define patterns. However, Harmonic Trading does not stop at the identification of valid patterns.
Although it is the important first step in defining potential trading opportunities, specific rules
8
Harmonic Trading: Volume One

and guidelines are required to maximize the management of a position. There is more to
profiting from the patterns than just proper identification. The other aspects of trade execution
and position management are equally as important to maximize profit potential and to reduce
risk exposure:
1. Trade Identification. Regardless of what type of trading system is utilized, the initial
step is identifying a potential opportunity. Harmonic Trading techniques utilize historically
proven and repetitive price patterns that capitalize on overbought and oversold signals
generated by the market’s technical price action. A good portion of this material is
dedicated to identifying and differentiating harmonic price patterns as quantified by
Fibonacci ratio alignments. Understanding the differences among the various harmonic
patterns is essential to capitalize on specific trading opportunities.
2. Trade Execution. After accurately identifying a potential trade opportunity, the actual
trade must be determined. Several considerations must be assessed within a specific
time period defined by the potential opportunity. The validity of the pattern must be
determined, and the final action of executing of the trade or not must be considered.
3. Trade Management. After the execution action is decided, there are a variety of
general considerations involved within the trading process. If the trade was executed,
the position must be managed with specific rules to maximize the profit while minimizing
the risk.
These three stages are important to consider as the general process of trading harmonic
patterns. As I said earlier, any system utilized to trade the markets must identify a potential
opportunity, execute the trade, and manage the position until it is closed.
If these concepts are new to you, I recommend that the identification of patterns be
thoroughly understood before executing trades. The essence of Harmonic Trading is the ability
to differentiate price structures based upon specific consecutive Fibonacci ratio alignments.
Therefore, a thorough comprehension of the specific pattern price point alignments is an
essential first step to successfully trade these situations. The other skills of effective trade
execution and acute trade management are equally as important and represent the necessary
elements to consistently profit from the Harmonic Trading approach.
Harmonic Trading utilizes the best strategies of Fibonacci and pattern recognition techniques
to identify, execute, and manage trade opportunities. These techniques are extremely precise
and comprise a system that requires specific conditions to be met before any trade is executed.
The Harmonic Trading approach offers information regarding the potential state of future price
action like no other technical methods. The unique measurements and price point alignment
requirements are some of the unprecedented methods that differentiate this approach from
other technical perspectives.
If you are new to Harmonic Trading, these techniques will open your eyes to many effective
strategies that can indicate the potential future price action. If you have experience with these
strategies, the material in this book will enhance your understanding of specific situations and
offer many pattern-specific techniques that will improve your trading performance.
Chapter 1
Harmonic Trading
9

This page intentionally left blank

Origin of the Fibonacci Sequence
Fibonacci numbers are based upon the Fibonacci sequence discovered by Leonardo de
Fibonacci de Pisa (b. 1170–d. 1240). His most famous work, the
Liber Abaci (Book of the
Abacus), was one of the earliest Latin accounts of the Hindu-Arabic number system. In this
work, he developed the Fibonacci number sequence, which is historically the earliest recursive
series known to date. The series was devised as the solution to a problem about rabbits.
The mathematical problem:
If a newborn pair of rabbits requires one month to mature and at the end of the second month
and every month thereafter reproduces itself, how many pairs will one have at the end of “n”
months?
The answer is: u
n
This answer is based upon the equation: u
n
+1 = u
n
+ u
n
-1
Although this equation might seem complex, it is actually quite simple. The sequence of the
Fibonacci numbers is as follows:
0, 1, 1, 2, 3, 5, 8, 13, 21, 34, 55, 89,144, 233, 377…
∞
(infinity)
Beginning with zero and adding one is the first calculation in the numeric series. The calcu-
lation takes the sum of the two numbers and adds it to the second number in the addition. The
sequence requires a minimum of eight calculations.
(0+1=1)…(1+1=2)…(1+2=3)…(2+3=5)…(3+5=8)…
(5+8=13)…8+13=21)…13+21=34)…(21+34=55)…(34+55=89)
After the eighth sequence of calculations, there are constant mathematical ratio relation-
ships that can be derived from the series. Starting with the sum of the eighth calculation (34) as
11

the numerator and using the sum of the ninth equation (55) as the denominator, the result
yields 0.618.
34/55 = 0.618181 ~ 0.618
Repeating the process, the next division of the ninth calculation (21+34=55) and the tenth
calculation (34+55=89) equals 0.617978 or 0.618.
55/89 = 0.617978 ~ 0.618
In the inverse calculation of these numbers, the same rules apply. After the eighth calcula-
tion, use this sum (34), but in this case as the denominator, and the sum of the ninth equation
(55) as the numerator. This inverse calculation yields 1.618.
55/34 = 1.676471 ~ 1.618
Repeating the process, the next division of the tenth calculation (34+55=89) over the ninth
calculation (21+34=55) equals 1.618182 or 1.618.
89/55 = 1.618182 ~ 1.618
These mathematical relationships remain constant throughout the entire Fibonacci series to
infinity.
In the realm of Mathematics, the 1.618 is known as the
golden ratio or Phi. The inverse
(1/1.618) of Phi is 0.618, sometimes referred to as “little Phi.” The 1.618 ratio is also commonly
referred as the golden number or the golden mean. The number is denoted by the Greek letter
Phi (
ϕ). The inverse of the 1.618 (phi) sometimes is referred to as the golden ratio or golden
proportion (0.618), and it is recognized by a small “p.”
The Golden Section
A simple line can illustrate the relationships of the golden ratio or golden mean in the
golden
section. Begin with drawing a line and then divide it into segments where the ratio of one part
to the entire line is the same as the ratio of the smaller part to the larger. The example of the
golden section is illustrated in the following table:
Whole Line A = 1 inch ( __________ )
Section B = 0.618 inches ( ______ )
Section C = 0.382 inches ( ___ )
A – B = C + B = A
|-------------------|---------------|----------------|------------|
1 - 0.618 = 0.382 + 0.618 = 1
12
Harmonic Trading: Volume One

These line segments can be divided in various combinations to manifest phi (0.618) ratios.
•
Ratio of A to B = 1/0.618 = 1.618
•
Ratio of A to C = 1/0.382 = 2.618 (1+1.618)
•
Ratio of B to A = 0.618/1 = 0.618
•
Ratio of B to C = 0.618/0.382 = 1.618
•
Ratio of C to A = 0.618/1 = 0.618
•
Ratio of C to B = 0.382/0.618 = 0.618
The golden section is closely related to the golden ratio since the ratios have a relationship
to one another that is equal to phi (0.618) or the inverse, Phi (1.618).
Ancient Examples
The 0.618 and the 1.618 constants from the series are found in the Great Pyramids. In
addition, architects and artists have utilized the geometric proportions of the golden ratio in
everything from the Parthenon of Athens to the works of Leonardo Da Vinci.
Examples in the Universe
In his development of the numeric sequence, Fibonacci was attempting to define the
growth pattern of generations of rabbits as the example to explain particular mathematical
relationships. Whether it’s rabbits, elephants, or pigeons, the point to be understood is the
mathematical sequence of growth patterns possesses Phi-related proportions that are exhibited
throughout a variety of universal examples in nature.
It is important to note that both the ratios (1.618, 0.618) and the numbers in the sequence
itself (…8,13, 21, 34, 55) are manifested in these examples. For example, the actual Fibonacci
sequence of numbers can be found in the growth patterns of plants, whereas the golden num-
ber (1.618) can be found in the proportional growth of seashells. The human body possesses a
variety of relative phi (0.618) ratio measurements, and even examples of planetary phenomena
adhere to these golden proportions.
Fibonacci Phyllotaxis
Fibonacci Phyllotaxis is the discipline of studying and classifying the number of visible spirals,
called parastichies, of flowers and seed growth patterns within plants. Most commonly, various
Chapter 2
Fibonacci Numbers
13

14
Harmonic Trading: Volume One
plants grow seeds or leaves in patterns of successive elements exactly related to the Fibonacci
sequence. A survey of plants of 650 species and 12,500 specimens displaying spiral or multiple
phyllotaxis estimated that about 92% of them have Fibonacci Phyllotaxis. (R. V. Jean,
Phyllotaxis:
A Systemic Study in Plant Morphogenesis [Cambridge: Cambridge University
Press, 1994]).
On many plants, the number of petals is a Fibonacci number. For example, buttercups have
5 petals, lilies have 3 petals, some delphiniums have 8, and daisies can be found with 34, 55,
or even 89 petals. Fibonacci numbers can also be seen in the arrangement of seeds on flower
heads. Sunflower seed heads, which grow in a defined outward series, typically possess either
34, 55, or 89 spirals. Cactus spines and pinecones show the same spirals as other seed head
and leaf arrangements, but they are much more clearly visible.
Planetary Phenomenon
Not only do these constant numeric relationships occur in the Fibonacci series, there are
also universal examples that exhibit this phenomenon. For example, Venus takes 225 days
to complete a revolution around the sun. As we all know, the Earth requires 365 days to
complete one revolution. If you divide 225 by 365, the result is approximately 0.618 of a year
(225/365 = 0.616 ~ 0.618) and the inverse (365/225 = 1.622 ~ 1.618) results in 1.618 of a year.
Fibonacci Rectangles and Shell Spirals
Another illustration that exemplifies the Fibonacci numeric sequence starts with one small
square of 1 inch on each side (see Figure 2.1). After drawing the first box, a second box of
1 inch in size is added in the progression of the Fibonacci sequence (0, 1, 1, 2, 3, 5).
Figure 2.1
On top of both of these, continue to draw 1-inch boxes, thereby completing a square the
size of 2 (1+1=2). Again, repeat this process in the sequential order of the Fibonacci series, as
a new square can be drawn that touches both a unit square and the latest square of side 2.
This results in having sides 3 units long and another touching both the 2-square and the
3-square that now has sides of 5 units (see Figure 2.2).

Figure 2.2
In this sequential order, each square can be added with new squares having a side that is
as long as the sum of the latest two squares’ sides. Essentially,
Fibonacci Rectangles are struc-
tures composed of squares with sides each a number from the Fibonacci sequence. From this
succession of rectangles, a spiral is drawn in the squares, resulting in a quarter of a circle in
each square. It is important to note that the spiral is not a perfect symmetrical formation since it
is made up of a fragment of a circle. However, it is a good approximation of the kind of spiral
formations that are manifested in nature and illustrates the relationships of phi quite clearly.
Utilizing the Fibonacci Rectangle progression, spirals can be drawn within these constraints
that resemble the exact mathematical proportions of the shape of snail shells and seashells
(see Figure 2.3). The spiral-in-the-squares begins with a line from the center of the spiral,
increasing by a factor of the golden number in each square. So, each point on the spiral is
1.618 times as far from the center after a quarter-turn (per rectangle side).
Chapter 2
Fibonacci Numbers
15
Figure 2.3
Figure 2.4 shows a cross-section of a Nautilus seashell. The spiral curve of the shell and the
internal chambers provide buoyancy in the water that the animal continues to grow throughout
its development. Each chamber possesses defined relationships similar to the Fibonacci
Rectangle example. In the same manner that the spiral was measured in the Fibonacci
Rectangle, a particular line drawn from the center of the Nautilus out in any direction, locating
two places where the shell crosses, will possess golden proportions.
Figure 2.4
The outer crossing point will be 1.618 times as far from the center, and the inverse
resulting in 0.618, of course. This is one example in a variety of shells that manifest these phi
relationships in nature.

Human Body
As the Nautilus shell example demonstrates, peculiar mathematical relationships are exhibited
in many of nature’s growth cycles. The human body demonstrates many of the same golden
proportion relationships, as well. Each tooth is related to each other based on type. For
example, the width of the central incisor is in the golden proportion to the width of the lateral
incisor. The lateral incisor is in the same golden proportion to the canine, and the canine is in
the golden proportion to the first premolar.
It is commonly known that the human hand possesses many golden proportions.
Specifically, the individual bones in the index finger are related to each other by Phi. Starting
with the tip of the finger to the base of the wrist, each section is larger than the preceding by
approximately 1.618.
The human body manifests both the golden proportions and the numeric properties of the
Fibonacci sequence itself. DNA molecules exhibit the elements of the golden section. Each
molecule measures 34 angstroms long by 21 angstroms wide for each full cycle of its double
helix spiral. The numbers, 21 and 34, are the seventh and eighth results of the Fibonacci
sequence, respectively, and possess golden proportions.
From the unique mathematical properties of the Fibonacci series to the plethora of examples
of this phenomenon repeating throughout nature, the most important concept to grasp is that
there is some unexplainable universal order to many of life’s cyclical processes. The realm of
this discussion could fill an entire book. The mysteries of these golden relationships have been
studied and debated for thousands of years. I believe it is important to understand the essence
of this natural phenomenon, as such order in the universe has implications far beyond the
financial markets. But, this discussion can be left for the theologian and the atheist to debate.
For trading purposes, these relationships, when applied to the financial markets, can
effectively analyze similar cyclical growth patterns in price action quite effectively. However,
it is important to not get caught up in the “why-type” questions that undermine the application
of these methods. Rather, it is important to respect this phenomenon and master the discipline
that such a perspective offers. As W. D. Gann proclaimed:
“I have always looked for causes and when once I determine a
cause I can always be sure of the effect or future event which I
predict. IT IS NOT MY AIM TO EXPLAIN THE CAUSE OF CYCLES.”
(
The Tunnel Thru the Air [Pomeroy, WA: Lambert-Gann Publishing,
1927], 78)
In this manner, it is important to focus on the application of the strategies that consistently
work and not attempt to seek the deep philosophic justifications for their validation.
16
Harmonic Trading: Volume One

Harmonic Trading Ratios
Utilizing Phi (1.618) and its inverse (0.618) as the primary measurement basis, Harmonic
Trading techniques identify price action that reacts to these defined levels of support or
resistance. The gamut of Fibonacci numbers utilized in Harmonic Trading is either directly or
indirectly derived from the primary ratios 0.618 and 1.618 from the Fibonacci sequence. The
primary numbers, when utilized in combination with the
derived ratios from the sequence,
validate harmonic patterns and define the potential areas of change in price action.
It is important to note that some of the derived ratios are not entirely conceived from the
Fibonacci sequence. For example, Pi (3.14) is more related through Ancient Geometry to Phi
than directly calculated from the Fibonacci numeric sequence. But, Pi is effective in combina-
tion with the primary numbers 0.618 and 1.618 in the measurement of harmonic price action.
The ratios utilized in Harmonic Trading techniques are important as the primary means of
differentiating price patterns and defining the state of potential price action. The essence lies
within the specific combinations of these ratios that offer information regarding various price
structures and identify trading opportunities. It is important to note that other technical methods
utilize different percentage ratios. Dow Theory, for example, estimates general price movements
by thirds (1/3 or 33%).
The primary numbers (0.618, 1.618) utilized in Harmonic Trading have been applied to
Elliott Wave Theory for decades. Therefore, Harmonic Trading does utilize similar Fibonacci
measurements as other technical methods. However, a variety of other derived numbers, such
as the 0.886 and its inverse 1.13, are unique to Fibonacci trading methods. Although a few of
these Fibonacci ratios have not been previously presented, others have utilized ratios like the
0.618 and the 1.618 in Technical Analysis for decades. Therefore, Harmonic Trading is not
exclusive in this type of Fibonacci application to the financial markets. The true uniqueness
and effectiveness of these numbers can be found in the combination of their specific ratio
alignments.
This is the key difference of Harmonic Trading techniques versus other Fibonacci-related
analysis. For example, many people utilize a simple 1.618 projection in their Fibonacci analysis.
However, in certain situations, an 0.886 retracement can be a powerful level of support or
resistance when combined with a 1.618 projection.
These relationships will be completely illustrated in the Pattern Identification section of
this book. For now, it is important to understand that Harmonic Trading ratios are unique. The
following list comprises the only ratios that are utilized to determine precise Harmonic patterns.
Chapter 2
Fibonacci Numbers
17
18
Harmonic Trading: Volume One
Harmonic Trading Ratios
Primary Ratios:
(Directly derived from the Fibonacci Number Sequence)
• 0.618 = Primary Ratio
• 1.618 = Primary Projection
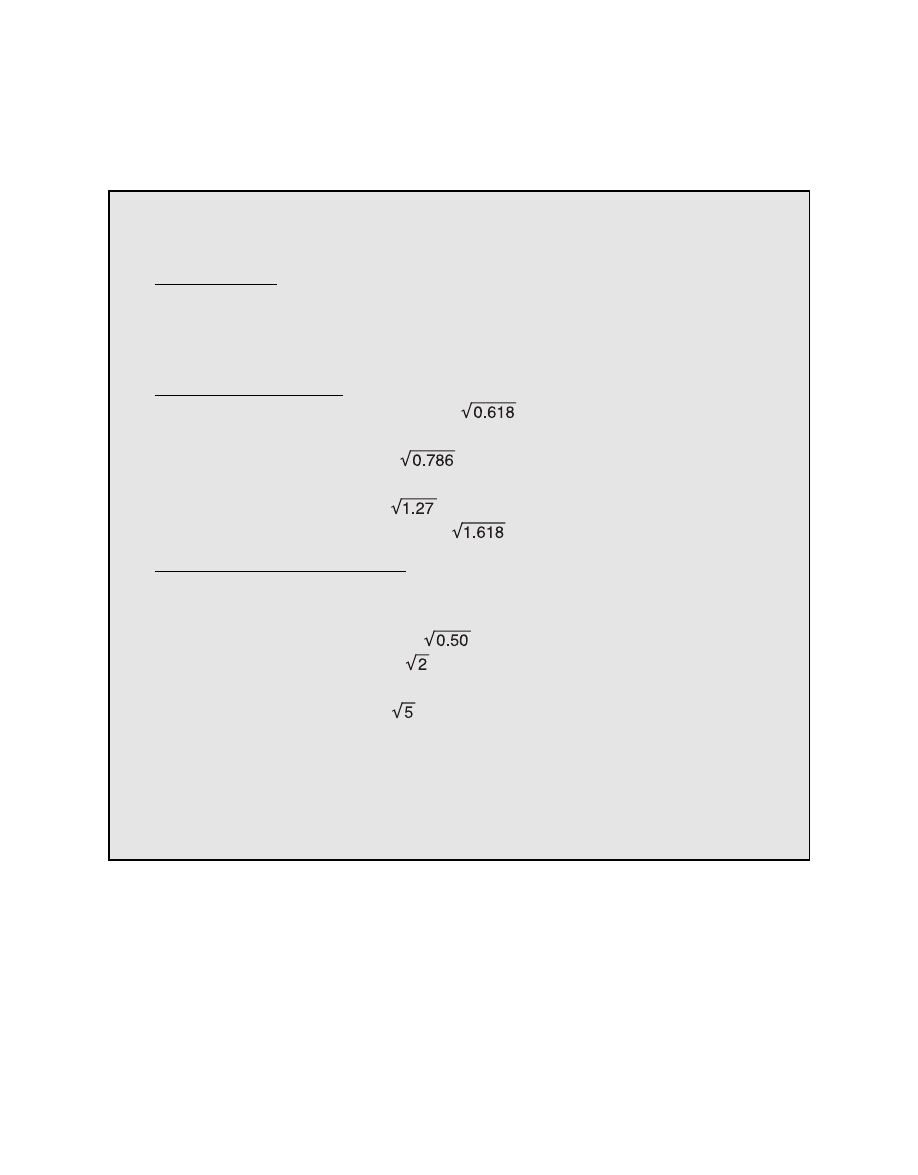
Primary Derived Ratios:
• 0.786 = Square root of the 0.618 (
)
• 0.886 = Fourth root of 0.618 or
Square root of the 0.786 (
)
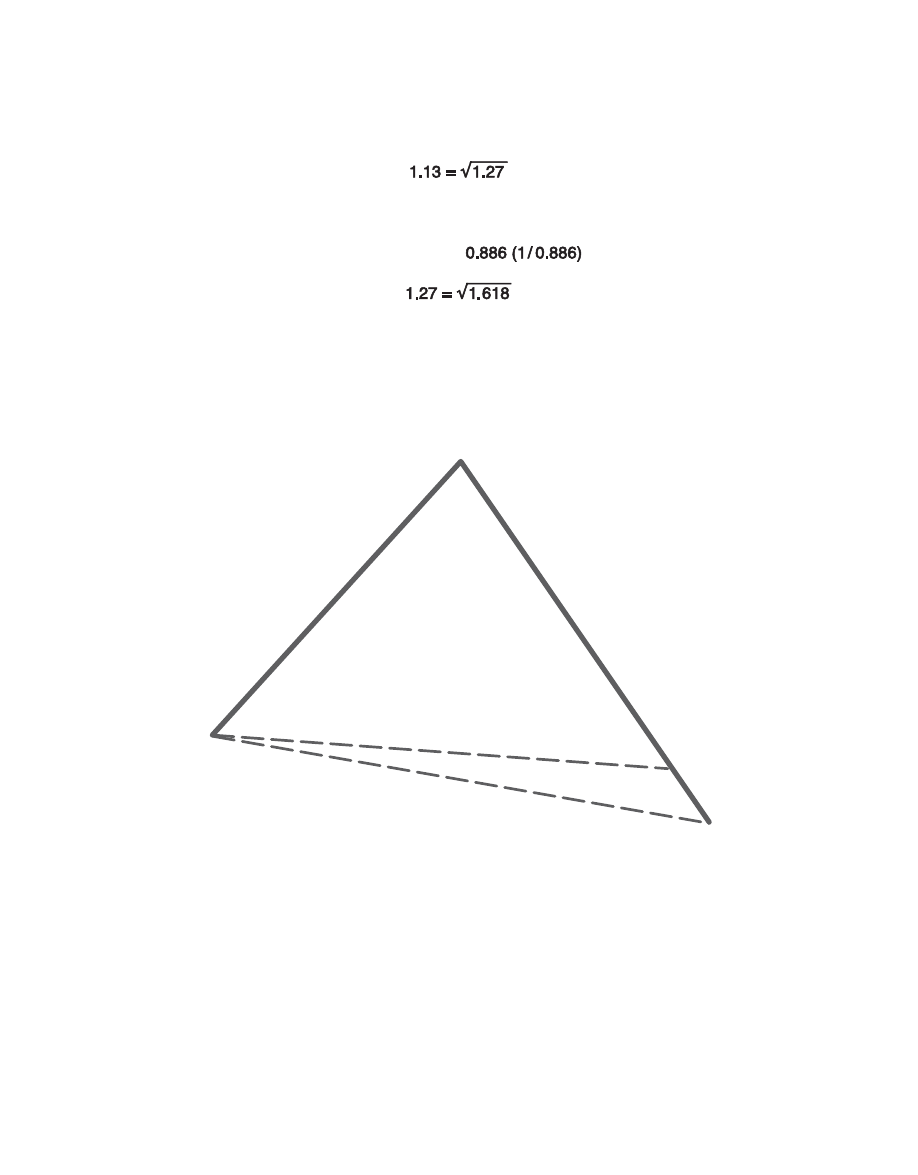
• 1.13 = Fourth root of 1.618 or
Square root of the 1.27 (
)
• 1.27 = Square root of the 1.618 (
)
Complementary Derived Ratios:
• 0.382 = (1-0.618) or 0.618
2
• 0.50 = 0.707
2
• 0.707 = Square root of 0.50 (
)
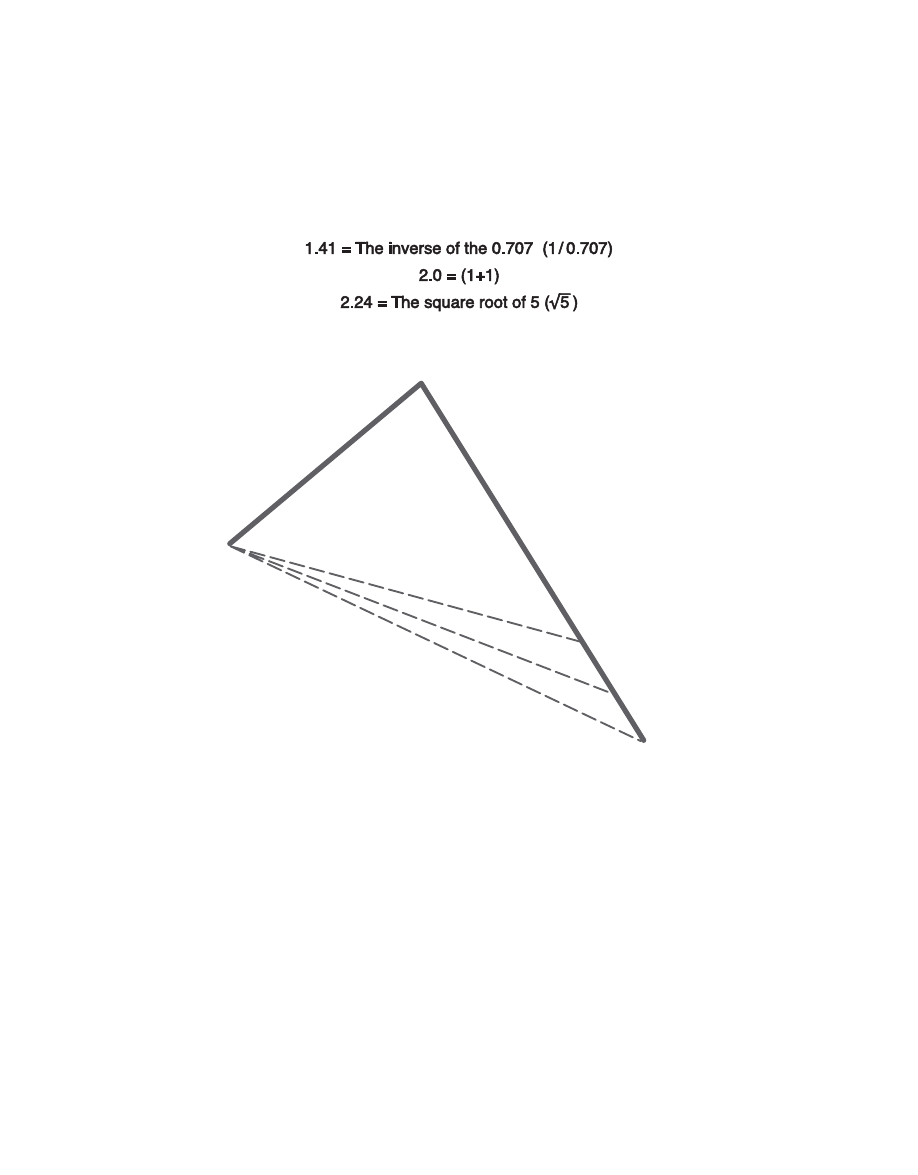
• 1.41 = Square root of 2.0 (
)
• 2.0 = (1+1)
• 2.24 = Square root of 5 (
)
• 2.618 = 1.618
2
• 3.14 = Pi (See later section “The Importance of Pi (3.14) in Harmonic
Trading”)
• 3.618 = (1+2.618)

Primary Retracement: 0.618
Derived directly from the Fibonacci sequence, the primary 0.618 retracement is the defining
element of many harmonic structures. In patterns like the ideal Gartley and the Crab, the 0.618
at the B point distinguishes these specific price structures.
Primary Bullish Retracement: 0.618
The primary bullish 0.618 (see Figure 2.5) ratio or retracement measurement is derived directly
from the Fibonacci sequence. It is probably the best-known Fibonacci ratio. Although commonly
and incorrectly referred to as a 2/3 retracement, the bullish 0.618 retracement is important
support and frequently can be found in well-established channels. In addition, long-term 0.618
retracements can identify critical levels of long-term support.
Chapter 2
Fibonacci Numbers
19
A
B
0.618
C
Figure 2.5
The bullish 0.618 retracement is often a defining Fibonacci number within many patterns like
the Crab and the Gartley. In addition, ideal AB=CD patterns possess a 0.618 retracement.

Figure 2.6
The 0.618 retracement—bearish or bullish—is most important in the Gartley pattern.
Specifically, the B point of the Gartley must be at a 0.618 retracement. In fact, the ideal
alignment for this pattern requires an almost exact 0.618 retracement to validate the pattern.
In these situations, the 0.618 retracement can be very effective in differentiating harmonic
patterns and identifying the best trading opportunities.
20
Harmonic Trading: Volume One
A
B
0.618
C
Primary Bearish Retracement: 0.618
Again, the 0.618 is probably the best-known Fibonacci ratio. It is important to note that Elliott
Wave measurements frequently utilize 0.618 retracements to project time and price targets.
The bearish 0.618 retracement (see Figure 2.6) frequently can be found in well-established
down-trend channels. In addition, long-term bearish 0.618 retracements can be critical levels of
long-term resistance following.
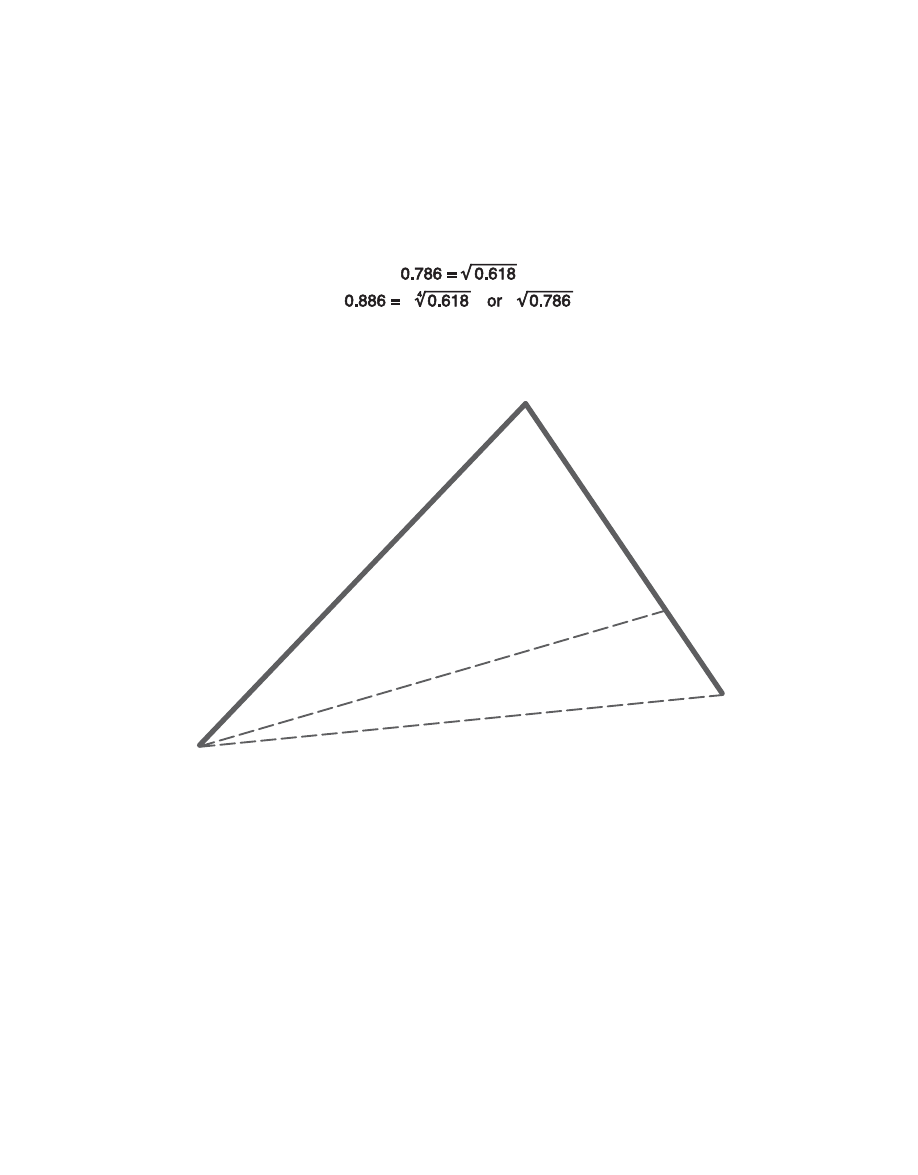
Figure 2.7
Out of these two simple Fibonacci retracements, I prefer the 0.886. I believe that the 0.786
retracement is more complementary in most pattern formations. Only in the ideal Gartley
pattern is the 0.786 retracement a considerable harmonic number. The 0.886 is the most
important retracement in the Bat pattern. In addition, the 0.886 is a critical number in the
Deep Crab pattern, as the B point typically triggers 1.618 extensions. A bullish 0.886
retracement is usually an excellent entry technique to buy well-established support. Although
the 0.786 retracement is more directly related to the 0.618, the 0.886 is a more critical number
in harmonic patterns.
Chapter 2
Fibonacci Numbers
21
A
B
0.786
0.886
C
Primary Derived Bullish Retracements:
0.786 and 0.886
The Primary Derived Bullish Retracements of the 0.786 and the 0.886 (see Figure 2.7) are
directly derived from the 0.618 ratio. The 0.786 is the square root of the 0.618. The 0.886 is
the fourth root of the 0.618 or indirectly derived as the square root of the 0.786.
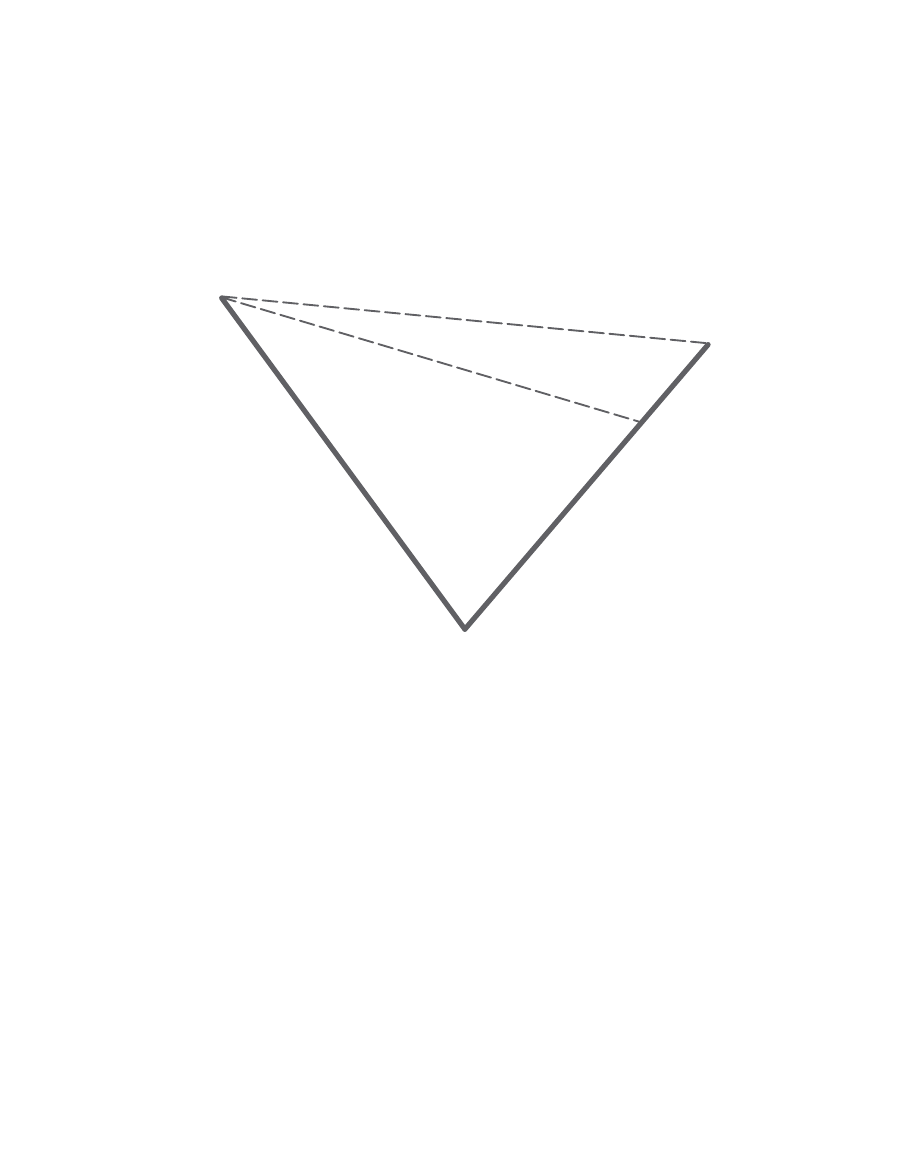
Figure 2.8
Although these two numbers are closely related in percentage terms to each other, their
application in Harmonic Trading techniques can create vast differences in identifying potential
patterns. In fact, the difference between 78.6% and 88.6% is more than a mere 10%. The
88.6% retracement differentiates the Bat pattern from the Gartley pattern. Although these
patterns are similar in formation, their respective ratios define entirely different potential trading
opportunities. This is just one example of the importance of being as precise as possible when
analyzing harmonic price structures.
22
Harmonic Trading: Volume One
A
B
0.786
0.886
C
Primary Derived Bearish Retracements:
0.786 and 0.886
The 0.786 and 0.886 bearish retracements (see Figure 2.8) are commonly found in many
corrective patterns. Again, the 0.886 is a more critical harmonic number in most patterns than
the 0.786 retracement.

The Origin of the 0.886 Retracement
Although the 0.618 and the 0.786 retracement have been utilized in Fibonacci analysis for quite
some time, the introduction of the 0.886 retracement is a relatively new discovery. Although I
have introduced the ratio on various websites in recent years popularizing its use in the
Fibonacci trading realm, I am not solely responsible for its invention. The 0.886 retracement
was conceived through the collaborative effort of Jim Kane and myself.
Jim Kane of KaneTrading.com has investigated a gamut of Fibonacci-derived ratio levels for
years. He and I have shared many ideas with each other that have advanced the field of
Fibonacci analysis as it relates to the financial markets in an unprecedented fashion. In my
opinion, the 0.886 retracement is one of the finest discoveries in Technical Analysis in the past
ten years. The retracement is crucial in differentiating harmonic pattern structures and effective
in areas of clear support and resistance.
Initially, I showed Jim a few different pattern structures in my attempt to prove that “not all
Gartley patterns are the same!” Essentially, I was refining each 5-point price structure based on
specific Fibonacci alignments. When it came to the 0.886, I noticed many specific commonali-
ties that developed in price structures that accompanied the retracement. Specifically, I noticed
that the B point within a Gartley-type structure that was less than a 0.618 would almost always
exceed the expected 0.786 retracement of the XA leg at the projected completion point. I
showed Jim this new pattern called “The Bat,” which utilized a “deep 0.786 retracement.” I told
him that executing at the 0.786 without regard to the structure was a critical mistake. Besides,
the 0.886 retracement when utilized in the correct pattern structures reduced the amount of risk
in previously “undifferentiated” Gartley setups by 10%.
I showed him the relationships between the “deep 0.786 retracement” (0.886) and the 1.618
XA projection in the Deep Crab pattern. After we discussed the ideal Fibonacci alignments for
the Bat versus the ideal Gartley pattern and in the Deep Crab, he said to me, “The deep 0.786
is really an 0.886 retracement, the fourth root of the 0.618 or the square root of the 0.786.”
Although I defined the price structures and specific Fibonacci alignments for harmonic patterns
like the Bat, Crab, and Deep Crab patterns, I want to recognize Jim for his tremendous
contribution to Harmonic Trading and recognize him for quantifying the 0.886 retracement.
Jim and I agree that it is the most effective Fibonacci ratio in the entire Harmonic Trading
arsenal. In recent years, the 0.886 retracement has magically popped up on many trading-
related websites. All I have to say is that if you see the 0.886 retracement on any website other
than KaneTrading.com or HarmonicTrader.com, they are borrowing the technique. That’s okay.
But, it is critical to understand the nature of this Fibonacci level as more than just another
retracement on the chart.
The 0.886 Fibonacci retracement is frequently the determining price level in areas of
well-defined support and resistance. Valid reversals in patterns like the Bat frequently turn
precisely at the 0.886 retracement within the Potential Reversal Zone (PRZ). Although these
considerations will be covered later in this material, I must emphasize that the effectiveness of
the 0.886 retracement, as an unprecedented discovery, is vital within the arsenal of Harmonic
Trading techniques.
Chapter 2
Fibonacci Numbers
23
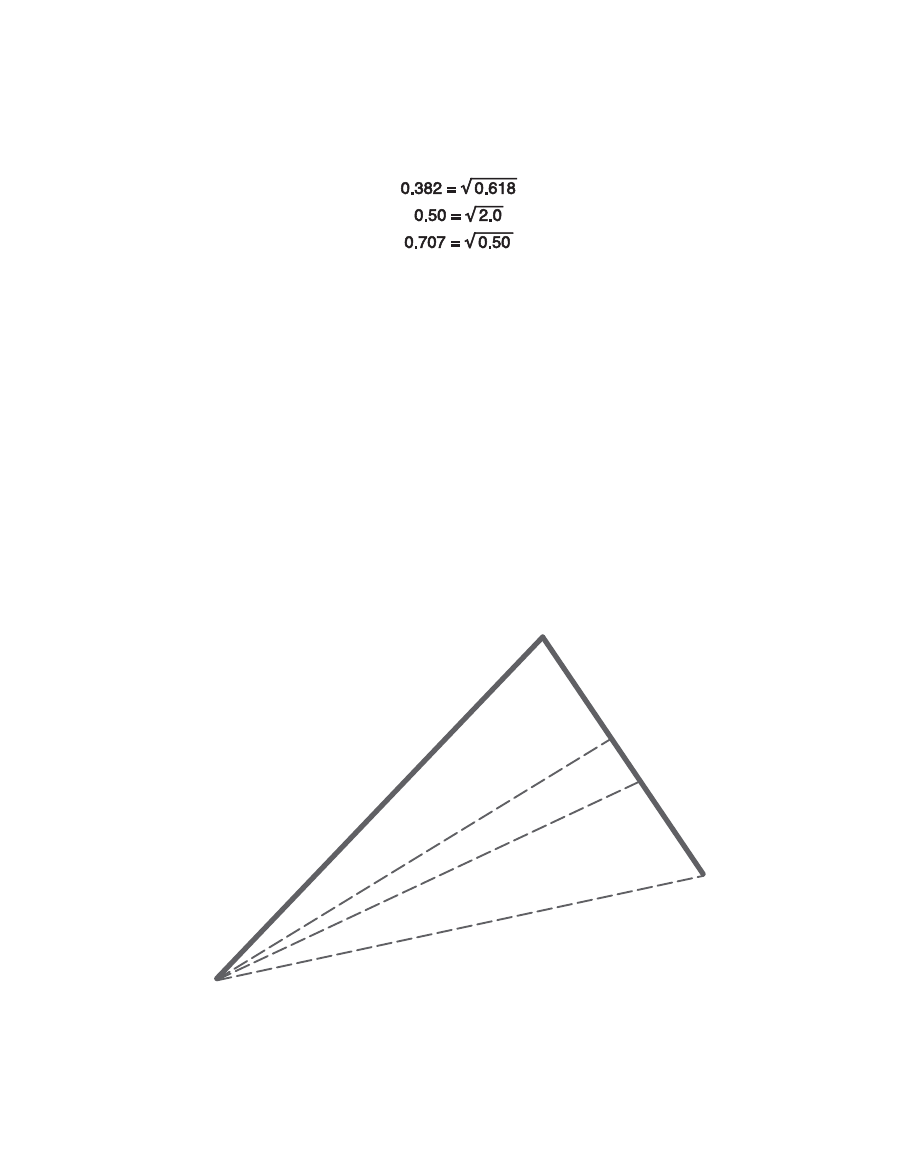
Secondary Bullish Retracements:
0.382, 0.50, and 0.707
The Secondary Bullish Retracements of the 0.382, the 0.50, and the 0.707 (see Figure 2.9) are
indirectly derived from the Fibonacci sequence and the 0.618. These numbers are utilized only
as complementary measurements within most harmonic price patterns. Therefore, trades are
never executed from these numbers exclusively. However, these numbers are crucial in the
differentiation of similar price structures. For example, the 0.382 and the 0.50 are commonly
found as the B point utilized in the Bat and the Crab pattern. Although the 0.707 is less
frequently utilized in Harmonic Trading ratios, it still complements “internal” Fibonacci
calculations within patterns. The 0.707 is usually an intermediate retracement within a 5-point
pattern structure. Again, the 0.382 and the 0.50 are more commonly found as definitive B point
retracements in many patterns like the Bat and the Crab. In the Bat pattern, a 0.382 or a 0.50
retracement at the B point is mandatory for a valid price structure. Although the 0.50 is a more
common retracement than the 0.382, these numbers are very effective in validating price
structures as harmonic patterns.
24
Harmonic Trading: Volume One
A
B
0.707
0.50
C
0.382
Figure 2.9
Chapter 2
Fibonacci Numbers
25
A
B
0.382
0.707
C
0.50
Secondary Derived Bearish Retracements:
0.382, 0.50, and 0.707
These secondary retracements are effective in defining certain patterns (see Figure 2.10).
In addition, the 0.382 retracement is an important initial profit target following valid pattern
reversals.
Figure 2.10

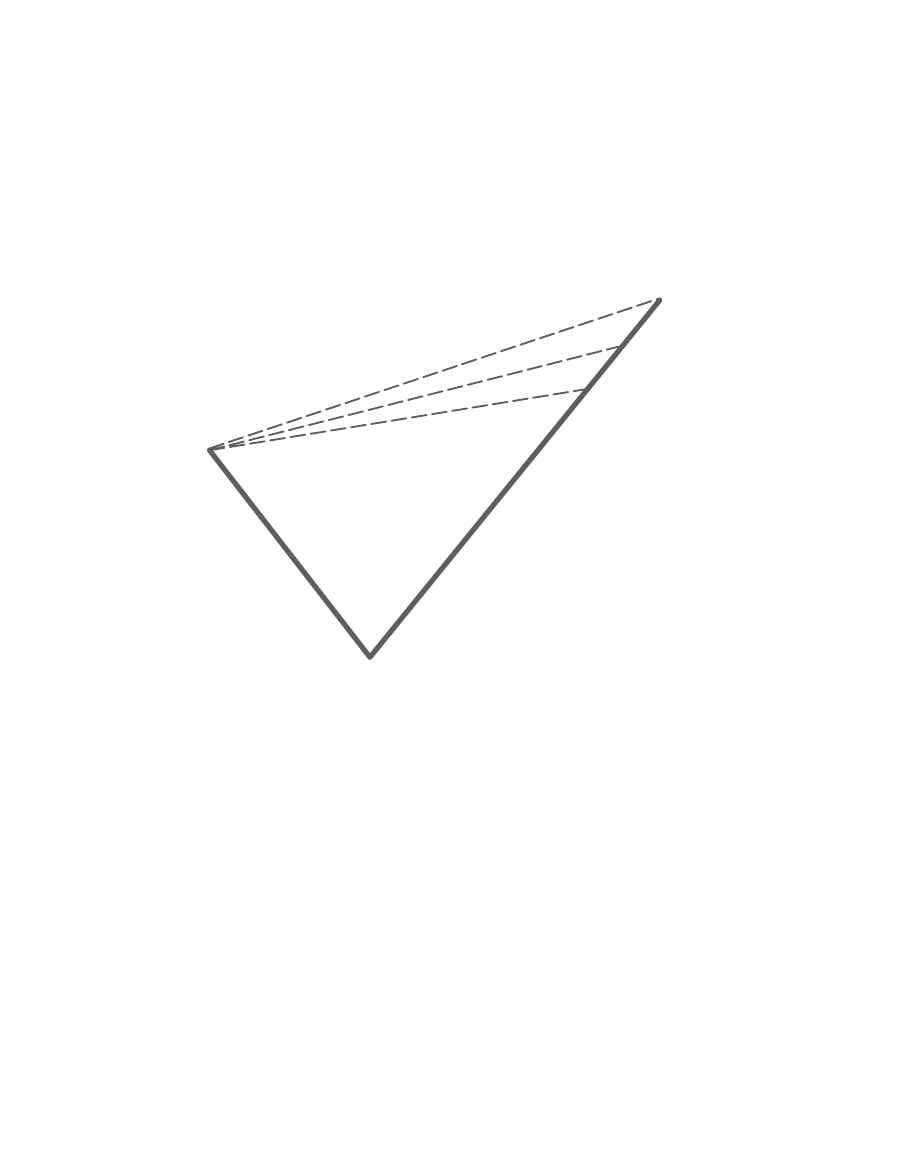
Primary Projection: 1.618
Derived directly from the Fibonacci sequence, the primary 1.618 projection is the defining
element of many patterns. From a pure Fibonacci perspective, the 1.618 extension signals a
state of extreme price action. As a general rule, this measurement frequently identifies the most
critical area within a Potential Reversal Zone (PRZ). It is interesting to note that the 1.618 is
utilized far more frequently as an entry point than its inverse, the 0.618. In fact, the 0.618 is
mostly a complementary Fibonacci number, defining specific price structures as valid harmonic
patterns.
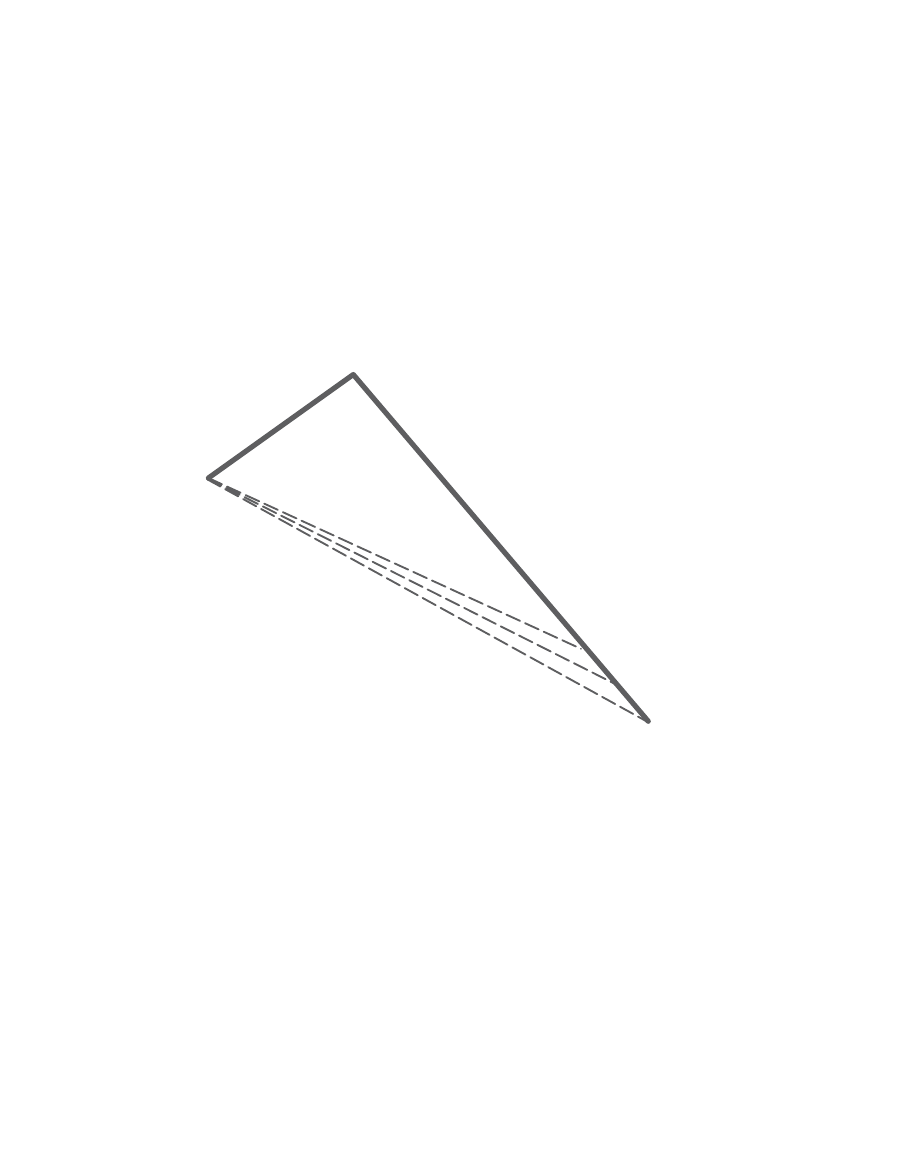
Primary Bullish Projection: 1.618
The primary bullish 1.618 projection (see Figure 2.11) signifies an oversold state of price
action. It is the defining measurement in the Crab and the Deep Crab patterns, and it is an
important element in the Bat structure. In addition, the 1.618 extension works extremely well on
intra-day time frames for short-term trading opportunities.
26
Harmonic Trading: Volume One
X
B
A
1.618
Figure 2.11

Primary Bearish Projection: 1.618
From a pure Fibonacci perspective, a 1.618 extension signifies an overbought state of price
action, especially when other harmonic measurements exist that complement this resistance
level (see Figure 2.12).
Chapter 2
Fibonacci Numbers
27
A
C
B
1.618
Figure 2.12
Again, the 1.618 extension commonly will be the most important number within a PRZ. The
Crab and the Deep Crab possess critical 1.618 extensions that are the defining measurement
within their pattern structures.
28
Harmonic Trading: Volume One
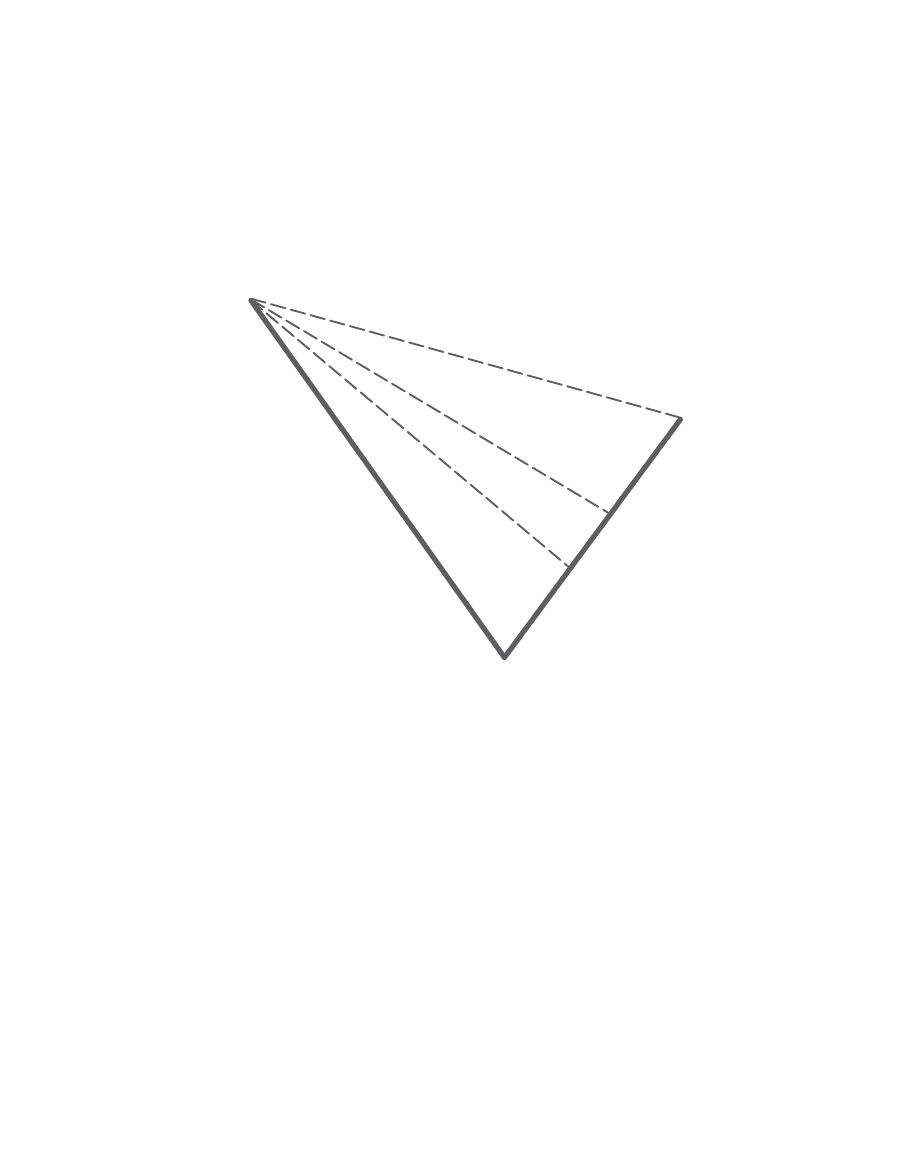
Primary Derived Bullish Projections: 1.13, 1.27
or
the inverse of the
The 1.27 is indirectly derived from the Fibonacci sequence via the square root of the 1.618
(see Figure 2.13). It is an important number in the
ideal Butterfly pattern structure. The 1.27 BC
projection is frequently found in
ideal Gartley patterns, as well.
B
A
X
1.27
1.13
Figure 2.13
The 1.13 and the 1.27 are not nearly as important as the 1.618 extension. Although it is a
frequent pivot point, the 1.27 projection must be utilized in specific situations. For example,
the Butterfly pattern requires specific BC projections for the 1.27 XA price leg to be a valid
entry point in a potential trade.
Primary Derived Bearish Projections: 1.13, 1.27
When combined with other specific Fibonacci measurements, the 1.27 can define precise
harmonic zones of support and resistance (see Figure 2.14). Again, the 1.27 XA projection is
the most significant number in the PRZ of the Butterfly pattern. The 1.27 AB=CD pattern is the
most common alternate structure that is frequently found in the Butterfly, as well.
Chapter 2
Fibonacci Numbers
29
B
A
X
1.27
1.13
Figure 2.14
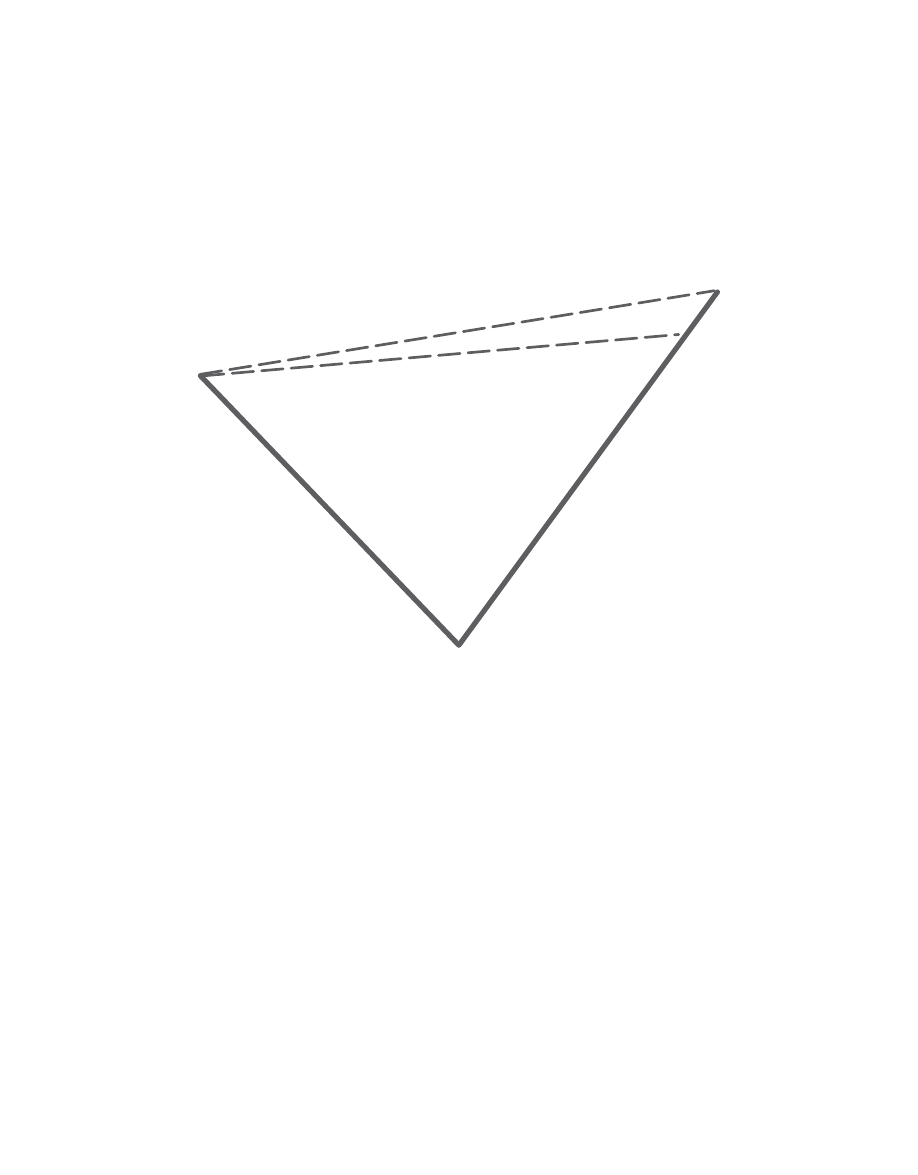
Secondary Derived Bullish Projections:
1.414, 2.0, and 2.24
The secondary bullish projections are most commonly found in BC measurements of patterns
and merely complement the more significant numbers in a PRZ (see Figure 2.15).
30
Harmonic Trading: Volume One
2.24
1.414
A
2.0
B
C
Figure 2.15
Although the 1.41 is less commonly utilized in harmonic patterns, it is as effective as the 2.0
and 2.24 when complementing other harmonic numbers at a pattern’s completion point.
Chapter 2
Fibonacci Numbers
31
Secondary Derived Bearish Projections:
1.414, 2.0, and 2.24
Again, these Fibonacci measurements are extremely effective when they complement other
more significant numbers in a PRZ (see Figure 2.16).
A
C
B
1.414
2.24
2.0
Figure 2.16
The 1.414 is commonly found in the Gartley and AB=CD patterns. The 2.0 and 2.24 usually
complement more extreme projections in Bat, Butterfly, and Crab patterns. Some AB=CD
patterns utilize the 2.0 and 2.24, but these are typically associated with extreme price action.
Secondary Derived Bullish Projections
(Extreme Numbers): 2.618, 3.14, and 3.618
The extreme numbers are unique Fibonacci measurements. These projections are frequently
found in Crab and Deep Crab patterns, as BC projections (see Figure 2.17).
2.618 = 1.618
2
3.14 = Pi (Explanation to follow)
3.618 = (1+2.618)
32
Harmonic Trading: Volume One
3.618
2.618
A
3.14
B
C
Figure 2.17
Although the 2.618 is clearly derived from the Fibonacci sequence, the 3.14 and 3.618
originated indirectly from the other Harmonic Trading ratios. The 3.14 (Pi) projection is a
powerful harmonic measurement. The 3.618 is merely a complementary number in most
pattern structures. In fact, the 3.14 and the 3.618 are mostly utilized as the BC projection in
the Crab and Deep Crab patterns.

Secondary Derived Bearish Projections
(Extreme Numbers): 2.618, 3.14, and 3.618
These numbers are usually found in patterns possessing extreme price action, hence the name
(see Figure 2.18).
Chapter 2
Fibonacci Numbers
33
A
C
B
2.618
3.618
3.14
Figure 2.18

The Importance of Pi (3.14) in Harmonic Trading
Pi, which is denoted by the Greek letter (
π), is one of the most famous ratios in mathematics,
and is one of the most ancient numbers known to humanity. Pi is approximately 3.14 and
represents the constant ratio of the circumference to the diameter of a circle. Known as the
decimal expansion of Pi, it is impossible to calculate the ratio to an exact decimal place.
Furthermore, no apparent pattern emerges in the succession of digits:
3.1415926535897932384626433832795028841971693993.....
∞
(infinity)
Like the Golden proportions, Pi is manifested in many of life’s natural processes. The
planetary bodies possess distinct Pi proportions, as well as the double helix spiral of DNA.
The importance of all Harmonic Trading ratios is that they are manifested in many of life’s
natural processes. The principles of Harmonic Trading are instilled in the origins of natural laws
that govern many of life’s cyclical growth processes. When applied to the financial markets,
these measurements offer an effective means to assess the state of price action. Furthermore,
these ratios serve as the primary basis that validates price structures as harmonic patterns.
Although these examples are present throughout the universe, it is important to note that
Harmonic Trading is
not Astrology. In recent years, certain astrological financial analysts and
software programs have tried to align their approach with Harmonic Trading or, as it is also
known, Harmonic Analysis. I believe people sometimes confuse the inherent natural aspects of
Fibonacci relationships in Harmonic Trading to planetary alignments. Although these subjects
may seem similar, they are not related to each other.
Harmonic Trading demystifies the frequently misappropriated use of Fibonacci analysis with
respect to the financial markets. With the exception of Elliott Wave Theory, I believe Fibonacci
ratios have not been clearly presented in recent years, and they have been frequently exploited
as mere marketing tools for certain individuals. I am confident that this book will clarify the
confusion of Fibonacci methods and provide an effective approach to define trading
opportunities based on the specific application of Harmonic Trading techniques.
34
Harmonic Trading: Volume One

What Is a Harmonic Pattern?
Harmonic patterns are defined by specific price structures quantified by Fibonacci calculations.
Essentially, these patterns are price structures that contain combinations of
distinct and
consecutive Fibonacci retracements and projections. By calculating the various Fibonacci
aspects of a specific price structure, harmonic patterns can indicate a specific area to examine
for potential turning points in price action.
Specific Price Structures
Harmonic Trading techniques are similar to standard technical price patterns, such as the Head
and Shoulders or wedge formations, since the focus on a particular shape of price action is the
key validation factor. However, harmonic patterns are probably the most specific technical price
patterns due to the specific Fibonacci measurements of each point within the structure. These
measurements provide a tremendous advantage in that they serve to quantify and categorize
similar price structures as distinct “technical entities.” Depending upon the specific alignment of
Fibonacci ratios within each structure, potential trading opportunities can be differentiated,
offering pattern-specific strategies for each situation. In essence, similar price structures are
not
the same, and each pattern must be precisely defined. From such specification, a great deal of
information can be garnered regarding the state of potential price action.
Elliott Wave Theory
The analysis of harmonic price structures is based upon the elements of simple Geometry and
resembles the measuring techniques of Elliott Wave principles. I strongly recommend reading
Elliott Wave Principle, by Robert Prechter and A. J. Frost. This profound work advanced the
original writings of R. N. Elliott and offers a comprehensive explanation of the universal
geometric relationships of natural law as they relate to price action in the financial markets.
Furthermore, the Wave Theory and the discoveries of R. N. Elliott were some of the primary
35

technical works that established the basic technical foundation for the identification of specific
price structures based upon quantified wave counts.
Unlike the general structures of Elliott Wave Analysis, Harmonic Trading focuses on
specific price movements. Harmonic Trading is unique in its approach of defining precise price
structures, differentiating these movements with respect to their Fibonacci alignments. For
example, most technicians are aware of the “M” and “W” corrective patterns explained within
Elliott Wave Analysis. These corrective structures—either simple “abc” pullbacks or complex
“abcde” formations—are vital in the validation of wave counts and Elliott Wave Theory. However,
Harmonic Trading quantifies all of the Fibonacci aspects within a particular structure, further
refining these “M’s” and “W’s” as unique technical patterns.
Harmonic Trading versus basic Elliott Wave Analysis:
• The price point alignment of harmonic patterns is essential.
• Each pattern must possess an exact alignment that must not be violated.
• The most significant point in all harmonic patterns is the mid-point (B).
• Unlike Elliot Wave number counts, Harmonic Trading denotes each point with
letters, marking each price move as XA, AB, BC, CD.
Harmonic Trading analyzes and quantifies price structures with incredible precision. The
specific rules required to validate price structures as exact harmonic patterns are unique and
differentiate Harmonic Trading from all other technical methods. In fact, there is no variation
permitted from the prescribed alignments of the harmonic patterns. This differs from Elliott
Wave Theory, which allows greater variation within the realm of its price structure analysis.
There are many advantages in differentiating specific price structures. Such specification
utilizes different strategies based upon each situation. Essentially, “all patterns are not the
same.” Although certain price structures may appear similar, the treatment of each situation
depends upon the exact alignment of harmonic aspects that defines the pattern. This is one of
the most important principles within the Harmonic Trading approach and is essential for turning
patterns into profits.
W. D. Gann and Harmonic Trading
One of the most famous traders in history, W. D. Gann utilized trading methods based upon
time and price analysis. Although many students of Gann’s approach focus their attention on
his application of geometric proportions based on the circle, square, and triangle, the true value
of his work was revealed “in between the lines” of his many books, which emphasized the
importance of respecting natural laws in financial market analysis. Although his methods are
notoriously accurate—as evidenced by his performance in 1933 when he made 479 trades
during the year, of which 422 were winners and 57 were losers—his profound writings offered
a great deal of insight into the proper approach required to analyze the market. (Referenced
from the W. D. Gann website: http://www.wdgann.com/pages/about_gann.php)
36
Harmonic Trading: Volume One

The premise of Gann’s approach should be considered as one of the primary forerunners to
Harmonic Trading. In fact, one of the earliest references to Harmonic Trading was mentioned in
his 1927 book
The Tunnel Thru the Air in which Gann stated:
“But mathematical science, which is the only real science that the
entire civilized world has agreed upon, furnishes unmistakable
proof of history repeating itself and shows that the cycle theory, or
harmonic analysis, is the only thing that we can rely upon to ascer-
tain the future.”
(T
he Tunnel Thru the Air [Pomeroy, WA: Lambert-Gann Publishing,
1927], 77)
Although Gann’s brand of harmonic analysis is more complex, including the use of his
Natural Squares Calculator, both approaches utilize relative geometric price calculations of
cyclical trends in an attempt to define critical turning points in the markets.
Fibonacci Pattern Alignments
Although many price structures may appear similar, they simply are not. The differentiation of
patterns is the underlying basis and primary effectiveness of Harmonic Trading identification
techniques. Like a combination to a safe, Harmonic Trading’s precise Fibonacci price
alignments unlock valid market signals in an unprecedented fashion.
In real trading situations, the specification of similar price structures that possess different
Fibonacci alignments can substantially reduce overall risk. Furthermore, the ability to
differentiate price structures is essential for identifying the best trade opportunities and handling
each situation in the most effective manner. Differentiation is the key to successful Harmonic
Trading, and it begins with the understanding that similar price structures are not the same.
This specification of Fibonacci alignments instills a disciplined approach that requires exact
conditions to be satisfied before trade signals are generated. Although this can create situations
where opportunities are missed if certain patterns do not reverse at the projected completion
point, valid price structures become trade signals only when all conditions are satisfied. Such
strict application of pattern identification techniques removes potentially dangerous and flawed
strategies of flexible interpretations of price action.
One example that will be reviewed later in this book is the difference between a Bat pattern
and an
ideal Gartley pattern. Many people mistakenly believe that these are the same pattern.
They simply are not. A Bat pattern is an entirely different combination of Fibonacci alignments
than the
ideal Gartley. In fact, I have seen e-mails and charting postings on the Internet over
the past few years that frequently identify potential Gartley patterns, when the alignment clearly
possesses a Bat structure. It is an example of strict application of different alignments like this
that sets Harmonic Trading techniques apart from all other Fibonacci methods.
It is important to note that the strict application of any trading system is the primary basis for
consistent performance—good or bad. Although this will be discussed in Chapter 11, “The
Harmonic Trade Management System,” the application of precise harmonic patterns offers a
disciplined and consistent approach to trading.
Chapter 3
Pattern Identification
37

38
Harmonic Trading: Volume One
Another essential principle of Harmonic Trading is founded in the belief that trading signals
come from the market. Since Harmonic Trading utilizes quantifiable price patterns that have
repeated historically, it is important to note that the price action is the determining element to
define trading opportunities. After calculating the relative segments of each price structure,
Harmonic Trading techniques quantify precise zones of potential support or resistance based
upon their prescribed Fibonacci alignments. The price action must satisfy these conditions
before any trading action can be taken. In this manner, it is the market that provides the signals
required to take action.
The completion of patterns as market signals is based upon the notion that each segment
within a particular structure can offer vital information regarding the potential state of future
price action. The premise of Harmonic Trading’s exact Fibonacci alignments that define specific
patterns depends upon the relative measure of price action within each structure. This relative
measure is known as the
Principle of Harmonicity.
Principle of Harmonicity
J. M. Hurst outlined one of the most comprehensive references to Harmonic Trading in his
Cycles Course from the early 1970s. His Principle of Harmonicity states:
“The periods of neighboring waves in price action tend to be relat-
ed by a small whole number.”
(J. M. Hurst, J. M. Hurst Cycles Course [Greenville, S.C.: Traders Press,
1973])
The important concept to grasp is that price waves or distinct price moves are related to
each other. Furthermore, Harmonic Trading techniques utilize Fibonacci numbers and price
patterns to quantify these relationships, and provide a means to determine where the turning
points will occur. From a general sense, the Principle of Harmonicity is the technical term that
explains the basic premise of Harmonic Trading. The “neighboring waves” of price movements
are utilized to identify and calculate potential trading opportunities. Harmonic Trading’s focus
on “neighboring waves of Fibonacci alignments” inherently grounds all trading decisions from
a technical perspective based upon past and future price movements. Not to get into a
long-winded discussion regarding fundamental information such as market news and other
financial media-related stories that might affect the financial markets, the focus of all decisions
within the realm of Harmonic Trading is dependent upon pure price action.
The strict reliance on pure price action to define trading decisions is essential to remain
unbiased and open to all
technical signals that are available. Relative measurements of
“neighboring waves” do provide the necessary signals of potential market turning points.
Harmonic Trading techniques determine market conditions and identify trading opportunities
at price levels where the natural ebb and flow of buying and selling is changing based upon
specific price patterns.

The precise rules that validate all harmonic patterns also create a system that bases all
trading decisions on a defined
technical entity. Specifically, trading decisions that are based
upon individual patterns (the technical entity) fall within precise numeric ranges, where all
elements, such as execution points, stop loss limits, and profit objectives, are defined relative
to the structure.
This understanding that patterns create a “defined trading realm” promotes a sense of
security, as all potential actions are defined in advance by the limits established by the setup
and the price action behavior within this range. These concepts are easily understood with
actual chart examples that will be covered later in this material. For now, it is important to
understand that this approach generates valid trading signals based upon pure price action
that is quantified by Fibonacci measurements and pattern recognition techniques.
Potential Reversal Zone (PRZ)
The concept of a Potential Reversal Zone (PRZ) was originally outlined in
The Harmonic
Trader
:
“History has proven that a convergence of Fibonacci numbers
and price patterns provides a highly probable area for a reversal.…
This area of convergence is called the potential reversal zone.
When three, four, or even five numbers come together within a
specific area, you must respect the high probability for some type
of reversal.”
(
The Harmonic Trader, [Nevada: HarmonicTrader.com, L.L.C., 1999])
Specific price structures that possess three or more numbers within a defined area are the
basis for defining these harmonic zones. It is called “Potential” because the defined area must
be analyzed as the price action tests the projected “Reversal Zone.” Although this concept will
be covered extensively later in this material, it is imperative to understand that patterns are
defined by specific price structures that contain combinations of distinct and consecutive
Fibonacci retracements and projections. By calculating the various Fibonacci aspects of a
specific price structure, harmonic patterns can indicate a specific area to examine for potential
turning points in price action. Again, this area is called the Potential Reversal Zone (PRZ). In
essence, a PRZ represents the critical areas where the flow of buying and selling is potentially
changing. These harmonic zones attempt to identify the price levels where imbalanced
overbought and oversold situations are reversing—at a minimum—back to their respective
equilibrium level.
Any trading system attempts to be on the “right side” of the market—buying low and selling
high. Harmonic Trading techniques quantify these areas and generate buy and sell signals
based on the price action at these turning points. Furthermore, these techniques inherently
define and direct trading behavior as a means of anticipating these potential changes in price
action.
Chapter 3
Pattern Identification
39

From a broader perspective, the identification of harmonic price patterns can offer
tremendous technical insight of the state of price action. Past patterns and historically
significant Fibonacci levels are an effective means of identifying important areas of support
and resistance. Furthermore, each pattern provides additional information regarding the extent
of overbought or oversold conditions in the markets that no other technical method offers.
The PRZ serves as a “harmonic window” that examines a specific price area with respect to
the entire price structure. This concept places a great deal of emphasis on the price action
within these windows of opportunity. Furthermore, the result of the price action in these zones
is another defining element of Harmonic Trading.
From a general perspective, Harmonic Trading requires a
belief that the markets provide the
signals necessary to understand price action. Since all harmonic patterns represent the total
sum of buying and selling relative to prior respective price action, each signal is generated
from the market’s own movements. In this manner, the relative analysis of past price action,
as explained by the Principle of Harmonicity, is essential to define PRZs, to generate trading
signals and to quantify specific structures.
It is important to emphasize that Harmonic Trading utilizes many unprecedented
measurements to define critical areas of support and resistance. Exact alignments of Fibonacci
ratios are the primary methods that validate price structures as harmonic patterns. In fact, the
PRZ is truly a remarkable technical tool that no other method incorporates. Although these
concepts will require some time to grasp and to integrate into your trading strategies, the
Harmonic Trading techniques will always provide critical information regarding the state of
future price action.
40
Harmonic Trading: Volume One

The AB=CD pattern is a 4-point price structure where the initial price segment is partially
retraced and followed by an equidistant move from the completion of the pullback. This
structure has been previously discussed in many technical works, and it represents the basic
foundation for ALL harmonic patterns. The Fibonacci aspects in the pattern should occur at
specific points. In the AB=CD, the C point will be a defining level for the completion of the
pattern. Although the BC projection is critical in this structure, the most significant harmonic
number is the exact completion point of the AB=CD.
AB=CD Reciprocal Ratios
In the AB=CD pattern, the alignment of Fibonacci ratios within the structure usually manifests
specific reciprocal relationships. The reciprocal ratio of the C point retracement of the AB leg
usually indicates which BC projection is utilized to define the Potential Reversal Zone (PRZ).
For instance, a 0.618 retracement at the C point typically will possess a 1.618 BC projection
that converges closest with the completion of the AB=CD. This reciprocal relationship within the
equivalent AB=CD pattern defines the best PRZ for this structure. The reciprocal ratios that
complement the AB=CD structure are as follows:
C Point Retracement
BC Projection
0.382
.24 or 2.618
0.50
2.0
0.618
1.618
0.707
1.41
0.786
1.27
0.886
1.13
The reciprocal ratios help define the completion of the pattern. However, the most
important consideration to remember is that the BC projection should converge closely with
the completion of the AB=CD.
41

The Bullish AB=CD Pattern
The Bullish AB=CD pattern is an excellent measure when looking at a well-defined sell-off.
Although the symmetry may vary, this basic structure is a minimum requirement for all
harmonic patterns (see Figure 4.1).
42
Harmonic Trading: Volume One
B
C
0.382;
0.886
1.13;
3.14
A
D
Figure 4.1
It is important to point out that the “0.382; 0.886” Fibonacci retracement range for the
C point can be any of the Harmonic Trading ratios that fall between these two constraints.
Therefore, the C point can be 0.382, 0.50, 0.618, 0.707, 0.786, or 0.886. Referring to the
reciprocal ratios listed on the previous page, this correlates into a BC projection that can either
be a 1.13, 1.27, 1.41, 1.618, 2.0, 2.24, or 2.618. In some rare cases, a 3.14 projection can
be utilized.
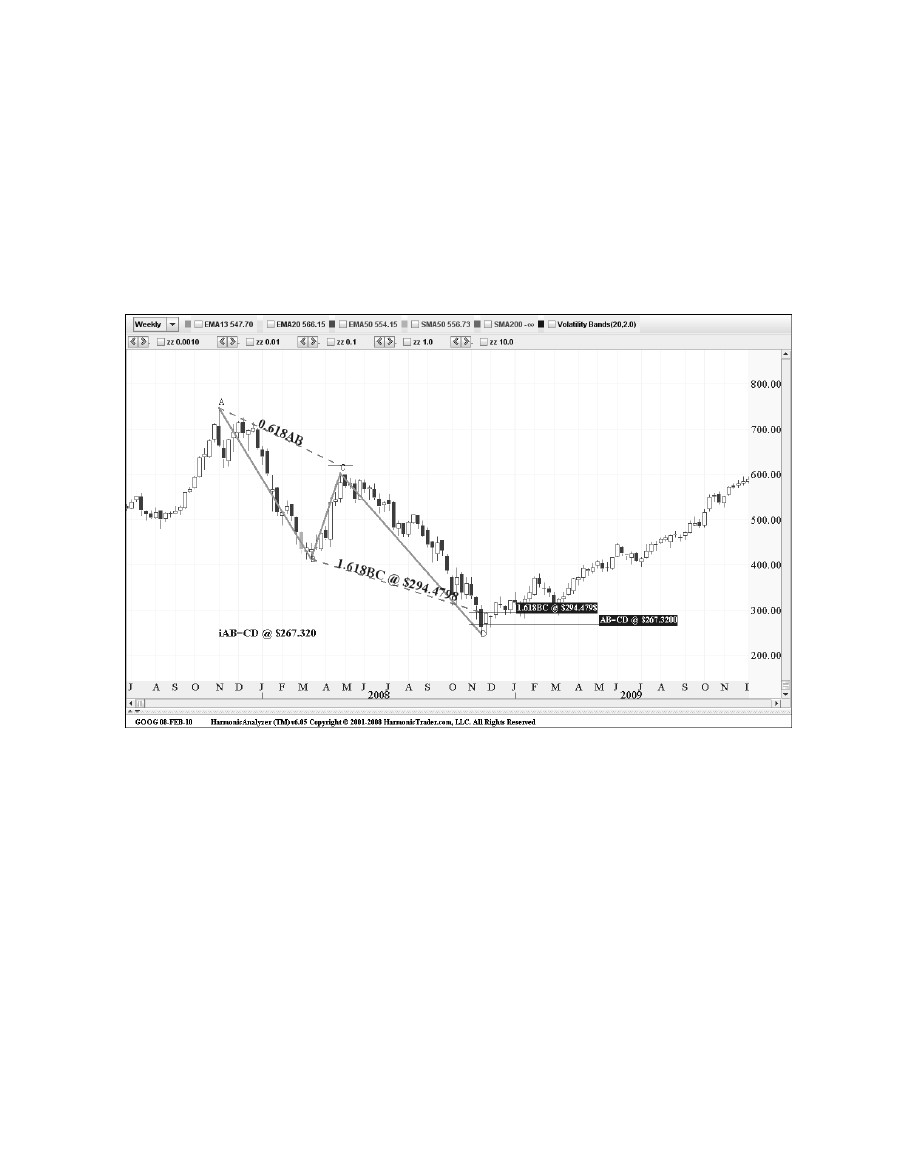
Google (GOOG): Weekly
The first example of this weekly chart of Google (GOOG) shows a distinct Bullish AB=CD
pattern with the completion point calculated at 267 (see Figure 4.2). The 1.618 BC projection
complimented this area at 295. The pattern defined a Potential Reversal Zone (PRZ) of 30
points to buy the stock. Each price leg was approximately 300 points and required 6 months to
complete.
Chapter 4
The AB=CD Pattern
43
Figure 4.2
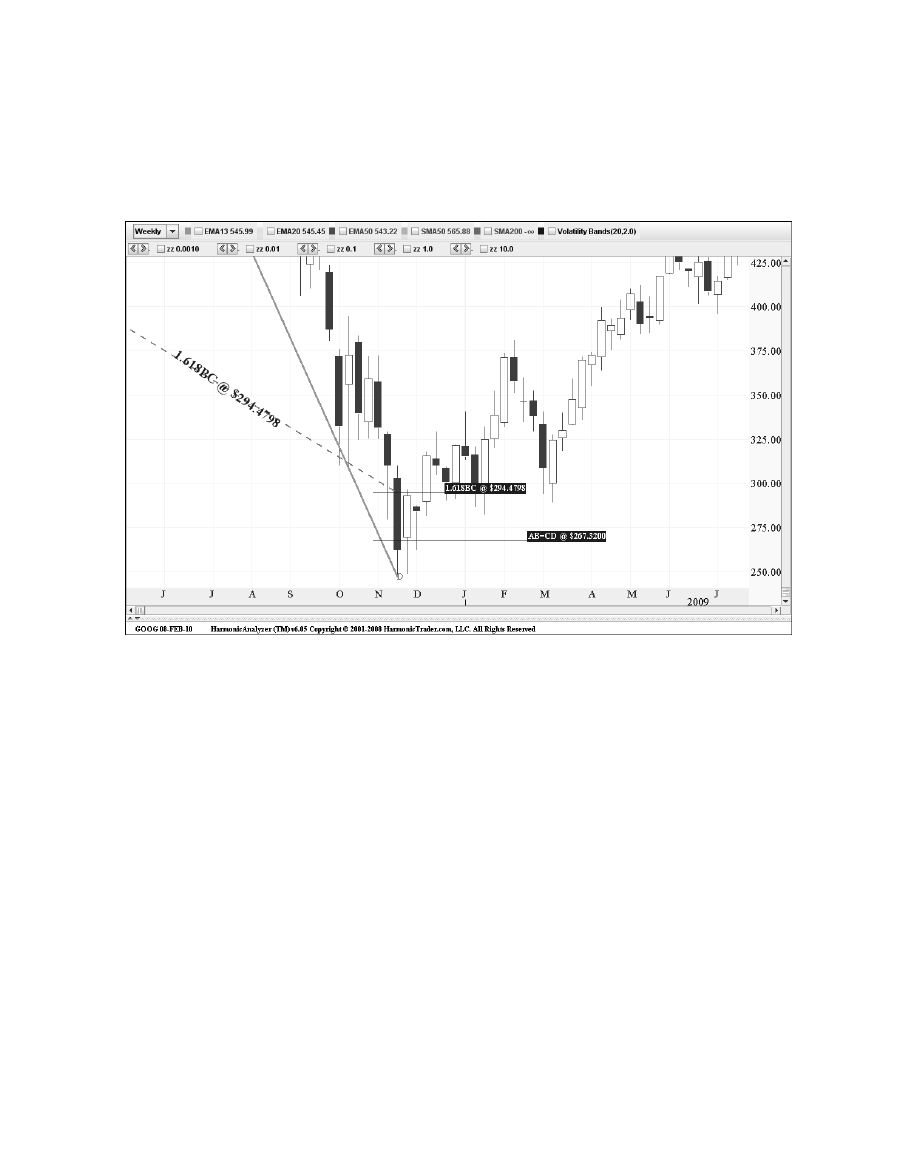
44
Harmonic Trading: Volume One
The following chart of the price action in the PRZ shows an ideal reversal from this support
level (see Figure 4.3). On the first week Google hit the numbers in the PRZ, the stock stabilized
in the lower range of support. The stock held its ground and rallied nicely to reverse the
downtrend. The following week, the upside breakout was confirmed.
Figure 4.3
This example illustrates an ideal reversal. When looking at a PRZ, it is important for the
price action to turn in the area where the harmonic numbers define the situation. Clearly, this
pattern identified a distinct support zone in the $265–290 area. The entire PRZ was tested and
the price action reversed accordingly. Furthermore, the ability of Google to hold the low of the
initial weekly test of the entire PRZ and rally above this projected support are excellent signs of
a valid reversal at hand. This example is remarkable due to the precise symmetry and length of
time that this pattern possessed. Each down leg required 6 months to complete and extended
nearly 350 points. Although Google exceeded the exact completion point at 267, as the stock
threatened to test the psychological 250 level, the price action stabilized the week following the
complete test of the weekly PRZ.
When assessing the validity of a PRZ, it is important to examine the specific range to define
where harmonic patterns complete. Although the exact completion of the Bullish AB=CD
pattern completed lower than the 1.618 extension, both numbers defined the area under 300 to
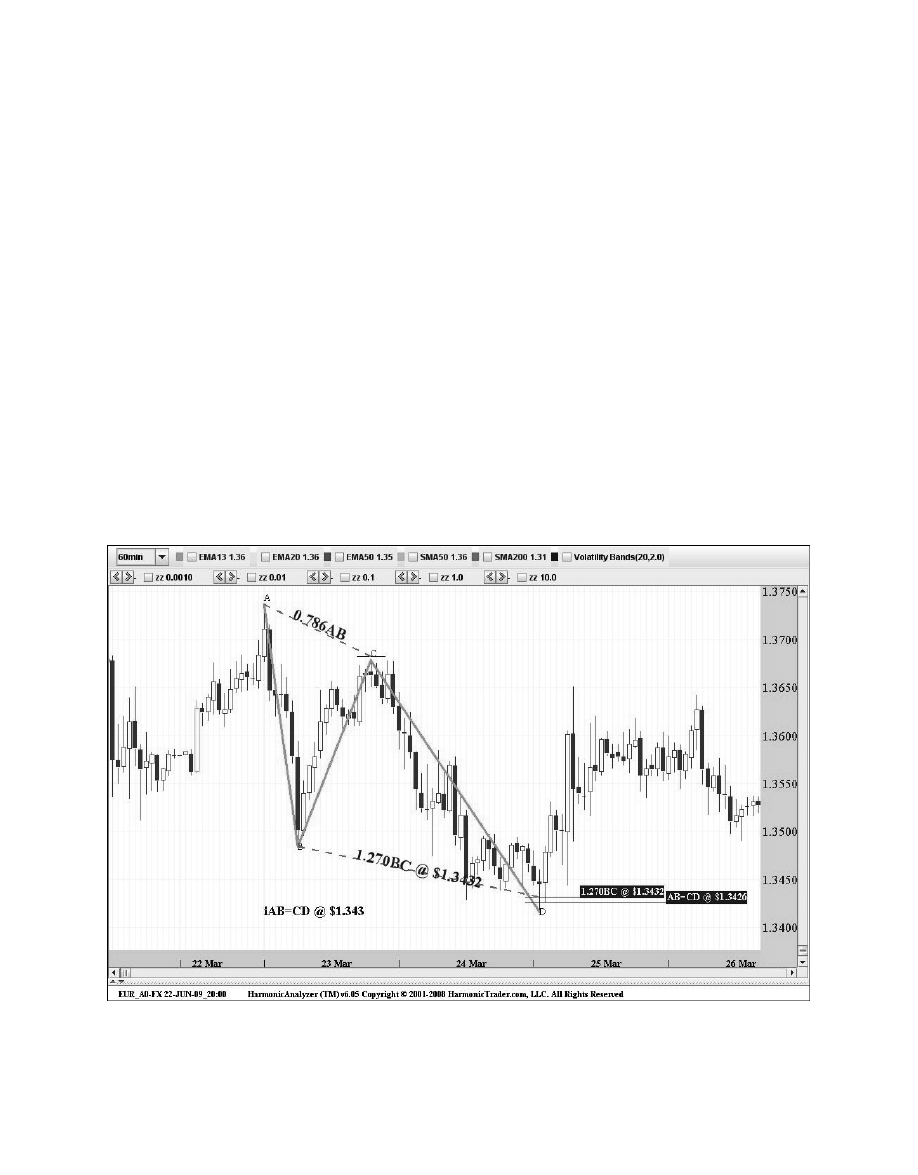
look to buy the stock. In these situations, the AB=CD completion point is the most important
number of the pattern. In fact, the completion point of the AB=CD pattern should serve as a
mandatory requirement before executing a trade. The 1.618 BC projection should complement
the completion point area to validate the pattern. The key is to closely monitor the price action
in the PRZ and look for the predominant downtrend to stabilize in the overall range defined by
the PRZ. In the AB=CD pattern, trades will be executed close to the exact pattern completion
point but the validity of the setup will be determined shortly after PRZ is tested.
Eurodollar
(EUR_A0-FX): 60-Minute
Figure 4.4 is an example of the 60-minute chart of the Eurodollar (EUR_A0-FX) shows a
distinct Bullish AB=CD pattern with the completion point calculated at 1.3426. The 1.27 BC
projection complemented this area at 134.32. Again, it is important to consider the range
defined by the PRZ. In this case, the AB=CD completion point at 1.3430 was the trigger for the
setup. After selling off for nearly the prior three sessions, the Euro clearly stabilized before
completing the reversal.
Chapter 4
The AB=CD Pattern
45
Figure 4.4
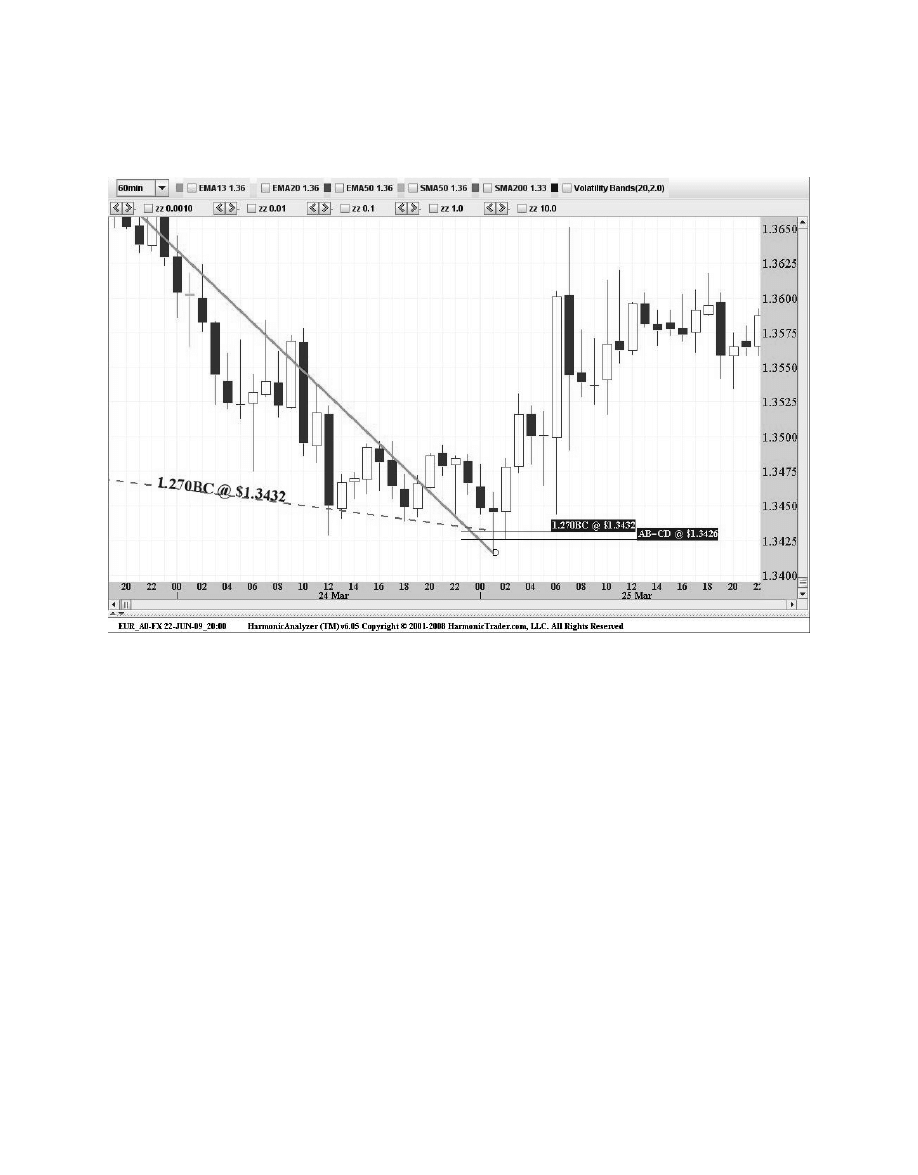
Figure 4.5
Although the reversal required some consolidation to reverse the downtrend, the harmonic
support identified critical support just under 1.3430. It is important to note that the ideal, exact
AB=CD reversal are very obvious situations. However, the validity of any reversal depends upon
the price action in the PRZ after all the numbers have been tested. Sometimes, a valid reversal
is automatic. The price action hits the harmonic numbers and reverses nicely. In other
instances, the situation may require some consolidation. Despite the time required, the focus
should remain on the defined range in the PRZ after the numbers have been tested. In this
manner, the PRZ creates a distinct window to examine and to assess the validity of the
structural signal provided the pattern.
46
Harmonic Trading: Volume One
The following chart of the price action in the PRZ shows the reversal at the numbers in this
harmonic support area (see Figure 4.5). After two tests of the PRZ, the price started to turn up.
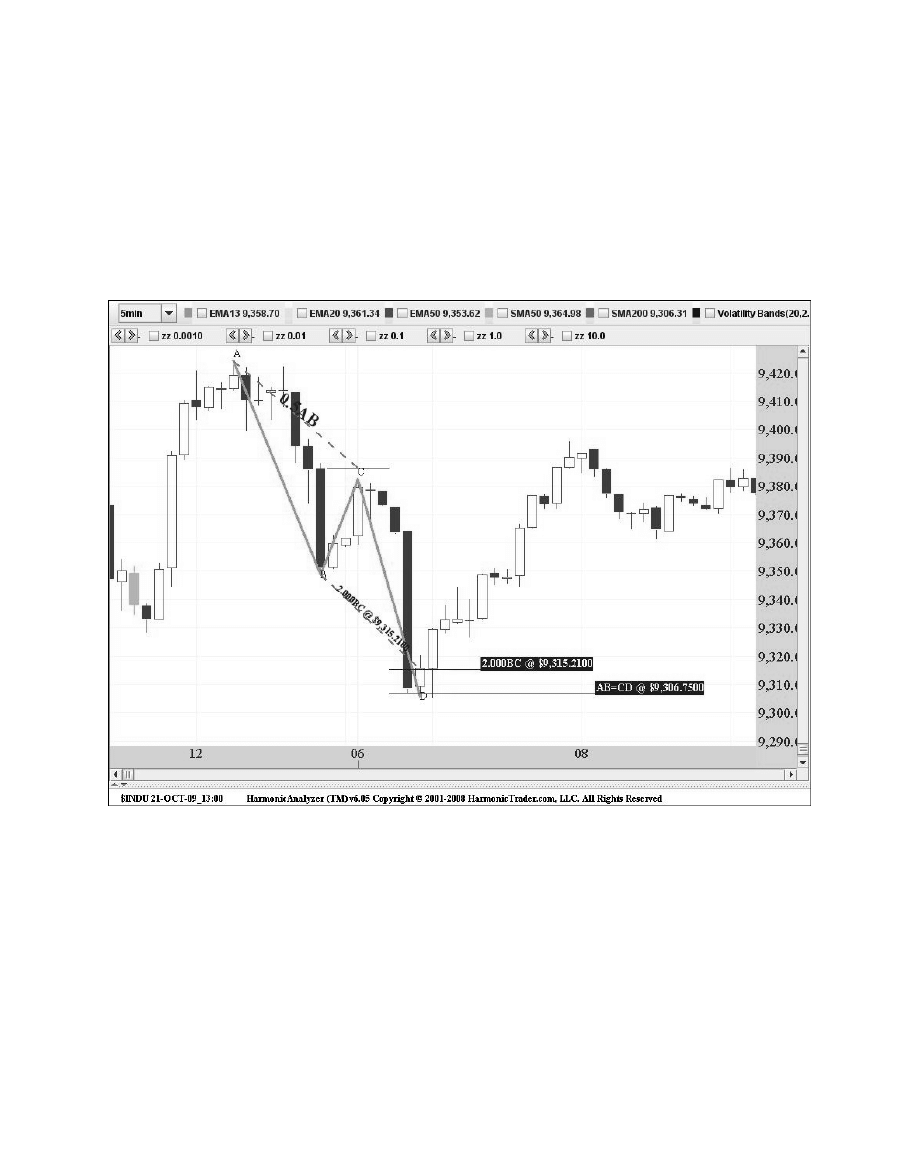
Dow Jones Industrial Average
($INDU): 5-Minute
Figure 4.6 shows an exact Bullish AB=CD pattern in the Dow Jones Industrial Average on this
5-minute chart. The Industrials formed this intra-day pattern with nearly identical time and exact
price components. Each down leg was approximately 70 points. The AB leg required 8 price
bars, while the CD leg entailed 7 price bars.
Chapter 4
The AB=CD Pattern
47
Figure 4.6
The completion point of the AB=CD pattern was calculated at 9306.75. The 2.0 BC
projection complemented this area at 9312.21. The following chart of the price action in the
PRZ shows the near-perfect reversal on the complete test of this support. After dropping more
than 70 points early in the session, the $INDU hit the completion point of the pattern just above
9300 and started to stabilize.
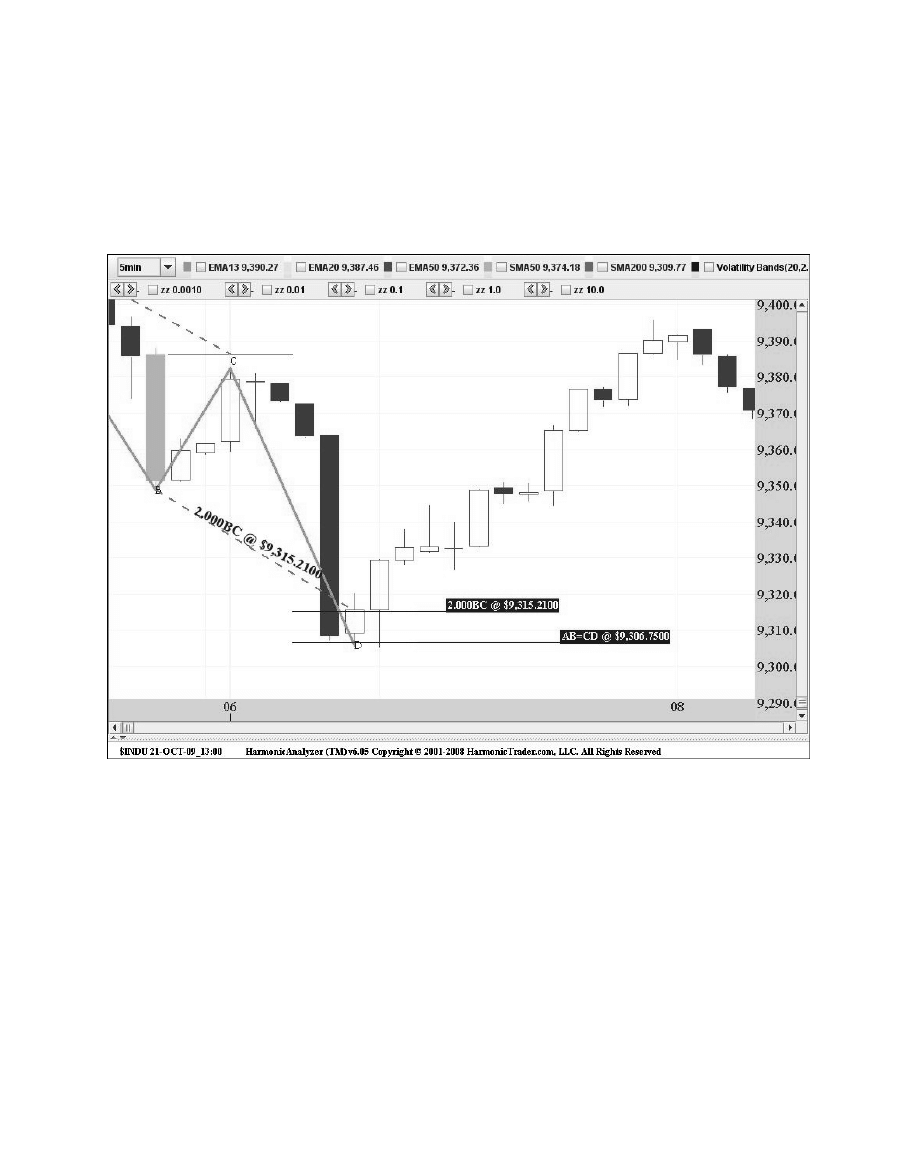
Although the initial test nearly hit all the numbers in the PRZ, the third price bar was the
clear trigger for the reversal. Figure 4.7 demonstrates the technical importance of the entire
PRZ. The index stabilized on the initial test of this projected harmonic support before yielding a
nice intra-day rally. The next several 5-minute price bars confirmed the reversal at hand, as the
upside continuation indicated the strength of the pattern’s completion point.
48
Harmonic Trading: Volume One
Figure 4.7
Another consideration is the sharp decline into the PRZ. Although the severe price action
was a warning sign of a potential pattern failure, the ability of the index to stabilize immediately
after hitting the PRZ is a strong factor in the validity of successful reversal. Not to mention, the
reversal accelerated immediately after the AB=CD completion point was hit.
These are ideal signs of a valid reversal regardless of the timeframe. Although this was a
5-minute chart, the same principles apply for longer timeframes—60-minute, daily, weekly. The
same technical principles should be assessed to determine the validity of a reversal from a PRZ.
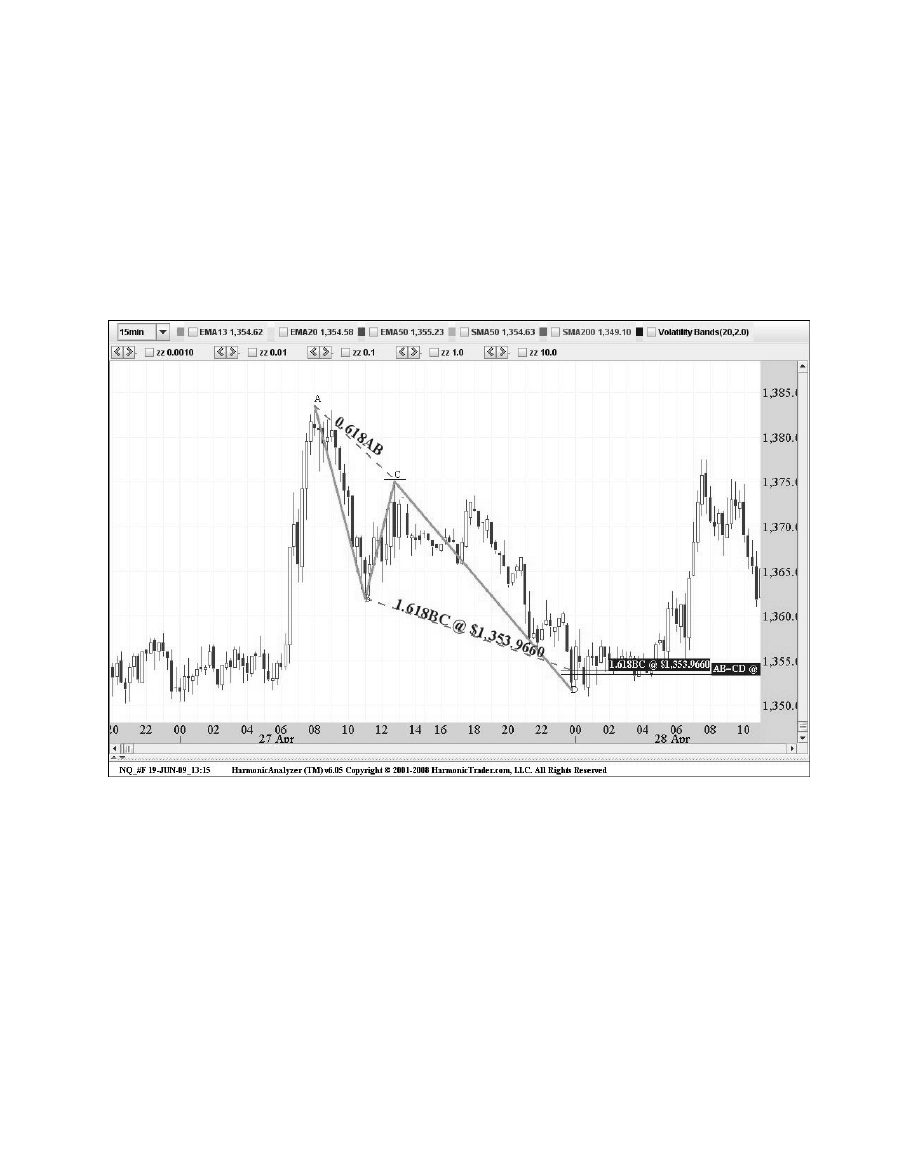
NASDAQ Mini-Contract
(Continuous)—(NQ_#F): 15-Minute
Figure 4.8 of the NASDAQ 100 Continuous Mini-contract exemplifies the ideal stabilization in
the PRZ that valid patterns can demonstrate. The NQ possessed a considerable AB=CD
pattern on this 15-minute chart. The BC projection converged in nearly the exact area as the
completion point of the Bullish AB=CD. Both numbers defined the 1353 area as important
intra-day support.
Chapter 4
The AB=CD Pattern
49
Figure 4.8
The PRZ in this example required several tests to validate the harmonic support. In these
situations, the price action will require some consolidation to resolve the prior downtrend before
reversing. Although this concept will be thoroughly discussed in Chapter 11, “The Harmonic
Trade Management System,” it is important to consider the time required for a valid reversal
is typically relative to the size of the pattern. In this example, the price action stabilized as it
tested all of the numbers in the PRZ. Despite the consolidation, the Bullish AB=CD pattern
clearly identified the precise area for a long position.
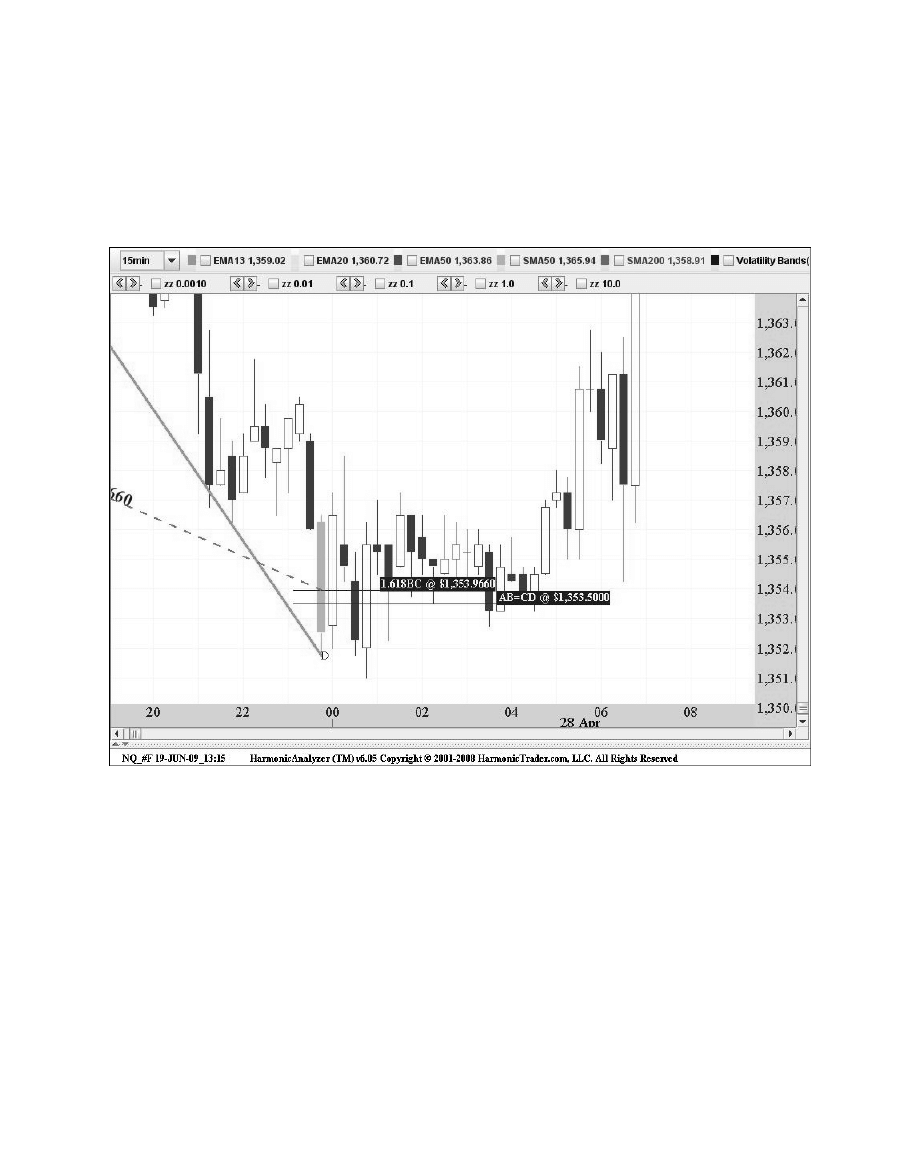
Figure 4.9 shows the price action at the completion point of the pattern. Despite a somewhat
severe decline into the PRZ, the 1.618 BC projection complemented the AB=CD at the 1353
level. The price action bottomed after testing all the numbers in the Bullish AB=CD Potential
Reversal Zone. This situation provided ample opportunity to get long in this area, as the NQ
reversed nicely from the completion of this pattern.
50
Harmonic Trading: Volume One
Figure 4.9
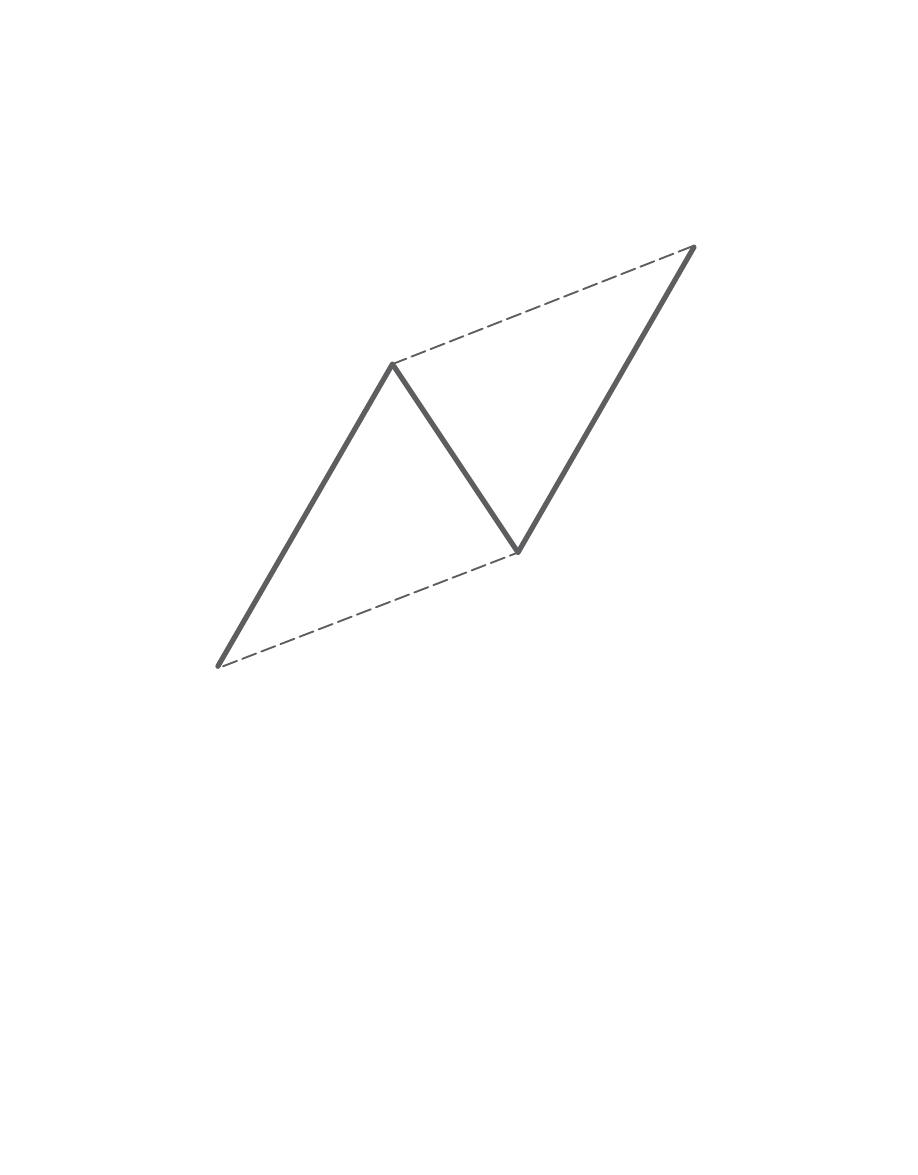
The Bearish AB=CD Pattern
The Bearish AB=CD should possess a distinct symmetry with the completion point of the
pattern complementing the BC projection and defining a precise PRZ (see Figure 4.10).
Chapter 4
The AB=CD Pattern
51
B
C
0.382;
0.886
1.13;
3.14
A
D
Figure 4.10
Again, it is important to point out that the “0.382;0.886” Fibonacci retracement range for
the C point can be any of the Harmonic Trading ratios that fall between these two constraints.
Therefore, the C point can be 0.382, 0.50, 0.618, 0.707, 0.786, or 0.886. Referring to the
reciprocal ratios, this correlates into a BC projection that can either be a 1.13, 1.27, 1.41,
1.618, 2.0, 2.24, or 2.618. In some rare cases, a 3.14 projection can be utilized.
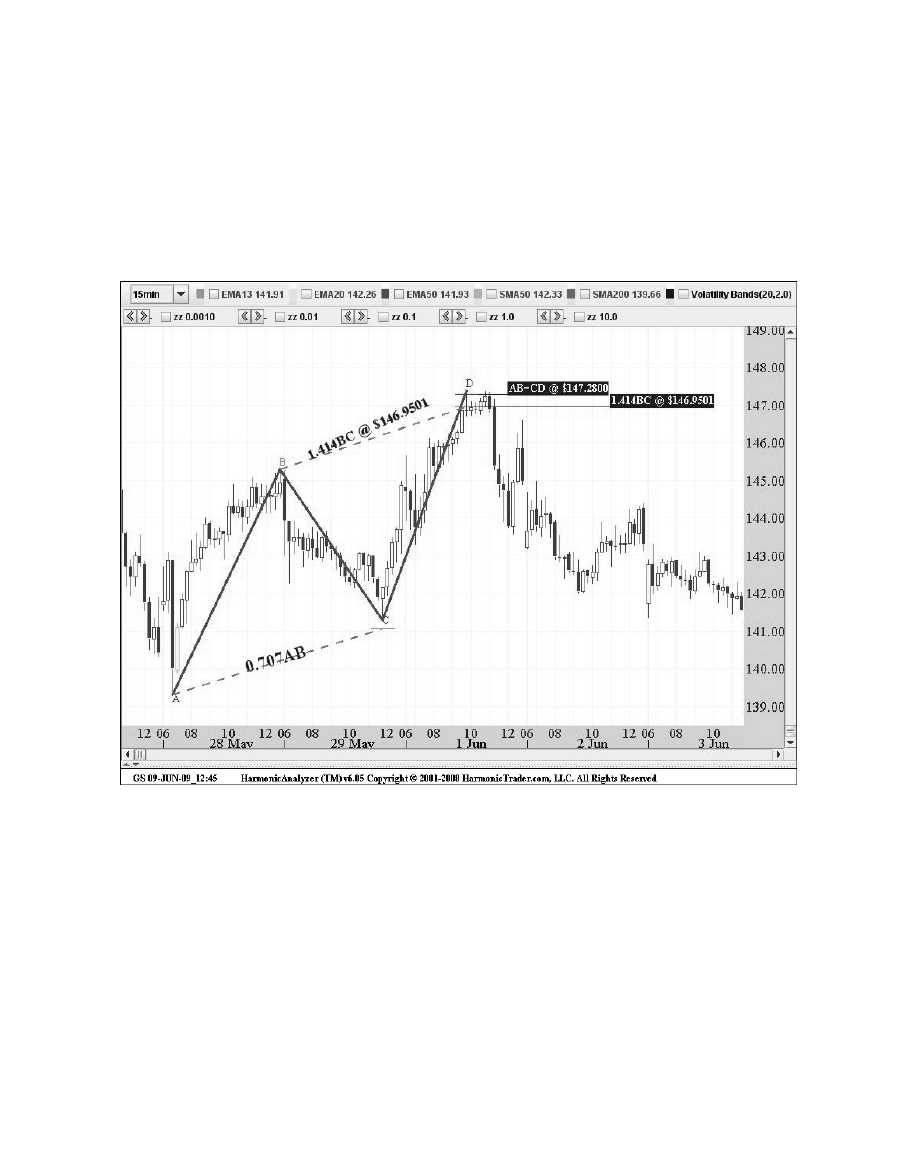
Goldman Sachs
(GS): 15-Minute
This example of an intra-day chart of Goldman Sachs (GS) illustrates the ideal Bearish AB=CD
structure (see Figure 4.11). The completion point of the pattern was calculated at 147.28 with
the 1.41 BC projection complementing this area at 146.95.
52
Harmonic Trading: Volume One
Figure 4.11
These two numbers defined the 147 area as critical short-term resistance. It is important to
note that the stock reversed after the AB=CD completion point was tested. Although the BC
projection was an important calculation within the PRZ of the pattern, the completion of the
equivalent AB=CD structure was the defining limit. The chart of the price action in the PRZ
shows the near-perfect reversal just above the PRZ at 147.
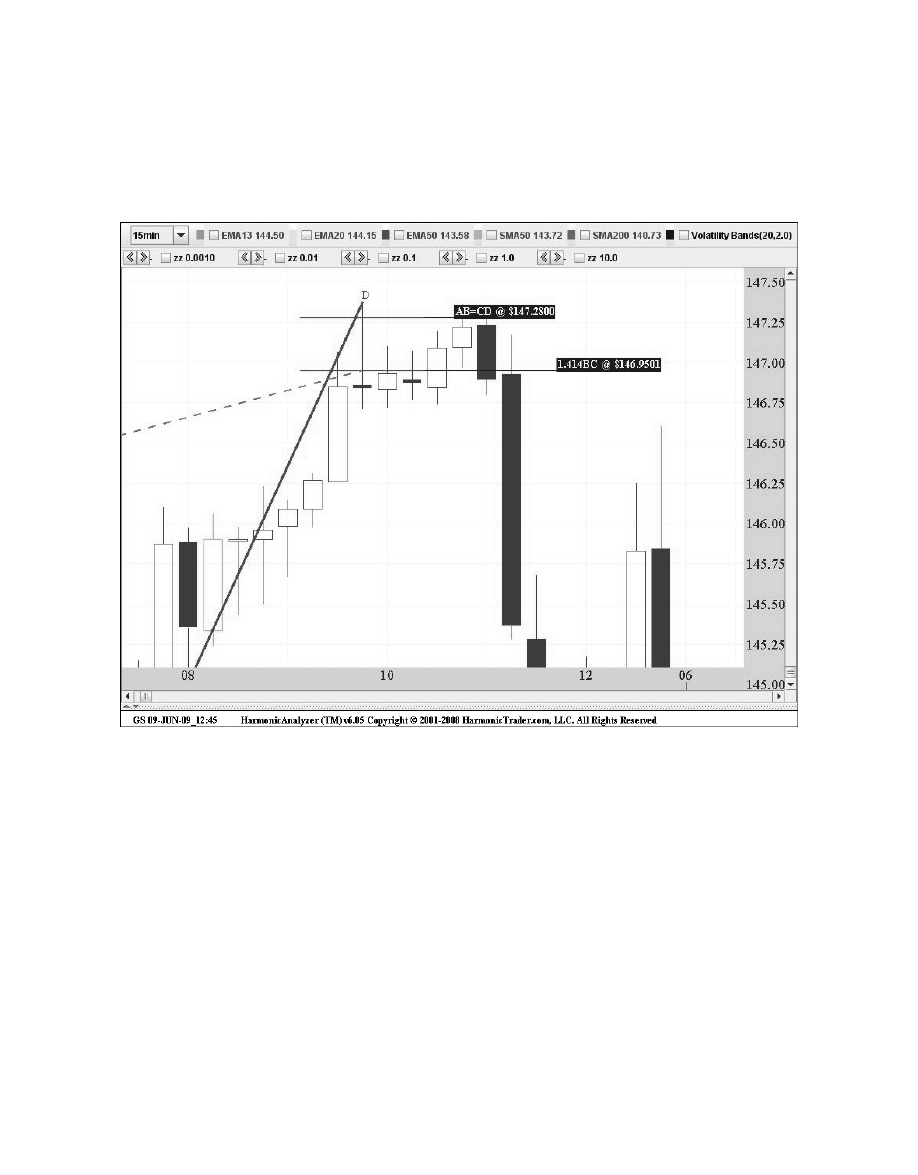
Chapter 4
The AB=CD Pattern
53
The stock stalled after testing the entire PRZ and reversed several price bars later, as
it stalled at the pattern’s completion point (see Figure 4.12). This is another ideal reversal
scenario. The price action in the PRZ clearly defined the do-or-die window of opportunity to
short the stock.
Figure 4.12
Although Harmonic Trading employs a variety of patterns to define potential reversal points,
the same technical principles apply in the determination of price action in the PRZ. This case
illustrates the ideal reversal situation and should be studied closely. In addition, the same
principles apply, regardless of the timeframe. This example was a 15-minute intra-day chart.
But, the same assessments of the price action stalling in the PRZ would relate if this was a
60-minute or weekly chart. The only difference is that the time considerations are obviously
longer.
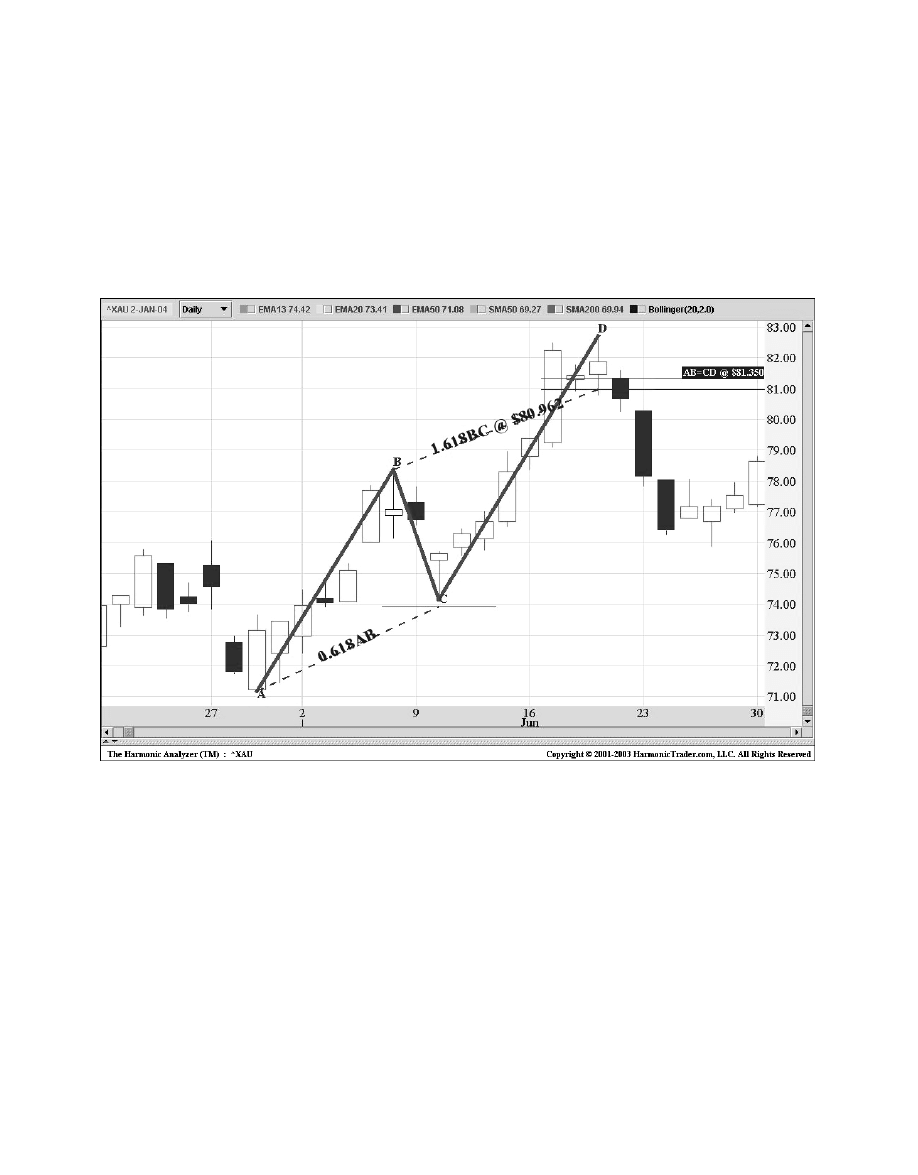
Philadelphia Gold and Silver Mining Index
(^XAU): Daily
This daily chart in Figure 4.13 illustrates the effectiveness of distinct AB=CD patterns. Not to
mention, harmonic patterns can be found in all markets—especially commodities. Gold can be
extremely harmonic, as price action seems to respect Fibonacci levels more precisely than
other markets.
54
Harmonic Trading: Volume One
Figure 4.13
This daily chart exemplifies the elements and the effectiveness of Bearish AB=CD patterns.
The XAU formed this pattern with the first leg (AB) requiring seven days, followed by a
near-perfect 0.618 C point retracement and a CD leg that totaled eight days to complete. The
PRZ in this situation was precise with the AB=CD completion point serving as the top limit of
the range at 81.35. The XAU reversed 1 point above this level. Although this was not an exact
reversal from the pattern completion point, the tight PRZ and distinct AB=CD structure with the
perfect 0.618 and 1.618 ratios define this pattern.
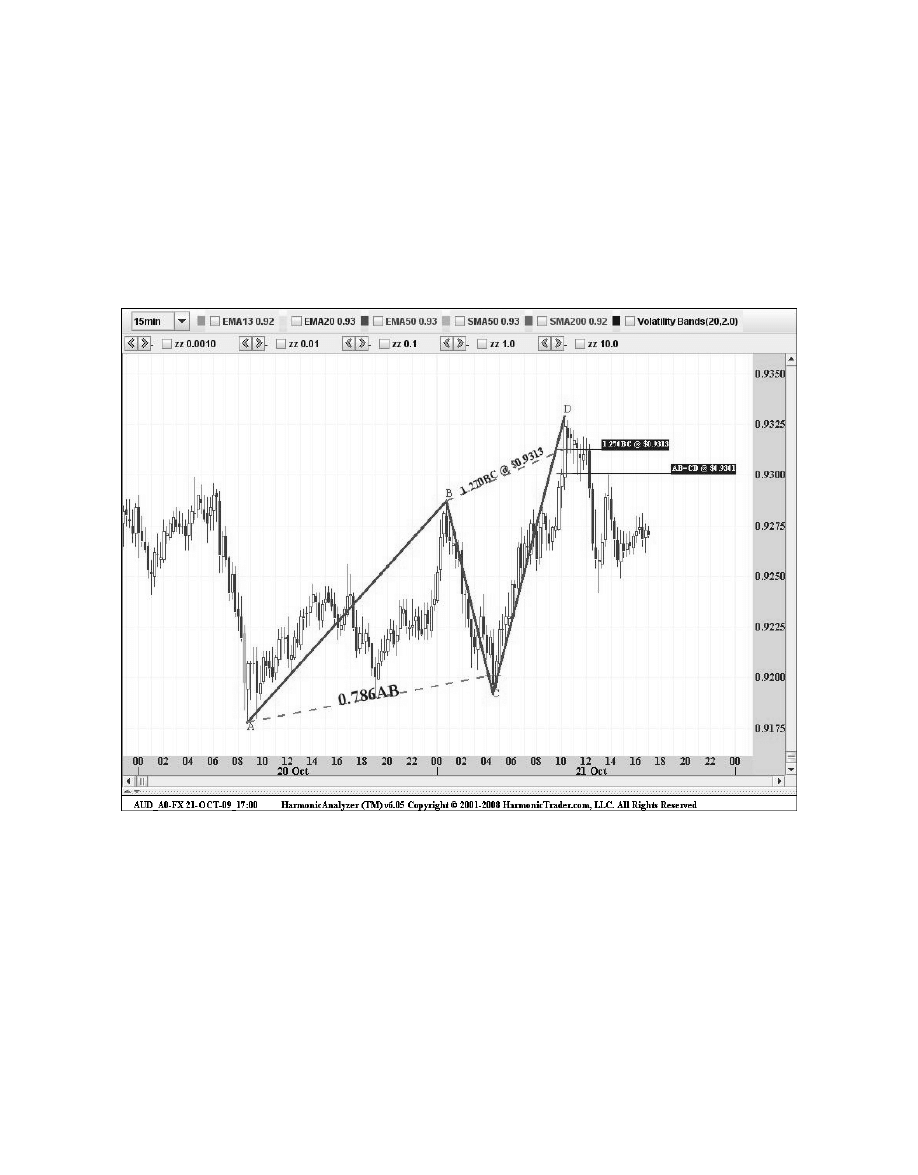
Australian Dollar
(AUD_A0-FX): 15-Minute
This example of the Australian Dollar (AUD_A0-FX) shows a distinct Bearish AB=CD pattern
that defined an excellent short-term currency trade (see Figure 4.14). The completion point of
the pattern was calculated at 0.9301 with the 1.27 BC projection complementing this area at
93.13.
Chapter 4
The AB=CD Pattern
55
Figure 4.14
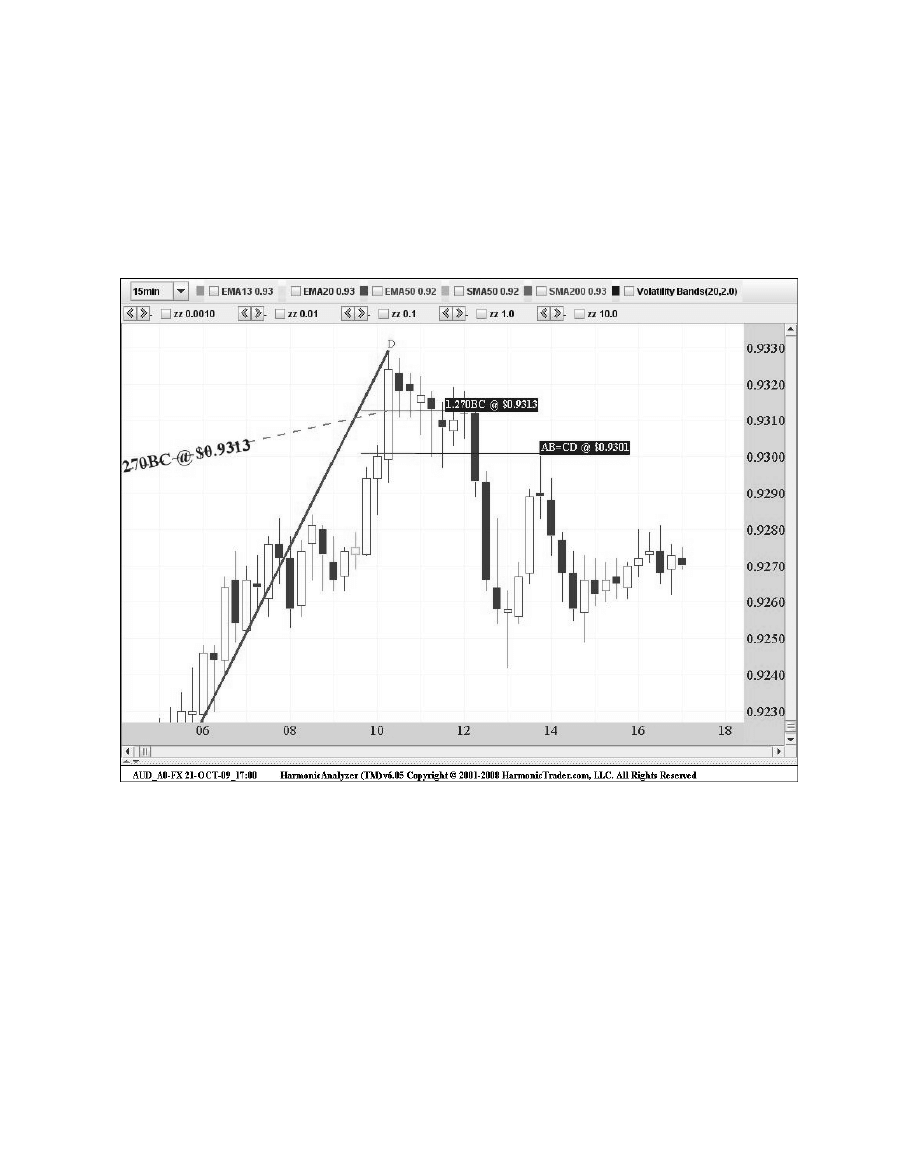
Figure 4.15
This example possesses several interesting aspects that many valid reversals manifest.
The pattern was clear and the completion point was well defined. The distinct change in the
price action in the Potential Reversal Zone (PRZ) exemplified the impending change of the
predominant trend. The stalling price action in the PRZ is typical of a valid reversal. In this
case, the AUD possessed a tight range of numbers just above 0.93 to get short.
56
Harmonic Trading: Volume One
The Aussie $ formed this pattern over the course of two full sessions where each up leg
was approximately 100 pips. The setup clearly indicated initial short-term resistance just
above the general 0.93 area. After rallying sharply up to the PRZ, the price action stalled at
the numbers and showed signs of resistance. In fact, the price action failed to follow through to
the upside after testing all of the numbers in the zone. Figure 4.15 shows the reversal after the
price action tested the entire area.
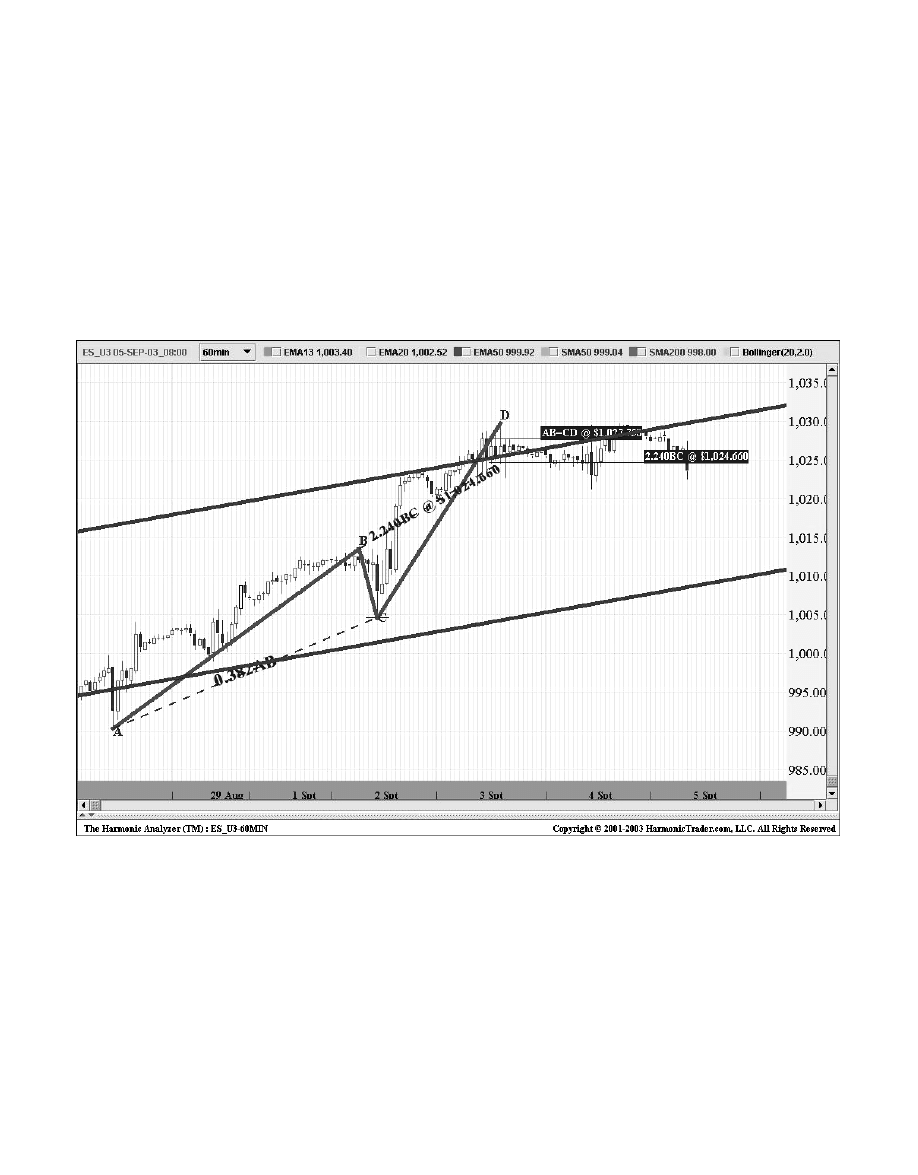
Standard and Poor’s 500 September 2003
Mini-Contract (ES_U3): 60-Minute
A few years ago, I provided a daily advisory service. I would identify potential trades by
outlining the various critical ratios and patterns that were near completion. The next examples
are from these reports and reflect actual trading situations. These reports can be referenced on
HarmonicTrader.com. Furthermore, these demonstrate a real-time application of this approach.
These examples both show intra-day Bearish AB=CD patterns in the S&P 500 September 2003
Mini-contract (ES).
Chapter 4
The AB=CD Pattern
57
Figure 4.16

I trade the minis regularly and frequently utilize the AB=CD patterns as a means of defining
intra-day pivot points. On this day, the ES formed an intra-day Bearish AB=CD pattern with the
completion point at 1023.75 and the 2.24 BC projection at 1024.65. The next chart of the price
action in the Potential Reversal Zone (PRZ) clearly shows the roll over at the completion point
of the Bearish AB=CD at 1027.75.
For the daily commentary on the website, I posted a note before the market opened. Based
upon the pattern at hand, I identified a distinct short-term trading opportunity in the Standard
and Poor’s 500 Index Mini-contract. On this particular morning, I was assessing the Bearish
AB=CD pattern that identified a selling opportunity in this PRZ. Before the market opened on
September 4th, I wrote:
“For today’s immediate action, the ES is off 2
1
⁄
2
. The ES will likely
attempt to retest the Bearish AB=CD at 1028 and fill today’s upside
gap. This should offer an early shorting opportunity.
With the ES testing the top range of the bullish channel, I would
look for the ES to correct this week’s rally off this resistance for a
move to test this Bullish AB=CD at 1020. This area is also prior har-
monic resistance of this Bearish AB=CD at 1020 acting as support.”
(HarmonicTrader.com, 09/04/03; http://www.HarmonicTrader.com/
members/harmonic/home/miniroom090403.htm)
58
Harmonic Trading: Volume One
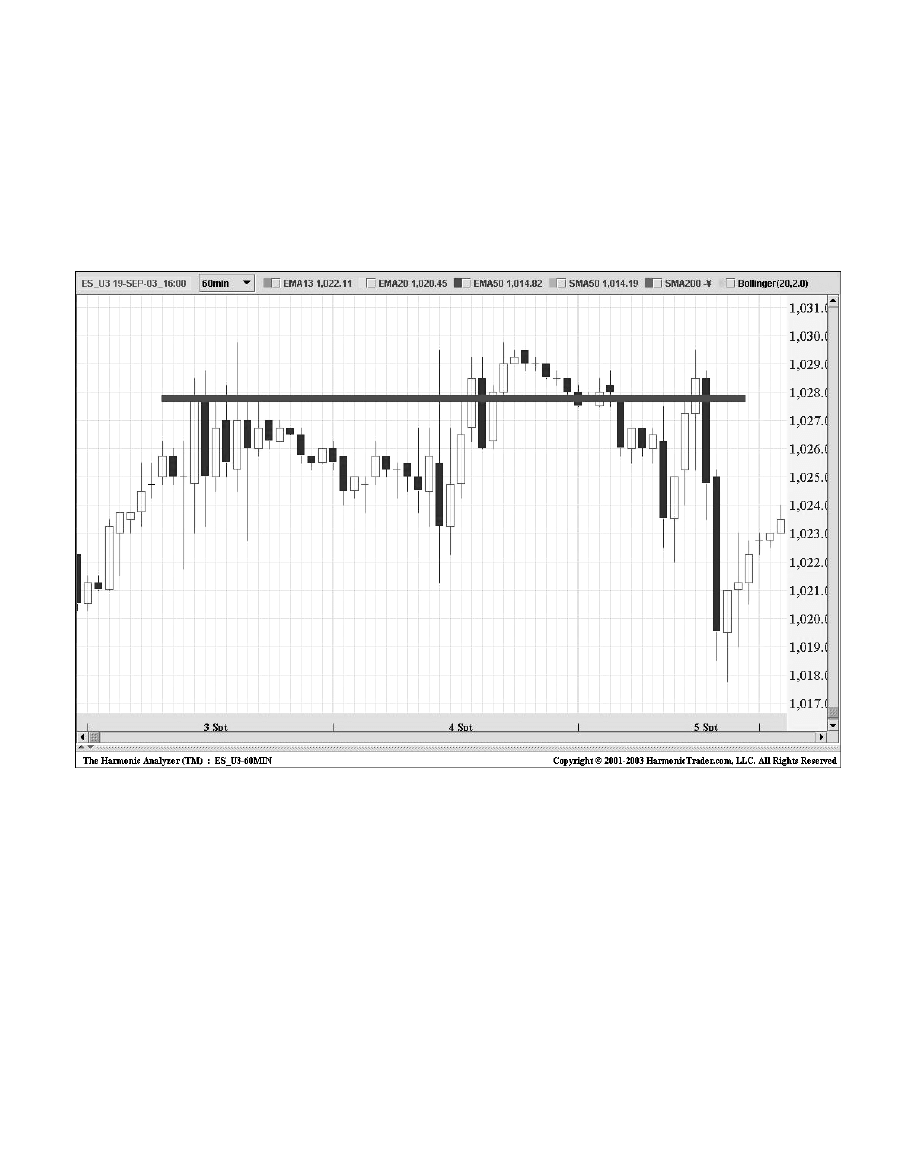
Chapter 4
The AB=CD Pattern
59
Figure 4.17
I realized that this Bearish AB=CD pattern was valid short-term resistance because of the
initial action at the PRZ. The first test of the PRZ on the prior day held firm, as the 1028 area
defined precise short-term resistance. Although a secondary retest of this PRZ was required,
the pattern clearly defined the ideal area to sell.
The chart in Figure 4.17 of the price action in the PRZ shows the resistance experienced
by the ES over the course of three days (September 3–5, 2003). The Bearish AB=CD pattern
indicated the area to sell the ES, and the price action tested this resistance three times before
the ultimate reversal. On the day of September 4, the ES rallied back to retest the Bearish
AB=CD completion point at the 1028 level. By the following day, the ES hit the 1020 profit
target outlined in the previous morning’s report.
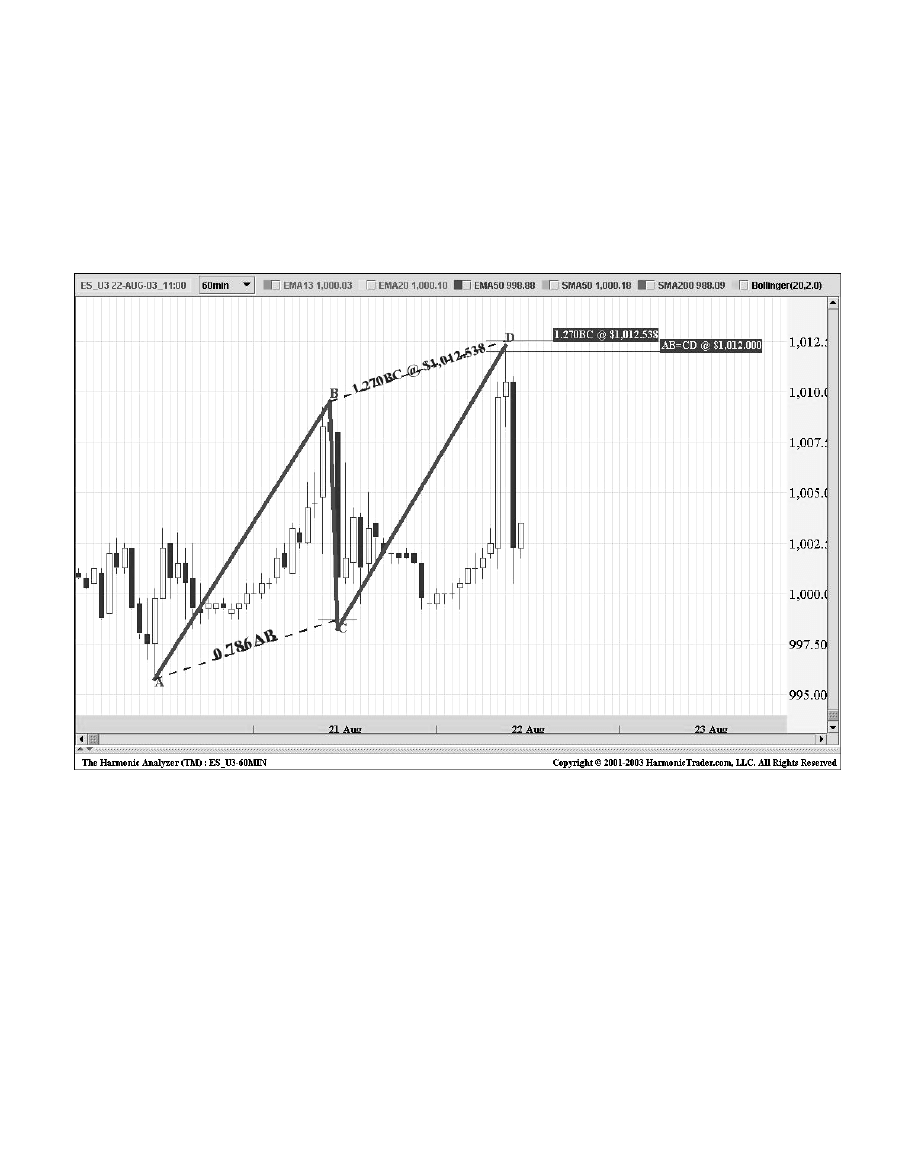
60
Harmonic Trading: Volume One
It is important to note that multiple tests of a distinct PRZ are common, especially in
short-term trading situations like these. Furthermore, multiple tests of harmonic patterns
can serve to confirm support and resistance levels. This was the case with the ES.
The next 60-minute chart of the Standard and Poor’s 500 September 2003 Mini-Contract
(ES_U3) shows another distinct Bearish AB=CD that reversed sharply from the completion
point of the pattern (see Figure 4.18).
Figure 4.18
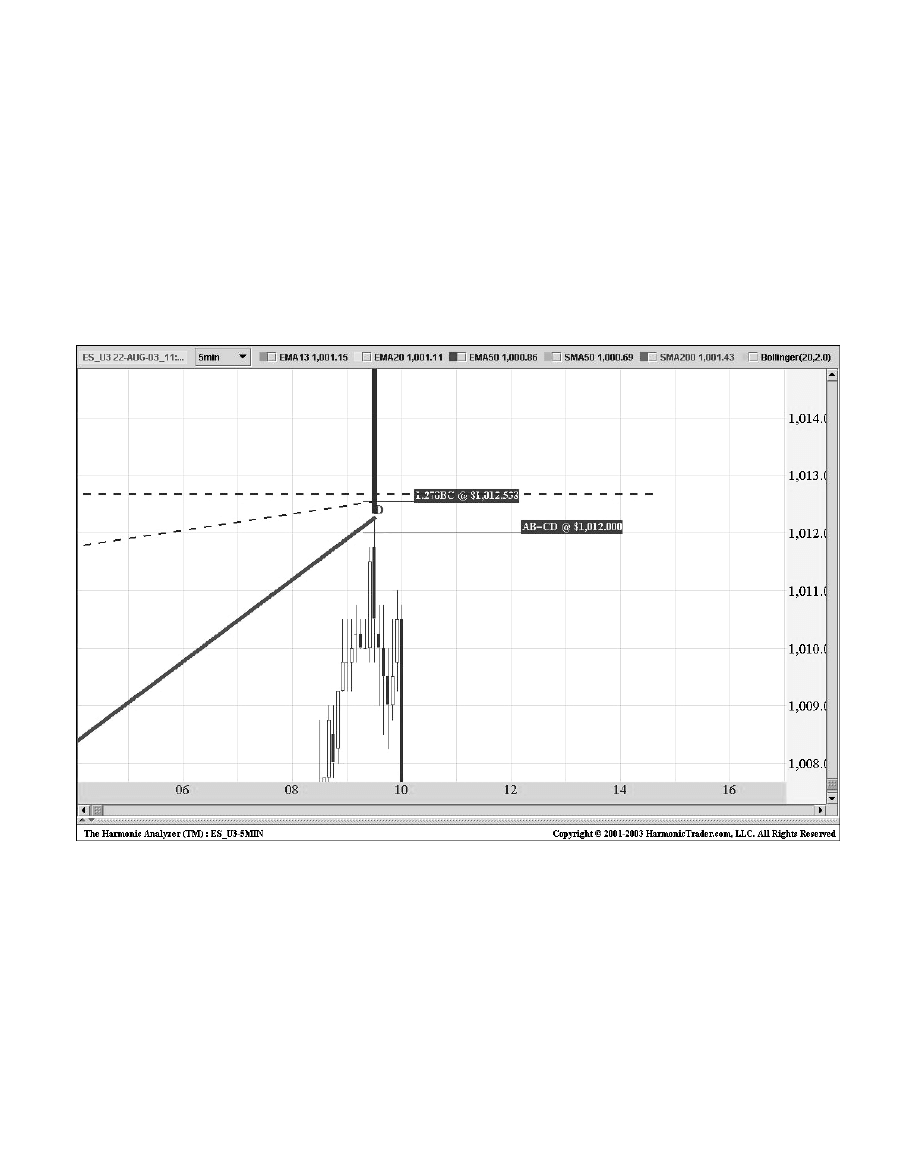
The chart in Figure 4.19 of the price action in the PRZ shows a precise reversal
1
⁄
4
point
above the completion of the pattern. Although the peak fell shy of the 1.27 BC projection at
1012.50, the pattern clearly indicated that the 1012 area was a selling opportunity.
A sharp reversal like this can be difficult to catch sometimes. This example demonstrates the
precision that Bearish AB=CD patterns possess, especially on intra-day time intervals, although
long-term situations can be as precise. The key is to identify the pattern’s completion point and
to execute trades in the PRZ. The most important aspect is to focus on the price action after
the entire zone has been tested. A valid reversal should clearly begin to stall at the numbers
and change the direction of the predominant trend.
Chapter 4
The AB=CD Pattern
61
Figure 4.19
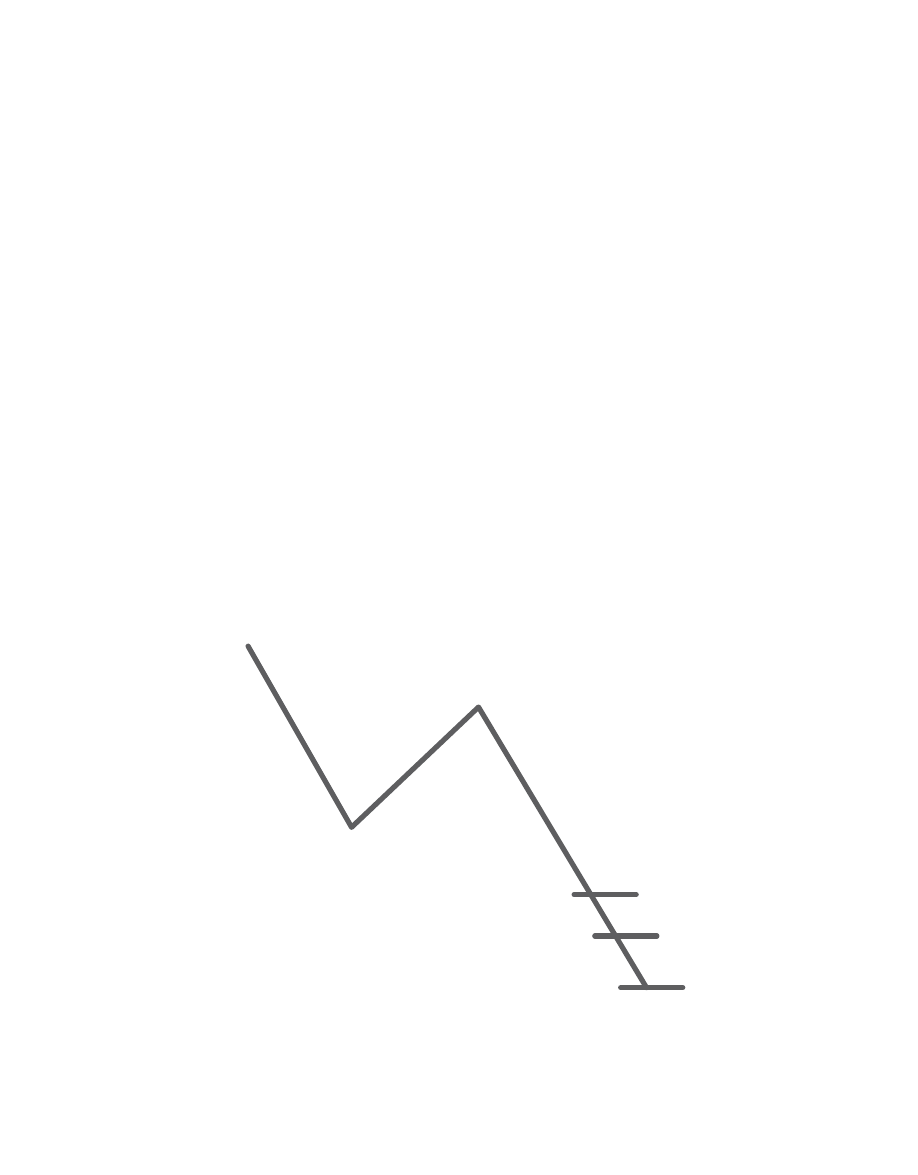
Alternate AB=CD Patterns
Since the AB=CD pattern is the basic framework of all harmonic patterns, it is an essential
consideration in defining any Potential Reversal Zone (PRZ). Although the AB=CD equivalent
patterns have been utilized by technicians for quite some time, the idea of an alternate
calculation to define other harmonic patterns was originally outlined in
The Harmonic Trader.
Alternate patterns provide an effective means of complementing other significant Fibonacci
calculations, especially when the equivalent AB=CD is not relevant for a particular setup.
The Alternate AB=CD pattern differentiates similar structures, as well.
Alternate Bullish AB=CD Pattern
The Alternate Bullish AB=CD pattern (see Figure 4.20) typically develops in patterns like the
Bullish Crab and the Bullish Butterfly in extended sell-offs. However, the Alternate AB=CD
pattern is merely a complementary measure relative to other Fibonacci numbers in the PRZ.
In addition, equivalent AB=CD patterns usually possess more significant completion points than
the alternate structures. The 1.618 AB=CD pattern is utilized less frequently than the other
AB=CD combinations. Despite the variations, each AB=CD measurement, when applied to
correct the harmonic pattern can define precise reversal areas and offer an effective means
to quantify price structures.
62
Harmonic Trading: Volume One
C
A
D
1618AB=CD
AB=CD
1.27AB=CD
B
Figure 4.20
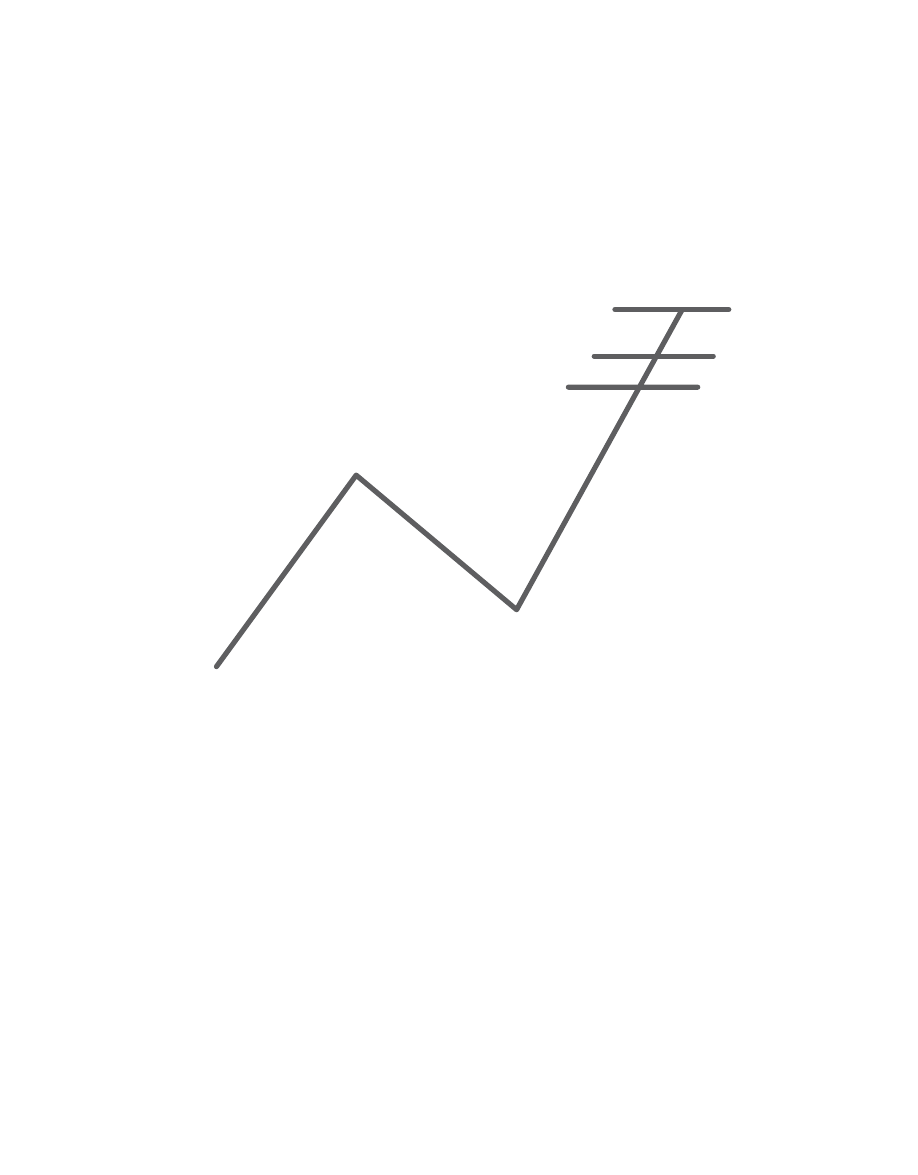
Alternate Bearish AB=CD Pattern
It is important to note that the AB=CD pattern—equivalent or alternate—is the basis for all
harmonic structures (see Figure 4.21). In most setups, the equivalent AB=CD pattern is a
minimum requirement before entering a trade. When combined with other significant Fibonacci
retracements and projections, the AB=CD pattern can define excellent reversal areas.
Chapter 4
The AB=CD Pattern
63
AB=CD
C
B
D
A
1.27AB=CD
1.618AB=CD
Figure 4.21
The alternate variations the AB=CD are frequently found in those patterns with an extended
CD leg. Unlike a Gartley, which utilizes an equivalent AB=CD, the Bat structure typically
experiences an Alternate 1.27 AB=CD pattern. These two similar patterns require completely
different AB=CD conditions to validate their respective structures. However, this degree of
differentiation increases the validity of pattern identification techniques and reduces the overall
risk by defining the most precise PRZ.
The Perfect AB=CD Pattern
The Perfect AB=CD pattern is primarily defined by the C point that should be a precise 0.618
retracement of the AB leg. Ideally, the B point should be tested but not exceeded measurably.
The 0.618 C point retracement sets up the 1.618 BC projection. Although a 1.618 extension
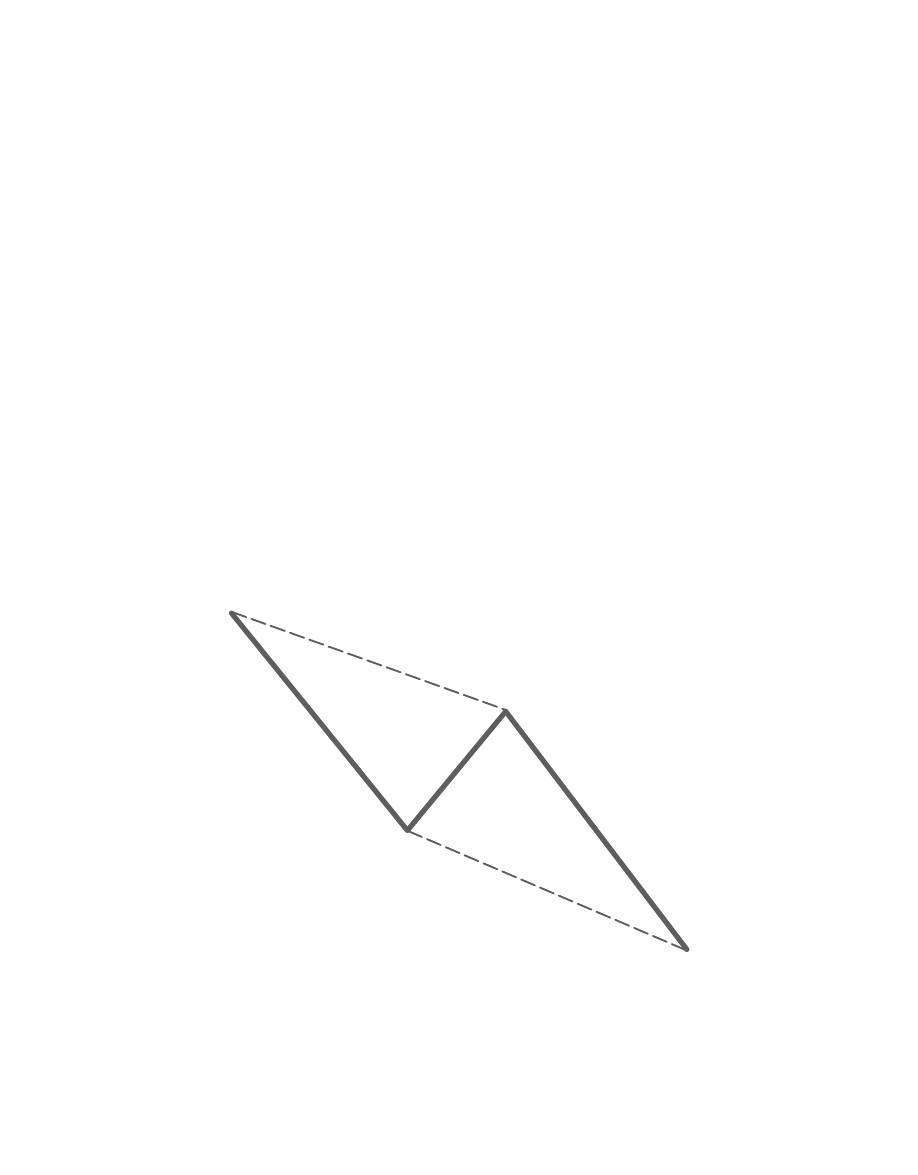
usually indicates an extreme area from a Fibonacci perspective, these frequently yield
significant reactions, especially in perfect AB=CD patterns.
These structures are typically quite symmetrical and possess the most ideal of geometric
structures. For obvious reasons, the 0.618 and 1.618 within the perfect AB=CD pattern repre-
sent the most harmonic ratios that are directly derived from the Fibonacci sequence. Another
aspect of the perfect AB=CD pattern is the general time consideration, where each leg should
be exactly equivalent in duration. Although an exact time length for each price leg is not
required, each segment of the pattern should be distinctly symmetrical.
1.
Precise 0.618 C point retracement of the AB leg
2.
1.618 BC projection
3.
Equivalent time duration for each leg
The Perfect Bullish AB=CD Pattern
The perfect Bullish AB=CD pattern is usually a distinct structure that adheres to a precise
symmetry and mandatory Fibonacci pivot points (see Figure 4.22). The AB=CD completion
point should be the lowest number in the PRZ and converge in the same area with the
1.618 BC projection.
64
Harmonic Trading: Volume One
C
A
D
0.618
1.618
B
Figure 4.22
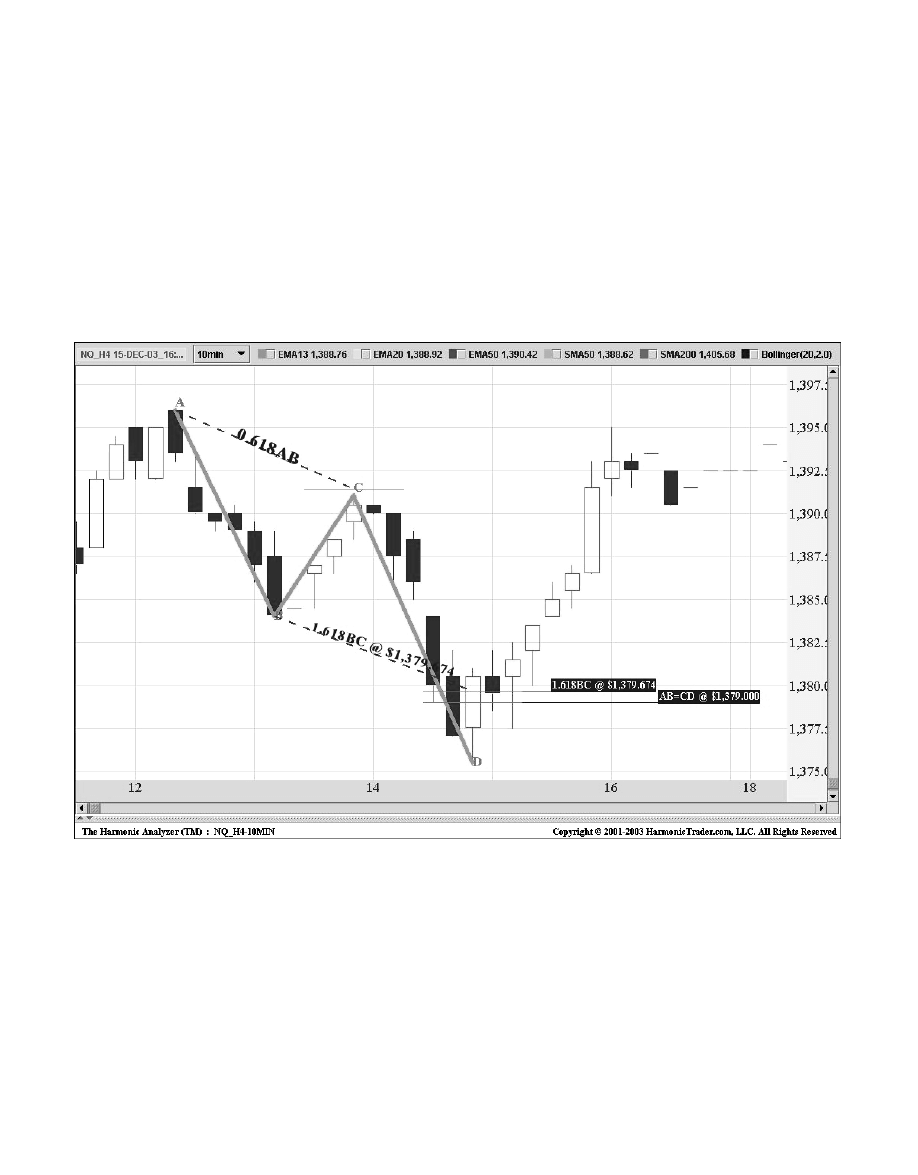
NASDAQ 100 March 2004 Mini-Contract
(NQ_H4): 10-Minute
The chart in Figure 4.23 is a clear example of a perfect Bullish AB=CD pattern with the
completion point calculated and the 1.618 BC projection converging within a tight range. In
addition, the symmetry of the pattern is distinct. In this case, each down leg (AB, CD) was
six 10-minute bars. It is important to note that the AB=CD completion point at 1379 was the
defining limit in the PRZ. In a perfect Bullish AB=CD, the completion point of the AB=CD should
sit below the 1.618 XA projection.
Chapter 4
The AB=CD Pattern
65
Figure 4.23
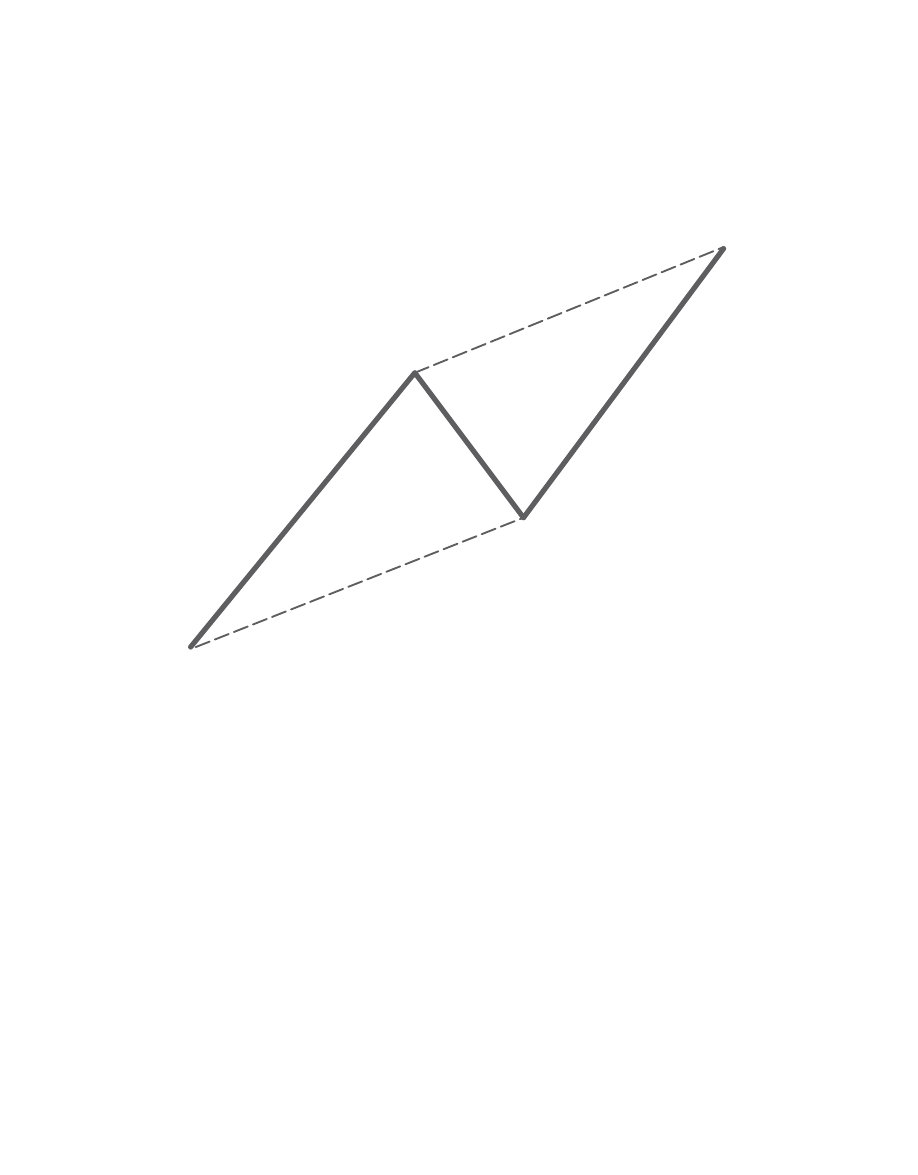
The Perfect Bearish AB=CD Pattern
The perfect Bearish AB=CD pattern is a distinct structure that adheres to precise Fibonacci
pivot points (see Figure 4.24).
66
Harmonic Trading: Volume One
D
C
1.618
A
B
0.618
Figure 4.24
The AB=CD completion point should be the highest number in the PRZ and converge in a
precise area as the 1.618 BC projection. The C point must be at a 0.618 retracement, which
also establishes the reciprocal 1.618 BC projection. The perfect Bearish AB=CD pattern is an
excellent harmonic setup that frequently develops on intra-day time frames. In many of the
futures markets, a perfect Bearish AB=CD commonly marks intra-day highs.
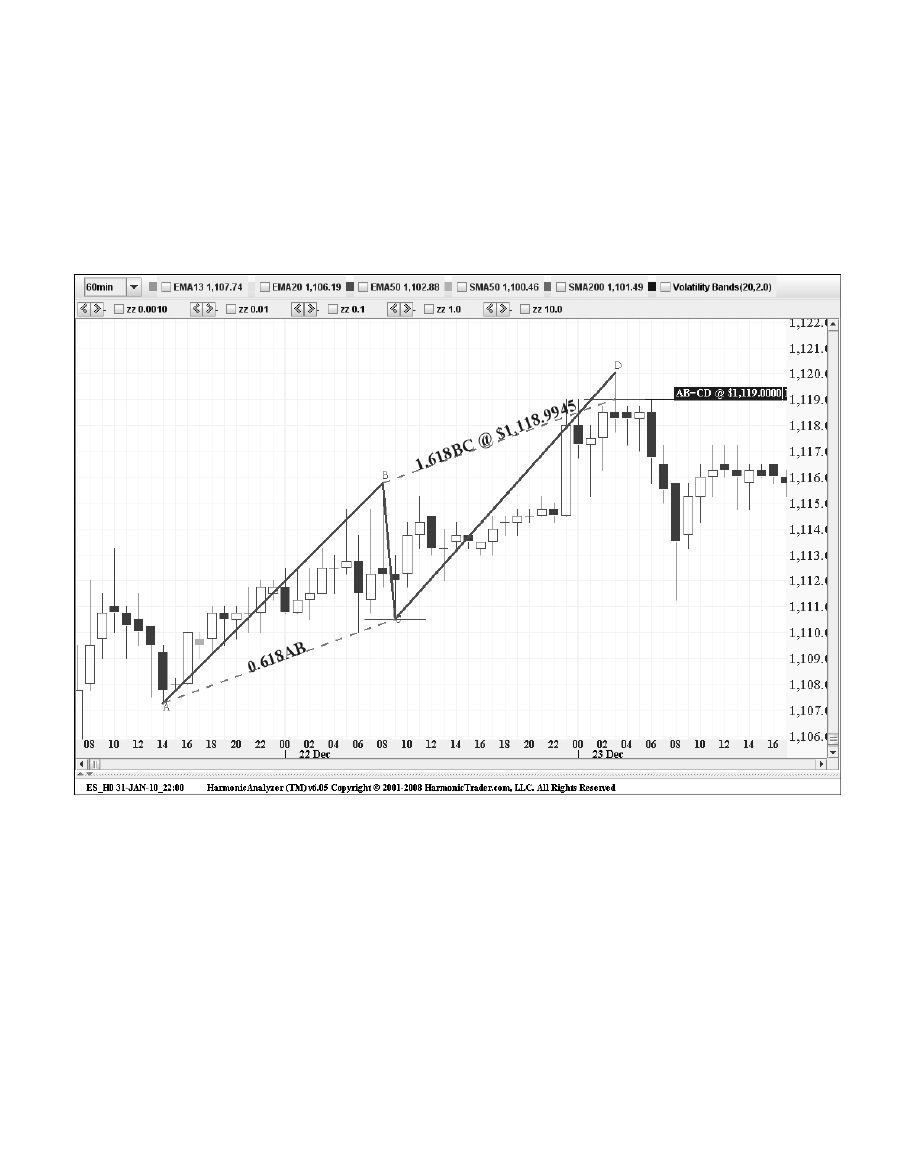
Figure 4.25
Chapter 4
The AB=CD Pattern
67
Standard and Poor’s 500 March 2010
Mini-Contract (ES_H0): 60-Minute
This perfect Bearish AB=CD defined a tight PRZ on the 60-minute chart (see Figure 4.25).
The symmetry of the structure was perfect, as the ES formed this pattern with each leg (AB)
requiring 18 days to complete.
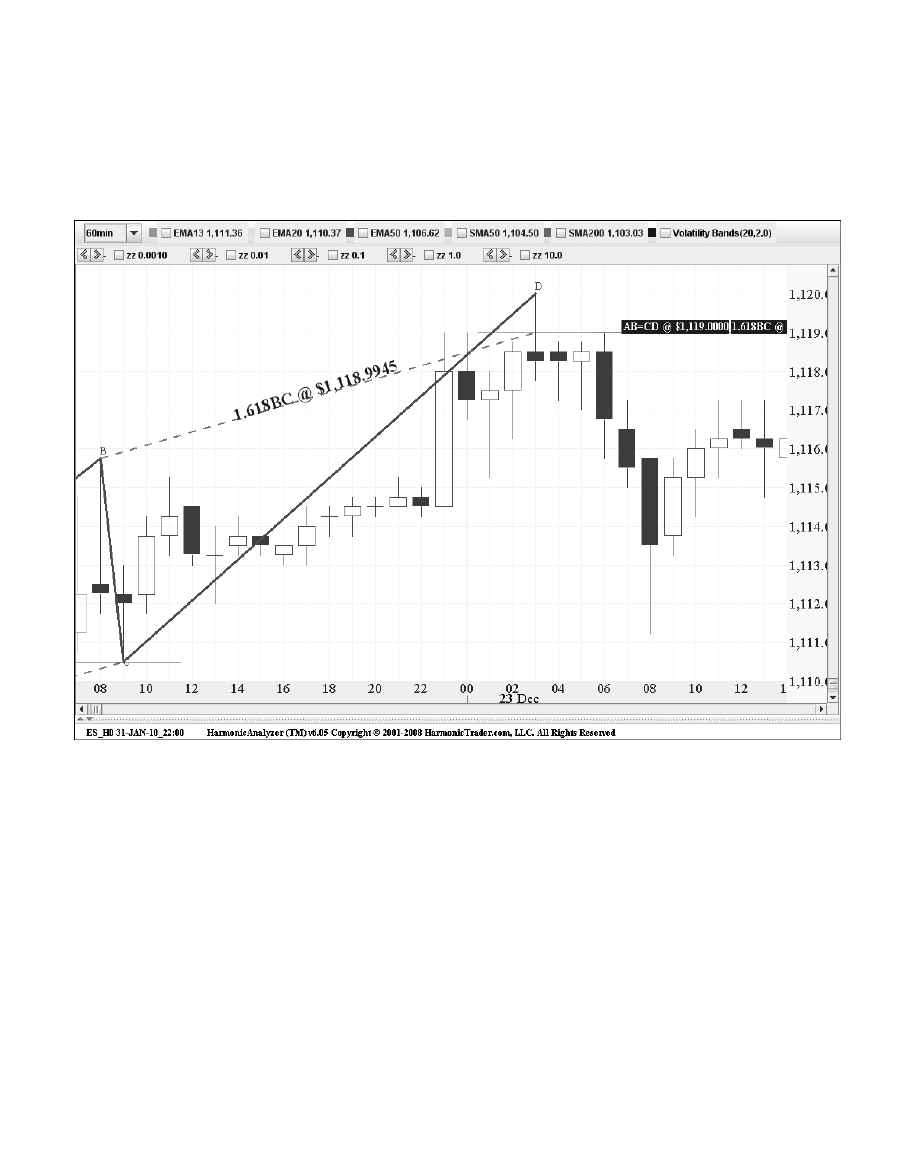
The next chart of the price action in the PRZ shows the sharp reversal from the completion
of this pattern (see Figure 4.26). It is important to note that the AB=CD completion point at
1119 was the defining limit in the PRZ. In a perfect Bearish AB=CD, the completion point of the
AB=CD should sit above the 1.618 XA projection.
68
Harmonic Trading: Volume One
Figure 4.26
In this case, the numbers that defined the PRZ completed precisely at the same price level.

The AB=CD Pattern Summary
Although the basic AB=CD structure may possess a variety of Fibonacci ratios, the concept of
support or resistance at the completion of two distinct and consecutive price legs is the
essence of all harmonic patterns.
Alternate AB=CD patterns underscore the importance of using the basic structure to define
the completion of specific patterns. In either AB=CD, the BC projection should complement the
completion point of the pattern. It is important to remember the reciprocal relationships of the
C point to the BC projection. A perfect AB=CD utilizes the 0.618 retracement and 1.618 exten-
sion, as the most harmonic alignment of Fibonacci ratios for the pattern. I believe that this
pattern should possess specific characteristics to be a valid harmonic structure and to define
a trading opportunity:
1. Minimum AB=CD completion where each price leg is equivalent.
2. C point retracement can vary between a 0.382 to a 0.886, although 0.618 is
preferred.
3. BC projection can vary from 1.13 to 3.618 and depends upon the C point
retracement.
4. Alternate AB=CD patterns exist.
It is important to mention that many Fibonacci-related analysts have oversimplified this pat-
tern in recent years. The idea of trading every AB=CD that completes is absurd. Many people
who present this pattern as the “end-all-be-all” price structure fail to understand that AB=CDs
require many other considerations to confirm and complement the completion point. Preferably,
the structure should possess other Fibonacci retracements or projections. However, the most
important concept is that the AB=CD is the basic structure of all harmonic patterns.
Chapter 4
The AB=CD Pattern
69

This page intentionally left blank

The Bat pattern is a precise harmonic pattern that I discovered in 2001. The Bat pattern
is probably the most accurate pattern in the entire Harmonic Trading arsenal. The pattern
possesses many distinct elements that define an excellent Potential Reversal Zone (PRZ). The
pattern typically represents a deep retest of support or resistance that can frequently be quite
sharp. Quick reversals from Bat pattern PRZs are common. In fact, valid reversals from Bat
patterns frequently possess price action that is quite extreme.
The pattern incorporates the powerful 0.886 XA retracement, as the defining element in the
PRZ. The B point retracement must be less than a 0.618, preferably a 0.50 or 0.382 of the XA
leg. The most ideal B point alignment is the 50% retracement of the XA leg. The B point is one
of the primary ways to differentiate a Bat from a Gartley pattern. If a pattern is forming and the
B point aligns at a 0.50 of the XA leg, it is likely to be a Bat.
The Bat utilizes a BC projection that is at least 1.618. The BC projection can be as much
as 2.618. However, the most ideal BC projections in a Bat pattern are a 1.618 or a 2.0. It is
important to note that the BC projection must not be a 1.27, as anything less than a 1.618 BC
projection invalidates the structure. Furthermore, the 1.27 BC projections are usually found in
Gartley structures.
The AB=CD pattern within the Bat distinguishes the structure, as well. This pattern is usually
extended and ideally possesses a 1.27 AB=CD calculation in the Bat structure. However, the
equivalent AB=CD pattern does serve as a minimum requirement for any Bat to be a valid
setup.
The Bat is an incredibly accurate pattern and requires a smaller stop loss than most
patterns. The 0.886 retracement is the most important number in the PRZ, but it is common
for the other harmonic numbers within the structure to converge closely, defining in a precise
range.
71

Bat Pattern Elements:
• B point at a less than a 0.618 retracement of XA, preferably a distinct 50% or
38.2% retracement.
• BC projection must be at least 1.618.
• AB=CD pattern is usually extended.
• 0.886 XA retracement.
• C point with range between 0.382 and 0.886.
The Bullish Bat Pattern
A B point that is less than a 0.618 retracement, preferably a 0.50 or 0.382 of the XA leg,
defines the Bullish Bat pattern (see Figure 5.1). The bullish 0.886 retracement is critical in
this setup. Typically, Bullish Bat patterns are excellent 5-point corrective structures found
in well-established support levels.
72
Harmonic Trading: Volume One
X
B
0.886
C
0.382;
0.886
1.618; 2.618
0.382; 0.50
A
D
Figure 5.1
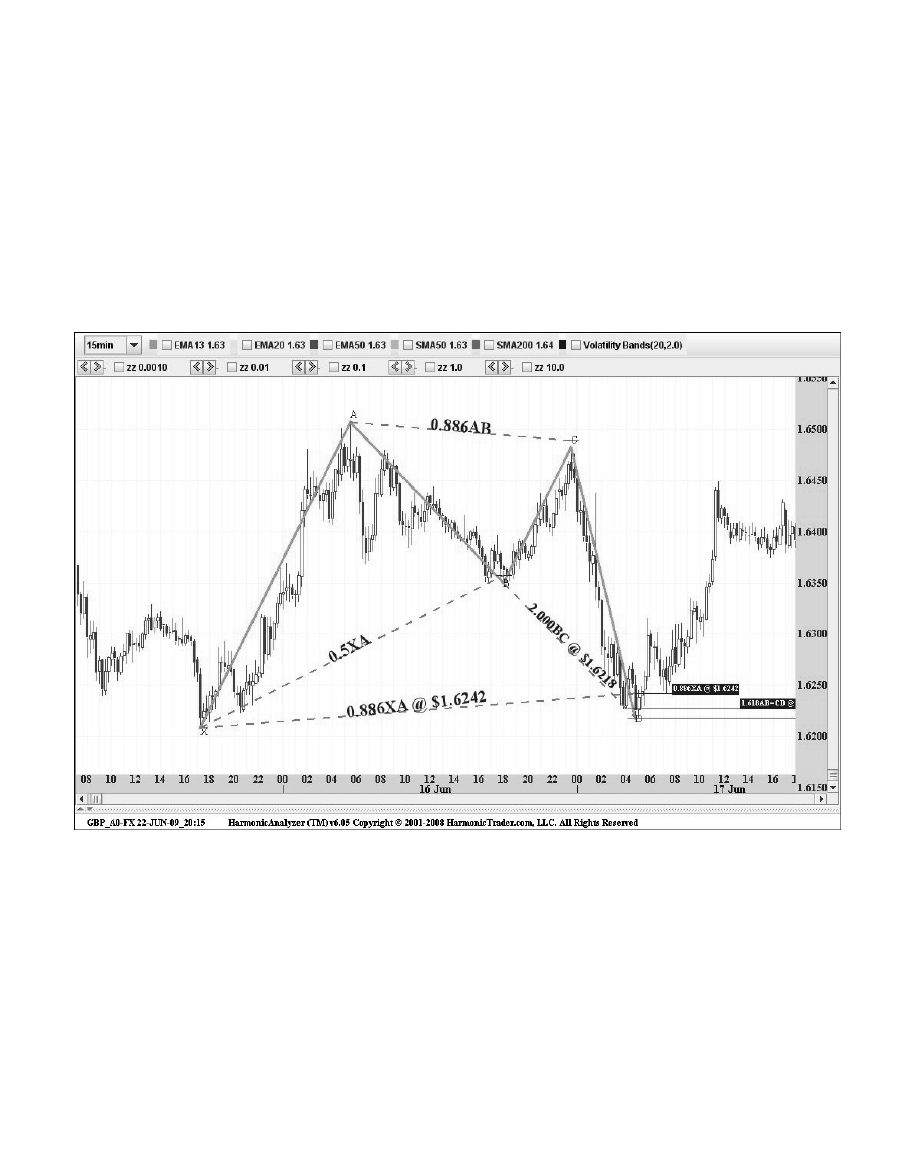
British Pound
(GBP_A0-FX): 15-Minute
This first example of the British Pound shows a distinct Bullish Bat pattern with a precise
PRZ (see Figure 5.2). The ratio alignment was quite precise, especially the 50% B point
and extended BC projection. The three numbers of the PRZ defined a tight zone between
1.6242–1.6218 to get long. Specifically, the setup possessed a 1.618 AB=CD pattern at
1.6232, a 1.618 BC projection at 1.6218, and the 0.886 retracement at 1.6242.
Chapter 5
The Bat Pattern
73
Figure 5.2
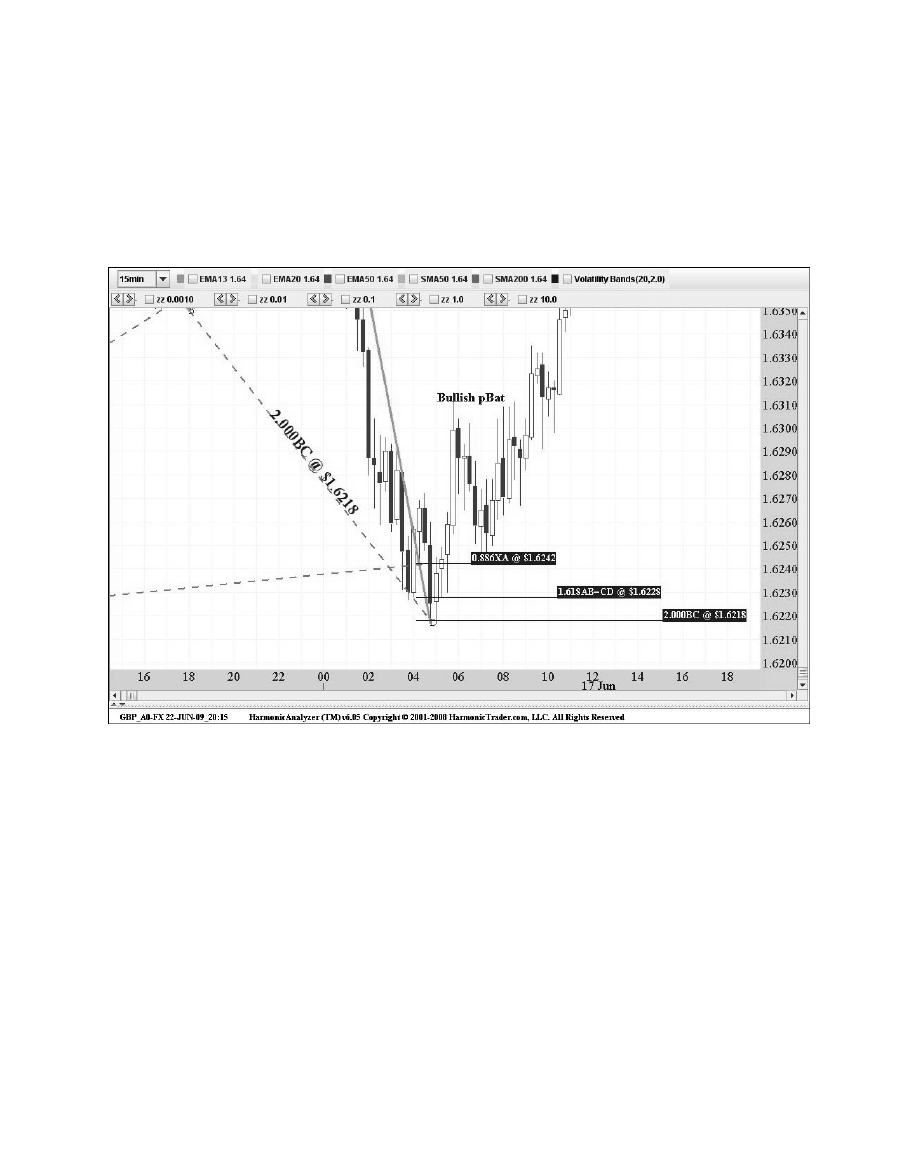
74
Harmonic Trading: Volume One
Figure 5.3
This example is an ideal scenario. A distinct Bullish Bat pattern with a sharp reversal from
the PRZ is exactly the type of price action to expect in a valid harmonic setup. This pattern
possessed all of the ideal elements for a valid buy signal. Again, the key technical event occurs
immediately after the entire zone is tested. In this case, the Pound was clearly stabilizing at the
numbers and decisively changed direction after the pattern was complete. Not to mention, the
tight alignment of numbers in the PRZ and distinctively symmetrical pattern structure were
further confirmation of an extremely harmonic setup.
In addition to an ideal alignment of Fibonacci numbers at the pattern’s completion, the price
structure possessed distinct symmetry that formed on this intra-day chart and provided a clear
short-term trading opportunity. The chart in Figure 5.3 of the price action in the PRZ shows the
near-perfect reversal on the first test of this support. After the price action tested the entire
PRZ, the Pound bounced sharply from this area. The GBP bottomed 2 pips below the entire
PRZ and reversed nicely for the next several hours, confirming the new intra-day up trend.
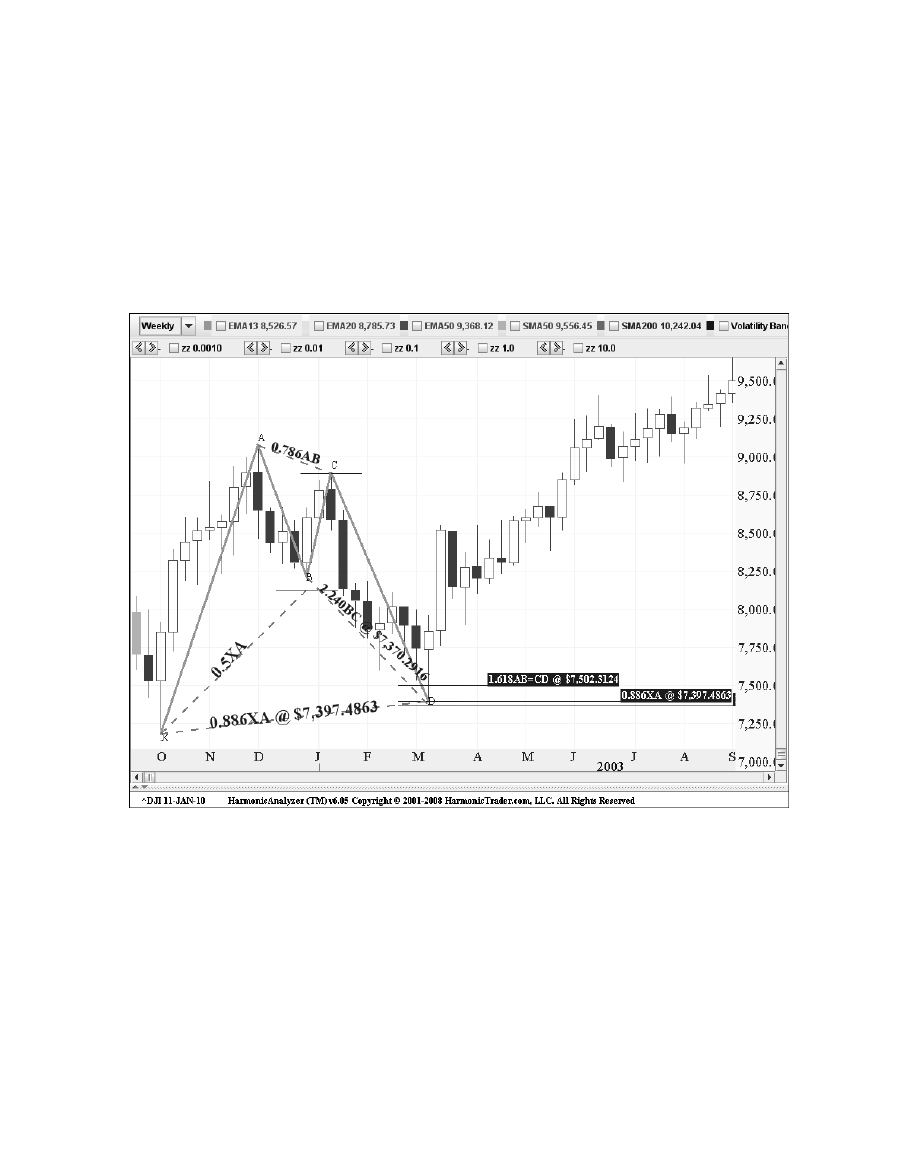
Dow Jones Industrial Average
(^DJI): Weekly
Figure 5.4 shows a Bullish Bat that was incredibly significant, as the reversal from this pattern
marked the beginning of the 2003 bull market (see Figure 5.4). This weekly chart shows three
numbers that defined a tight zone in the 7400–7500 area. The pattern possessed a 1.618
AB=CD pattern at 7500, while the 2.24 BC projection and the 0.886 retracement converged just
under the 7400 mark.
Chapter 5
The Bat Pattern
75
Figure 5.4
As a side note, this pattern was extremely significant, and it was the deciding factor for
my switch from a 2
1
⁄
2
year bearish position on the index for my website advisory service. The
sharp reversal from this PRZ and the distinct structure clearly indicated the strength of this
pattern.
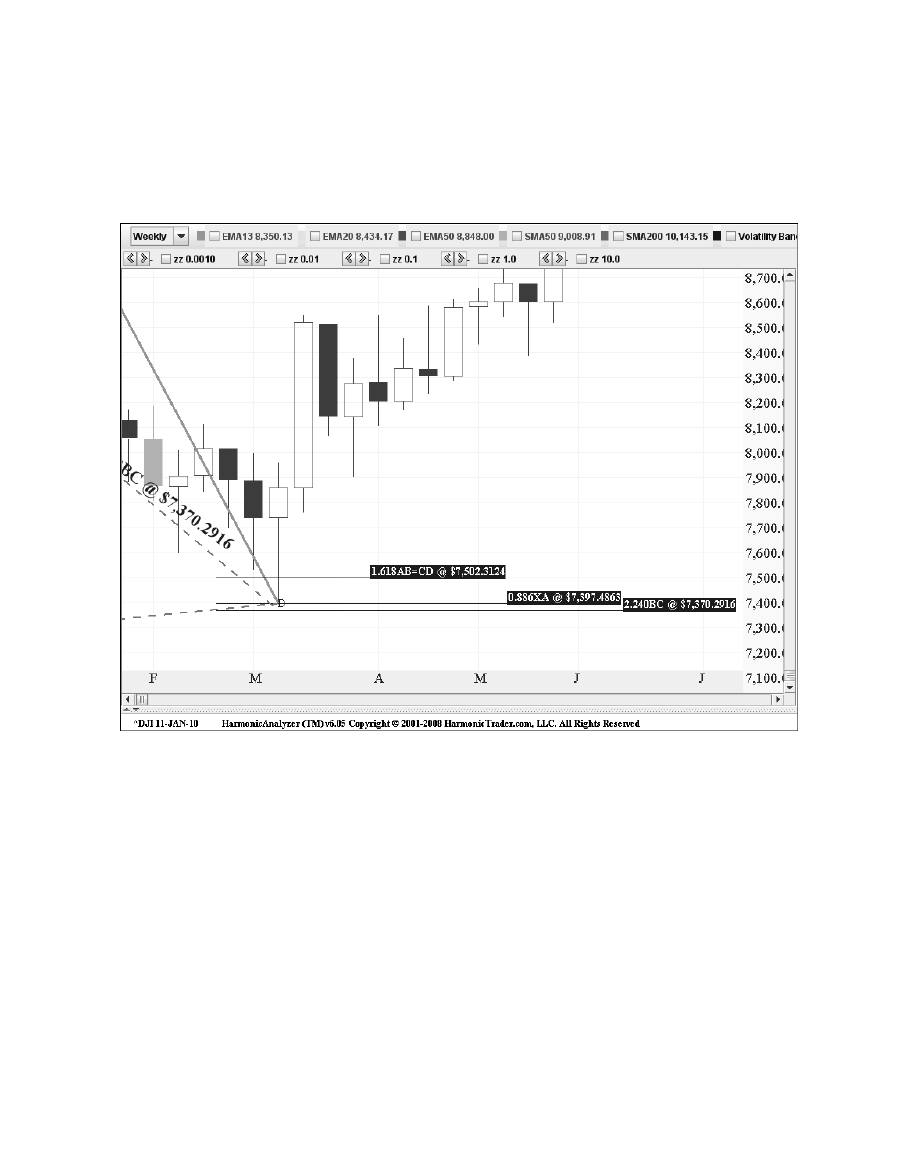
Figure 5.5
The Alternate 1.618 AB=CD complemented the other numbers in the PRZ. This situation
underscores the ability of the Bullish Bat to serve as a powerful 5-point corrective structure and
define precise technical levels within the overall trend.
76
Harmonic Trading: Volume One
This chart of the price action in the PRZ (see Figure 5.5) shows the sharp reversal from the
completion of this pattern. It is important to note that the 0.886 retracement at 7400 was the
defining limit in the PRZ. In fact, the Dow Jones Industrial Average reversed almost exactly
from this retracement.
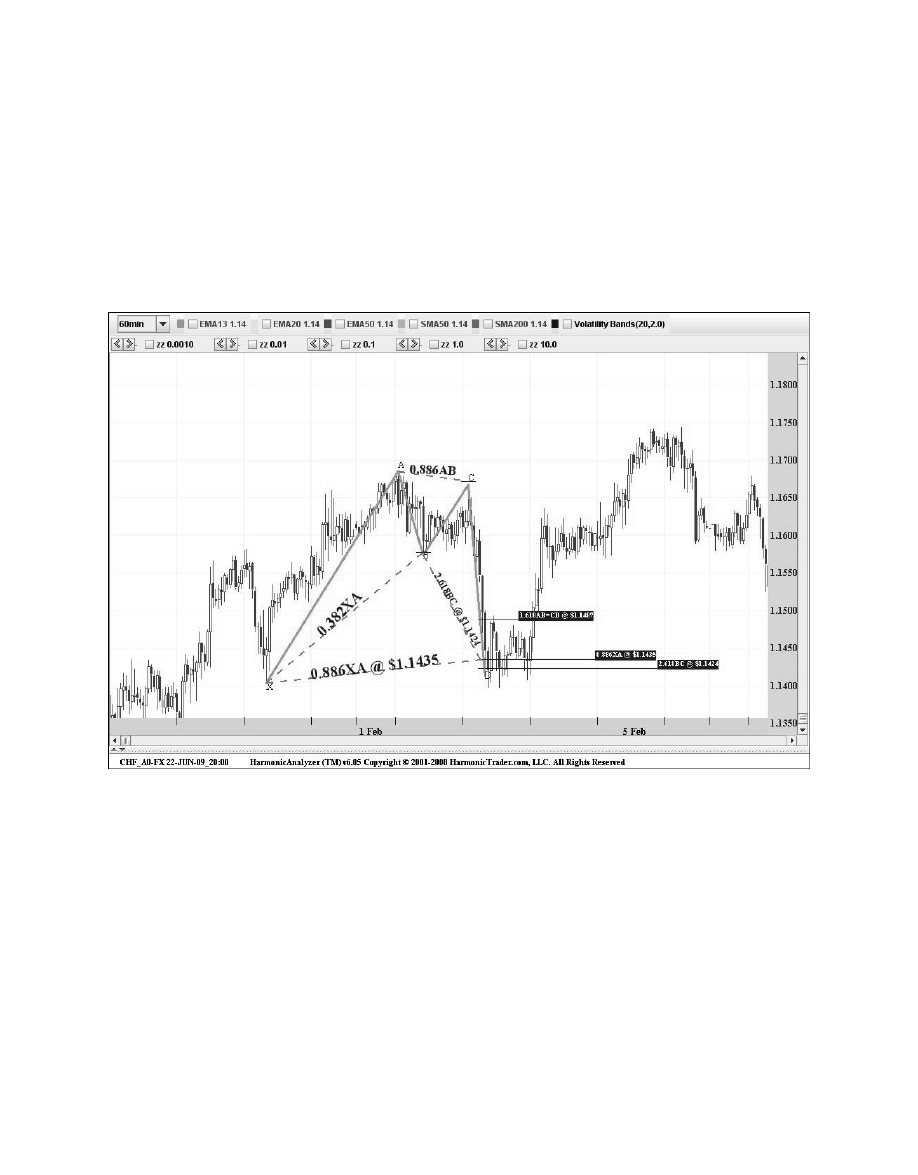
Swiss Franc
(CHF_A0-FX): 60-Minute
The next example of a Bullish Bat in the Swiss Franc shows another excellent harmonic pattern
at well-defined support in the currency markets (see Figure 5.6). The 60-minute chart possessed
a distinct pattern, clearly defining the critical support. The pattern formed the required Fibonacci
alignment to validate the Bat structure and the price action stabilized nicely after testing the
entire PRZ. The pattern marked an important continuation of the predominant intra-day trend.
Chapter 5
The Bat Pattern
77
Figure 5.6
These situations occur frequently in all currency markets on all time frames. Distinct patterns
such as the example of the Swiss Franc are common, but it is important to wait for the clearest
structural setups. Although the pattern possessed three numbers in a somewhat wide 50 pip
range, the 0.886 retracement defined the extreme limit of the PRZ. Furthermore, the clear sta-
bilization after all the numbers were tested was another signal of a valid reversal in the works.
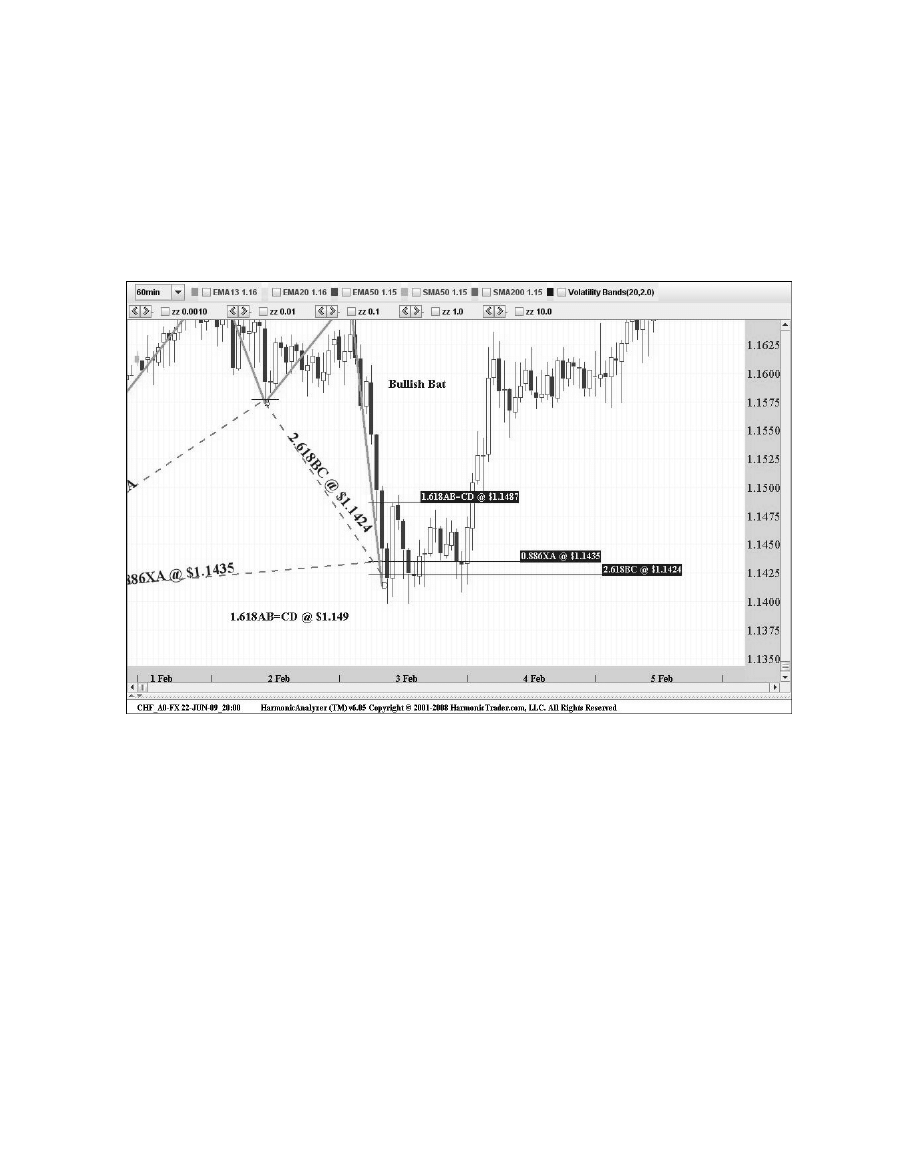
Figure 5.7
Another aspect of this example is the severity of the price decline toward the PRZ—although
the preferred completion point with respect to time would have been more ideal if the price
action tested the support zone a bit more steadily. The CD leg declined sharply in the hours
leading up to the pattern’s completion. Despite the somewhat premature test of the PRZ, the
structure was still distinct and a valid setup.
This situation underscores the importance of PRICE over TIME. I would like to take a
moment to comment on this controversy. Technicians have argued the “price versus time”
debate for decades. Although time is an important element in many approaches of Technical
Analysis, I believe the emphasis within the realm of Harmonic Trading must be focused on price
measurements. I utilize time measurements with respect to patterns. In fact, the Harmonic
Analyzer is able to calculate effective time projections that complement harmonic pattern
structures. But, the time element of any technical method must include price as the primary
basis for trading decisions.
78
Harmonic Trading: Volume One
Figure 5.7 of the Potential Reversal Zone is another example of ideal price action that validated
the reversal. The well-defined projected harmonic support held firm, as the pattern’s completion
point was an excellent entry level for any long positions seeking to capitalize on a resuming
bullish trend. Although patterns within trends will be addressed later in this material, it is
important to know that valid structural signals commonly form in the middle of well-established
trends. Although the relative position of all patterns should be considered, the price action after
all the numbers in the PRZ are tested is still the most important technical consideration.
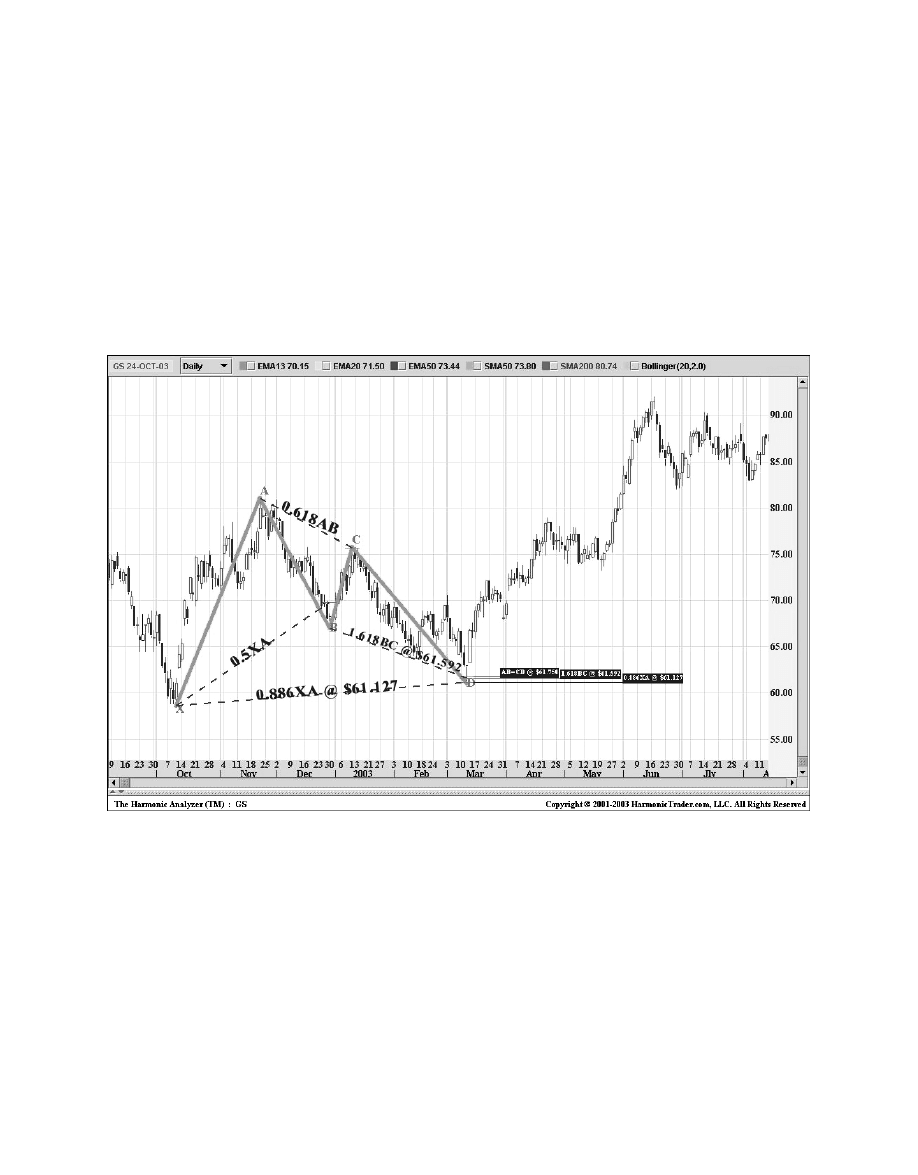
Chapter 5
The Bat Pattern
79
Figure 5.8
Goldman Sachs
(GS): Daily
Figure 5.8 is an example of a Bullish Bat in Goldman Sachs that shows a distinct PRZ that
utilizes an equivalent AB=CD pattern. It is important to note that the equivalent AB=CD is a
minimum target in the PRZ of a Bat pattern. The stock possessed the necessary Fibonacci
alignments to validate the Bat structure, including a 1.618 BC projection and a 0.886
retracement. The chart in Figure 5.9 of the price action in the PRZ shows the sharp reversal
from the completion of this pattern.
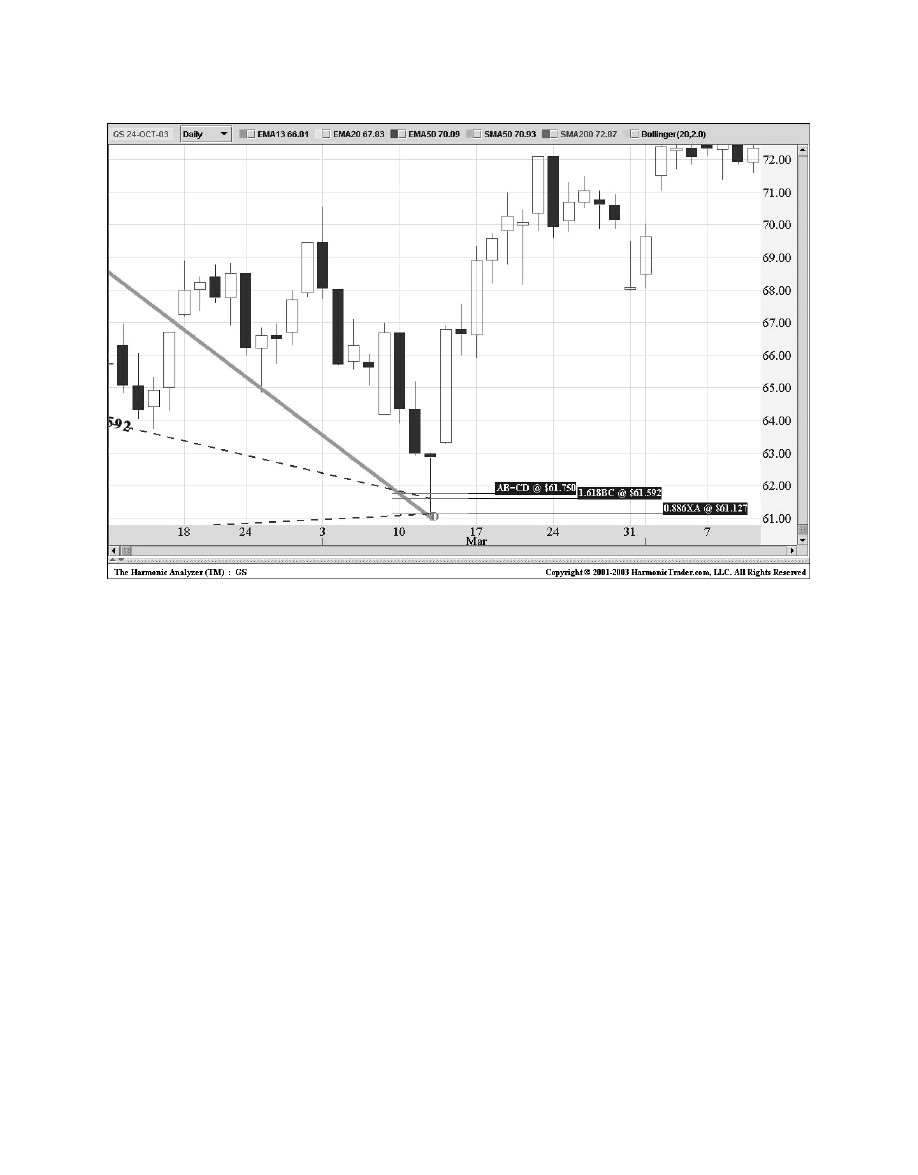
Figure 5.9
The stock rallied convincingly after testing all of the numbers in the PRZ. Again, it is
important to note that the 0.886 retracement just above 61 was the defining limit in the PRZ,
and it should be considered as the most important number in the completion of the pattern.
80
Harmonic Trading: Volume One
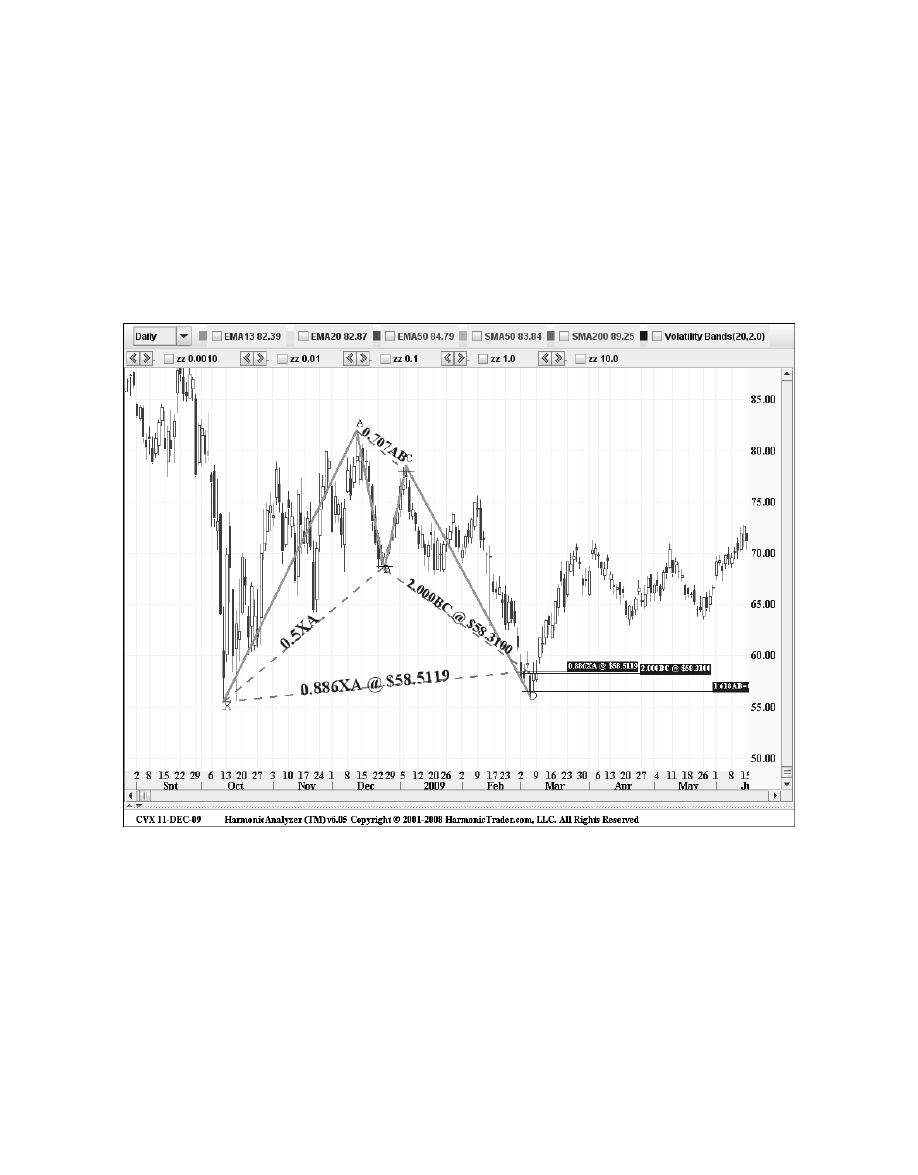
Figure 5.10
Chapter 5
The Bat Pattern
81
Chevron-Texaco
(CVX): Daily
The next example of Chevron-Texaco shows a distinct Bullish Bat pattern that formed on the
daily chart (see Figure 5.10). The stock possessed the necessary Fibonacci alignments to
validate the Bat structure, especially the precise 50% B point. The stock reversed after testing
the entire range of the PRZ. Although the reversal occurred immediately after hitting the
completion point, this distinct pattern clearly identified a buying opportunity just under the $60.
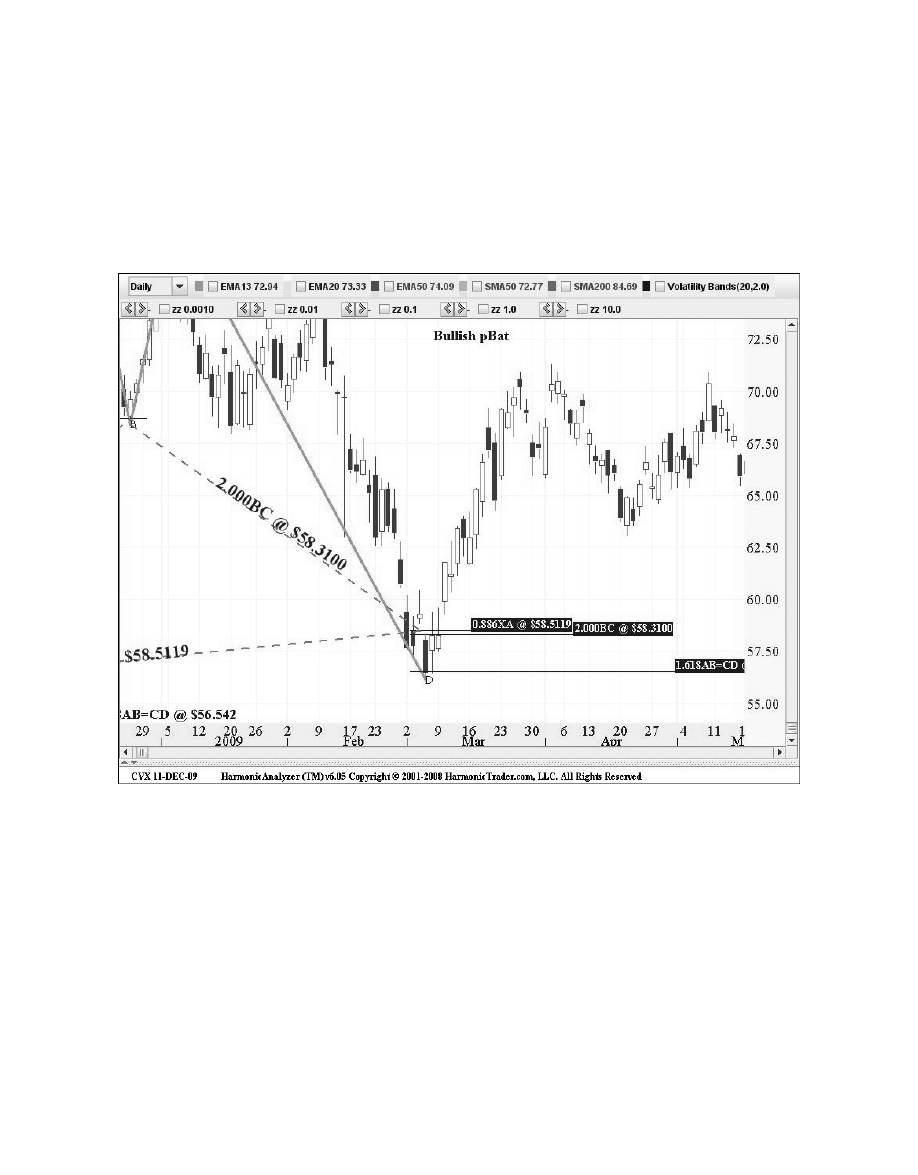
82
Harmonic Trading: Volume One
The chart in Figure 5.11 of the price action in the PRZ shows the sharp reversal after testing
the entire range of the PRZ. The 0.886 retracement converged exactly in the same area as the
2.0 BC projection, and the Bullish Alternate 1.618 AB=CD projection at 56.50. Although the
Alternate AB=CD was 2 points below the other two numbers, this example underscores the
importance of each number in the PRZ. The stock rallied convincingly after testing the entire
PRZ and confirmed the reversal within a few days after the initial test of the setup
Figure 5.11
Although some situations can be more difficult to gauge than others, this example demon-
strates the importance of focusing on the entire range of the PRZ. In this case, Chevron-Texaco
possessed harmonic support just under the $60 level with the completion of the Bullish Bat.
As the stock fell under $60, the price action appeared to be quite severe. However, Chevron-
Texaco soon stabilized and reversed course after testing the PRZ. Even if the execution was
delayed a day or two, the pattern clearly marked a critical turning point for the stock and
defined an optimal entry for a long position within the overall trend of the price action.

Chapter 5
The Bat Pattern
83
The Bearish Bat Pattern
A B point that is less than a 0.618 retracement, preferably a 0.50 or 0.382 of the XA leg,
defines the Bearish Bat pattern (see Figure 5.12). Bearish Bat patterns are excellent 5-point
corrective structures that frequently form after retracing a critical high point. In addition, these
structures are excellent trading opportunities when they form at distinct levels of resistance.
X
C
B
0.886
0.382; 0.50
0.382;
0.886
1.618; 2.618
D
A
Figure 5.12
The 0.886 XA retracement is the most critical level in the Bearish Bat. Since this
retracement occurs close to the prior high—which is the initial starting point (X) of the pattern—
the price action represents a substantial challenge of prior resistance. The structural signal
that the Bat pattern represents is a substantial technical factor that must be considered more
significant than simple retests. Bat patterns that form at distinct levels of resistance frequently
indicate substantial potential changes in trend—on any timeframe! It is important to wait for
clear opportunities like these. Not to mention, I prefer to wait for the entire PRZ range to be
tested to validate the completion of the pattern. Although this may delay a trade execution
slightly, valid reversals will provide definitive signals soon after the pattern is completed.
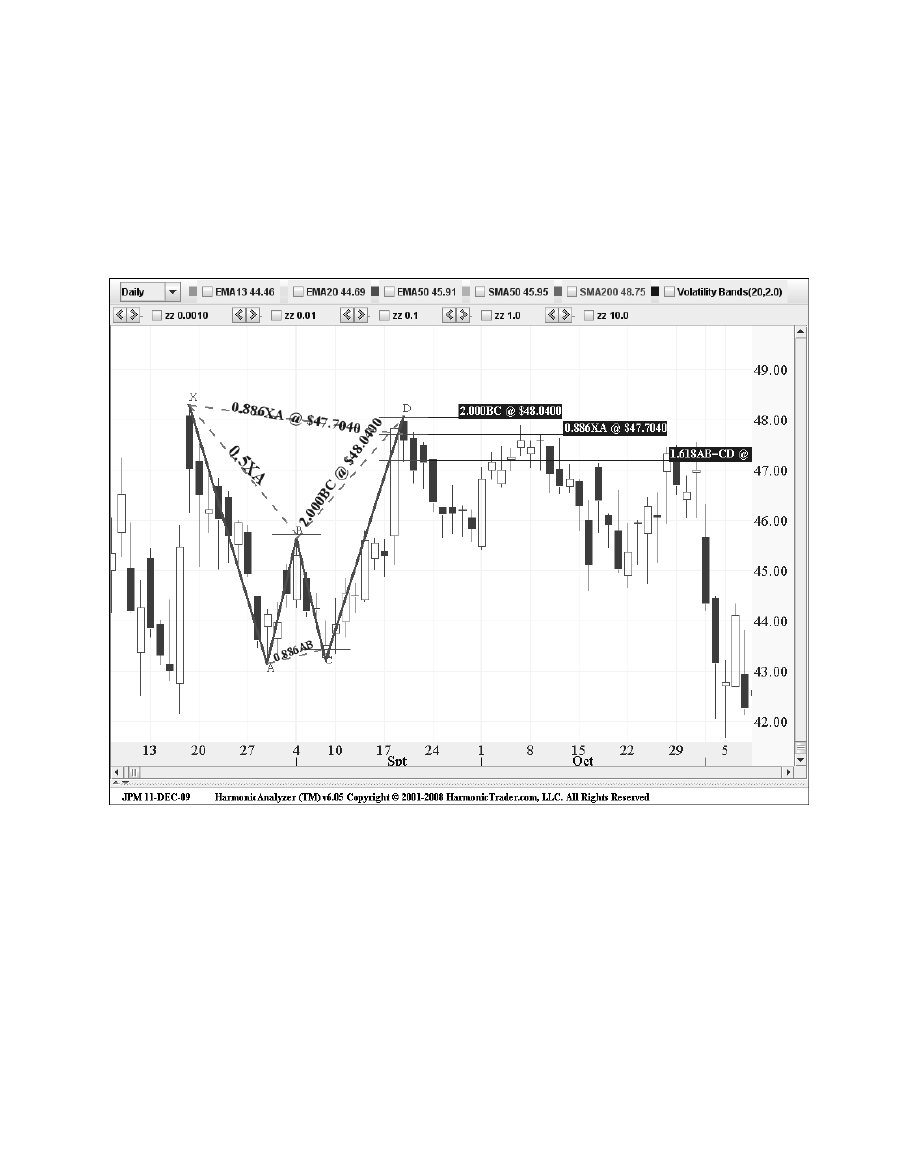
Figure 5.13
The pattern possessed a 1.618 AB=CD that converged in the same area as the 2.0 BC
projection. The 0.886 retracement at 47.70 was the defining upside limit for this setup, as the
stock reversed quickly after testing the entire PRZ.
J. P. Morgan
(JPM): Weekly
J. P. Morgan Chase formed a distinct Bearish Bat on this weekly chart with a precise PRZ in
the $48 area (see Figure 5.13). The pattern possessed three numbers that defined a tight zone
between 47.20–48.05 to short the stock.
84
Harmonic Trading: Volume One
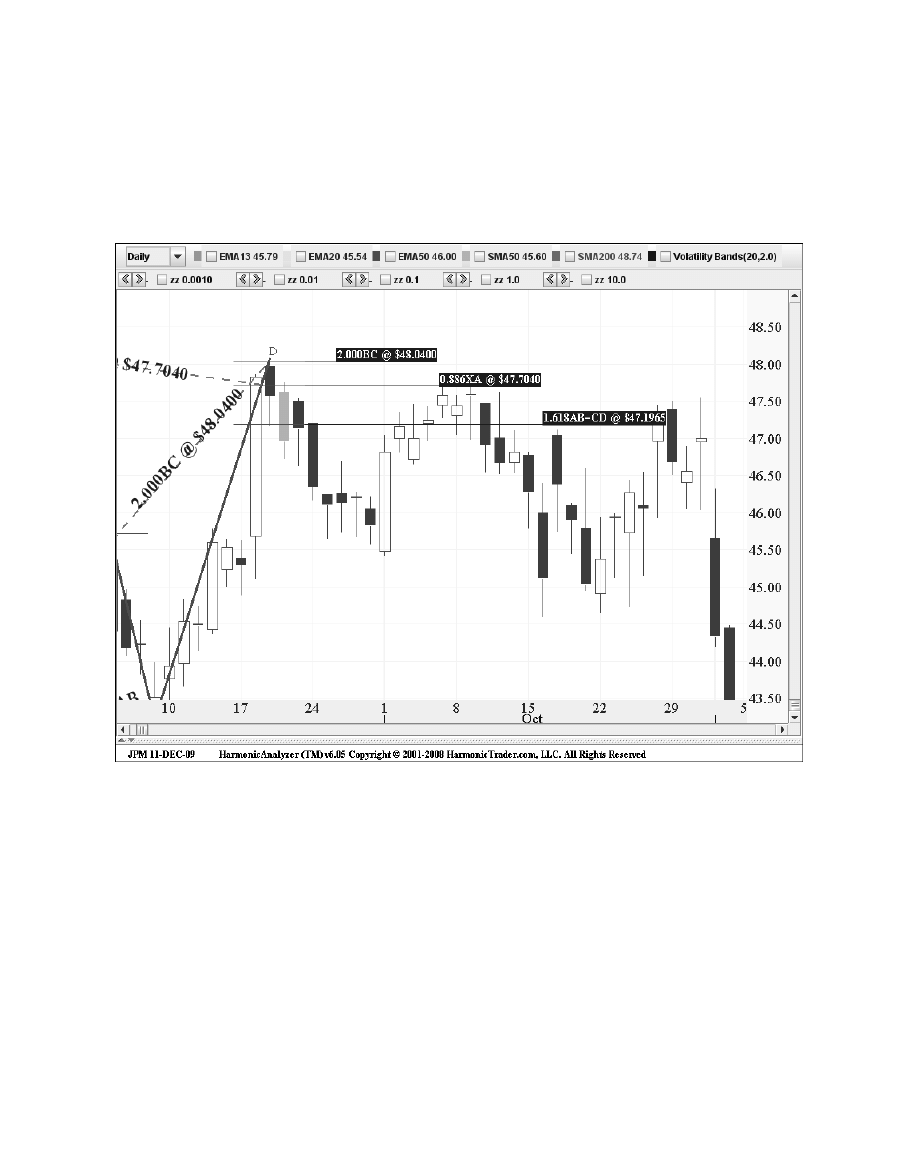
Chapter 5
The Bat Pattern
85
The chart in Figure 5.14 of the price action in the PRZ shows an ideal reversal after the
0.886 retracement was tested. Ideally, the entire PRZ should be tested in valid reversals. In
fact, the Bearish Bat tends to test its entire PRZ in valid structures more than most other
patterns. This is different from other 5-point corrective structures like the Gartley, where a
less strict approach is employed with the price action in the PRZ.
Figure 5.14
This case of JPM exemplifies the advantage of waiting for an entire test of the Bat PRZ.
The stock rallied into the range of harmonic numbers between 47.20 and 48 as it completely
tested the PRZ and confirmed the ultimate reversal at 0.886 retracement. The following few
weeks confirmed the reversal, as the sock rolled immediately after completing the Bat pattern.
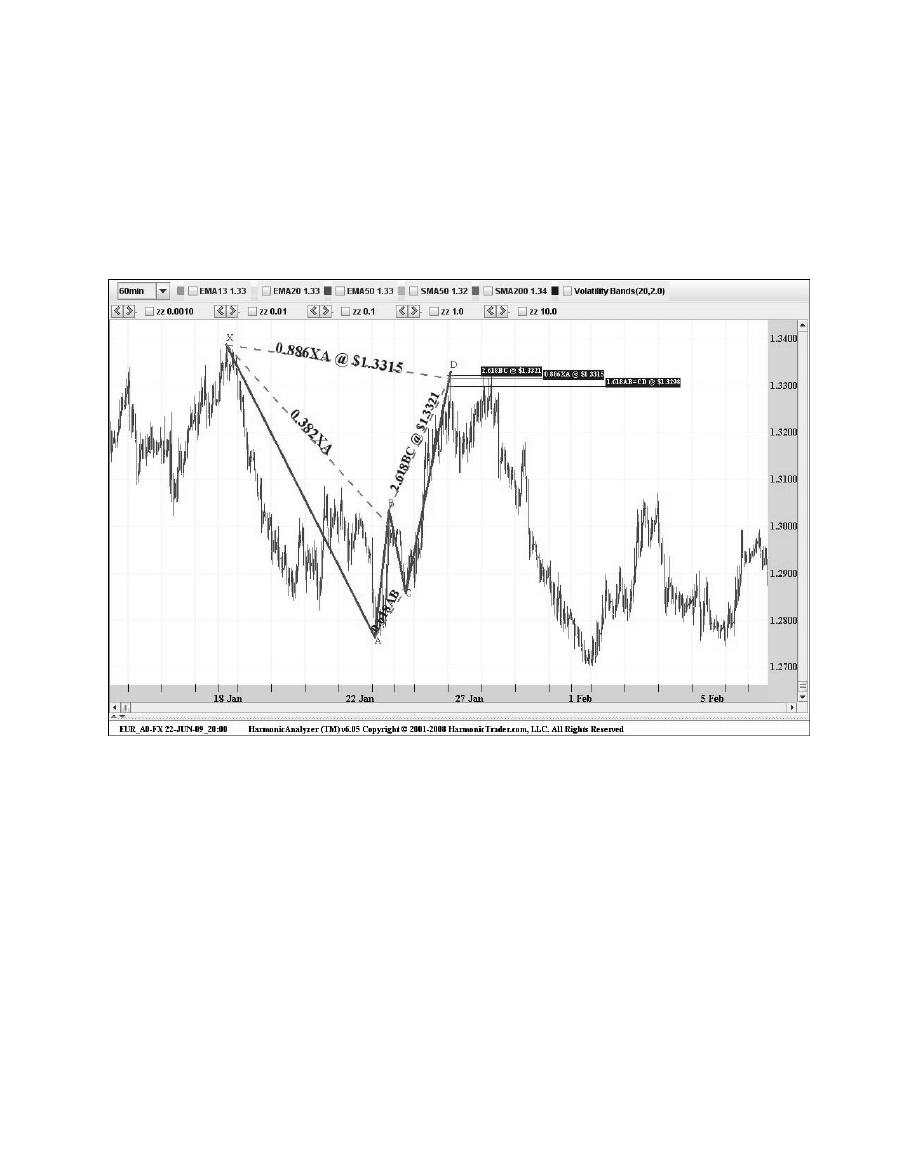
Eurodollar
(EUR_A0-FX): 60-Minute
This Bearish Bat in the Euro illustrates an ideal structural scenario, where the pattern’s
completion point serves as the optimal entry level for a trade (see Figure 5.15). The ideal
symmetry and precise alignment of the structure’s ratios clearly validated the pattern.
86
Harmonic Trading: Volume One
Figure 5.15
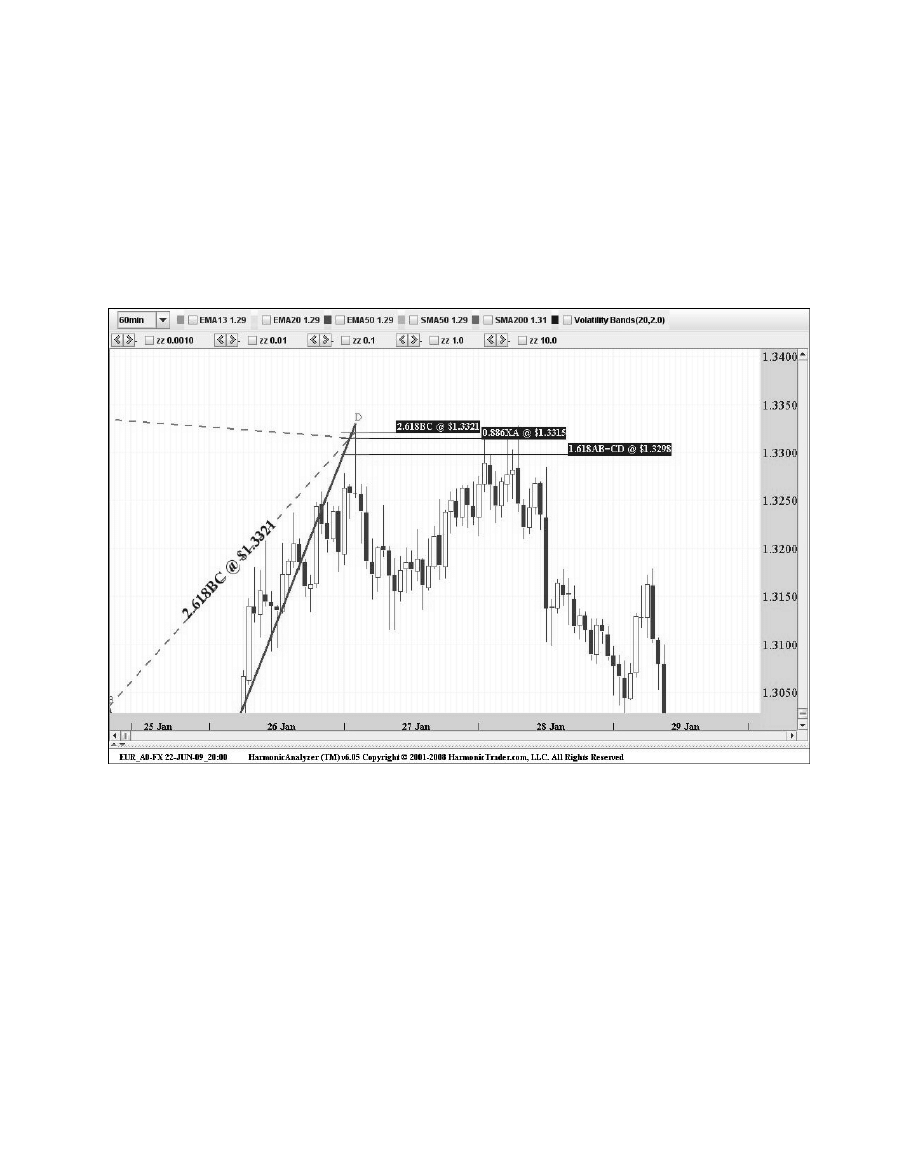
The price action reversed from the entire test of the PRZ. After a temporary pullback from
the initial test, the Euro consolidated within the range of harmonic resistance between 1.4419
and 1.4437, and reversed
after a second test of the entire PRZ. Again, the 0.886 retracement
in the 1.4437 area was the defining limit of the pattern and the most significant number in the
zone. In addition, the 0.886 retracement is typically the optimal area to execute a trade, as was
the case for the Euro. The chart in Figure 5.16 shows the price action in the PRZ. Despite the
strong rally that preceded the PRZ, the clear stalling that occurred after testing the harmonic
resistance validated the Bearish Bat pattern.
Chapter 5
The Bat Pattern
87
Figure 5.16
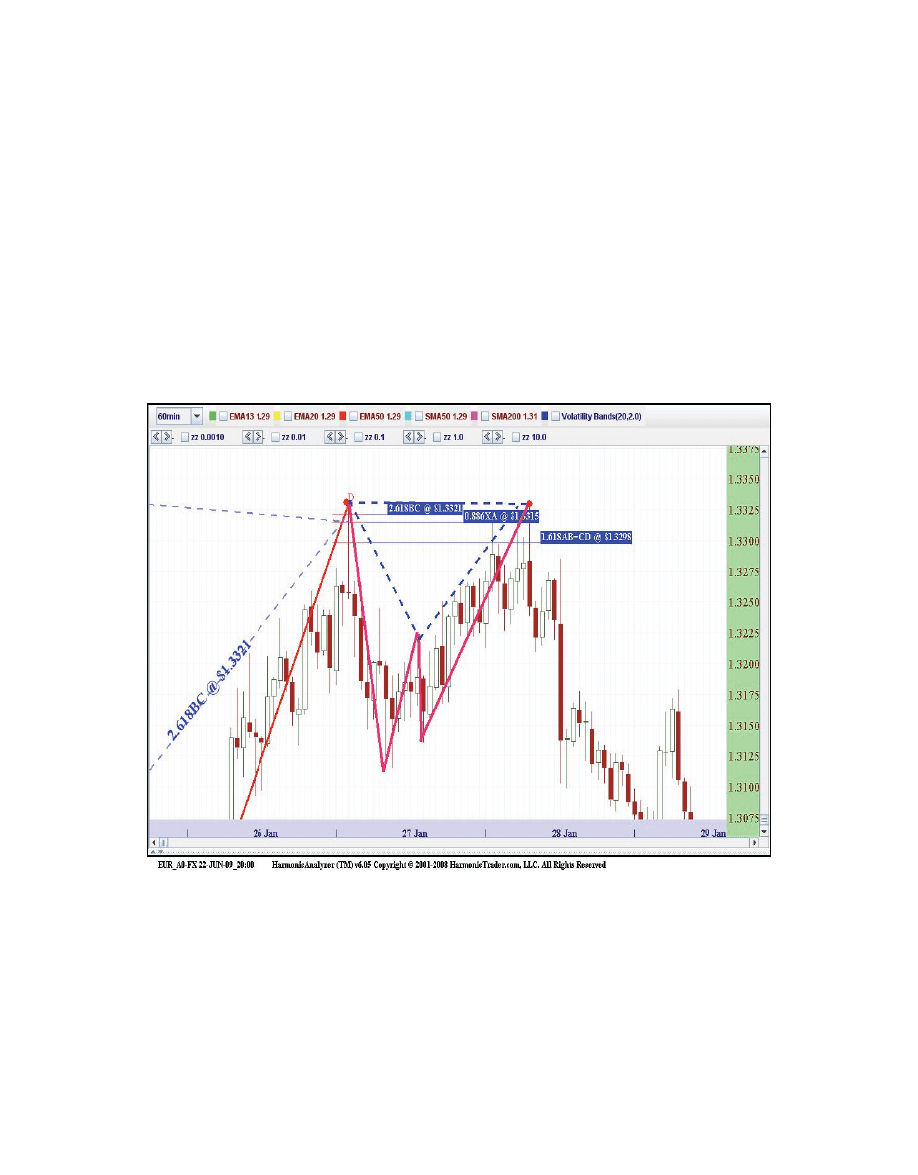
After rallying several hundred pips, the Euro formed a sharp Bearish Bat that not only
reversed at the completion of the pattern, but topped at nearly the exact high end of the PRZ.
The initial test yielded a valid short-term reversal. The more substantial move required a
secondary test and further consolidation before reversing dramatically. After consolidating in
this area, the Euro actually formed a smaller Bearish Bat on the secondary test (see Figure
5.17). This “pattern within a pattern” is just one of many types of multi-harmonic scenarios
that should be regarded as an additional structural confirmation of the setup. In this case, the
convergence of multi-patterns can have much greater implications for the reversal zone as a
critical turning point for the potential future trend. The smaller Bearish Bat completed at 1.3325,
which is the same level as the larger 88.6% retracement completes. The reversal following this
secondary test was a clear confirmation signal of the validity of these patterns as critical
harmonic resistance.
88
Harmonic Trading: Volume One
a
b
0.886
0.50
x
2.618
d
c
Figure 5.17
Although multiple harmonic patterns do not occur in every situation, it is common for many
valid reversals to experience some type of secondary test of significant setups before reversing
decisively. In fact, it is common to experience some type of reaction on the first test of an entire
PRZ. After some meaningful consolidation, a nominal retest of the PRZ often occurs that marks
the beginning of the reversal acceleration. These situations are excellent trading opportunities
because they provide ample time to analyze the price action and to execute the trade.
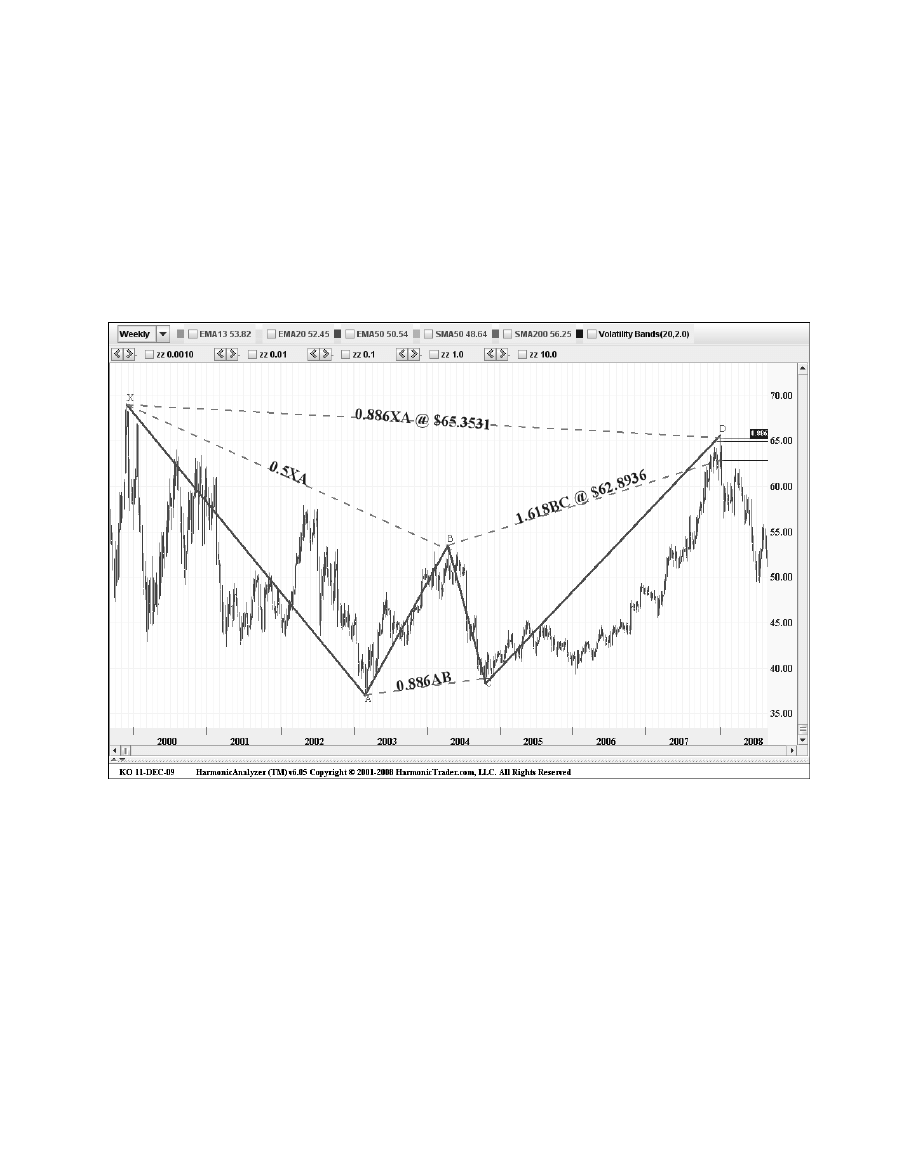
Coca-Cola
(KO): Weekly
Coca-Cola in Figure 5.18 shows a long-term Bearish Bat on this weekly chart. The pattern
possessed a precise PRZ with three numbers that defined a tight range zone between 34.55
and 36.30 (see Figure 5.17). The stock reversed after testing the entire PRZ (again) with the
0.886 retracement acting as the defining number within this range.
Chapter 5
The Bat Pattern
89
Figure 5.18
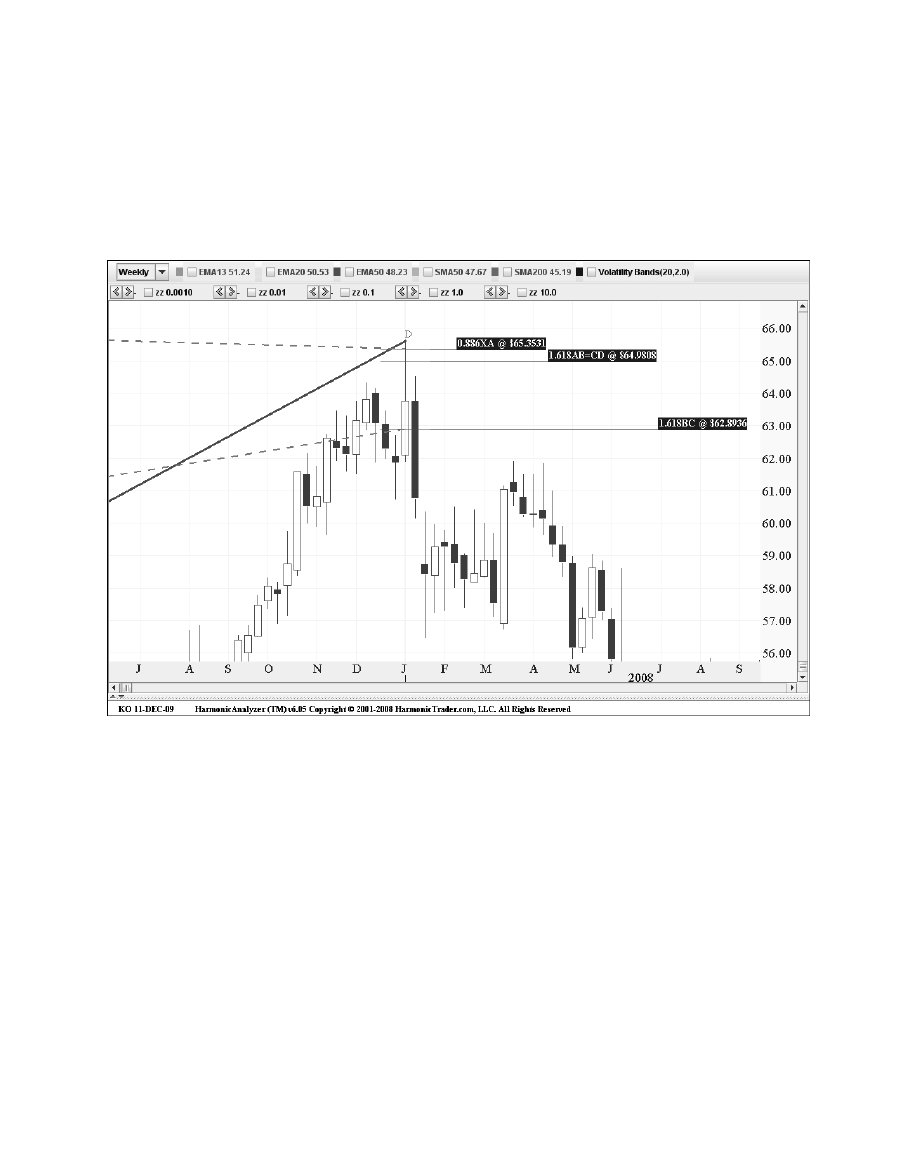
This example illustrates the ideal alignment that valid Bat patterns typically possess. The
exact 50% B point retracement with the Alternate 1.27 AB=CD pattern and the 2.0 BC
projection were ideal structural elements that defined this precise PRZ. Although the 0.886
was the defining element of this setup, the other two levels complemented this area ideally.
Figure 5.19 reveals the clear reversal that unfolded after a complete test of all of the numbers
in the zone.
90
Harmonic Trading: Volume One
Figure 5.19
The remarkable aspect of this example is the length of time required to form this structure.
This pattern formed over a period of seven years and incredibly the uptrend reversed on the
week it hit the completion point.
The Perfect Bat Pattern
The perfect Bat pattern is represented by a specific alignment of Fibonacci numbers within the
structure. The perfect Bat is a distinct structure with a tight range of three numbers that defines
the Potential Reversal Zone (PRZ). The mid-point is primarily defined by an exact 0.50% B
point retracement. The Alternate 1.27 AB=CD and the 2.0 BC projection should complete close
to the 0.886 retracement, which is the most critical number in the pattern.

Chapter 5
The Bat Pattern
91
X
B
0.886
C
0.50;
0.618
2.0
0.50
A
D
Perfect Bat Pattern Requirements:
1. Mandatory 50% B point retracement of the XA leg.
2. Precise 0.886 D point retracement of the XA leg as the defining limit within
the PRZ.
3. 2.0 BC projection.
4. Alternate 1.27 AB=CD pattern required.
5. C point should be in the 50–61.8% range.
The Perfect Bullish Bat
The perfect Bullish Bat pattern is primarily defined by a precise 50% retracement at the
B point (see Figure 5.20). The PRZ must possess an 0.886 retracement as the defining limit,
and this area should be complemented by a 2.0 BC projection with an Alternate 1.27 AB=CD
pattern. It is important to point out that the “0.50; 0.618” Fibonacci retracement range for the
C point is the only “discretionary alignment” permitted. This C point range is the most ideal
retracement to establish a 2.0 BC projection.
Figure 5.20
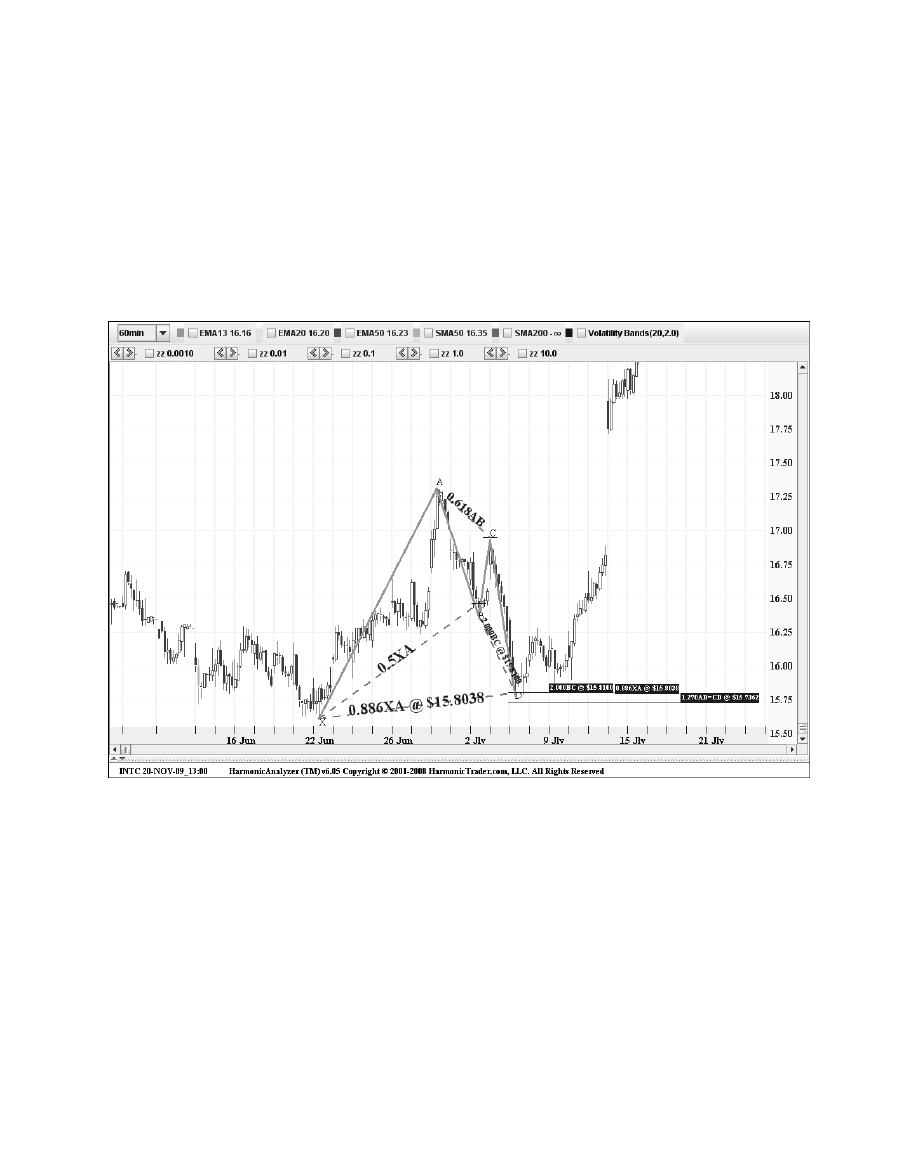
Intel
(INTC): 60-Minute
The intra-day example of the Intel in Figure 5.21 shows a perfect Bullish Bat pattern with a
precise Potential Reversal Zone (PRZ). The ratio alignment was quite precise, especially the
50% B point and extended BC projection. The three numbers of the PRZ defined a tight zone
in the 15.80 area to get long. Specifically, the setup possessed a 1.27 AB=CD pattern at 15.75,
with the 2.0 BC projection and the 0.886 retracement competing at 15.80.
92
Harmonic Trading: Volume One
Figure 5.21
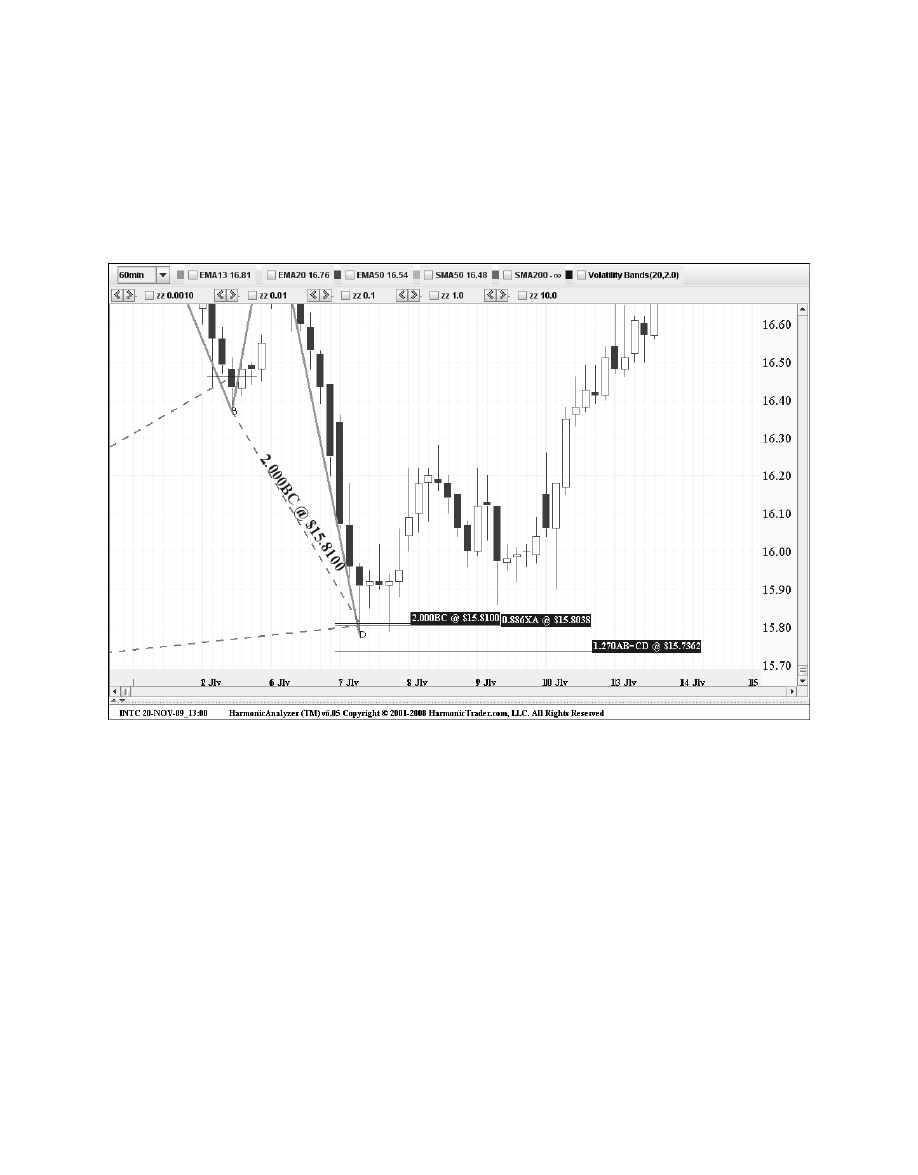
Figure 5.22
This example exhibits an ideal scenario. A distinct Bullish Bat pattern with a sharp reversal
from the PRZ is exactly the type of price action to expect in a valid harmonic setup. This pattern
possessed all the ideal elements for a valid buy signal. Not to mention, the tight alignment of
numbers in the PRZ and distinctively symmetrical pattern structure was further confirmation of
an extremely harmonic setup.
Chapter 5
The Bat Pattern
93
In addition to an ideal alignment of Fibonacci ratios to validate the perfect structure, the
pattern’s distinct symmetry was another ideal element of this short-term setup. The chart in
Figure 5.22 of the price action in the PRZ shows the near-perfect reversal on the first test of
this support. After the price action entered the PRZ, the price action stabilized and reversed
from the 88.6% retracement. The stock rallied decisively over the next several sessions to
confirm the new intra-day up trend.

The Perfect Bearish Bat
The perfect Bearish Bat pattern is primarily defined by an exact 0.50 retracement at the
B point. The PRZ must possess an 0.886 retracement as the defining upper limit, and this
area should be complemented by a 2.0 BC projection with an alternate 1.27 AB=CD pattern
(see Figure 5.23).
94
Harmonic Trading: Volume One
X
C
B
0.886
0.50
0.50;
0.618
2.0
D
A
Figure 5.23
It is important to point out that the “0.50; 0.618” Fibonacci retracement range for the C point
is the only “discretionary alignment” permitted. This C point range is the most ideal retracement
to establish a 2.0 BC projection.
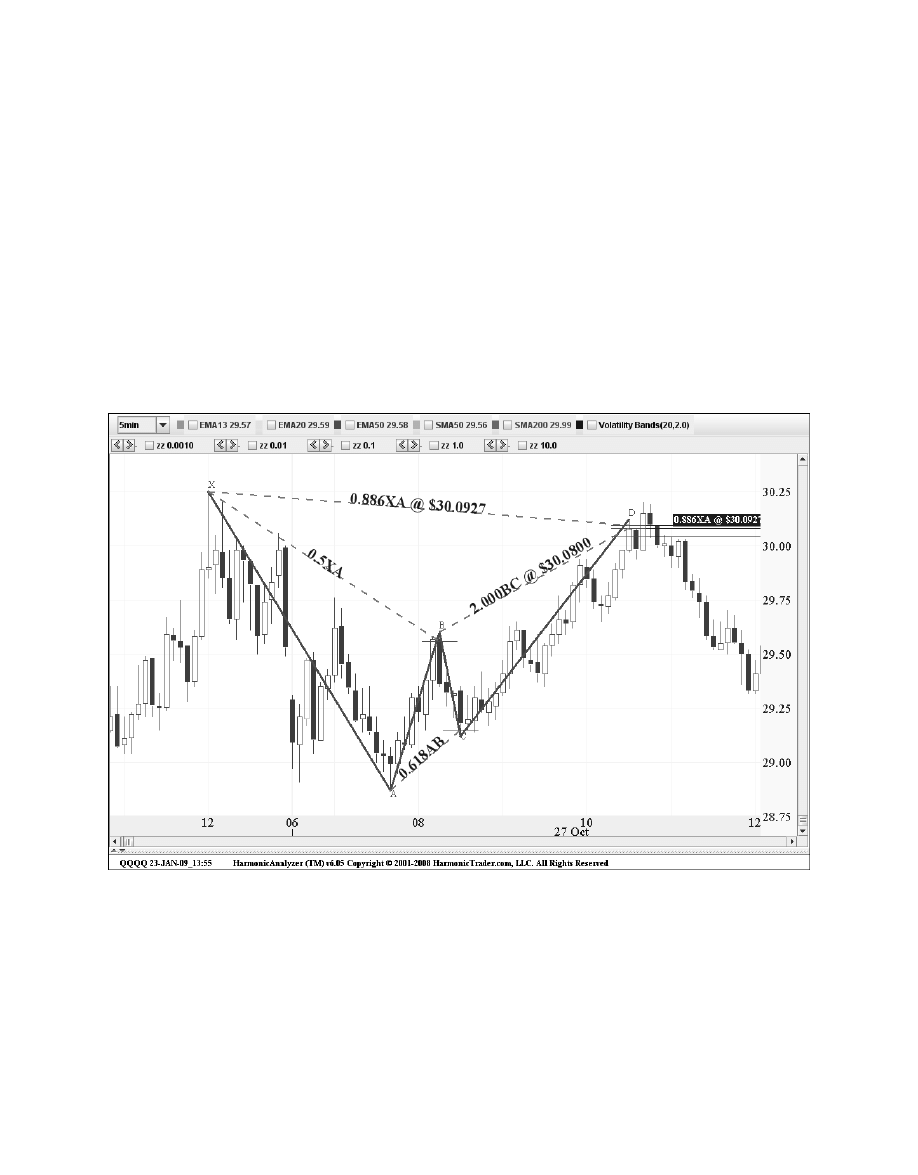
NASDAQ 100 Tracking Stock
(QQQQ): 5-Minute
The Bearish Bat in this example possesses a perfect structure with a precise alignment of
the required Fibonacci ratios to validate the pattern. Starting with a perfect 50% B point
retracement, the price action formed an Alternate 1.27 AB=CD pattern that completed in
the same exact area as the 2.0 BC projection. In combination with the 0.886 XA retracement,
the PRZ possessed three numbers in a 10-cent range that defined resistance just above $30
a share.
The chart in Figure 5.24 clearly demonstrates the effectiveness of the perfect pattern
structure to define critical turning points within any trend. In this case, the perfect Bearish Bat
defined an optimal execution area to short the Qs.
Chapter 5
The Bat Pattern
95
Figure 5.24

The Bat Pattern Summary
The Bat pattern is a precise harmonic pattern that frequently yields exact and sharp reversals.
The 0.886 retracement is a powerful completion point and the defining limit within the PRZ.
Although a 0.50 or 0.382 retracement is preferred, any B point that is less than a 0.618 will
define a valid Bat structure. The Bat pattern incorporates a minimum AB=CD completion to
validate the structure, as well. However, an Alternate 1.27 AB=CD is most common and is
a defining element in the Perfect Bat structure. Furthermore, the BC projection should
complement the other numbers in the PRZ, and it must be at least a 1.618 extension.
1. B point retracement of the XA leg must be less than 0.618 with a 0.50 or 0.382
retracement preferred.
2. Precise 0.886 D point retracement of the XA leg as the defining limit within
the PRZ.
3. Minimum 1.618 BC projection with extreme extensions (2.0–2.618) possible.
4. Minimum AB=CD completion, although an Alternate 1.27 AB=CD is more common
and preferred.
5. C point retracement can vary between a 0.382 to an 0.886.
The Bat pattern is probably the best harmonic pattern of them all! Bat structures represent
powerful corrective signals that identify excellent trading opportunities that are retesting
significant levels of support or resistance. The best structures typically are distinct and
possess a precise alignment of Fibonacci ratios to validate the pattern.
96
Harmonic Trading: Volume One

The Great Gartley Controversy
It is probably the best-known Harmonic pattern in the trading community—the Gartley.
Although many have written articles on this pattern, the origins of the Gartley pattern range
from erroneous to downright misinformation. H. M. Gartley first outlined the basic structure of
this pattern in his book
Profits in the Stock Market (Lambert-Gann Publishing, 1935) on page
222. Although contrary to what many have claimed, Gartley was
not responsible for assigning
Fibonacci ratios to this price structure. In fact,
Profits in the Stock Market did not mention
anything about Fibonacci ratios in the entire book. I know because I own the book. It’s not in
there. I believe it is important to correct these prevailing misconceptions regarding this pattern.
It is important to note that others have assigned a variety of Fibonacci ratios to the
framework of the Gartley pattern. However, they have used a large gamut of Fibonacci
numbers at the D points, essentially labeling any AB=CD pattern as a Gartley. This
interpretation assumes that any reversal is valid if it completes at a 0.618 or a 0.786
without regard for the overall structural alignment. This has created much confusion among
the technical community and has challenged the reputation of the pattern.
This controversy was one of the earliest challenges that I faced when I initially refined the
pattern. I argued with many people that “all Gartley patterns are not the same.” If anything,
the most effective Gartley pattern required an exact specification of Fibonacci ratios to validate
the structure. Although the general structure has been outlined previously, it was not until
The
Harmonic Trader was released in 1999 that the exact rules for specific retracements of the
B point at a 0.618 and the D point at a 0.786 were to be assigned to the pattern. This alignment
has now become the standard in the technical community and is now commonly referred to as
the Gartley pattern.
97

The exact 0.618 B point requirement was just one condition in this interpretation of the
structure.
The Harmonic Trader also outlined the importance of the AB=CD pattern and the BC
projection rules that required specific conditions to validate the structure.
The Potential Reversal Zone (PRZ) of a Gartley possesses several other elements that
differentiate the structure from other patterns. The pattern should possess a distinct and
equivalent AB=CD pattern that converges in the same area as the 0.786 XA retracement. In
fact, the completion of the equivalent AB=CD pattern and the 0.786 retracement are minimum
requirements for a valid Gartley. Frequently, the 0.786 XA retracement overlaps the AB=CD in
the PRZ. In these cases, this convergence typically represents the defining level of the PRZ.
The BC projection is another specific condition to validate the structure, and it must not
exceed a 1.618. Although the BC projection is a less significant number in the PRZ than in
other patterns, the 1.618 limit helps to differentiate the Gartley structure. Typically, a BC
extension greater than a 1.618 is found in Bat structures. Regardless of the required numbers
in the PRZ, the Gartley must possess a precise 0.618 B point retracement to validate the
structure. In fact, the Gartley pattern requires the most precise B point alignment of all the
harmonic patterns to define the best trading opportunities.
Gartley Pattern Elements:
• Precise 61.8% B point retracement of XA leg.
• BC projection must not exceed 1.618.
• Equivalent AB=CD pattern is most common.
• 0.786 XA retracement.
• C point within range of 0.382–0.886 retracement.
It has been my experience that anything less than the ideal Fibonacci alignment for the
Gartley usually results in “deeper” corrective structures, favoring a Bat pattern completion.
Although this strict application of the Gartley alignment reduces the number of pattern
matches, it is critical in identifying valid patterns and effectively differentiating these two similar
structures.
It is important to note that the Gartley pattern is simply one type of “M” or “W” Elliott Wave
corrective pattern. Although similar in structure, the Bat pattern is a distinctly different entity,
utilizing other rules to define the setup. Such specification of price structures, quantified by
Fibonacci calculations, is essential in Harmonic Trading. In terms of the Gartley pattern, the
setup that yields the most valid reversals is the one illustrated in
The Harmonic Trader.
As with all harmonic patterns, the specification of Fibonacci points within each structure is
extremely critical in determining valid trading opportunities. The Gartley pattern exemplifies
the necessity of such specification, as the structure frequently resembles a Bat pattern as it
completes.
On a final note about harmonic patterns,
The Harmonic Trader outlined many
unprecedented strategies that distinguished patterns based upon specific price point
alignments. This differentiation increased the effectiveness and served to demystify the
confusion of the overall application of these methods. Again, I must emphasize that although
98
Harmonic Trading: Volume One

others have utilized a variety of Fibonacci numbers in their analysis of price patterns, the exact
specification of price structures, quantified by Fibonacci calculations, is what separates
Harmonic Trading from the rest.
The Bullish Gartley
A distinct AB=CD and a 0.786 retracement define the Potential Reversal Zone (PRZ) in the
Bullish Gartley (see Figure 6.1). However, these conditions are valid only with a 0.618 B point
retracement of the XA leg.
Chapter 6
The Gartley Pattern
99
C
A
D
0.382;
0.886
1.13;
1.618
B
X
0.618
0.786
Figure 6.1
The BC projection should complement the other numbers in the PRZ, as a 1.13, 1.27, 1.41,
or 1.618 extension should converge in the same area. It is important to note that the Gartley
does not utilize any BC projection that is greater than a 1.618. Any BC projection that is greater
than a 1.618 is usually found in Bat structures. Again, it is important to point out that the
“0.382;0.886” Fibonacci retracement range for the C point can be any of the Harmonic Trading
ratios that fall between these two constraints. Therefore, the C point can be 0.382, 0.50, 0.618,
0.707, 0.786, or 0.886.
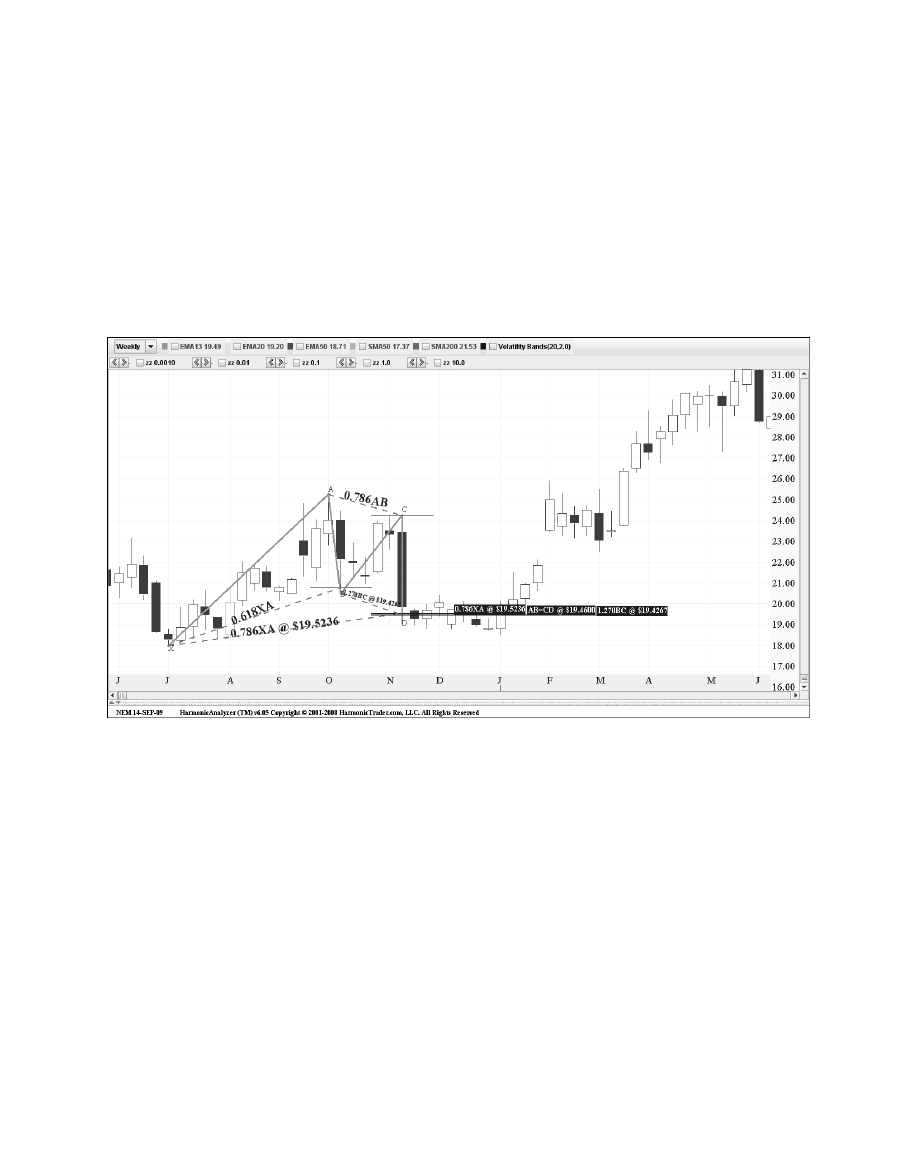
100
Harmonic Trading: Volume One
Newmont Mining
(NEM): Weekly
This first example of a weekly chart of Newmont Mining (NEM) illustrates the ideal Bullish
Gartley elements (see Figure 6.2). Starting with a precise 0.618 B point alignment to validate
the structure, the distinct AB=CD pattern completion point at 19.30 converged closely with the
0.786 XA retracement at 19.35. The 1.41 BC projection complemented this area at 18.70.
Although this area was exceeded slightly, the pattern clearly indicated harmonic support around
the $19 level.
Figure 6.2
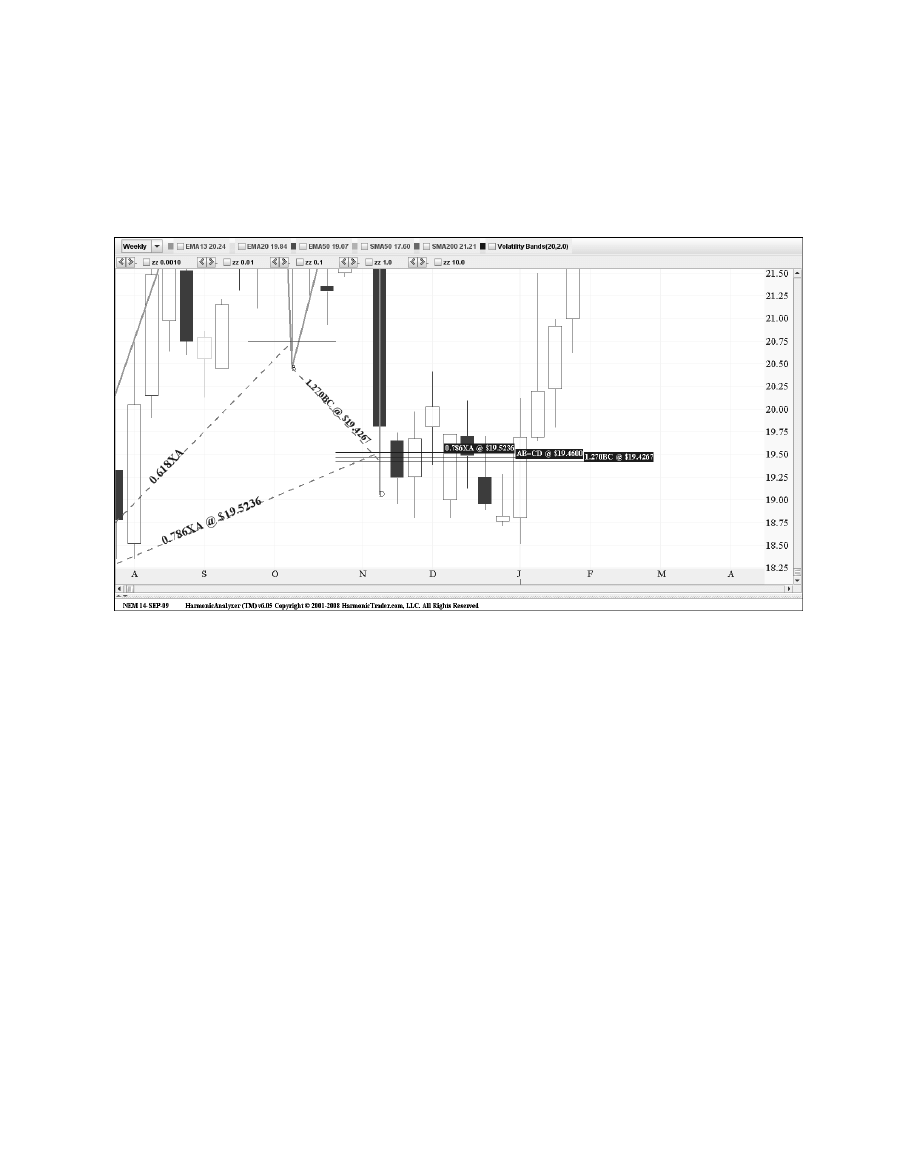
The chart in Figure 6.3 of the price action in the PRZ shows an ideal reversal after the 1.41
BC projection was tested. The interesting aspect of this reversal is the stabilization that
occurred after the 0.786 and the AB=CD completion points were tested. Although Newmont
Mining required several weeks of consolidation before reversing, the Bullish Gartley accurately
identified critical support for the stock.
Chapter 6
The Gartley Pattern
101
Figure 6.3
Although this concept may sound repetitive, it is important to emphasize the difference of
a Gartley structure versus a Bat pattern. The most important element that differentiates this
5-point corrective structure from a Bat pattern is the B point retracement at the 0.618 level of
the XA leg. If this was a Bat structure—defined by a 0.50 B point retracement or less, the
corresponding BC projection and Alternate 1.27 AB=CD pattern would have calculated a lower
PRZ, resulting in a missed trade.
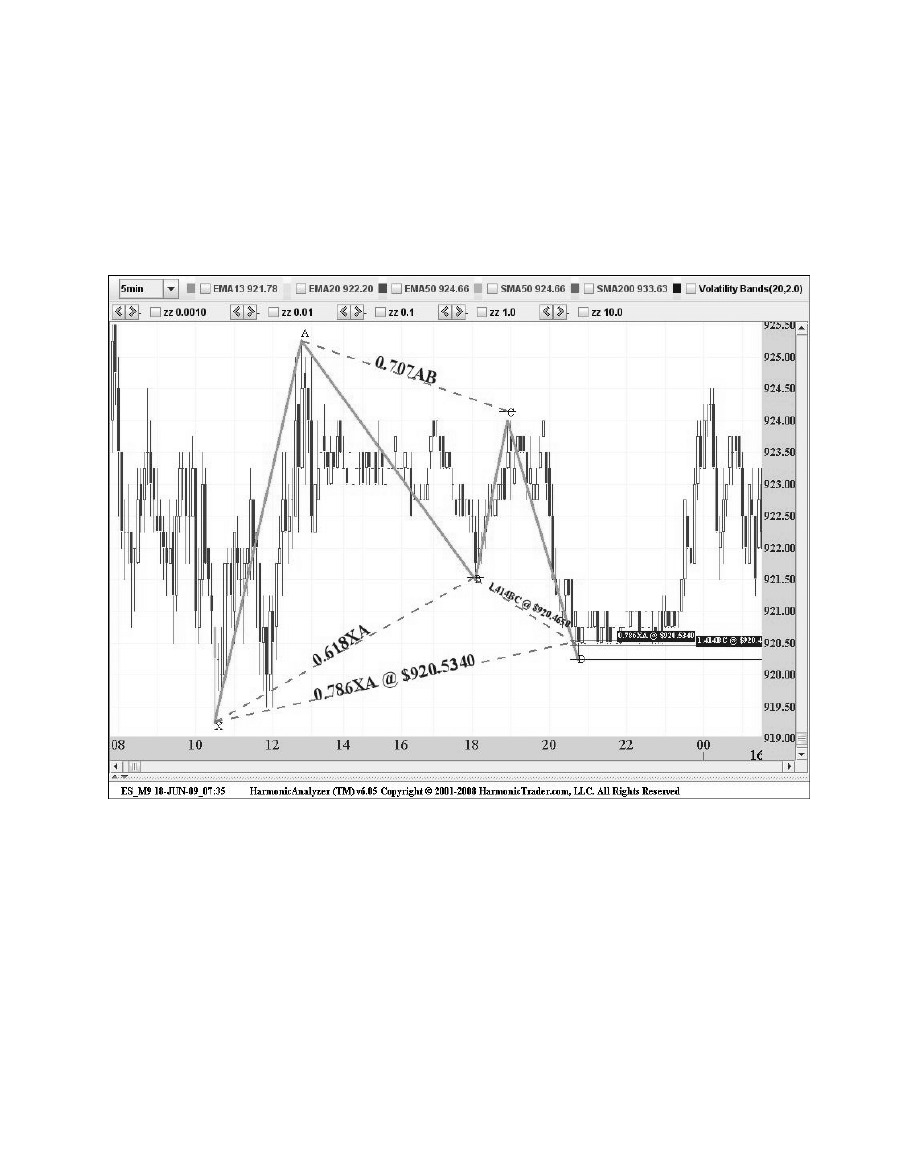
Standard and Poor’s 500 June 2003 Mini-Contract
(ES_M9): 5-Minute
The ES formed a distinct Bullish Gartley on this 5-minute chart. This was a nice structure with
an ideal alignment of harmonic numbers that defined a distinct intra-day PRZ in the 920 area.
(see Figure 6.4).
102
Harmonic Trading: Volume One
Figure 6.4
The overlapping of the AB=CD and the 0.786 retracement defined the critical area within
the PRZ, as the ES reversed sharply after testing this area. It is important to emphasize the
convergence of these two numbers in the Gartley PRZ. Although I prefer to wait for the entire
range of harmonic numbers to be tested in most patterns, the Gartley frequently reverses
after testing the AB=CD completion point and the 0.786 retracement. Not to mention, the
convergence of these numbers at the 920 level clearly defined critical intra-day harmonic
support.
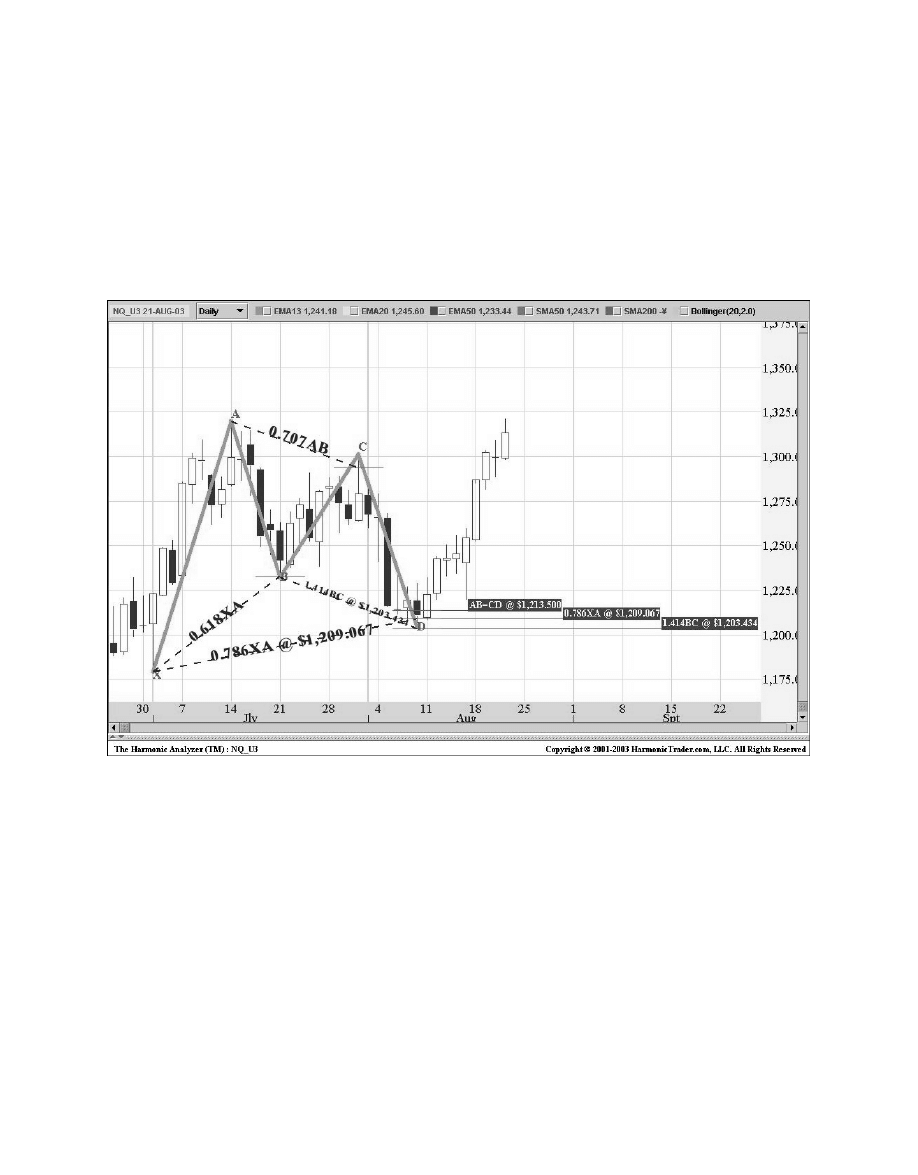
NASDAQ 100 September 2003 Mini-Contract
(NQ_U3): Daily
The September 2003 NQ Mini-contract formed this distinct Bullish Gartley on the daily chart,
marking the beginning of a huge rally. This pattern possessed a distinct structure with an ideal
alignment of harmonic numbers that defined a distinct PRZ between 1203.40 and 1213.50 (see
Figure 6.5).
Chapter 6
The Gartley Pattern
103
Figure 6.5
The convergence of the AB=CD completion point and the 0.786 XA retracement were the
defining elements of the PRZ, as the contract reversed sharply after testing this area.
Although the 1.41 BC projection complemented the PRZ, it was not tested. This exemplifies
the importance of the AB=CD and the 0.786 XA retracement in the PRZ for the Gartley pattern.
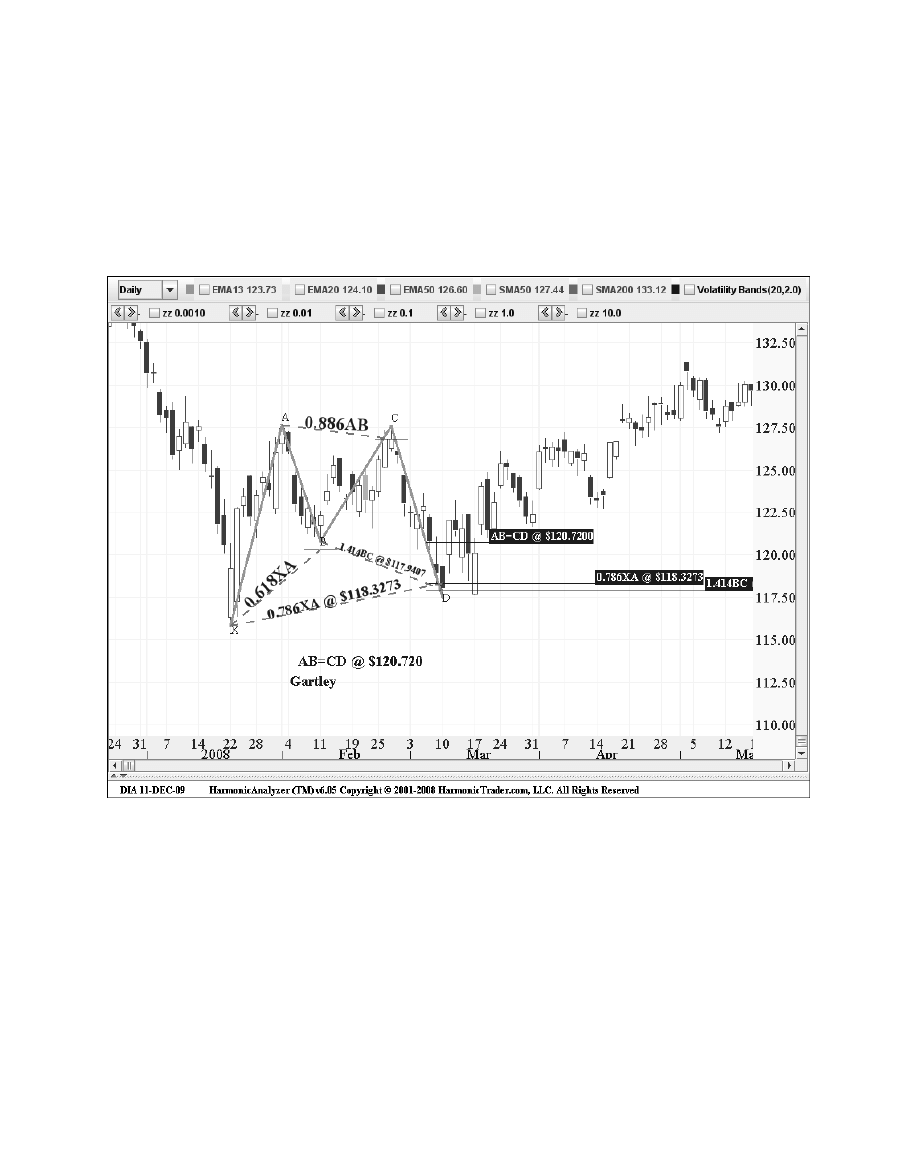
Dow Jones Industrial Average Tracking Stock
(DIA): Daily
The Dow Diamonds formed this Bullish Gartley on the daily chart (see Figure 6.6) with three
numbers in a tight range between 118–120. The pattern possessed a distinct structure with a
perfect 0.618 B point retracement.
104
Harmonic Trading: Volume One
Figure 6.6
This was another situation where the Gartley PRZ was defined by the convergence of the
AB=CD completion point and the 0.786 XA retracement. Although the BC projection marked
the low at $118, the convergence of the AB=CD completion and the 0.786 retracement
identified the most important area in the PRZ between. This was an important structural
pattern for the Dow Diamonds, as it confirmed the critical bear market low.
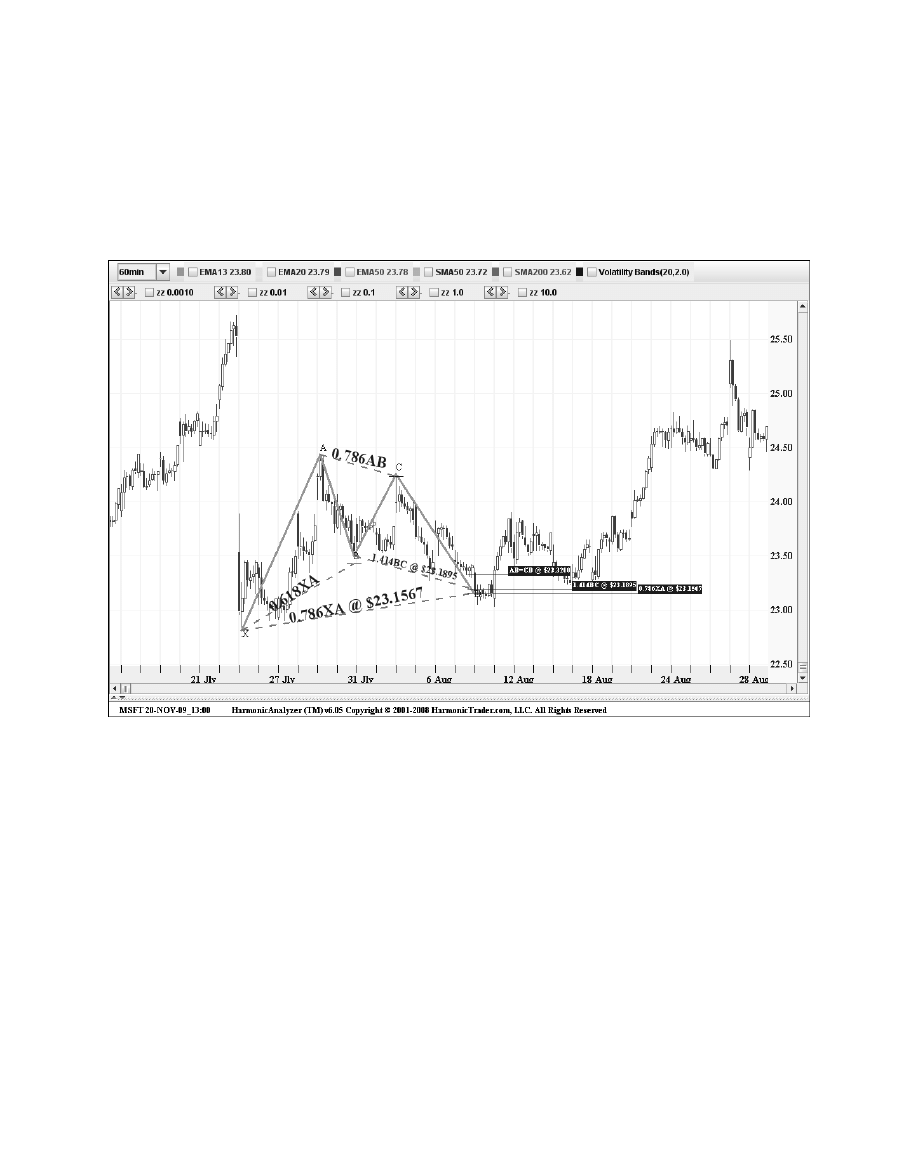
Microsoft
(MSFT): 60-Minute
After a severe decline, Microsoft consolidated over the course of several sessions to form a
distinct Gartley on this 60-minute chart (see Figure 6.7).
Chapter 6
The Gartley Pattern
105
Figure 6.7
The B point retracement reversed close to the 0.618 XA retracement, establishing the
structure of the pattern. The AB=CD completion point, the 0.786 XA retracement, and the 1.41
BC projection converged in a tight 10-cent range between 23.15–23.25. The stock rallied in the
following two weeks after the entire PRZ was tested.

The Bearish Gartley Pattern
The Bearish Gartley structure is principally identified by a 0.618 B point retracement of the XA
leg (see Figure 6.8). The other elements of the pattern—the AB=CD, the BC projection, and the
0.786 retracement—should converge within close proximity of each other to define the PRZ.
106
Harmonic Trading: Volume One
X
C
B
0.786
0.618
0.382;
0.886
1.13;
1.618
D
A
Figure 6.8
Standard and Poor’s 500 Index
(^SPX): Weekly
This first example of a Bearish Gartley was incredibly significant for the financial markets. The
Standard and Poor’s 500 Index completed this Bearish Gartley on the weekly chart at the
index’s all-time high, marking the beginning of the three-year bear market. The distinct AB=CD
pattern completion point and the 0.786 XA retracement were complemented by the 1.27 BC
projection, defining the area just above the 1500 level as critical resistance (see Figure 6.9).
Although the price action exceeded the top end of the range, the reversal occurred the week
after the price action tested the entire range of the PRZ.
The chart in Figure 6.10 shows an ideal reversal after this complete test.
The action after the entire PRZ was tested exemplifies an ideal reversal of a valid pattern. In
this case, the S&P 500 stalled at this harmonic resistance and continued lower in the weeks
following the reversal.
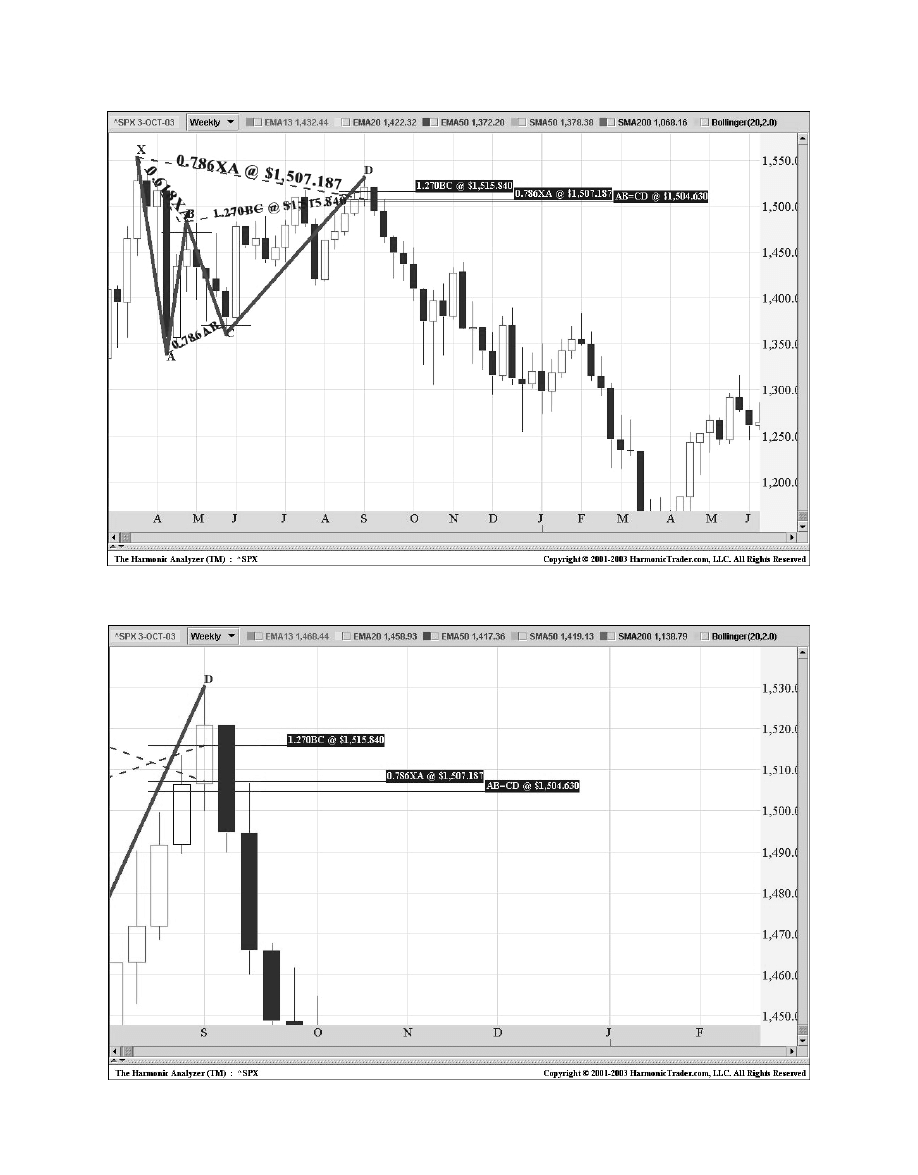
Figure 6.9
Chapter 6
The Gartley Pattern
107
Figure 6.10
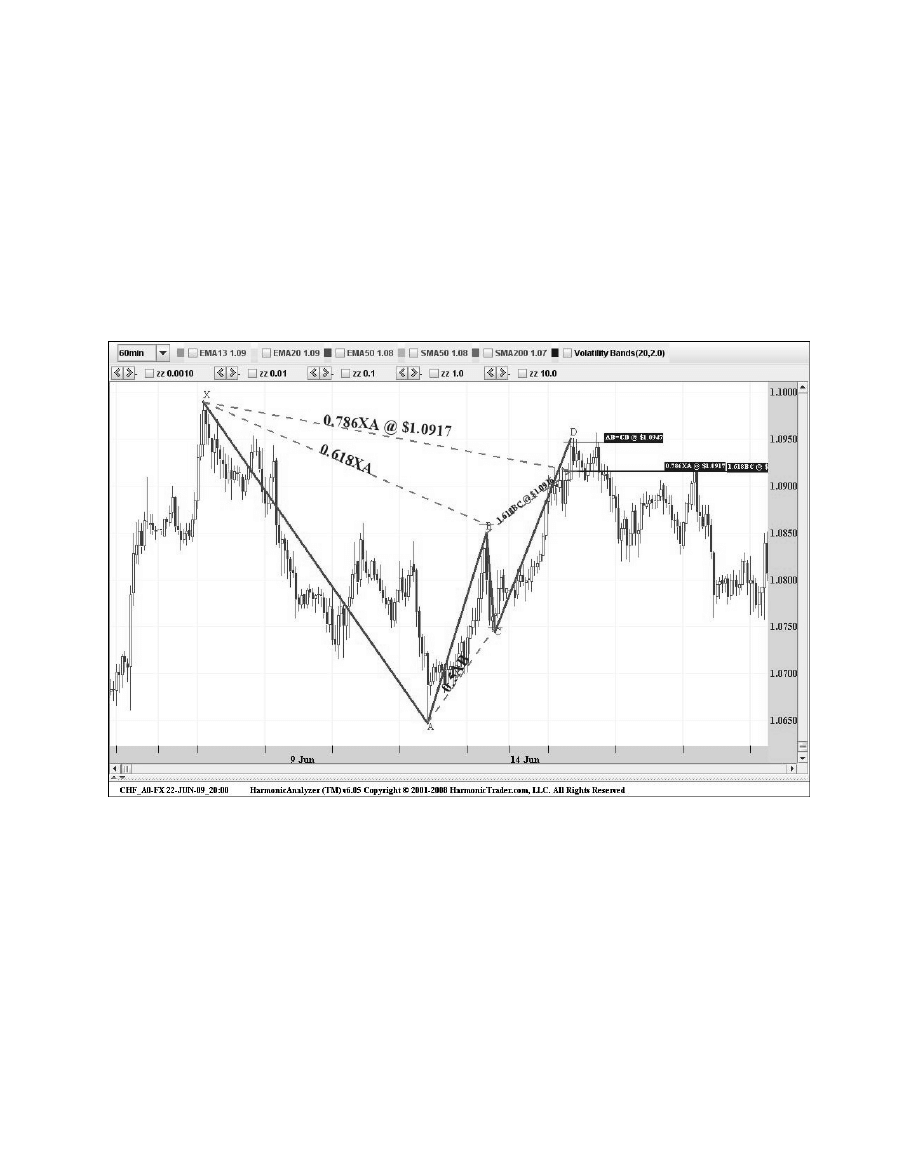
Swiss Franc
(CHF_A0-FX): 60-Minute
The next example of a Bearish Gartley in the Swiss Franc shows another excellent harmonic
pattern in the currency markets (see Figure 6.11). The 60-minute chart possessed a distinct
pattern, clearly defining the critical harmonic resistance. The pattern formed the required
Fibonacci alignment to validate the structure, especially the precise 0.618 B point. The price
action stabilized nicely after testing the entire PRZ and the pattern represented an excellent
intra-day selling opportunity.
108
Harmonic Trading: Volume One
Figure 6.11
Although the 0.786 XA retracement and the 1.618 BC projection converged in the low range
of the zone, the reversal did not occur until the AB=CD was completed. Again, this example
underscores the importance of the AB=CD pattern as a mandatory requirement in the Gartley
PRZ. The following chart of the price action in the PRZ shows the resistance as defined by the
AB=CD completion point (see Figure 6.12).
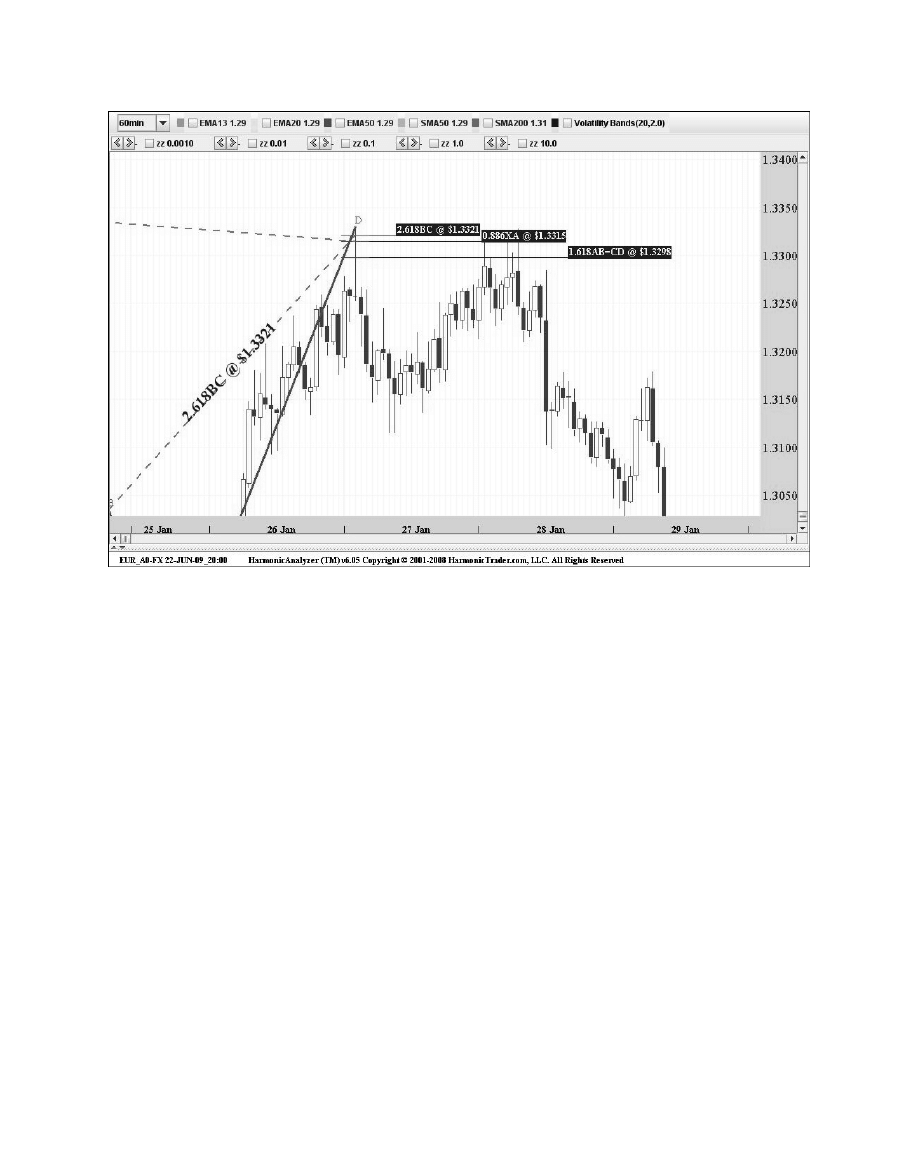
Figure 6.12
The price action clearly stalled in the zone and rolled over decisively after testing all the
numbers at the pattern’s completion point. The distinct structure provided a clear signal of an
impending reversal. These situations materialize in all markets on any timeframe. However,
harmonic patterns in the currency markets frequently provide even more defined opportunities,
as these intra-day setups continually materialize. Although smaller intra-day intervals provide
similar trading opportunities, the larger patterns on 15-minute and 60-minute timeframes tend
to allow for more deliberation and to offer clearer reversal signals.
Chapter 6
The Gartley Pattern
109
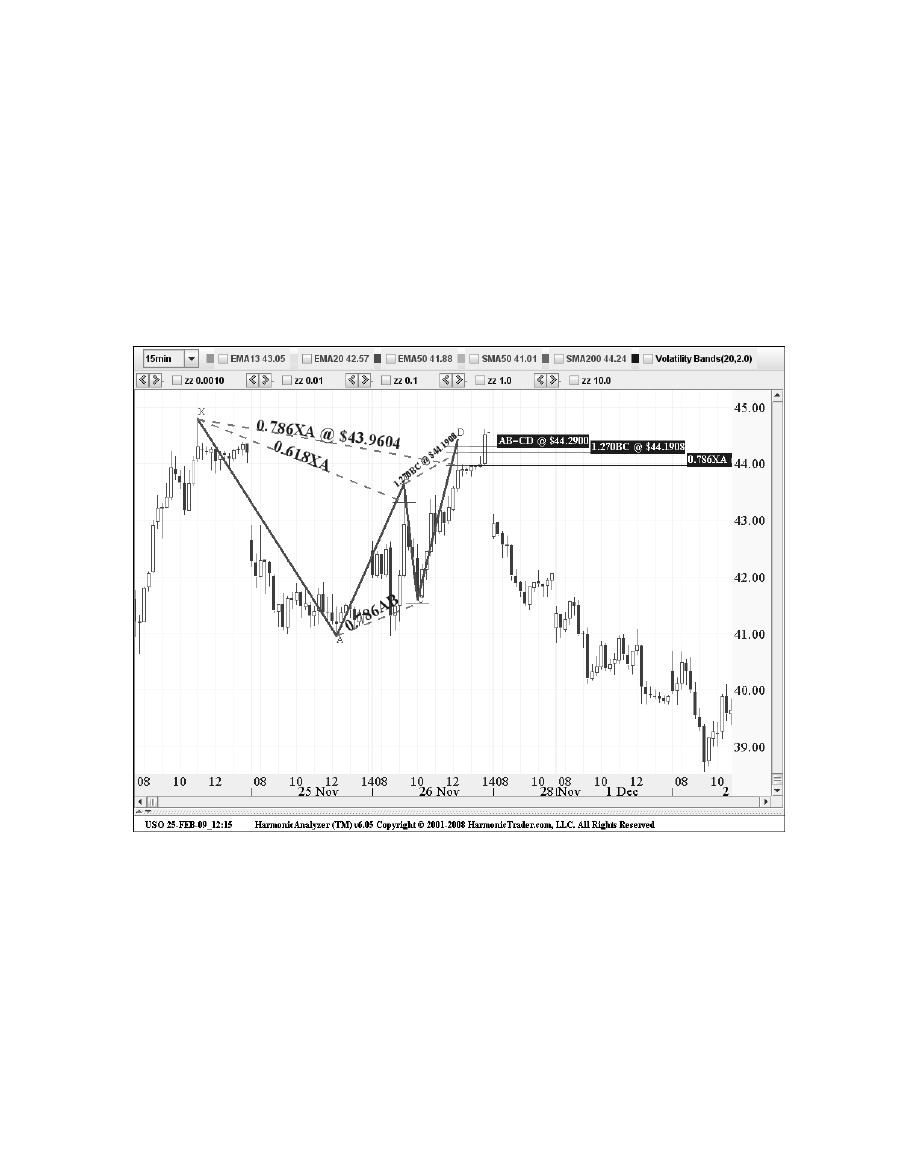
United States Oil Fund ETF
(USO): 15-Minute
The USO formed a Bearish Gartley on this 60-minute chart (see Figure 6.13). The distinct
AB=CD pattern completion point and the 0.786 XA retracement defined the 44 area as critical
intra-day resistance. The price action reversed immediately after testing all the numbers in the
PRZ. The AB=CD pattern defined the top range of the resistance and confirmed the optimal
entry point for the trade. Again, it is important to note that the distinguishing element of this
example is the precise 0.618 B point retracement that validated the structure.
110
Harmonic Trading: Volume One
Figure 6.13
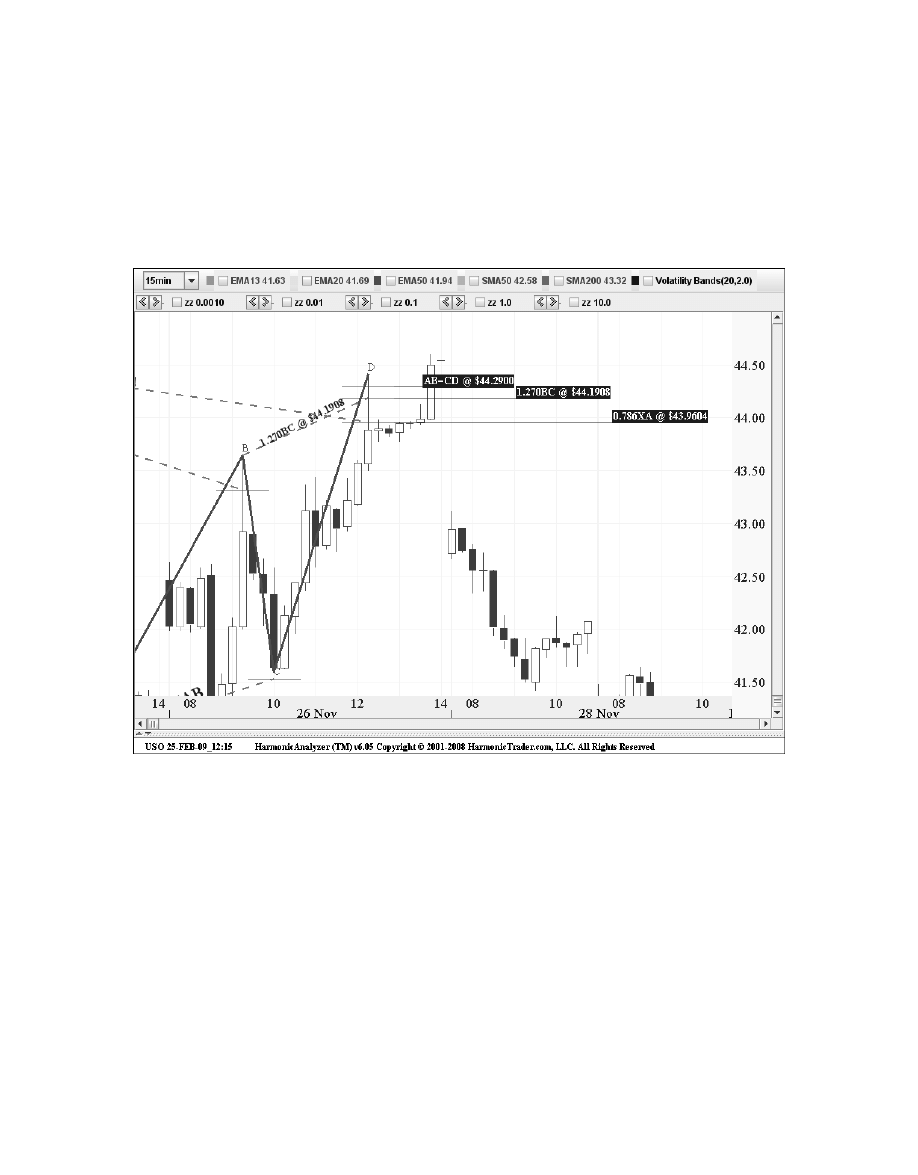
Figure 6.14
Although execution techniques will be covered later in this book in Chapter 11, “The
Harmonic Trade Management System,” this example underscores the importance of executing
in the zone. The Bearish Gartley pattern clearly indicated the area just above the $44 level as
the ideal entry for the short. When the price action hit the zone, there was a distinct window of
opportunity to execute the trade.
As I mentioned in the previous chapter, this is another example of the importance of PRICE
over TIME. Without engaging into a long-winded debate, the importance of price targets as a
determination for the execution of a trade must outweigh the time projections and expectations
of the market action. In the case of the USO, the focus should have been on the completion
point of the AB=CD pattern.
Chapter 6
The Gartley Pattern
111
The following chart of the price action in the PRZ shows an ideal reversal after the AB=CD
and the 0.786 XA retracement were tested (see Figure 6.14). The interesting aspect of this
reversal is the downside continuation that occurred after the reversal was complete. However,
the quick test that occurred at the pattern’s completion could have resulted in a missed
opportunity. When the price action traded into the PRZ, it reversed on the open of the next
day’s trading.
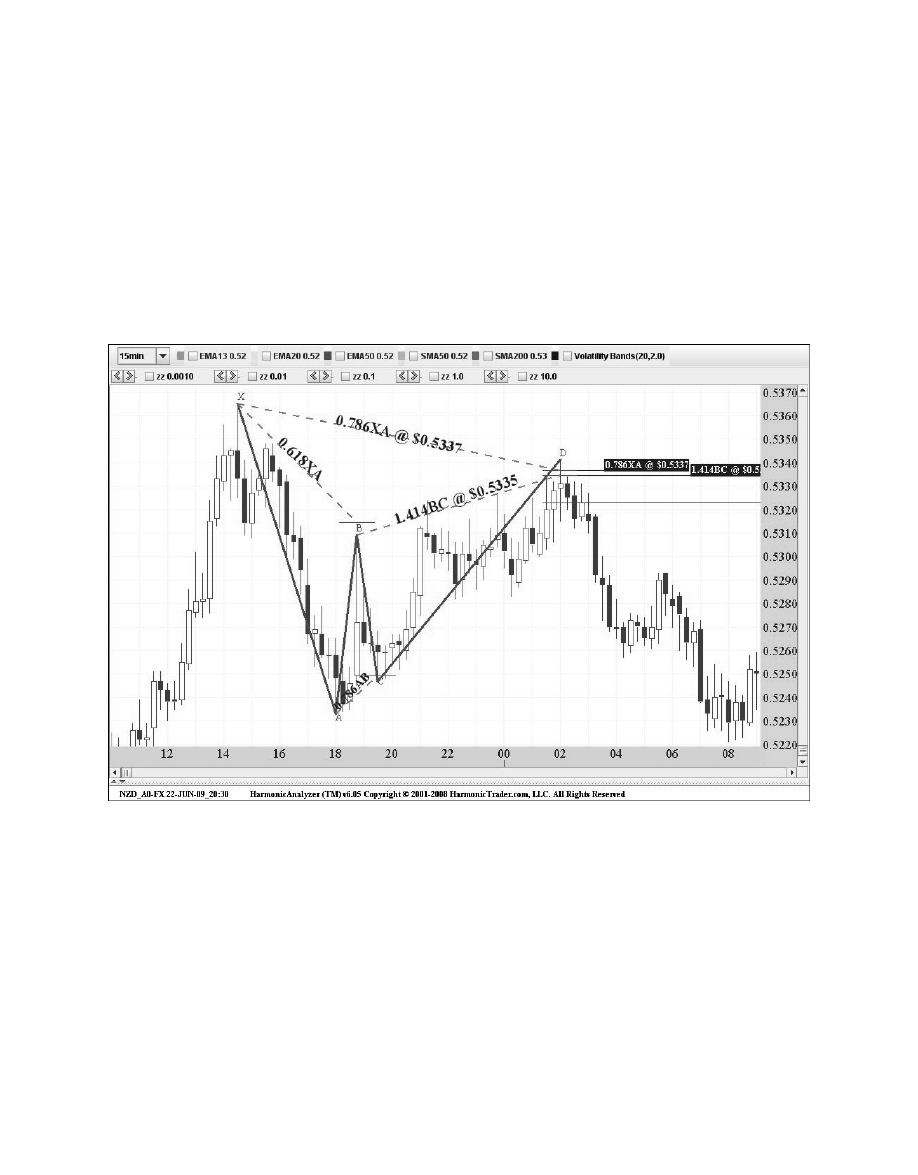
New Zealand Dollar
(NZD_A0-FX): 15-Minute
The next example in the New Zealand Dollar illustrates the ideal structure that valid Bearish
Gartley patterns should possess. The distinct harmonic pattern on the 15-minute chart in Figure
6.15 defined another fantastic intra-day trading opportunity in the currency markets. The setup
identified critical harmonic resistance in the 0.5330 area. The pattern formed the required
Fibonacci alignment to validate the structure, with a precise 0.618 B point in particular. The
price action stalled after testing the entire PRZ and reversed shortly thereafter.
112
Harmonic Trading: Volume One
Figure 6.15
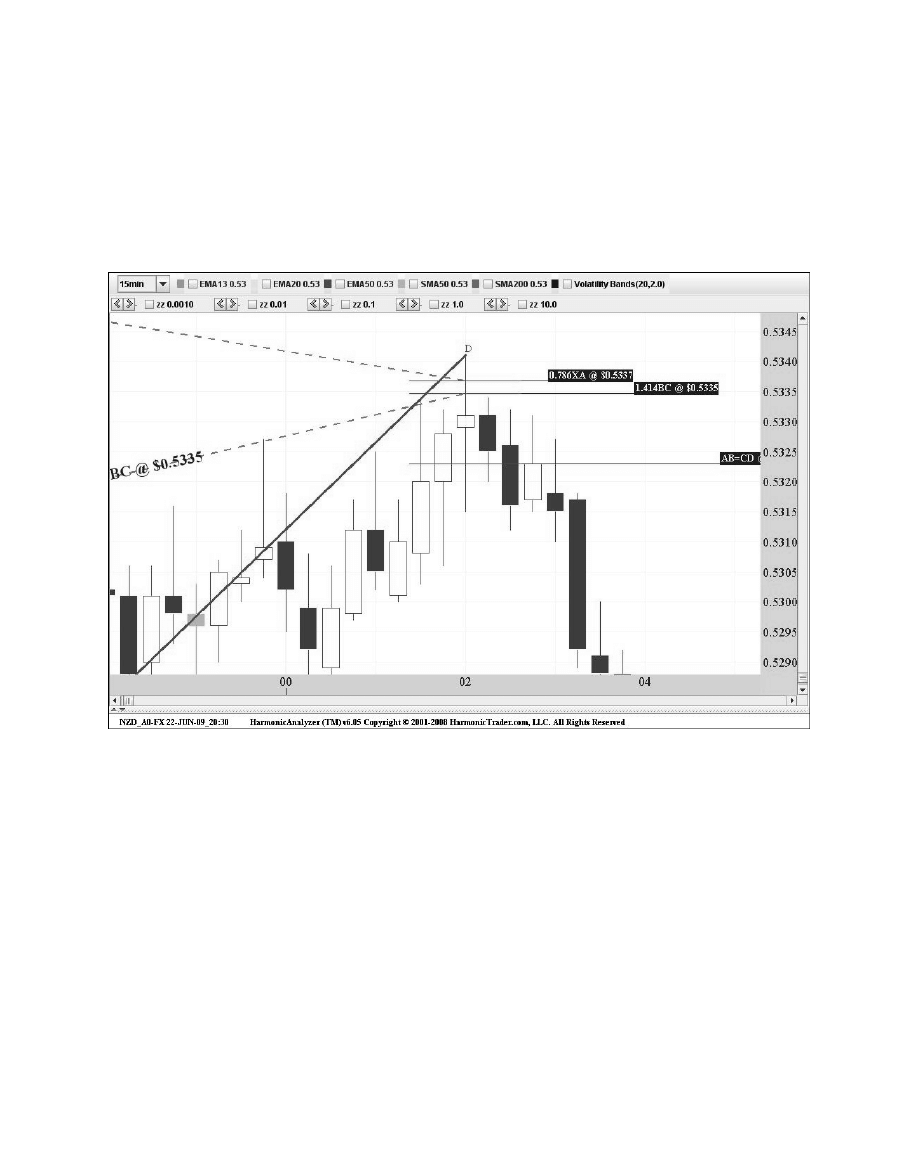
Figure 6.16 shows the price action at the completion of the pattern. The rally stalled right at
the numbers and reversed immediately after testing the PRZ. The distinct change in the nature
of the preceding uptrend was the overwhelming sign that the reversal was valid. The execution
of the short should focus on the entire range of the projected harmonic resistance, as this
example presents an ideal scenario of price action that reverses ideally from the completion of
the setup.
Chapter 6
The Gartley Pattern
113
Figure 6.16

The Perfect Gartley
The Perfect Gartley should possess the following elements:
1. Precise 0.618 B point retracement of the XA leg.
2. Precise 0.786 D point retracement of the XA leg in the PRZ.
3. Mandatory 1.618 BC projection.
4. Equivalent and Perfect AB=CD (0.618/1.618) with distinct symmetry and time
duration for each leg.
5. C point at a 0.618 retracement.
Although the
ideal Gartley is well defined, a perfect Gartley utilizes the perfect AB=CD
pattern (0.618/1.618) structure. The perfect AB=CD is primarily defined by the C point
retracement that should be precisely 0.618 of the AB leg. The 0.618 C point retracement sets
up the 1.618 BC projection. For obvious reasons, the 0.618 and 1.618 AB=CD pattern
represent the most harmonic ratios that are directly derived from the Fibonacci sequence.
The perfect Gartley should entail an exact B point retracement. Although the ideal Gartley
structure allows only a slight variation of the 0.618 B point retracement, a perfect Gartley
should possess an almost exact retracement. Furthermore, the C point should be at a 0.618
retracement. Due to the perfect AB=CD required to validate this structure, the C point is
another precise ratio that distinguishes the pattern. Another aspect of the perfect Gartley
pattern is the general symmetry and time consideration of the structure, where each leg is
exactly equivalent in duration.
114
Harmonic Trading: Volume One

The Perfect Bullish Gartley
The perfect Bullish Gartley pattern is primarily defined by an exact 0.618 retracement at the
B point (see Figure 6.17). Although the ideal price action should test the entire range of the
Potential Reversal Zone (PRZ), the minimum AB=CD and the 0.786 XA leg still represent
the most important numbers in the completion pattern. The structure should be distinct and
possess ideal symmetry. In addition, the AB=CD should be a perfect bullish structure with
0.618 and 1.618 ratios at the respective points. The combination of these elements define a
remarkably ideal setup with a particularly critical PRZ. Although these structures are rare,
they represent the best alignment of all the Gartley variations.
Chapter 6
The Gartley Pattern
115
C
A
D
0.618
1.618
B
X
0.618
0.786
Figure 6.17
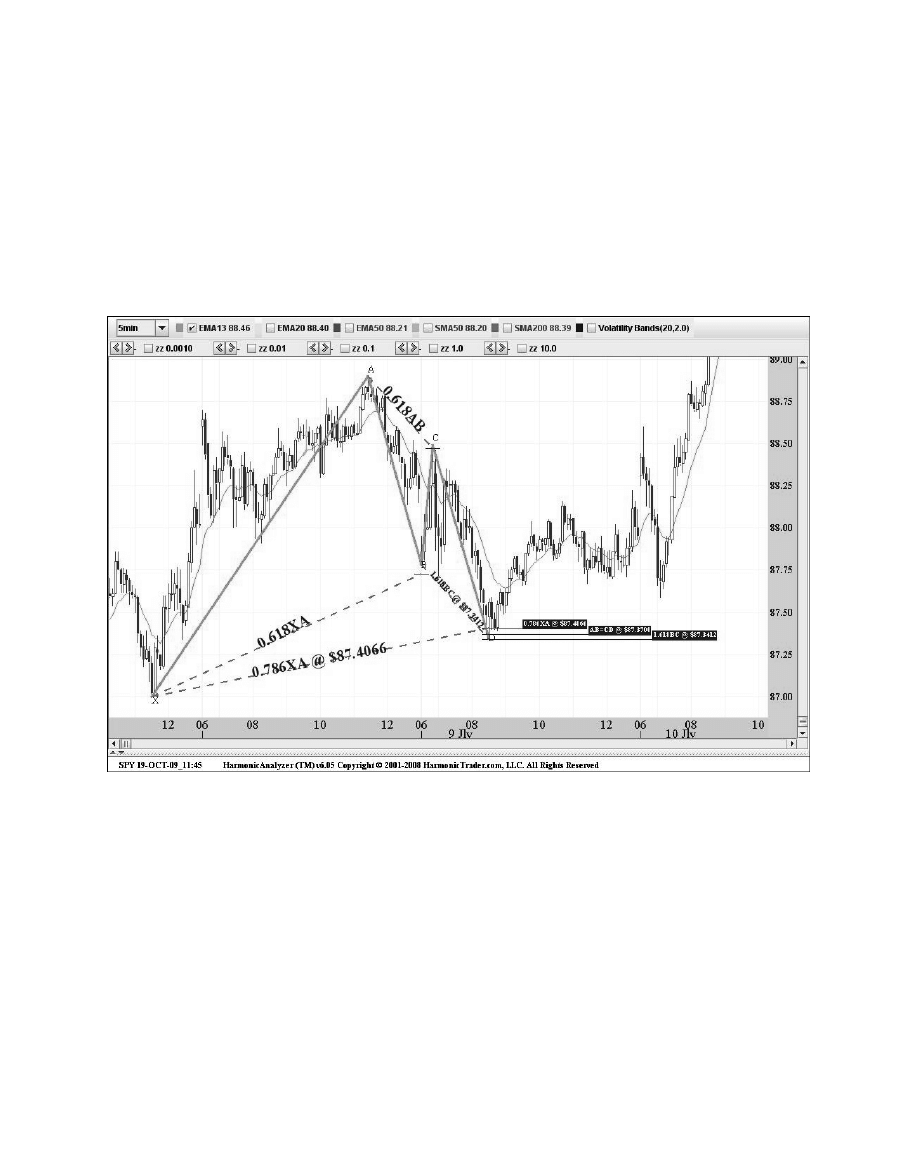
Standard and Poor’s 500 Tracking Stock
(SPY): 5-Minute
The following chart of the perfect Bullish Gartley in the SPY exemplifies the required structure
and alignment of Fibonacci ratios to validate the pattern (see Figure 6.18). Starting with an
almost exact 61.8% B point retracement, the price action formed a perfect AB=CD pattern that
reversed exactly at the pattern’s completion point.
116
Harmonic Trading: Volume One
Figure 6.18
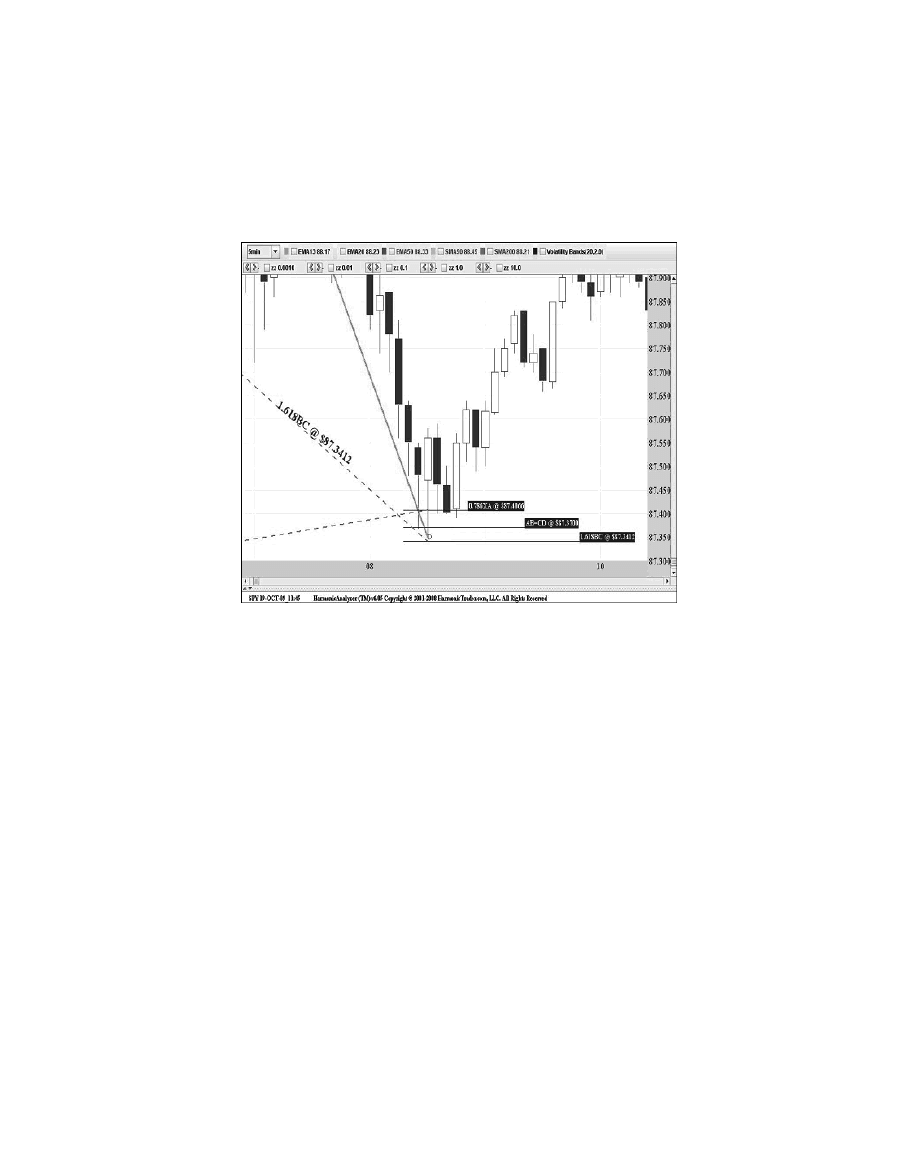
Chapter 6
The Gartley Pattern
117
The 0.786 XA retracement and the 1.618 BC projection complemented the perfect Bullish
AB=CD pattern to define a tight Potential Reversal Zone (PRZ). These numbers clearly
pinpointed the trade opportunity to buy the intra-day support in a close 15-cent range just
under 87.50 level. Figure 6.19 of the price action in the PRZ shows an ideal reversal after
all of the harmonic numbers were tested.
Figure 6.19
The SPY declined sharply as it approached the PRZ. Despite this drop, the price action
stabilized shortly after the pattern completed and rallied significantly immediately after testing
all of the numbers in the zone. In addition, the tight range of the PRZ created a clear make-or-
break harmonic support that represented an optimal entry for the intra-day long position.

The Perfect Bearish Gartley
The perfect Bearish Gartley pattern is defined by an exact 0.618 retracement at the B point
(see Figure 6.20). In addition, a perfect Bearish AB=CD and the 0.786 XA leg must be
complemented by a 1.618 BC projection.
118
Harmonic Trading: Volume One
X
C
B
0.786
0.618
0.618
1.618
D
A
Figure 6.20
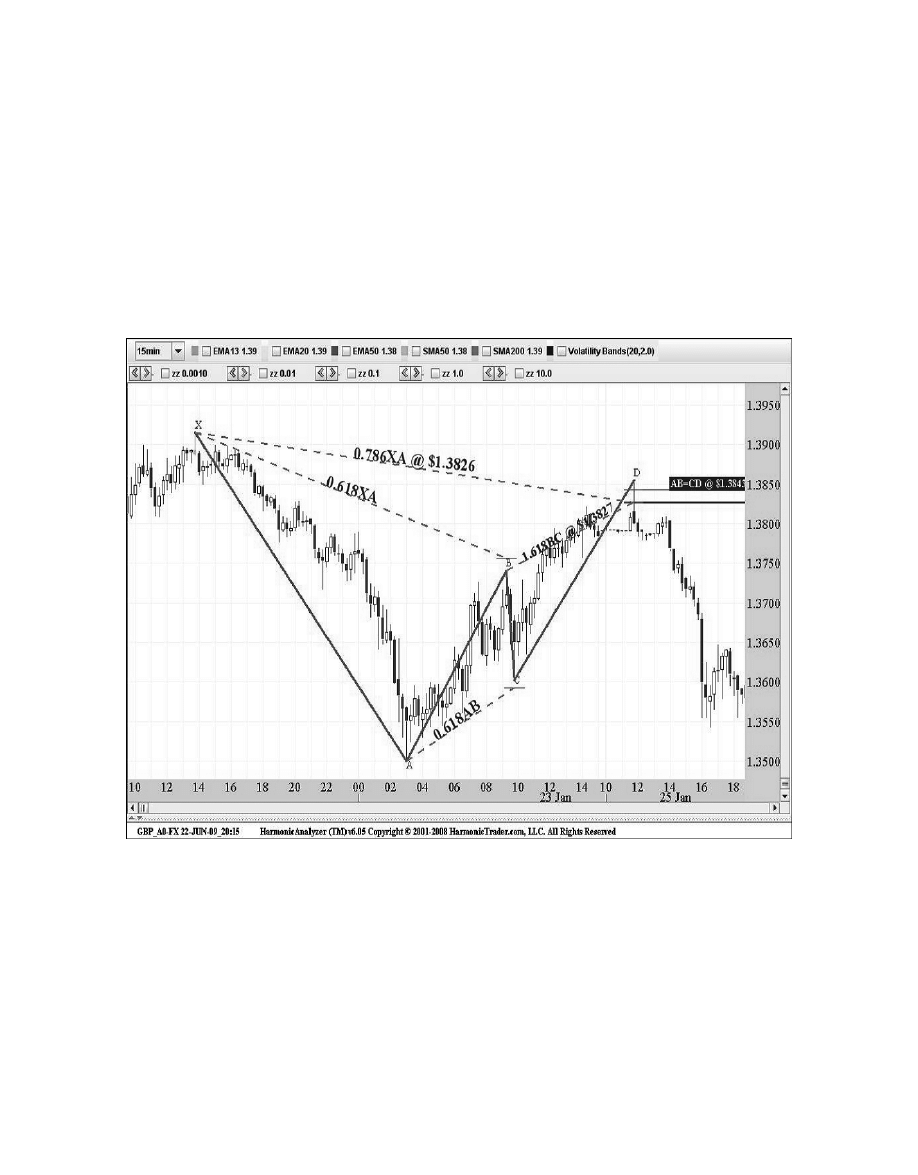
British Pound
(GBP_A0-FX): 15-Minute
The British Pound formed a perfect Bearish Gartley on 15-minute chart in Figure 6.21. The
perfect Bullish AB=CD pattern completion point and the 0.786 XA retracement in the 1.3830
area were the defining limits in the PRZ, as the price action reversed immediately after testing
these numbers. The 1.618 BC projection complemented the resistance and confirmed the
optimal entry target for the trade. Again, it is important to note that the distinguishing element
of this example is the precise 0.618 B point retracement that validated the structure.
Chapter 6
The Gartley Pattern
119
Figure 6.21
The price action in the Potential Reversal Zone (PRZ) shows an ideal reversal after the
AB=CD and the 0.786 XA retracement were tested. The interesting aspect of this reversal is the
downside continuation that occurred after the reversal was complete. However, the quick test
that occurred at the pattern’s completion could have resulted in a missed opportunity. When
the price action traded into the PRZ, it reversed immediately thereafter. Although execution
techniques will be covered later in this book in the Trade Management section, this example
underscores the importance of executing in the zone. The Bearish Gartley pattern clearly
indicated the area at the 1.3830 level as the ideal entry for the short. When the stock hit the
zone, there was only a small window of opportunity to execute the trade.

Gartley Pattern Summary
The Gartley pattern is a controversial pattern. Despite the varying interpretations within
The Great Gartley Controversy, the most harmonic Gartley pattern possesses distinct
characteristics at all points within the structural rules were originally outlined in “The Harmonic
Trader.”
The 0.618 B point retracement is critical in defining a valid Gartley structure. Although the
0.786 XA retracement is an important element of the structure, the equivalent AB=CD within
the pattern is the most critical completion point in the Potential Reversal Zone (PRZ).
Furthermore, the AB=CD completion is a mandatory minimum requirement for all valid Gartley
patterns.
1. Precise 0.618 B point retracement of the XA leg.
2. Precise 0.786 D point retracement of the XA leg in the PRZ.
3. 1.27 or 1.618 BC projection.
4. Equivalent AB=CD.
5. C point retracement can vary between a 0.382 to a 0.886.
The Gartley pattern must include these specific conditions to define the best harmonic
structures. Although the Gartley may resemble a Bat, the Fibonacci ratios utilized in the setup
are unique to this pattern. In addition, the pattern should be quite distinct and possess ideal
symmetry.
120
Harmonic Trading: Volume One

The Crab is a precise harmonic pattern that I discovered in 2000. The Crab is a distinct 5-point
extension structure that utilizes a 1.618 projection of the XA leg exclusively. This is the most
critical aspect of the pattern and the defining level in the Potential Reversal Zone (PRZ). The
extreme (2.618, 3.14, 3.618) projection of the BC complements the 1.618 XA extension. In
addition, the Crab primarily utilizes an Alternate AB=CD to complement the PRZ. Although a
minimum AB=CD completion is necessary for a valid structure, the Alternate 1.27 or 1.618
calculation are the most commonly found variations in the PRZ. In fact, the 1.618 AB=CD
pattern is the most common alternate calculation utilized in the structure.
It is important to note that the alternate AB=CD pattern within the Crab is the least important
number in the PRZ. The combination of the 1.618 projection of the XA leg and the extreme BC
projection usually creates a distinct range for the completion of the pattern. In fact, the AB=CD
calculation is probably the least important in the Crab than all other patterns. Although the
AB=CD structure is less significant in the case of the Crab, the pattern should still possess a
distinct symmetry.
Due to the extremity of the projections utilized in the completion of the pattern, the Crab
frequently experiences sharp price action and dramatic reversals. It is common for price action
to possess extreme ranges, quickly testing the Crab PRZ during the reversal. In fact, the price
action experienced in Crab pattern completions is usually the most extreme of all of the
patterns.
Despite the typically severe reversals, the focus of the pattern’s completion should examine
the 1.618 XA projection. In most cases, it is best to wait for the 1.618 to be tested. However,
the convergence of the BC projection should serve as the minimum requirement for the pattern
to be considered complete. The most distinct Crab structures will typically possess a precise
range of the XA and BC projections. Again, the AB=CD pattern, whether the equivalent or
alternate calculation, should complement this area, but it is not a significant consideration in
the PRZ.
121

Crab pattern elements:
• B point that is a 0.618 retracement of XA or less.
• Extreme BC projection that is typically a 2.618, 3.14, or 3.618.
• Alternate 1.27 or 1.618 AB=CD pattern required.
• 1.618 XA projection as the defining limit with the structure.
• C point with range between 0.382 and 0.886.
It is important to understand that the Crab is a unique 5-point corrective structure. Although
the pattern’s dependence on the 1.618 XA projection to define the completion area is critical,
it is not the only element in the structure. Essentially, the Crab is more than just a 1.618
extension. As I discussed previously regarding the importance of pattern differentiation, the
specification of all points within the Crab is essential to find the most valid structures.
Furthermore, this specification relates to all patterns, especially extension patterns.
I would like to take a moment to discuss the difference between retracement and extension
patterns. Retracement patterns, like the Bat or the Gartley, are 5-point corrective structures that
retest a critical high or low point, which is the initial point (X). In combination with some type
of AB=CD structure, the completion of the pattern possesses a defined range of harmonic
numbers—the PRZ.
These numbers serve as the pivot area relative to the initial starting point (X) for the
anticipated reversal. Essentially, if the price action exceeds the initial starting point (X), the
pattern is considered violated and the stop loss is executed. Therefore, the retracement
patterns possess more clearly defined parameters. In particular, the initial point (X) is the
determining level. In comparison, extension patterns like the Crab do not possess significant
relative validation levels. The initial point (X) is a less significant point in the extension
structure than a retracement pattern. Furthermore, the stop loss consideration is typically
more subjective, and the treatment of the price action in the PRZ must be handled differently.
The determination of the validity of extension patterns may require more risk in the actual
trade execution of the setup than most retracement situations. Although these strategies will be
covered extensively in Chapter 11, “The Harmonic Trade Management System,” it is important
to realize the difference between these two types of patterns.
122
Harmonic Trading: Volume One

Chapter 7
The Crab Pattern
123
X
B
1.618
C
0.382;
0.886
2.618; 3.618
0.382;
0.618
A
D
The Bullish Crab Pattern
The Bullish Crab pattern possesses a distinct structure with an extended final leg (see Figure
7.1). It is common for price action to become extreme as the pattern approaches its completion
point. Again, it is best to wait for the 1.618 XA extension to be tested, but the BC projection
should be a significant consideration and a minimum price level within the PRZ. In addition, the
Alternate 1.27 or 1.618 AB=CD should complement this area.
Figure 7.1
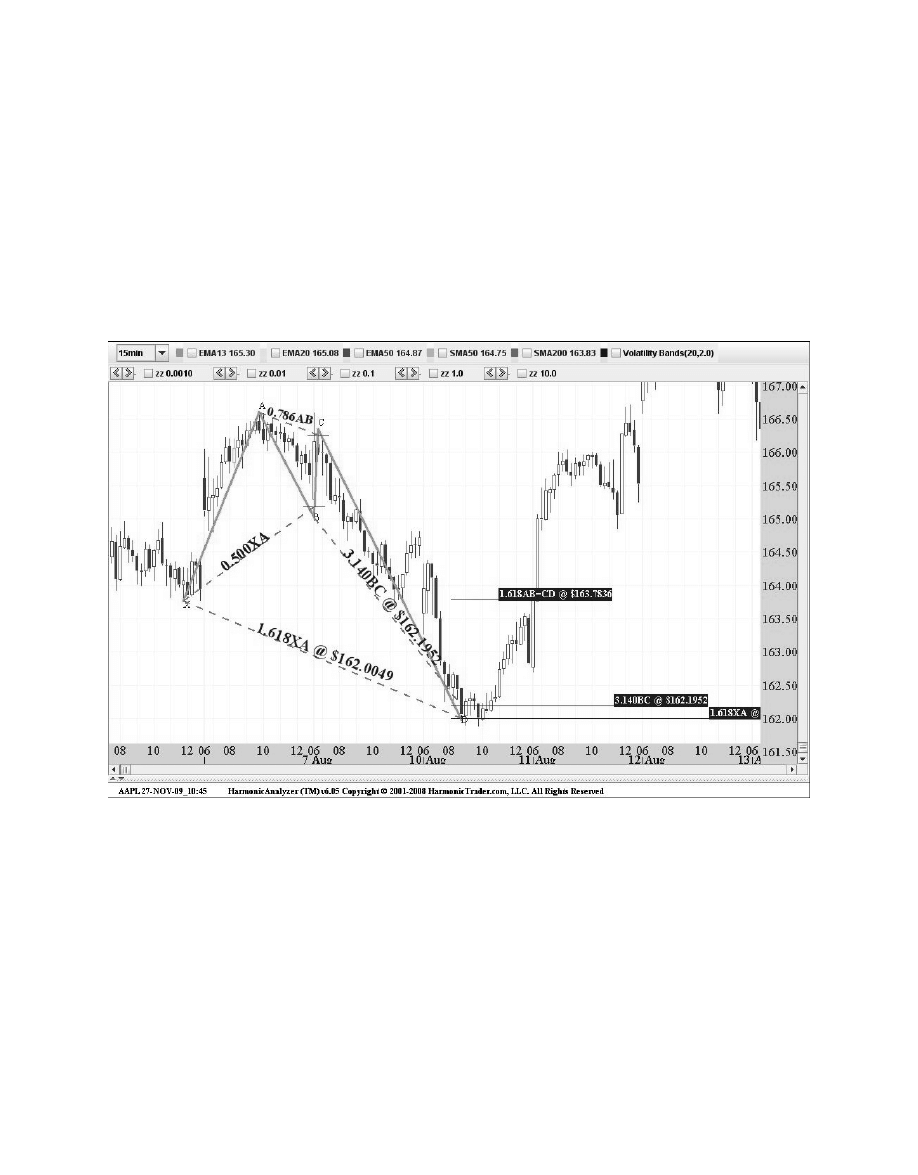
124
Harmonic Trading: Volume One
Apple
(AAPL): 15-Minute
Figure 7.2 is an example of an intra-day Bullish Crab in Apple which possessed a distinct 1.618
projection with a 3.14 BC projection that completed in the same area. The completion of the
Crab included an Alternate 1.618 AB=CD pattern that defined the top range of the PRZ.
Although AB=CD pattern consideration is less important in the Crab pattern, it is still utilized
with the other more significant numbers—the 1.618 XA projection and the 3.14 BC projection.
For Apple, the Bullish Crab clearly defined the 162 level as important intra-day support.
Figure 7.2
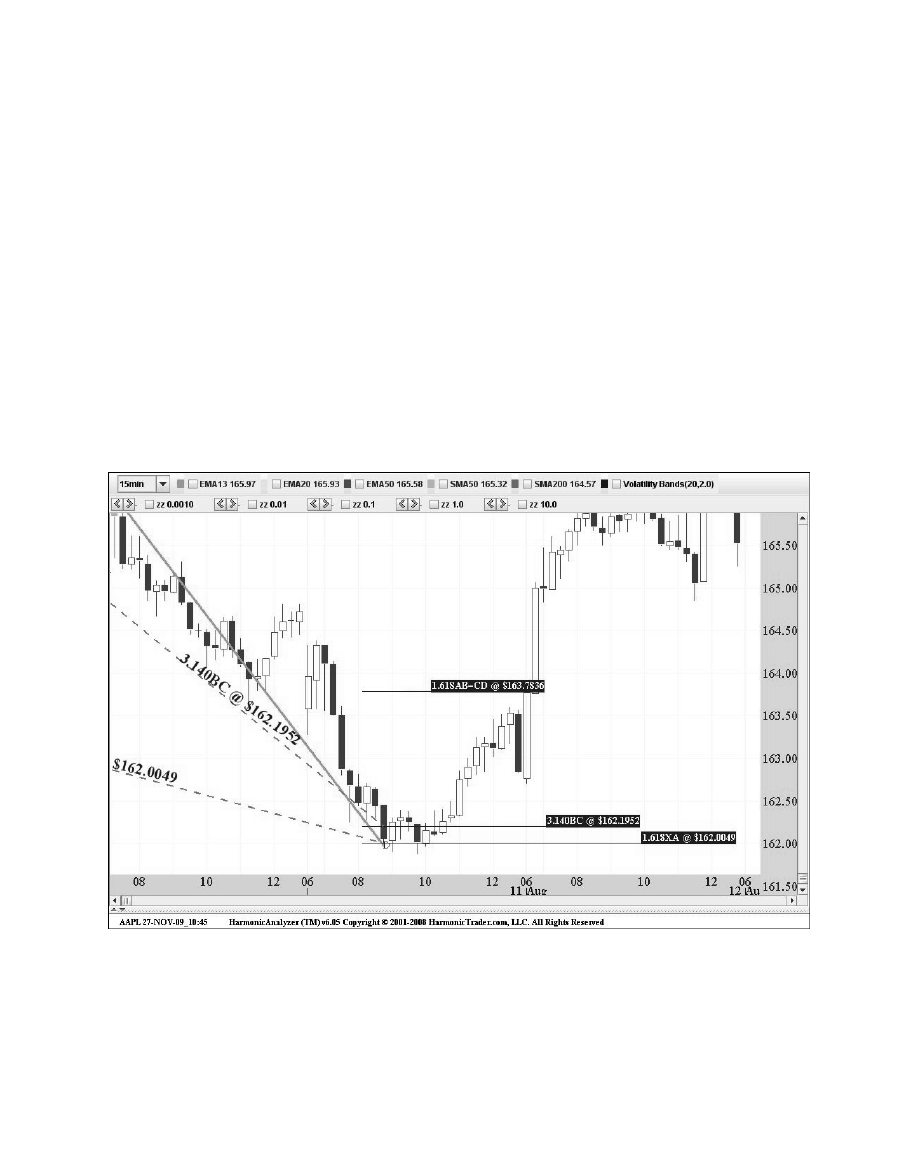
This intra-day chart of Apple also reveals the typical extreme price action that can occur as
the pattern nears completion. The sharp sell-off into the PRZ reflects the nature of both the
1.618 XA leg and the smaller yet more extended BC leg. These projections typically serve as
the most important support levels at the completion of the pattern. In this example of Apple, the
stock sank sharply before stabilizing in the PRZ. Shortly after all of the numbers in the zone
were tested, the price action reversed decisively and marked a critical intra-day turning point.
Figure 7.3 of the price action in the PRZ shows the ideal reversal that occurred after all of the
harmonic numbers were tested.
The tight convergence of the 1.618 XA and the 3.14 BC projection just above 162 was
clearly the defining limit of the PRZ. Sometimes, the Alternate AB=CD pattern will complement
the other two more significant numbers in the PRZ. In the case of Apple, the structure was
quite distinct and possessed a substantial 1.618 XA extension. This chart of the price action in
the Potential Reversal Zone also shows an ideal turnaround in the stock immediately after all of
the numbers were tested. In intra-day situations like these, valid reversals will possess price
action that responds dramatically to precise areas of harmonic support.
Chapter 7
The Crab Pattern
125
Figure 7.3
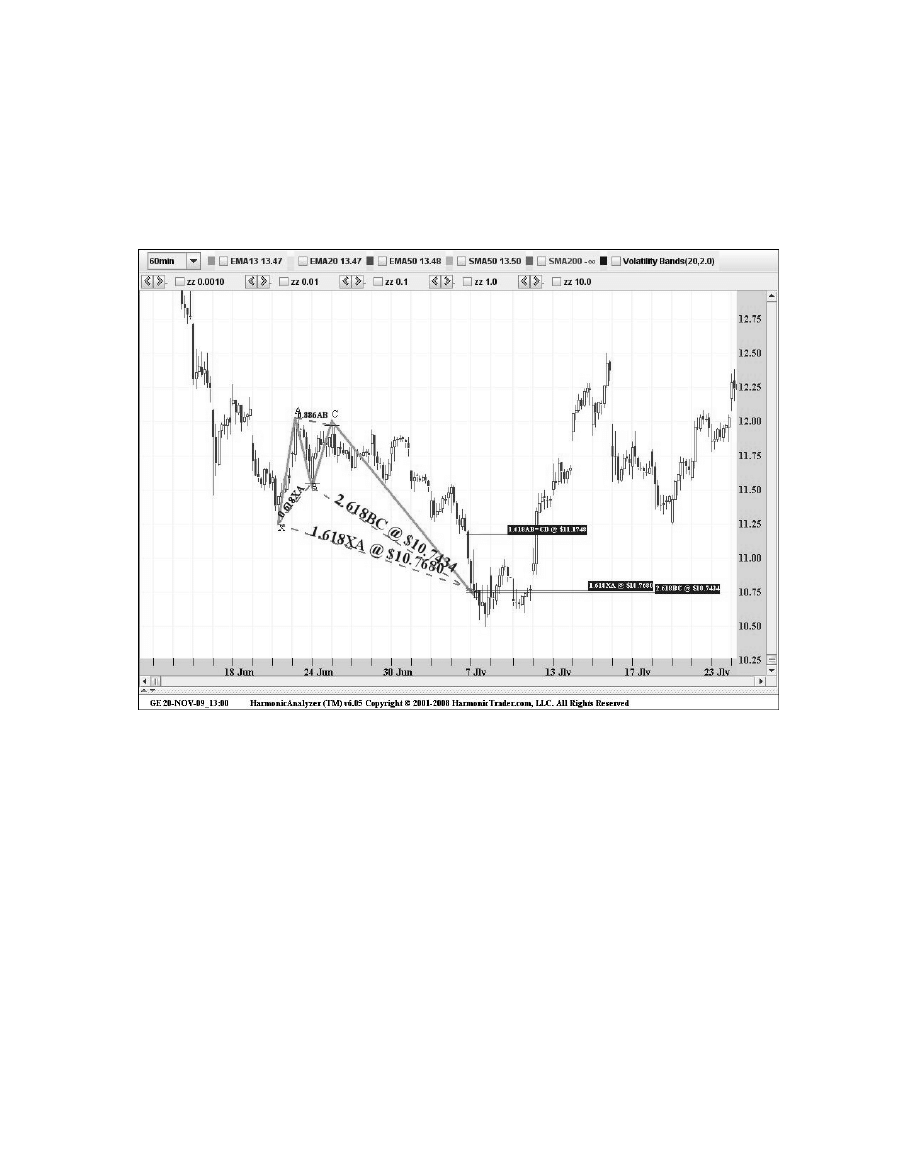
General Electric
(GE): 60-Minute
This 60-minute chart of General Electric shows another distinct intra-day Bullish Crab that
reversed immediately after testing the entire PRZ (see Figure 7.4).
126
Harmonic Trading: Volume One
Figure 7.4
Although the pattern possessed the required alignment of Fibonacci ratios to validate the
structure, the Alternate 1.618 AB=CD projection was not as close to the most important
number in the PRZ—the 1.618 XA leg. The XA leg defined the lower range of the PRZ at
10.75, while the BC projection complemented this area precisely. Clearly, the stock stabilized
after testing the entire zone and quickly confirmed the reversal, as the upside continuation
decisively rallied from the harmonic support. Again, the XA and BC legs were the defining limit
of the pattern while the AB=CD consideration merely complemented the harmonic support.
The following chart of the price action in the PRZ shows how the stock stabilized at the
convergence of the 1.618 XA and 2.618 BC projections (see Figure 7.5). The reversal
completed within a few days after the initial test of the harmonic support.
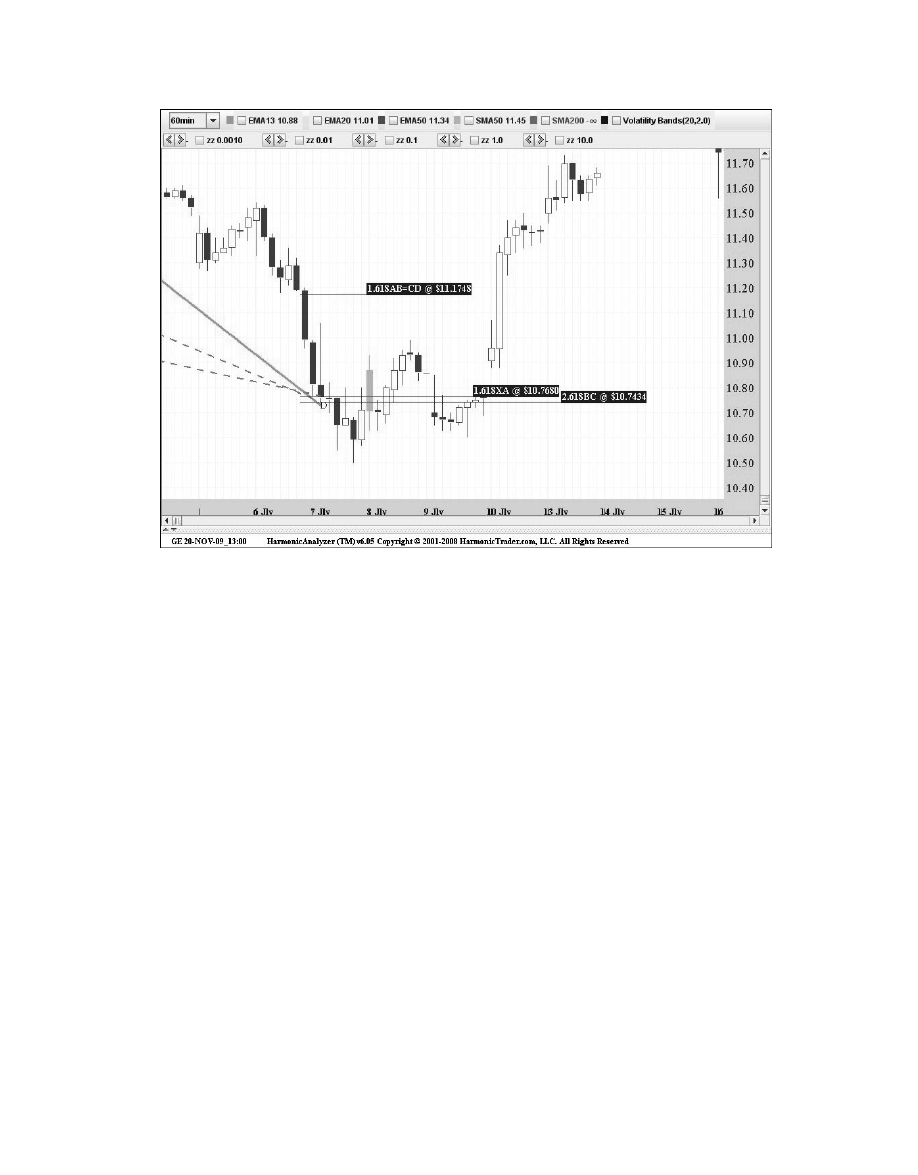
Chapter 7
The Crab Pattern
127
Figure 7.5
Again, it is important to note that the Crab pattern is less reliant on the three calculations
that typically define a PRZ. Although the Alternate AB=CD is merely complementary in this
Crab, the support defined by the PRZ is as accurate and effective as any pattern.
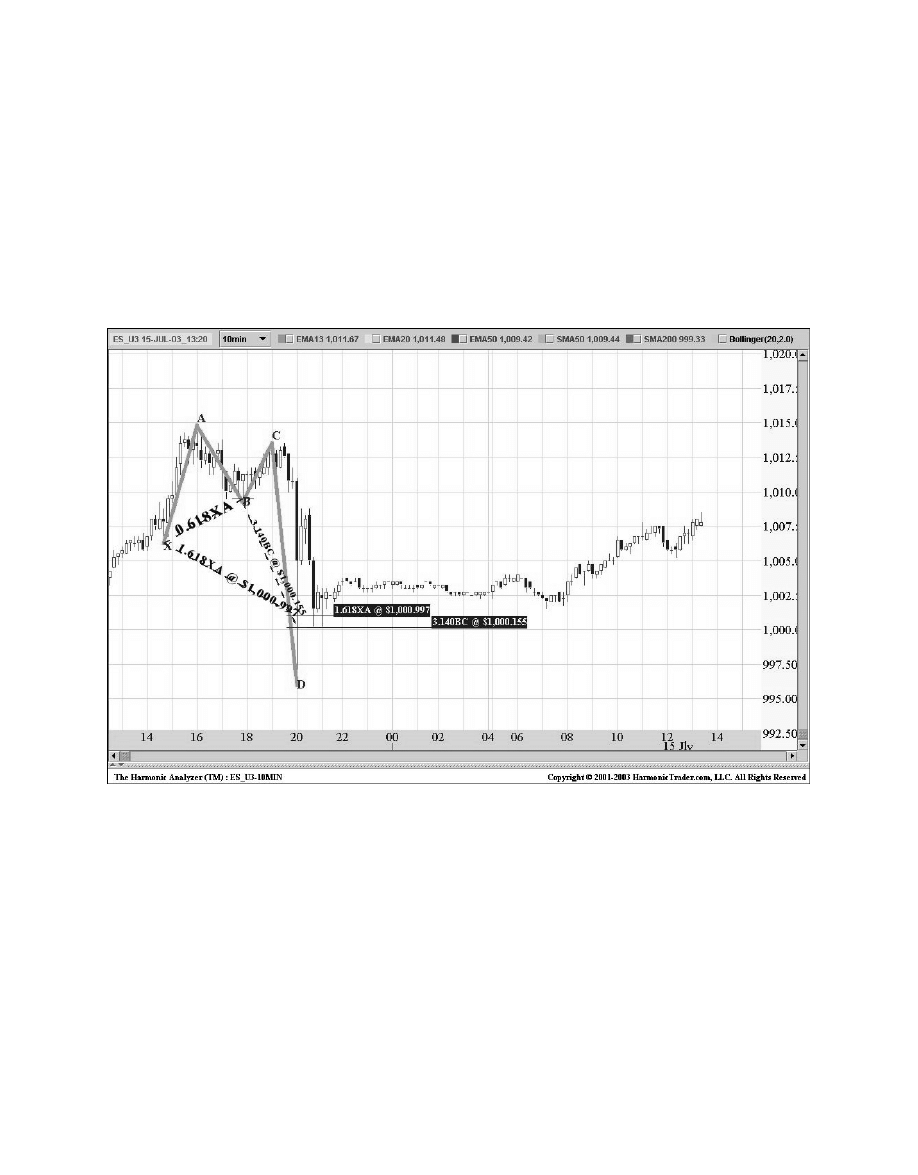
Standard and Poor’s 500 September Mini-Contract
(ES_U3): 10-Minute
The September 2003 ES Mini-contract formed a distinct Bullish Crab on this 10-minute chart
(see Figure 7.6). The pattern possessed nice symmetry with an ideal alignment of harmonic
numbers that defined a PRZ at the 1000 level. The convergence of the 1.618 XA and the 3.14
BC projections at the same level defined an ideal PRZ for the Crab pattern.
128
Harmonic Trading: Volume One
Figure 7.6
This setup was actually featured in my advisory service that I previously provided on my
website, HarmonicTrader.com. Although the pattern in the ES completed during the overnight
session, it still represented a valid trading opportunity. I outlined the situation in this day’s
Mini-Room post on my website, HarmonicTrader.com. On July 15, 2003, in the pre-market
report, I wrote:

“For today’s immediate action, the ES is up 7 in the pre-market. The
ES reversed from this Bullish Crab in the overnight session. This
complements the 1000 level and is now critical short-term support.
The open is critical for today’s trend. I would wait for the ES to pull
back slightly on (another) attempt to refill today’s upside gap. I
would watch for an early morning reversal…as an area to get long
for an attempt at new short-term highs.”
(HarmonicTrader.com, July 15, 2003, http://www.harmonictrader.com/
members/harmonic/home/miniroom071503.htm)
Although the price action did not offer a retest to get long in the PRZ, this set-up clearly
identified the critical intra-day support in the ES. Despite the extreme sell-off into the PRZ, the
ES stabilized after testing all of the numbers in the zone.
It is important to note that the initial point (X) utilized an “intermediate point” to begin the pat-
tern. The intermediate point, although not the clear low from the prior’s day action, was defined
well enough to establish the appropriate alignment of Fibonacci numbers in the structure. This
structure illustrates the importance of the relative alignment of ratios to define a pattern. The
formation of various patterns do not have to initiate from an absolute low or high. Although XA
legs that are well defined typically originate from an extreme price level, the symmetry and
validity of a particular pattern are more dependent upon the segments that comprise each
structure. In this example of the ES, both the XA and BC legs were distinct and effectively
outlined the pattern’s completion, despite originating from an intermediate support point from
the prior day.
Another consideration of this setup is the psychological price level that coincided with the
projected harmonic support. It is important to respect obvious “psychological” price levels that
occur at the completion of harmonic patterns. Price levels such as 50, 100, or 1000 can
frequently complement areas of harmonic support or resistance. In this case, the ES was
challenging the all-important 1000 level.
These situations are common and underscore the importance of Fibonacci alignments
to define potential harmonic structures. In fact, the various alignments of ratios that define
structures as valid patterns is one of the fundamental principles that separates Harmonic
Trading from all other Fibonacci-related methodologies. Furthermore, in my research of the
past ten years, the importance of ratio alignments has become more significant in validating
price structures as harmonic patterns.
On a side note, this intra-day chart example included a pattern that completed during the
overnight session. In recent years with the advent of 24-hour trading, the debate of which data
to use has become increasingly significant. Some have argued that only the regular session
(9:30 a.m.–4:00 p.m. EST) should be utilized. However, the surge in pre- and post-market
action, especially in futures contracts such as the Standard and Poor’s 500 (SPX) or its
“mini-me” sibling the ES, necessitates the inclusion of all trading action. The example of the
ES is a clear case of this technical phenomenon.
Although this situation can be difficult, a clear pattern that completes in the after-market
while most are sleeping can result in missed opportunities. Simply stated, trades—even the
Chapter 7
The Crab Pattern
129

best harmonic patterns—will be missed. Despite the inevitable frustration that may be
associated with these episodes, the pattern did clearly outline the short-term support and
distinct opportunity to get long the ES.
The Bearish Crab Pattern
The Bearish Crab pattern is a precise structure with a PRZ consisting of three numbers, the
1.618 XA retracement, the Alternate AB=CD, and an extreme BC projection (see Figure 7.7).
130
Harmonic Trading: Volume One
X
C
A
1.618
0.382;
0.618
0.382;
0.886
2.618;
3.618
D
B
Figure 7.7
The convergence of the XA and BC projections define the top range of the Potential
Reversal Zone. The 1.27 or the 1.618 Alternate AB=CD pattern typically complements the other
numbers at the pattern’s completion point. As was previously mentioned, the AB=CD pattern is
not as critical in the PRZ for the Crab as other patterns. At a minimum, the XA must be tested
before the reversal can be considered complete and the pattern a valid set-up. Although price
action may slightly exceed the 1.618 XA leg on the initial test of the PRZ, the completion point
in valid Crab patterns will mark the precise turning point for the reversal.
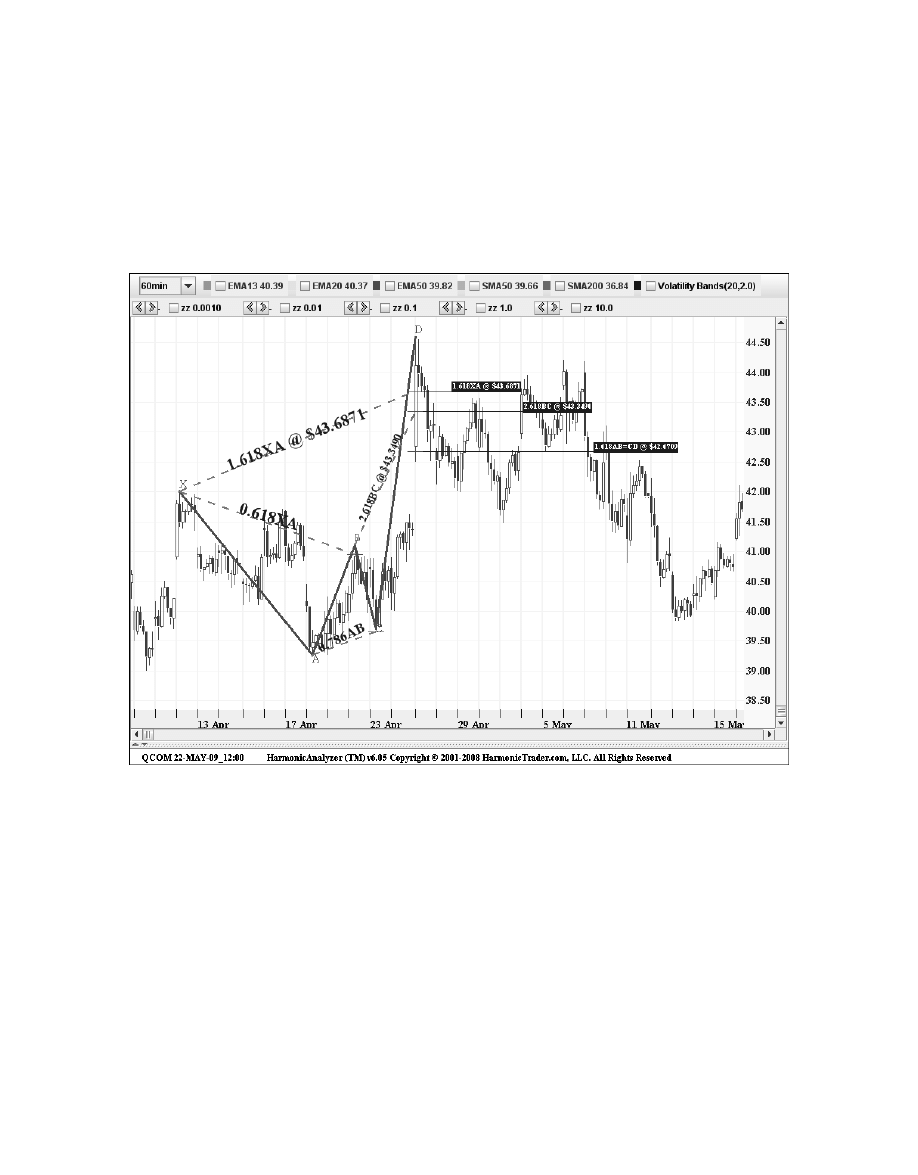
Qualcomm
(QCOM): 60-Minute
This intra-day Bearish Crab shows a distinct pattern with a convergence of the 1.618 XA and
the 2.618 BC projections and the Alternate 1.618 AB=CD completion defining a tight zone to
short the stock in the 42.75–43.70 range (see Figure 7.8).
Chapter 7
The Crab Pattern
131
Figure 7.8
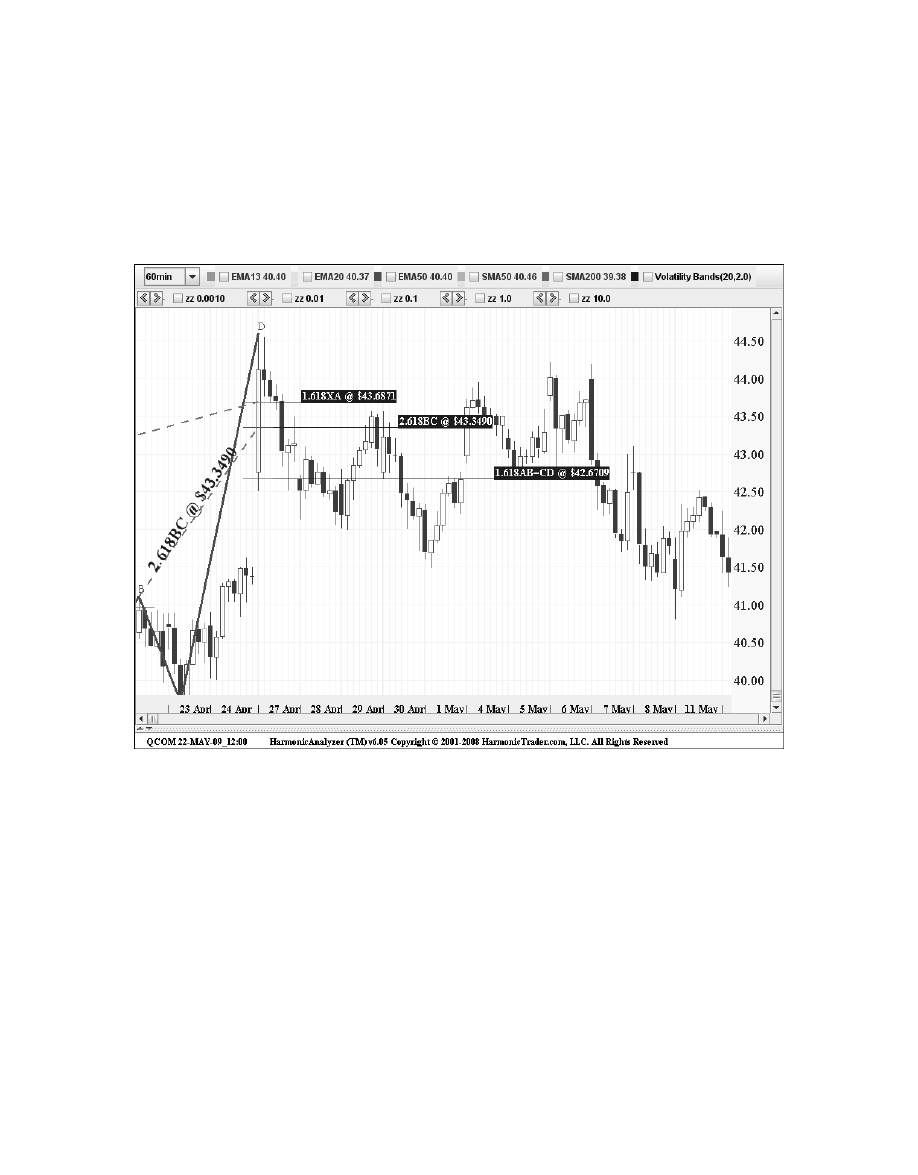
After opening slightly above the top range of the PRZ, the stock stalled at the harmonic
resistance and quickly declined within a short time after testing the entire range of harmonic
resistance. The following chart of the price action in the Potential Reversal Zone (PRZ) shows
the ideal reversal at the numbers (see Figure 7.9). Although QCOM opened above the zone,
the stock’s inability to continue the upside momentum is typically a sign of a reversal in
progress. In this case, the gap up on the open failed miserably in a distinct Bearish Crab PRZ.
132
Harmonic Trading: Volume One
Figure 7.9
This type of price action is common in the PRZ for the Crab pattern and exemplifies the
extreme price action that can be found in valid reversals. The immediate price action following
the test of all the numbers at the pattern’s completion point is one of the primary considerations
in the validity of the setup. In this case, the clear failure of the rally in the PRZ marked the
reversal.
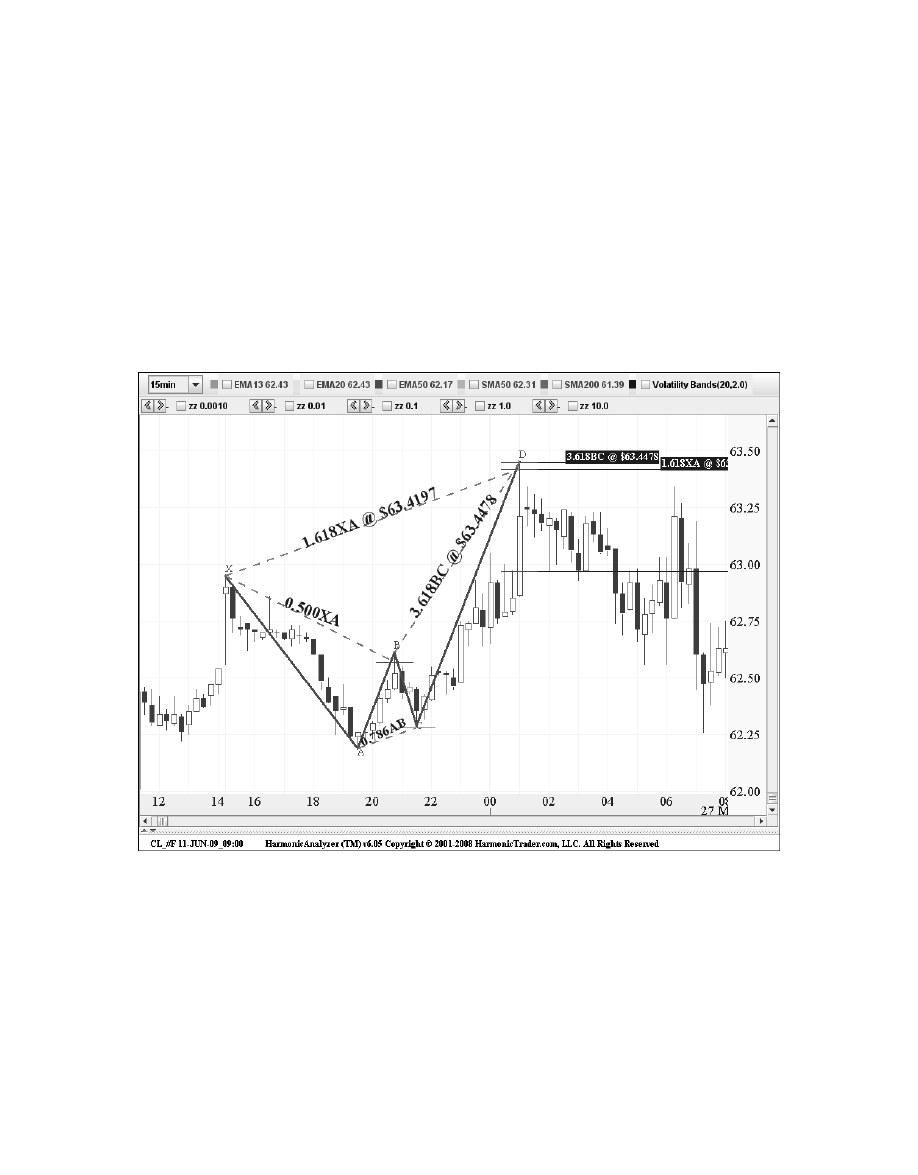
Light Sweet Crude Continuous Contract
(CL_#F): 15-Minute
This intra-day chart of the continuous contract of Light Sweet Crude (CL_#F) exhibits the
typical extreme price action that can occur as the pattern nears completion (see Figure 7.10).
The sharp rally into the PRZ reflects the extreme inherent nature that both the 1.618 XA leg
and the smaller yet more extended BC leg possess. Furthermore, these projections typically
serve as the most important support levels at the completion of the pattern. In this example of
Crude Oil, the price action quickly tested the completion of the pattern and reversed quickly
from this PRZ.
Chapter 7
The Crab Pattern
133
Figure 7.10
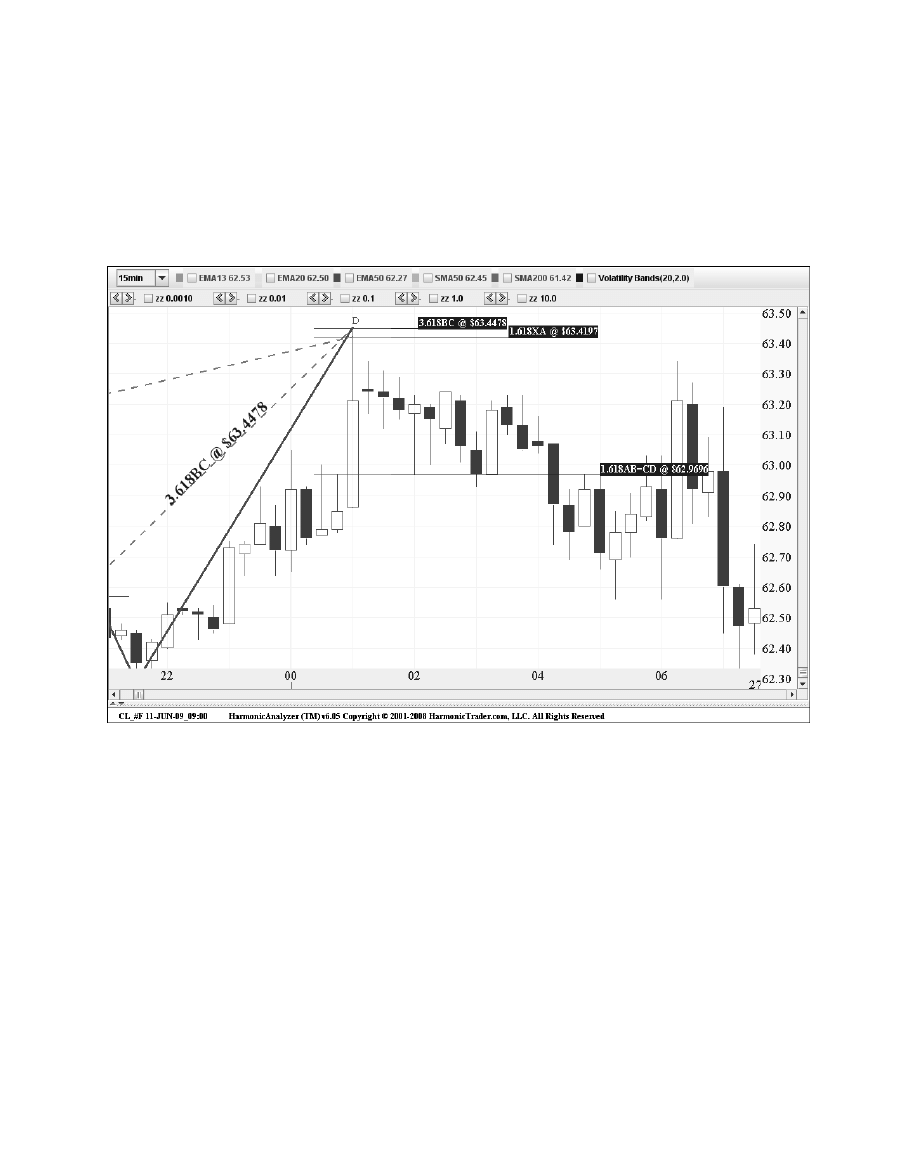
The following chart shows the price action at the completion of the pattern. The rally stalled
right at the numbers and reversed exactly at the top end of the intraday harmonic resistance.
The distinct change in the nature of the preceding uptrend was the overwhelming sign that
the reversal was valid. The execution of the short should have focused on the price action
immediately following the completion of the Crab pattern, as the price action provided
immediate signs of a valid reversal.
134
Harmonic Trading: Volume One
Figure 7.11
It is important to remember that the Crab PRZ is primarily defined by only the XA and BC
projections. In most instances, the Alternate AB=CD pattern does not complete in the vicinity of
these other two calculations. Although the AB=CD pattern completion sometimes complements
the other numbers more closely, the setup is primarily defined by the 1.618 XA projection.
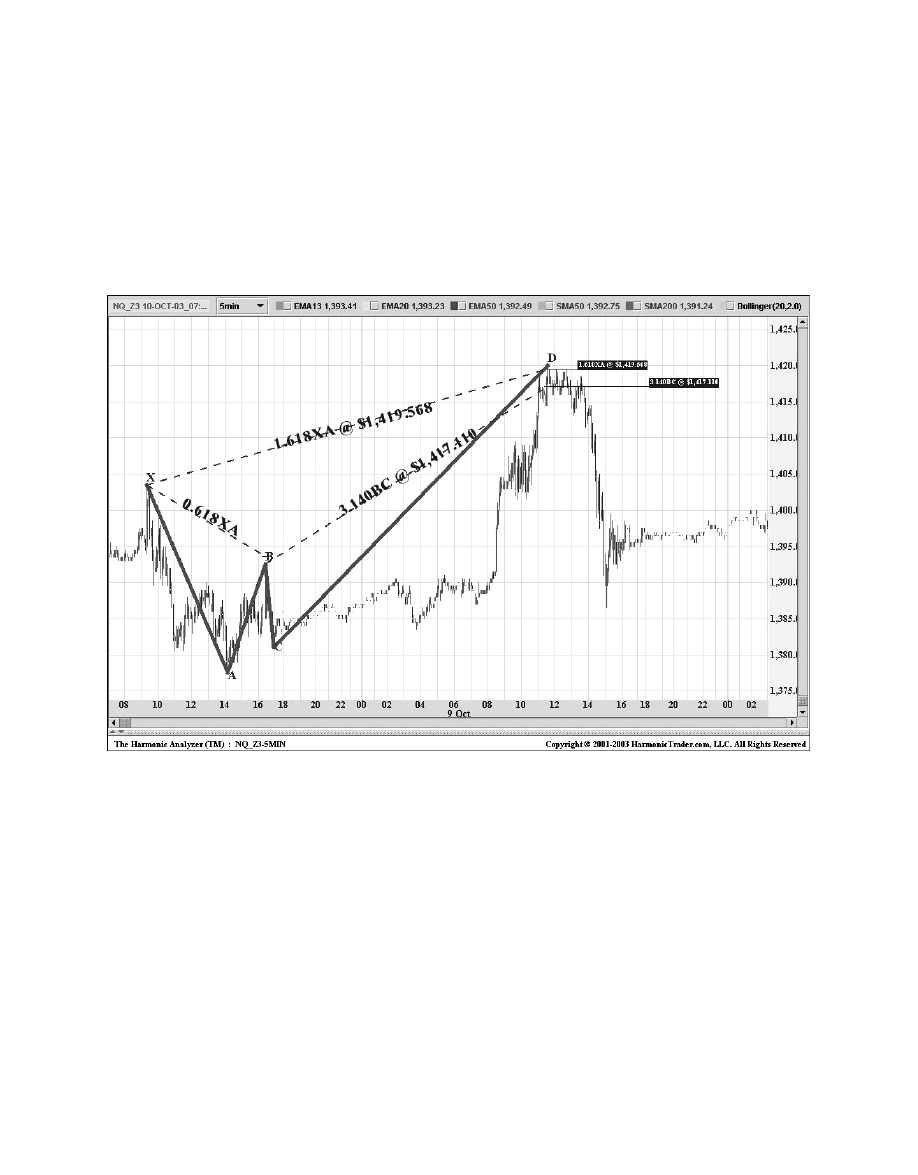
Chapter 7
The Crab Pattern
135
NASDAQ 100 December 2003 Mini-Contract
(NQ_Z3): 5-Minute
Incredible structure! The example of the December 2003 NASDAQ 100 Mini-contract
exemplified all the ideal elements of a Bearish Crab (see Figure 7.12). The tight convergence
of the 1.618 XA leg and the BC projection yielded an exact reversal and outlined a perfect
situation and a distinct trading opportunity to get short at the 1420 level.
Figure 7.12
I mentioned this previously, but I believe it is important to emphasize the advantage of
utilizing all trading data available, especially in futures markets to analyze potential harmonic
patterns. The NQ formed this pattern over the course of two days of trading, including an
overnight and pre-market session. This 5-minute chart is an excellent intra-day example that
formed the pattern utilizing all trading action over the course of a continuous 30-hour period.

The Deep Crab Pattern
The Deep Crab pattern evolved from two patterns—invalid Bat patterns and a specific type of
Crab pattern—that I developed as a further refinement of the basic structure. The Deep Crab is
similar to the original Crab pattern, as it is a 5-point extension structure that utilizes exclusively
a 1.618 XA projection for the defining level in the Potential Reversal Zone (PRZ). The difference
can be found at the B point which must be an 0.886 retracement. In fact, the Deep Crab pattern
usually possesses a B point that is beyond the 0.886 level but it does not violate the initial point
(X). The 0.886 B point requirement is special to the Deep Crab. When the structure is in the
midst of completing the CD leg, the violation of the B point AND the X point typically creates
a situation of severe price action. In essence, the price action is violating two important prior
support or resistance points. When this happens, the result is frequently a sharp move that
quickly extends to the 1.618 XA projection.
Another difference in the Deep Crab pattern is the AB=CD structure. The AB=CD pattern is
a more important consideration in the Deep Crab, although the structure typically possesses
the 1.27AB=CD alternate variation. However, it is common for these structures to possess
equivalent AB=CD patterns in certain circumstances. In a normal Crab, the “shallow” B point
retracement of a 0.618 or less creates an elongated CD leg, which typically sets up an
Alternate 1.618 AB=CD pattern. However, the Deep Crab’s alignment of Fibonacci ratios,
especially the 0.886 B point, creates a structure with an alignment that often possesses
significant AB=CD patterns.
The treatment of the BC projection is slightly different in the Deep Crab, as well. The BC
projection is usually less extreme than the regular structure. Specifically, the BC projection
possesses a minimum 2.24 measurement, but the variations can include extensions as large as
a 3.618. It depends upon the AB=CD completion that best fits the 1.618 XA projection.
Similar to the regular Crab pattern, the 1.618 XA leg is the defining Fibonacci measurement
in the pattern. The 1.618 projection underscores the extreme nature of the pattern, and it is
typical for price action to be volatile and reverse sharply from these PRZ.
Although these structures possess similar elements, their differentiated alignments, especially
their respective B point ratios, serve to differentiate these as unique harmonic patterns. In fact,
the Deep Crab is a different pattern than both the regular version of the Crab and the Butterfly.
Such precise pattern specification is one of the fundamental principles that separate Harmonic
Trading from all other pattern recognition methodologies. Although these three structures appear
similar, their respective Fibonacci alignments clearly differentiate them as distinct patterns.
136
Harmonic Trading: Volume One
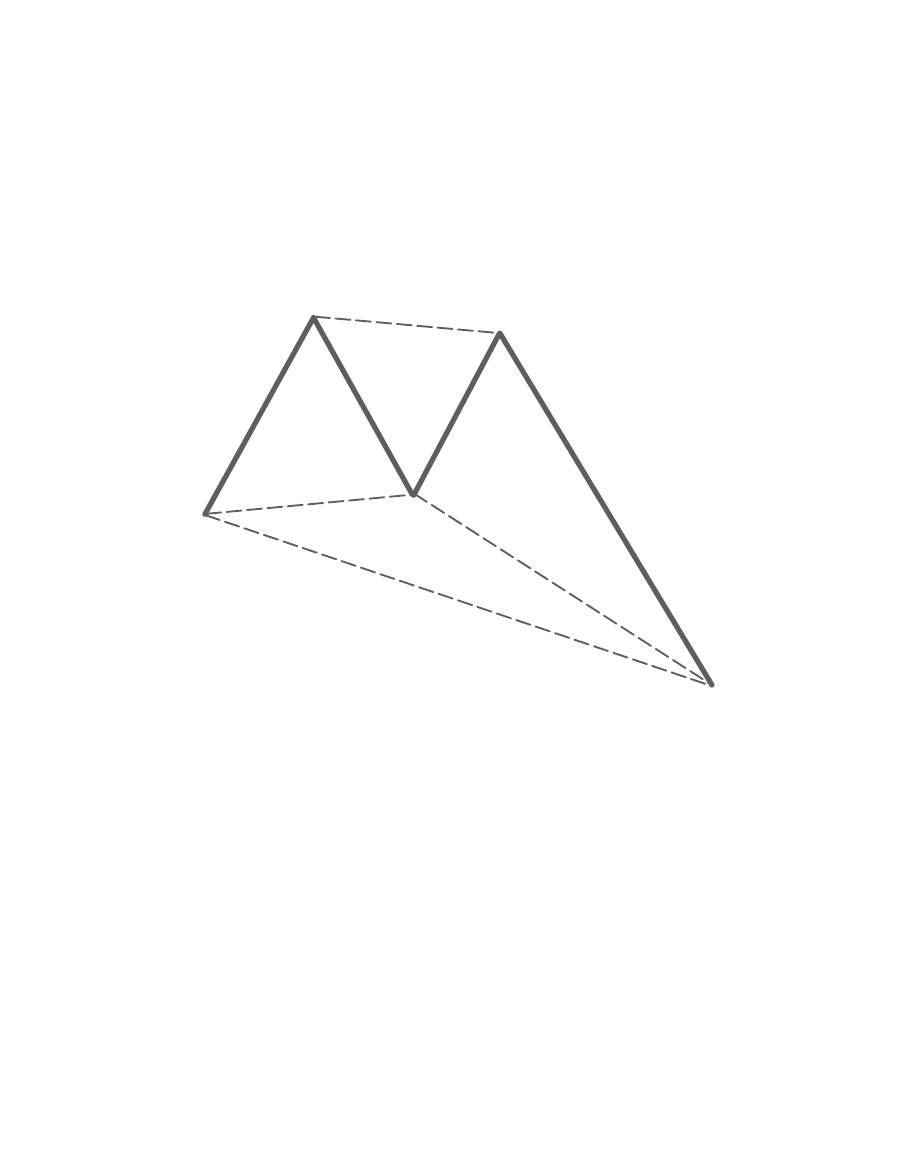
The Deep Bullish Crab Pattern
The Deep Bullish Crab is a distinct structure that is defined by the 0.886 B point retracement of
the XA leg (see Figure 7.13). The 1.618 XA leg should be the lowest point in the PRZ and the
defining limit in the completion of the pattern. The pattern usually possesses some type of
Alternate Bullish AB=CD that requires either a 1.27 or 1.618 calculation.
Chapter 7
The Crab Pattern
137
X
B
1.618
C
0.382;
0.886
2.24; 3.618
0.886
A
D
Figure 7.13
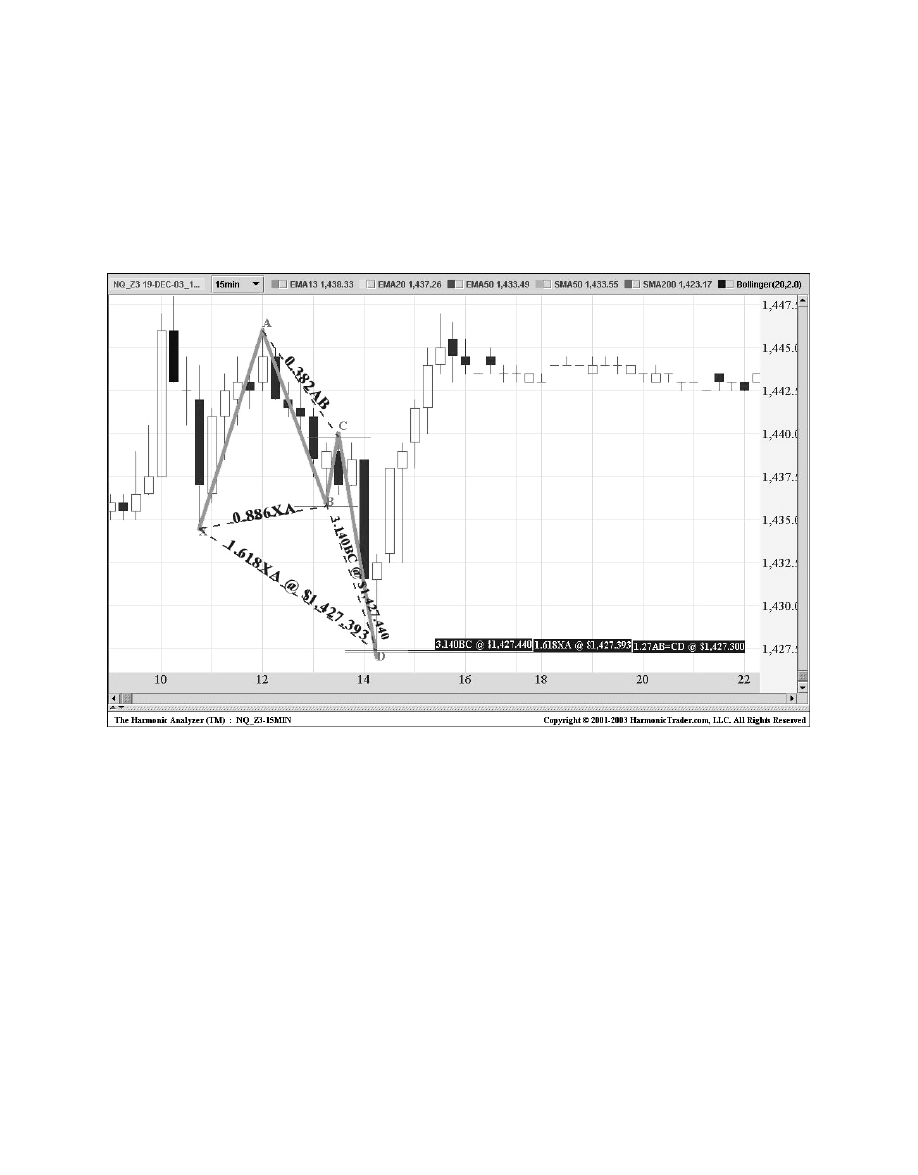
NASDAQ 100 December 2003 Mini-Contract
(NQ_Z3): 15-Minute
This Deep Bullish Crab formed on the 15-minute chart of the NQ (see Figure 7.14). This
pattern exemplifies a distinct Deep Crab structure, and it possessed three numbers, the 1.618
XA projection, a 1.27AB=CD, and a 3.14 BC projection, that converged just above 1427.
138
Harmonic Trading: Volume One
Figure 7.14
Such an exact alignment of numbers in the PRZ frequently offers a sizeable initial reaction
at a minimum. In this case, the NQ rallied exactly from the pattern’s completion.
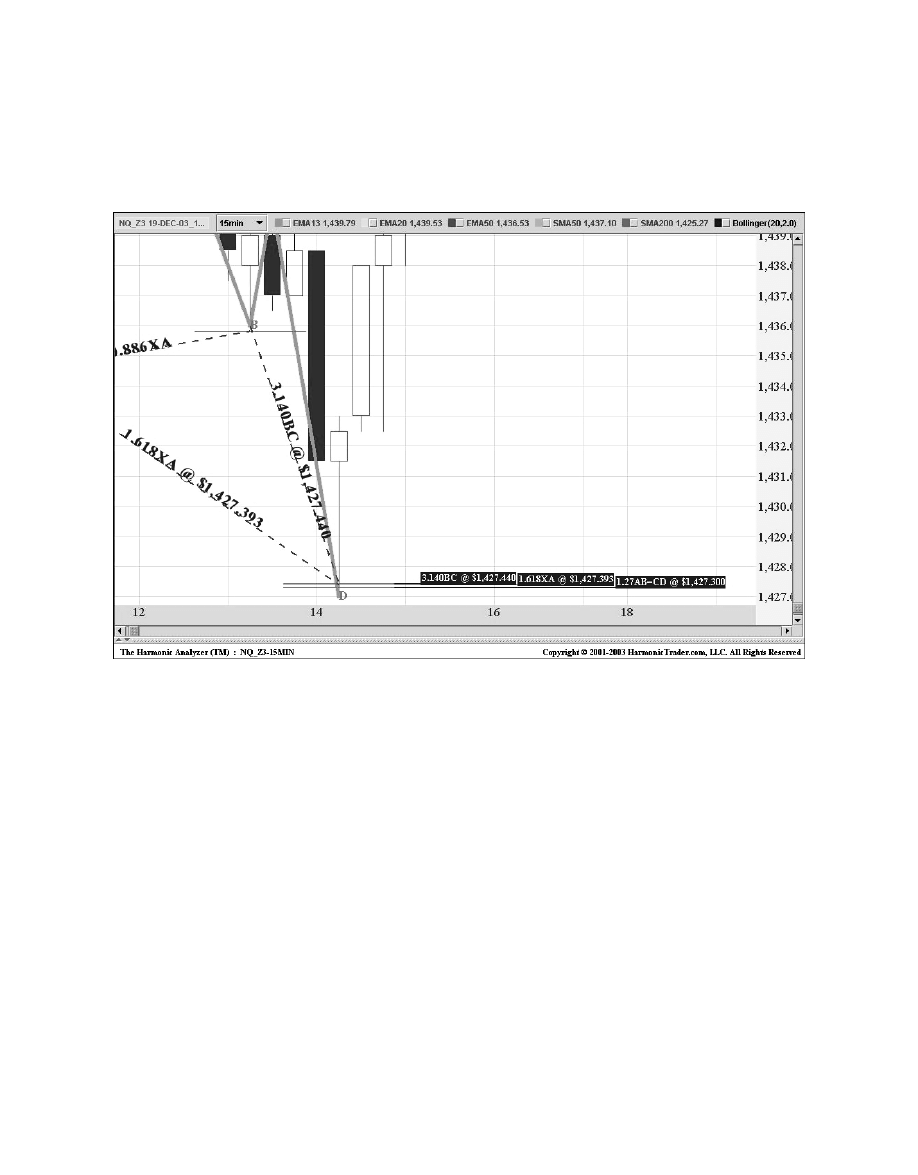
The chart in Figure 7.15 of the price action in the PRZ shows an ideal reversal exactly at
the harmonic numbers. This setup is a great case of a sharp reversal that can occur in Crab
patterns. Again, it is common for Crab patterns—Deep or regular—to experience reversals
that possess extreme price action in the PRZ.
Chapter 7
The Crab Pattern
139
Figure 7.15
It is important to note that such a convergence of Fibonacci calculations grouped this closely
together must be regarded as an extremely harmonic area. This is an extraordinary example
where three numbers completed within 1 tick (1/2 point), providing an excellent intra-day setup.

The Deep Bearish Crab Pattern
The Deep Bearish Crab pattern utilizes a 1.618 XA projection exclusively for the defining level
in the PRZ (see Figure 7.16). The 0.886 retracement at the B point validates the structure as
“deep” in nature. Essentially, this pattern possesses multiple extensions that combined with an
Alternate AB=CD structure, identify considerable potential turning points. The pattern frequently
develops after a trend has been established in patterns with an extreme BC projection.
140
Harmonic Trading: Volume One
A
C
B
1.618
0.886
0.382;
0.886
2.24; 3.618
D
Figure 7.16
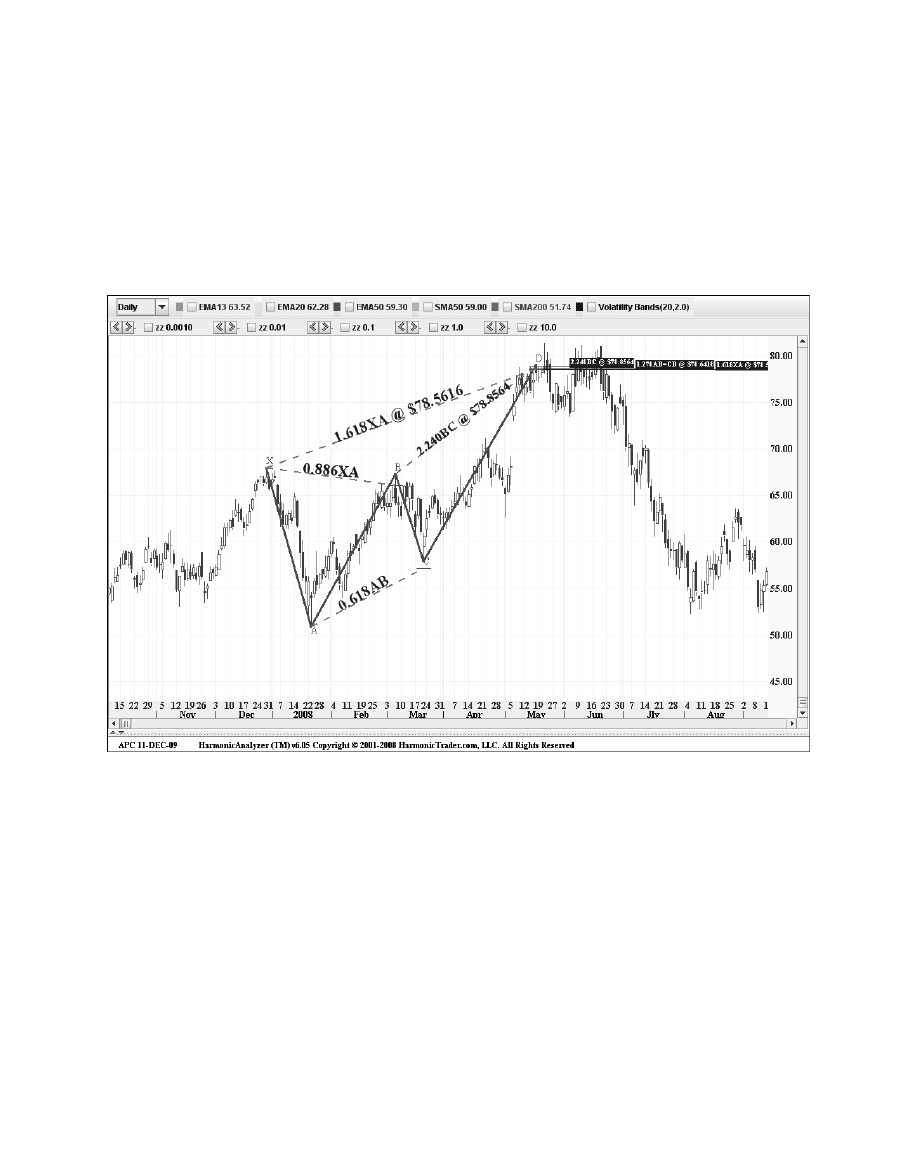
Anadarko Petroleum
(APC): Daily
Anadarko Petroleum formed this distinct Deep Bearish Crab that possessed three numbers
defining a tight 30-cent PRZ (see Figure 7.17). This is remarkable due to the fact that the
pattern comprises nearly a 30 points range. The 1.618 XA projection, the Alternate 1.27
AB=CD pattern, and the 2.24 BC projection converged in the same area at $78.80.
Chapter 7
The Crab Pattern
141
Figure 7.17
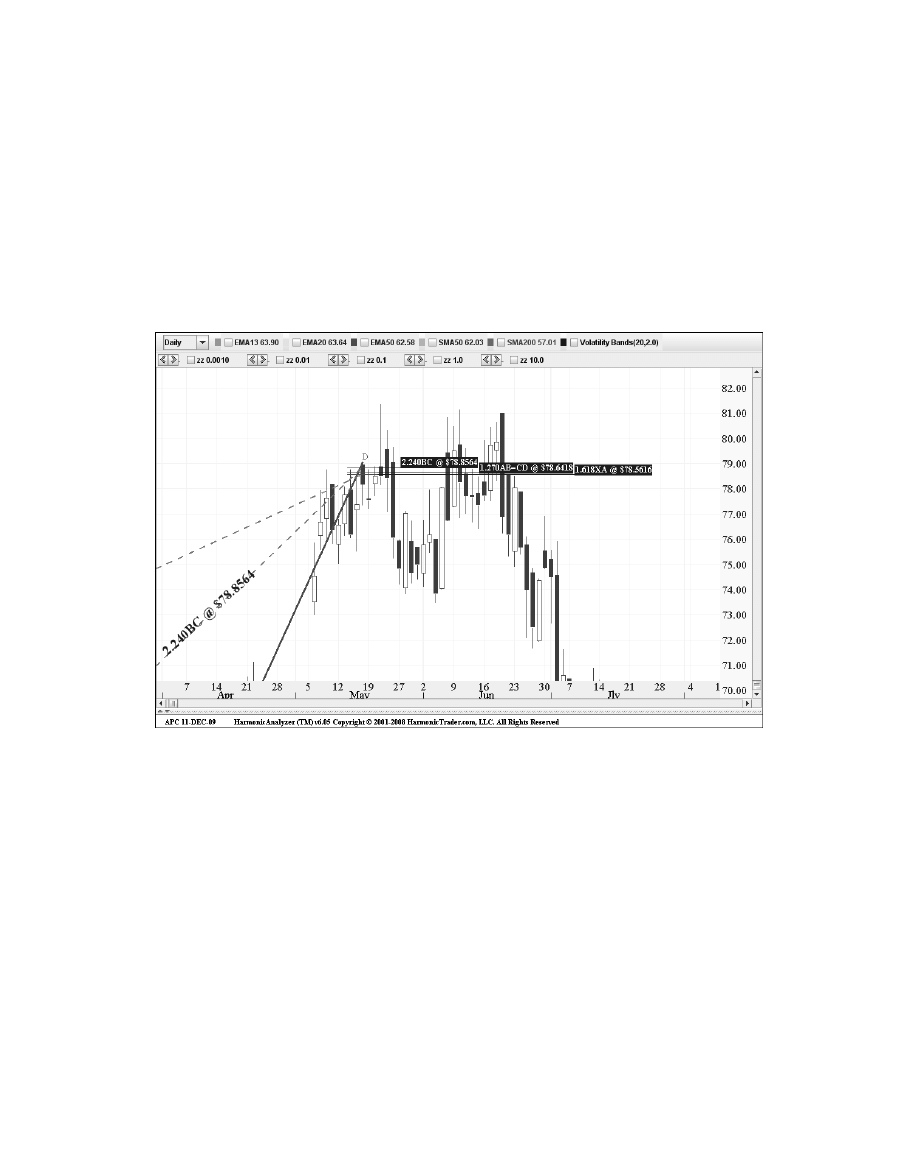
The price action stalled immediately after testing the entire PRZ and the stock reversed
considerably soon after. Although the price action rallied sharply as it approached the
completion of the pattern, the obvious stalling that occurred followed by the decisive downside
continuation were the definitive technical signs of a valid reversal. The price action reversed
quickly after slightly exceeding the top range of the PRZ and briefly tested the psychological
$80 level. The chart in Figure 7.18 of the Potential Reversal Zone clearly shows the price action
failing to continue to rally above the harmonic resistance. Furthermore, the psychological $80
level added to the resistance of the pattern, as the stock dropped sharply within several days of
testing the entire PRZ.
142
Harmonic Trading: Volume One
Figure 7.18

The Perfect Crab Pattern
The Crab pattern is defined by a 0.618 B point retracement, a 1.618 XA projection, and a 3.14
BC projection. Utilizing two extremely harmonic measures, 1.618 (Phi) and 3.14 (Pi), the perfect
Crab represents a unique structure and an incredibly precise pattern.
1. Precise 0.618 B point retracement of the XA leg.
2. 3.14 BC projection.
3. 1.618 AB=CD.
4. C point within a 50–61.8% range.
The Perfect Bullish Crab Pattern
The perfect Bullish Crab pattern in Figure 7.19 is a distinct structure that possesses a precise
alignment of 0.618 B point retracement, a 1.618 XA projection, an Alternate 1.618 AB=CD, and
a 3.14 BC projection.
Chapter 7
The Crab Pattern
143
X
B
1.618
C
0.50;
0.618
3.14
0.618
A
D
Figure 7.19
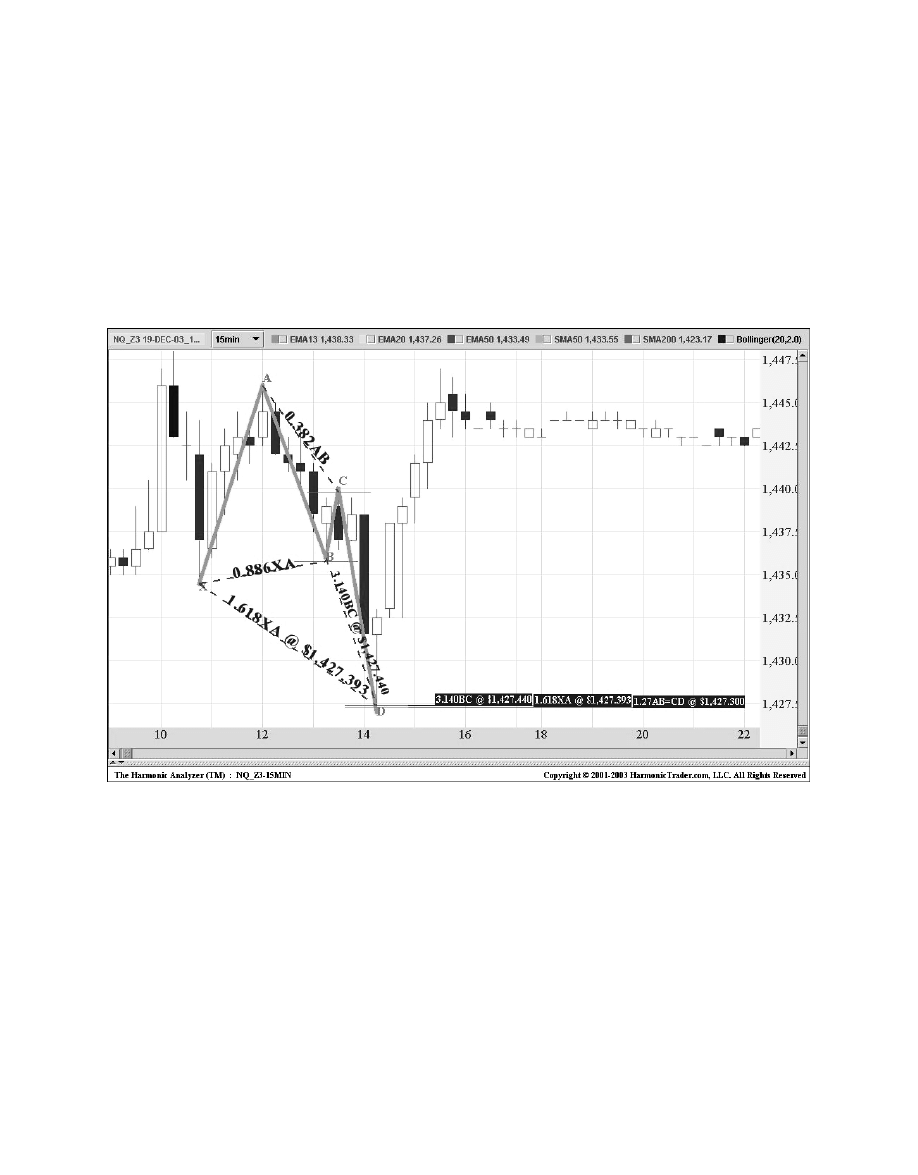
Home Depot
(HD): 15-Minute
This Perfect Crab in Home Depot (HD) exemplifies the proper alignment of Fibonacci ratios
required to validate the structure (see Figure 7.20). The pattern is defined by a precise 0.618 B
point retracement of the XA leg. The 1.618 XA projection is the lowest point in the PRZ, and the
Alternate 1.618 AB=CD with the 3.14 BC projection contributed to the harmonic support in the
32.50–32.75 range.
144
Harmonic Trading: Volume One
Figure 7.20
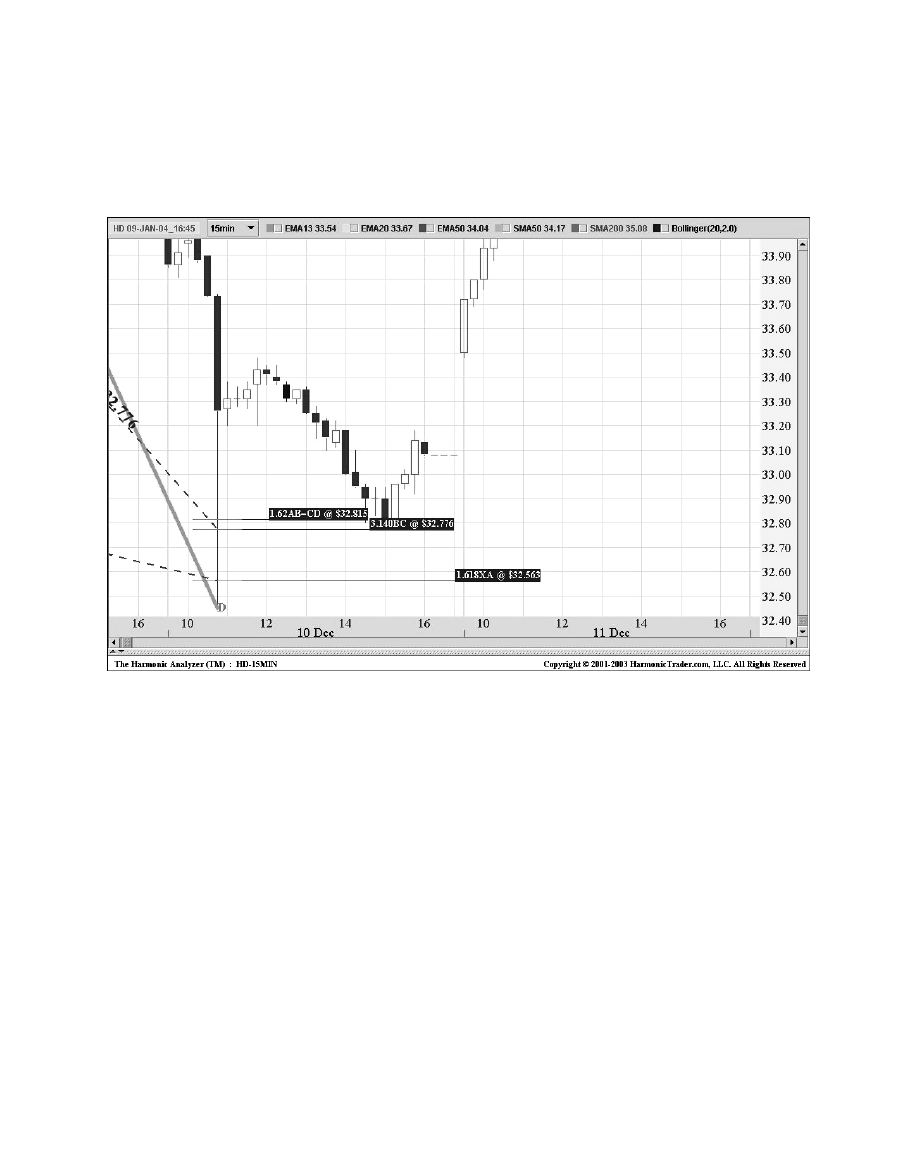
The chart in Figure 7.21 of the price action in the PRZ shows an ideal reversal after the
1.618 XA projection was tested. This is another example of a sharp price action as the stock
traded into the PRZ. Home Depot reversed almost exactly after hitting the 1.618 XA projection
at 32.55.
Chapter 7
The Crab Pattern
145
Figure 7.21
Perfect Crab patterns such as these frequently experience sharp and dramatic price action
at their completion points. The stock reversed immediately after testing the most important
number in the setup—the 1.618 XA. Despite the sharp intra-day decline, the pattern clearly
defined the short-term support.

The Perfect Bearish Crab Pattern
The perfect Bearish Crab is a distinct 5-point extension structure that combines the particularly
harmonic ratios of the 1.618 at the XA leg and the 3.14 at the BC leg (see Figure 7.22). This
unique alignment frequently defines remarkable trading opportunities and incredibly precise
resistance zones.
146
Harmonic Trading: Volume One
A
C
B
1.618
0.618
0.50;
0.618
3.14
D
Figure 7.22
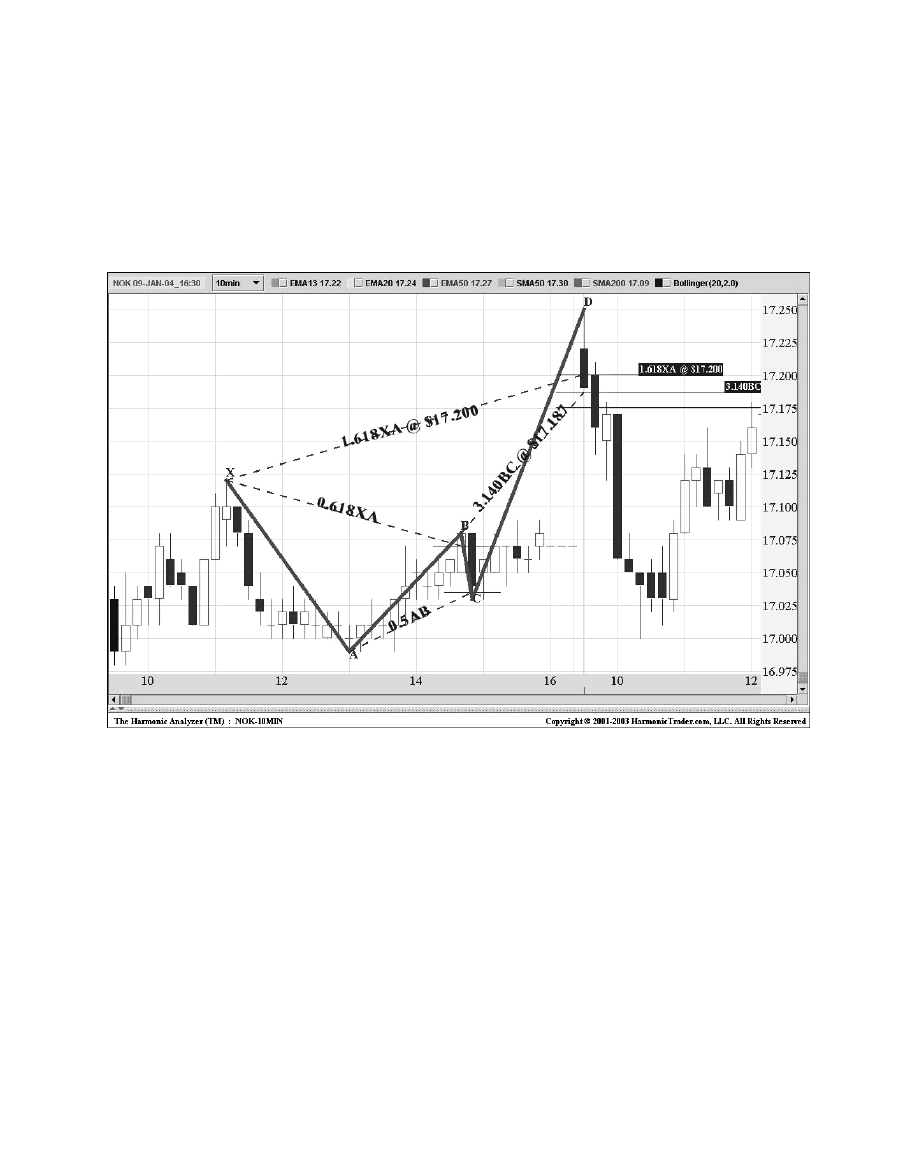
Nokia (NOK): 5-Minute
Nokia formed this Perfect Bullish Crab on the following 5-minute chart (see Figure 7.23). This
pattern exemplifies the proper alignment of Fibonacci ratios required to validate the setup. The
precise 0.618 B point retracement of the XA leg is the defining element that establishes the
structure.
Chapter 7
The Crab Pattern
147
Figure 7.23
The 1.618 XA projection defined the top range of the PRZ and the Alternate 1.618 AB=CD
with the 3.14 BC projection complemented the harmonic resistance in the 17.20 area.
This is another example of a typical extreme price move into the PRZ for a Crab pattern.
Although the stock rallied sharply, as it gapped up on the open, into the harmonic resistance,
the stock stalled immediately and rolled over, completing an ideal reversal.

The Crab Pattern Summary
Although the structural variations of the Crab may seem to define the same pattern, the
alignment of Fibonacci ratios clearly differentiates each type as a unique situation. The Crab
typically defines extreme overbought and oversold situations, as the 1.618 XA leg is the most
important Fibonacci measurement of the pattern and it represents the most critical number in
the Potential Reversal Zone (PRZ).
Unlike the other patterns within the Harmonic Trading approach, the AB=CD is not as critical
at the completion point. Although it is important to differentiate the AB=CD possibilities for each
variation, the Alternate 1.618 AB=CD pattern is the preferred structure in most Crab patterns.
However, the 1.27 AB=CD pattern is typically found in the original version, while it is not
unusual for the Deep Crab to possess an equivalent AB=CD.
The extreme BC projection—usually a 2.618, 3.14, or 3.618 extension—underscores the
nature of this structure. Although the Deep Crab permits a wider range of BC possibilities, this
projection should converge closely with the 1.618 XA.
1. Precise 0.618 B point retracement or less of the XA leg. (.382 and 0.50 are
common B points in the structure.)
2. Extreme 2.618, 3.14 or 3.618BC projection. (Sometimes 2.24 BC projections form
in the structure.)
3. Minimum AB=CD completion. Alternate 1.27 AB=CD or 1.618 AB=CD patterns are
most common.
4. C point retracement can vary between a 0.382 to an 0.886.
5. This is an extreme pattern!
The volatile nature of this pattern must be emphasized. Reversals from these PRZs can be
sharp and possess extreme price action. The Crab is a distinctive pattern and possesses
unique qualities that identify remarkable harmonic opportunities. The differentiation of this
pattern is critical to define each variation.
From a harmonic perspective, valid Crab structures identify extreme oversold or overbought
conditions. These patterns usually offer some type of reaction on the initial test of the
Potential Reversal Zone. The price action frequently responds to extreme Fibonacci projection
combinations within the Crab pattern of the 1.618 XA leg and the 2.618 or greater BC leg.
The Crab is an incredibly accurate and consistently effective pattern within the Harmonic
Trading arsenal to identify critical turning points in the markets.
148
Harmonic Trading: Volume One

Bryce Gilmore discovered the structure of the Butterfly pattern in his
Wave Trader software
program. Although his interpretation of the structure encompasses a multitude of Fibonacci
combinations, I believe the specification of each point within the structure is essential to be
able to successfully trade the pattern. As the example of the Crab pattern demonstrated, the
alignment of pattern points is critical. The Butterfly pattern is no different, as specific alignments
within this 5-point extension structure are the key to finding the best opportunities.
In my experience, I believe an
ideal Butterfly pattern requires a specific alignment of
Fibonacci measurements at each point within the structure. Most important, a mandatory 0.786
retracement of the XA leg as the B point is the defining element of an ideal Butterfly pattern,
and it acts as the primary measuring point to define a specific Potential Reversal Zone (PRZ).
In many ways, the ideal Butterfly pattern is like the Gartley pattern because it requires a specific
B point retracement and possesses a tighter array of Fibonacci ratios within the structure.
Specifically, the Butterfly incorporates a 1.27 XA projection with a “tame” BC projection, which is
usually only a 1.618. In addition, the Butterfly usually possesses an equivalent AB=CD pattern or
an Alternate 1.27 AB=CD pattern. Although the equivalent AB=CD is a minimum requirement, valid
Butterfly structures rarely exceed the Alternate 1.27 AB=CD completion point.
The Crab Pattern Versus the Butterfly Pattern
The difference between a Crab and a Butterfly is vast. Although these price structures appear
similar since they represent two types of extension patterns, their measurements clearly
differentiate their characteristics. The Crab utilizes a 1.618 XA projection, while the
ideal
Butterfly pattern utilizes a 1.27 XA projection exclusively. Essentially, the Crab is a reactionary
pattern that attempts to define extreme oversold and overbought situations. An ideal Butterfly
pattern is differentiated by a 0.786 retracement at the B point. Utilizing this alignment for an
ideal Butterfly pattern can eliminate many invalid imposters—those price structures “posing” as
potential valid patterns that are common failures.
The AB=CD pattern is another critical element for an ideal Butterfly pattern to be a valid
signal. It is important to note that the AB=CD pattern frequently will possess an alternate
149

structure that is typically 1.27 of the AB leg. Although this is an important requirement for a
valid trade signal, the most critical number in the ideal Butterfly pattern is the 1.27 XA leg. The
XA calculation is usually complemented by a 1.618, 2.00, or 2.24 BC projection. Although the
2.618 is sometimes utilized to complement a PRZ, the smaller BC projections work the best
with the 1.27 XA primary price leg. In essence, the BC projection should complete in a
“compact” area with the 1.27 XA leg. These numbers create a specific PRZ that can yield
powerful reversals, especially when the pattern is in all-time (new highs/new lows) price levels.
The ideal Butterfly works well in new high/low territory because valid patterns frequently
represent critical 5-point reversal structures that frequently trigger the end of the predominant
trend. The following illustrations and examples demonstrate these concepts.
Ideal Butterfly pattern elements:
• Precise 78.6% B point retracement of XA leg.
• BC projection must be at least a 1.618.
• Equivalent AB=CD pattern is minimum requirement, but the Alternate 1.27 AB=CD
is the most common.
• 1.27 XA projection most critical number in the Potential Reversal Zone (PRZ).
• No 1.618 XA projection.
• C point within range of 0.382–0.886 retracement.
The Bullish Butterfly Pattern
Beginning with a precise 0.786 B point retracement, the Bullish Butterfly (see Figure 8.1)
encompasses a minimum AB=CD pattern with the 1.27 XA and the 1.618 BC projections as
mandatory requirements to define the Potential Reversal Zone (PRZ).
150
Harmonic Trading: Volume One
X
B
1.27
C
0.382;
0.886
1.618; 2.24
0.786
A
D
Figure 8.1
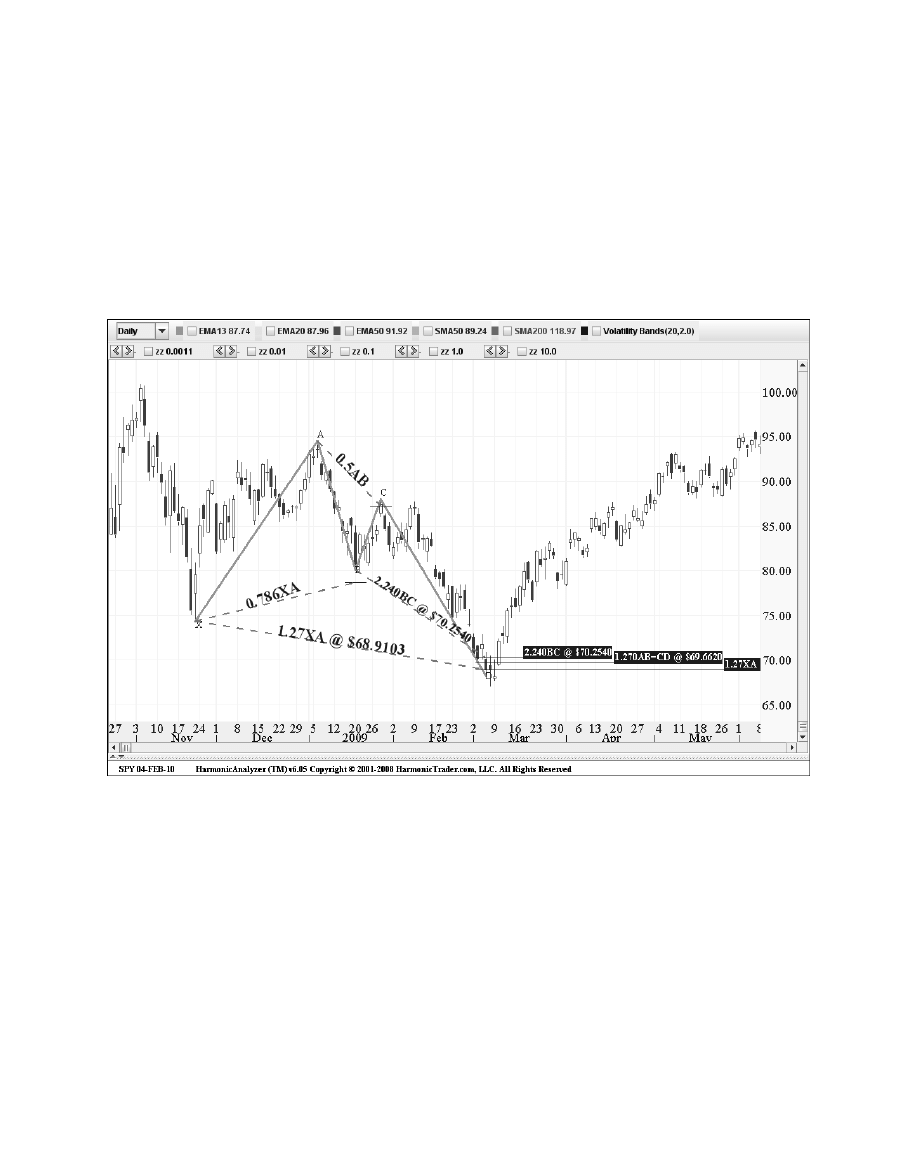
Standard and Poor’s 500 Tracking Stock
(SPY): Daily
In Figure 8.2, the SPY formed this ideal Butterfly pattern that exemplified the proper alignment
of Fibonacci ratios required to validate the structure. The 0.786 B point retracement of the
XA leg is the defining element in this example that establishes the structure. The 1.27 XA
projection defined the lower range of the PRZ, while the Alternate 1.27 AB=CD and the 1.618
BC projection contributed to the harmonic support just under the $70 level.
Chapter 8
The Ideal Butterfly Pattern
151
Figure 8.2
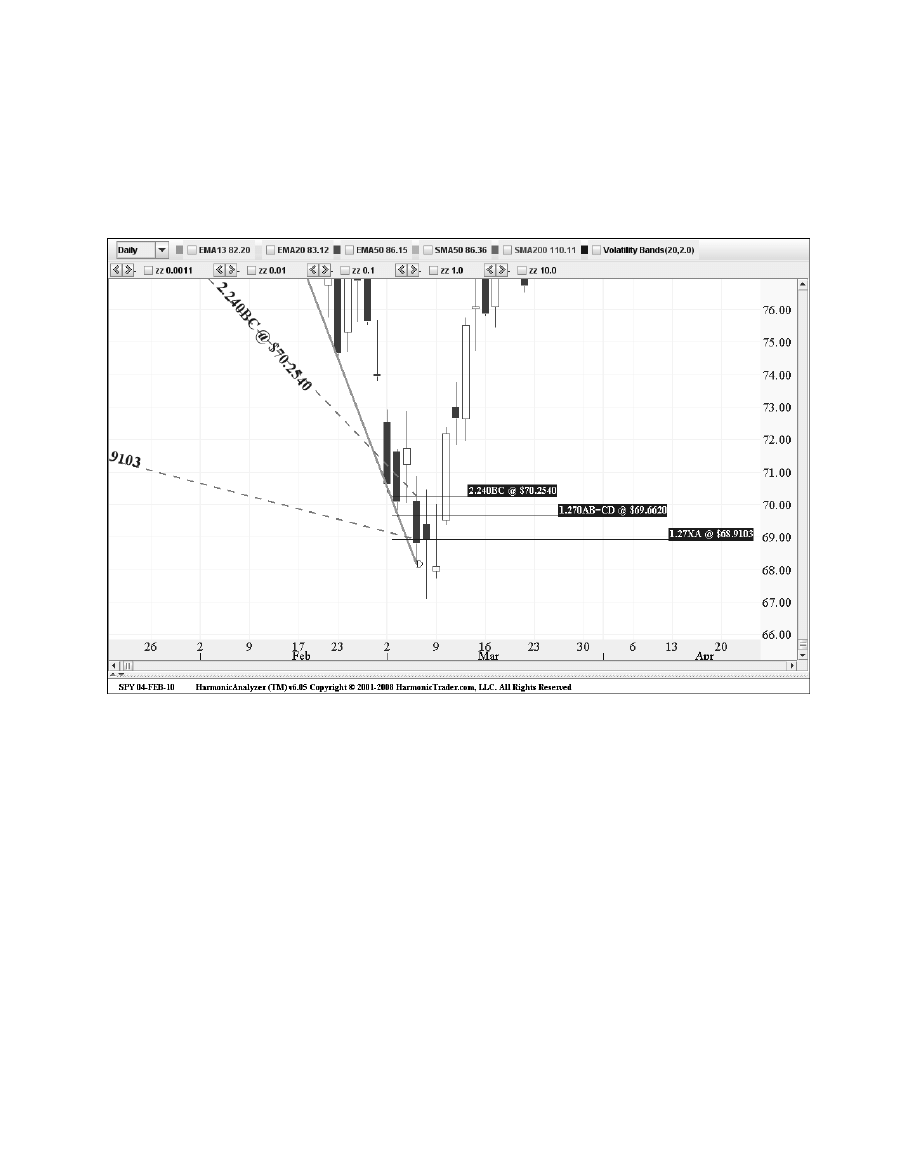
152
Harmonic Trading: Volume One
Figure 8.3
This example possessed a dramatic reversal. On the day the price action tested all of the
numbers in the PRZ, the downtrend started to stabilize. The following two days challenged the
PRZ. After the reversal was complete, the price action rallied convincingly, as it closed above
harmonic support. Although the price action required a few more days to stabilize, the
completion of the pattern clearly marked a critical low for the SPY.
This was a substantial structural signal, as it was the defining pattern that marked the 2009
bear market low. The following chart of the price action in the PRZ shows an ideal reversal after
all the numbers were tested (see Figure 8.3). After a steady decline, the SPY stabilized just
below the projected harmonic support.
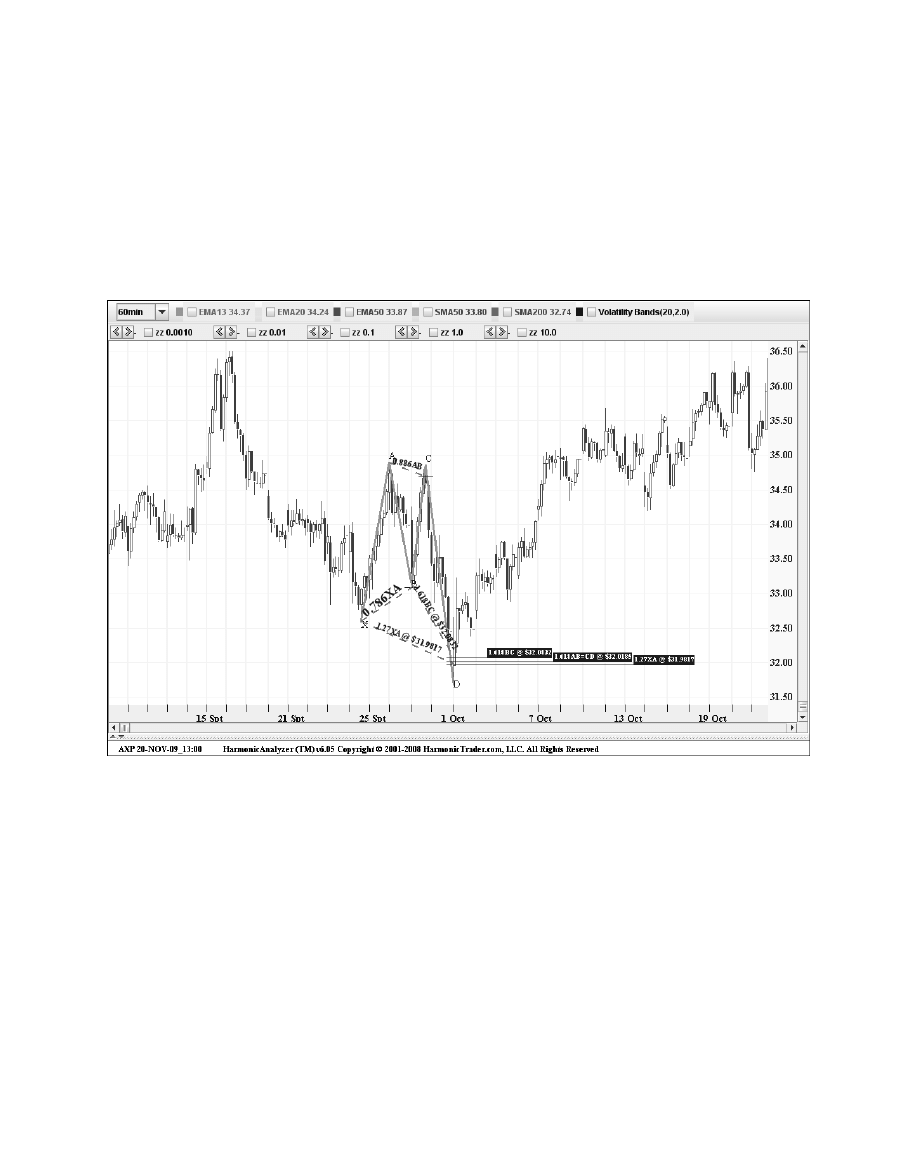
American Express
(AXP): 60-Minute
This Bullish Butterfly on the 60-minute chart of American Express is an excellent example of a
precise 0.786 B point retracement that defined the structure (see Figure 8.4). The 1.618 BC
projection and the Alternate 1.618 AB=CD complemented the harmonic support at the $32
level.
Chapter 8
The Ideal Butterfly Pattern
153
Figure 8.4
The pattern formed on this 60-minute chart over the course of several sessions and signaled
a resumption of the predominant uptrend. After a week of consolidation, the distinct pattern
defined critical support in a narrow ten-cent range in the $32 area. The price action rallied
immediately following the completion of the pattern.
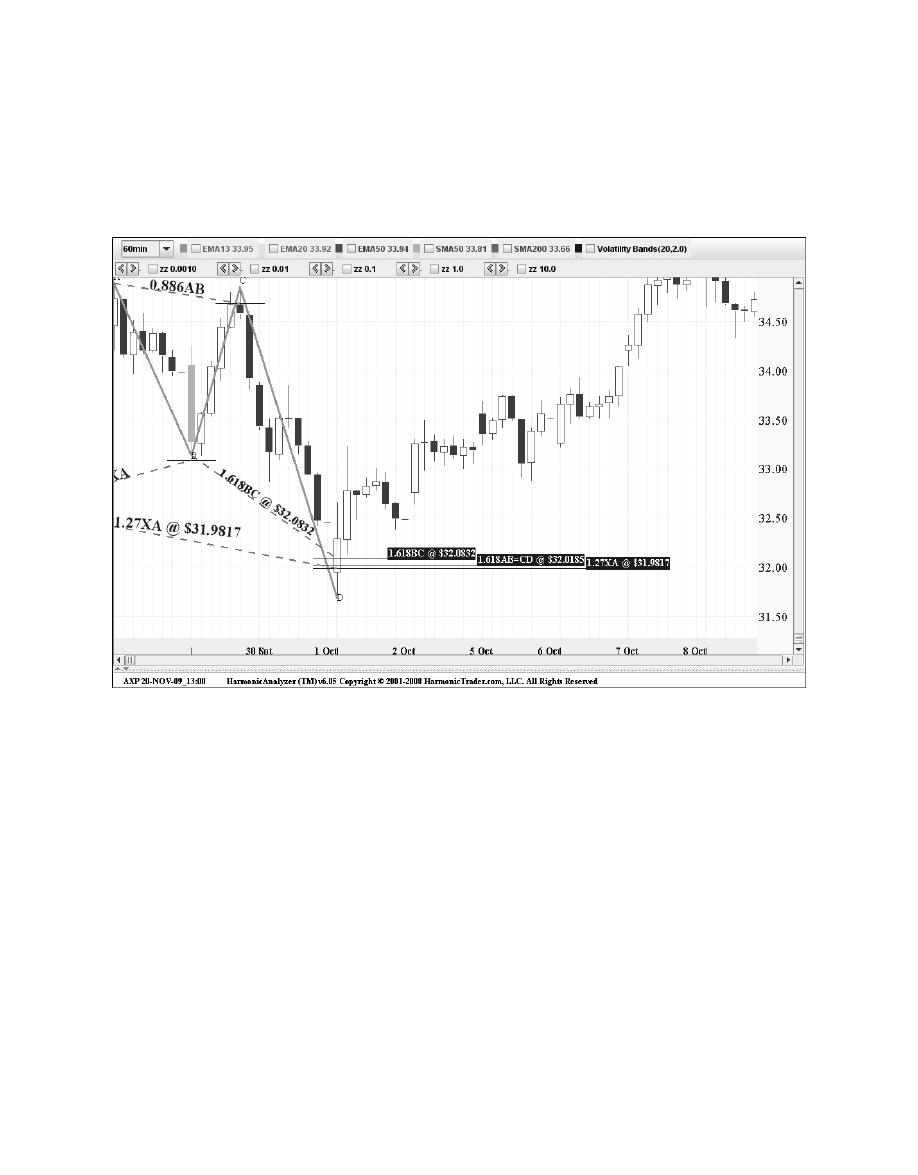
Figure 8.5
It is important to note that the Butterfly is similar to the Gartley because the B point is
so critical in validating the structure as a harmonic pattern. For a Butterfly, the B point must
possess a 78.6% retracement. As this enlarged chart of AXP illustrates, the precise B point
established the proper alignment of ratios, resulting in a defined completion area for the
pattern. Although the ideal conditions do not occur in every situation, these guidelines serve to
define the clearest opportunities and differentiate various structures as precisely as possible.
154
Harmonic Trading: Volume One
Such a close congregation of numbers in the PRZ is another sign of a significant
harmonic setup. Furthermore, the pattern’s structure possessed ideal symmetry and reversed
convincingly after the initial PRZ test (see Figure 8.5). All of these factors were solid indicators
that signaled a potential reversal. Although such setups do not guarantee a successful reversal,
these are the traits that define the best opportunities.
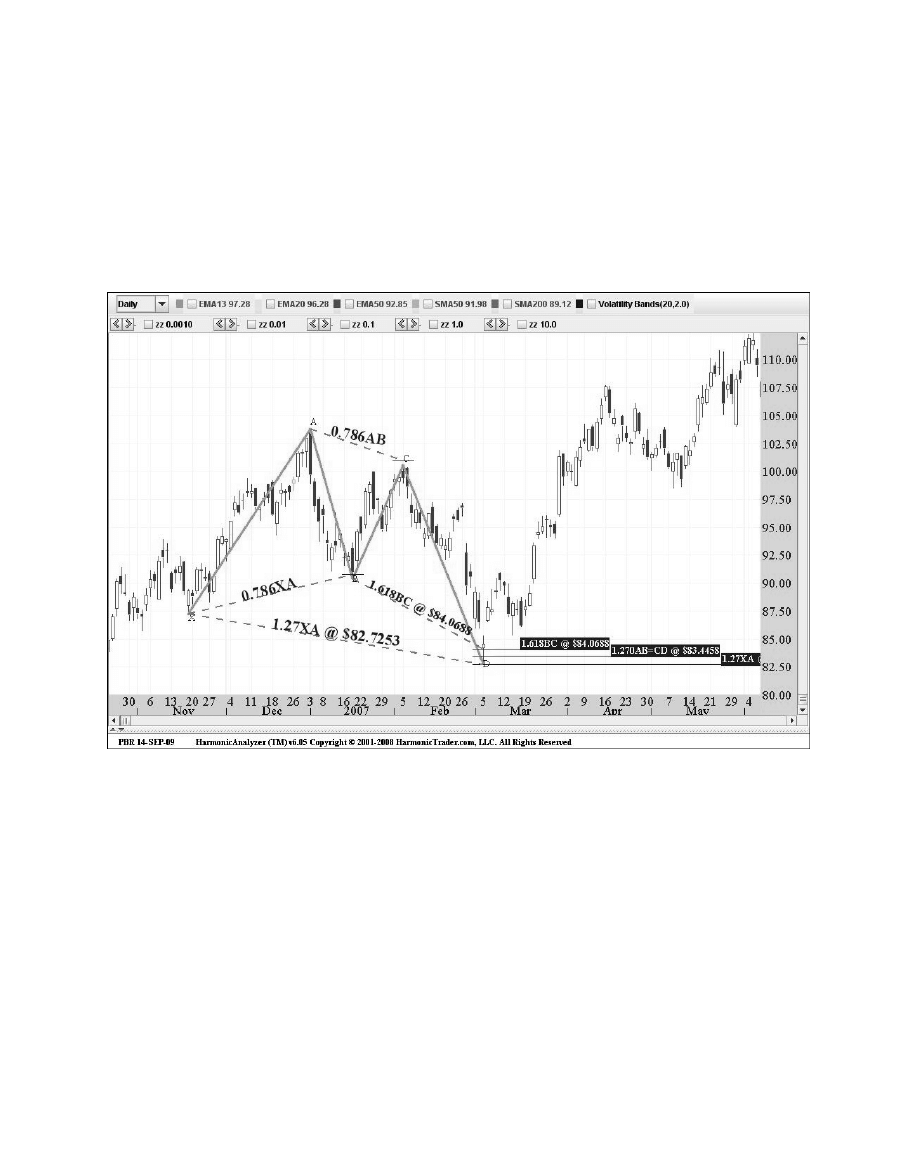
Petrobras
(PBR): Daily 60-Minute
This daily chart of Petrobras exemplifies the ideal structure that valid Bullish Butterfly patterns
should possess (see Figure 8.6). The setup possessed an ideal alignment of Fibonacci ratios to
validate the structure, including an exact 0.786 B point retracement of the XA leg.
Chapter 8
The Ideal Butterfly Pattern
155
Figure 8.6
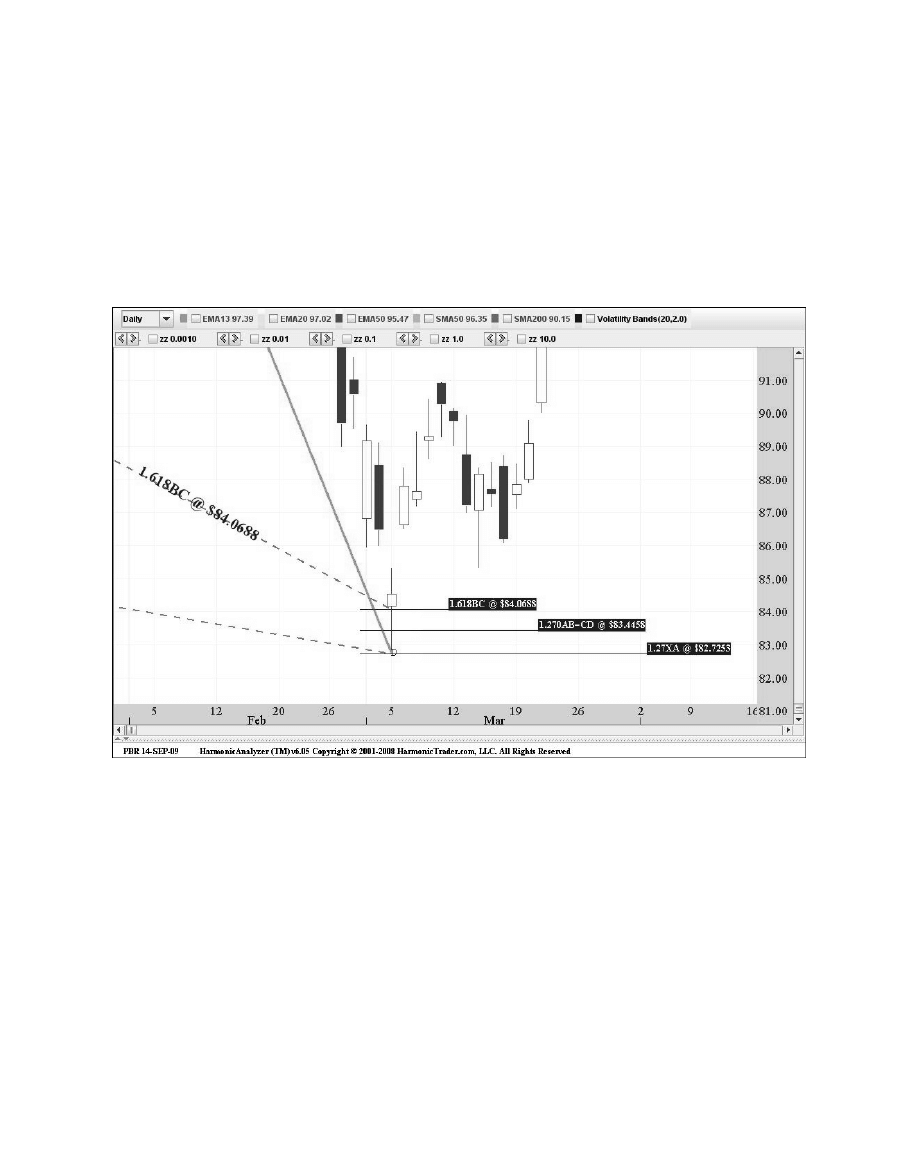
The 1.27 XA leg defined the lower range of the PRZ at 82.75, while the 1.618 BC projection
and the 1.27 AB=CD pattern complemented this area at 84.06 and 83.45, respectively. The
price action was able to stabilize on the day the stock tested all of the numbers in the PRZ. In
fact, the reversal was ideal, as the stock dropped sharply into the PRZ, hit the entire range of
numbers, and closed above the harmonic support. Although this was a dramatic reversal, the
Bullish Butterfly clearly defined the area for a critical turning point in the trend of the stock.
Petrobras stabilized above the PRZ and accelerated to the upside several days later to confirm
the pattern completion (see Figure 8.7).
156
Harmonic Trading: Volume One
Figure 8.7
Although the price action declined sharply as it entered the PRZ, the pattern completion
point put a floor under the stock. The fact that the stock was able to close above the top range
of the harmonic support was another indication of a valid reversal in the works.
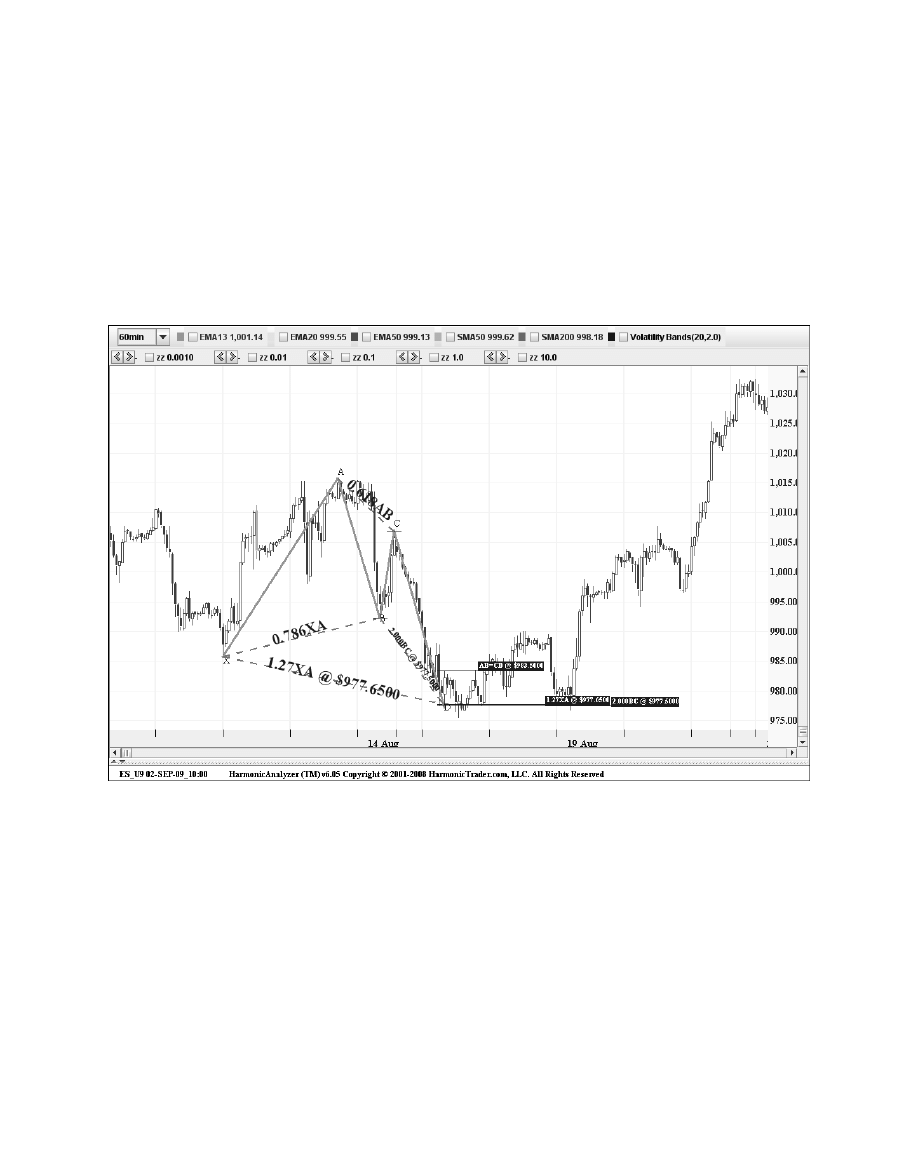
Standard and Poor’s 500 Mini-Contract
(September 2009)
(ES_U9): 60-Minute
The Bullish Butterfly on the 60-minute chart of the Standard and Poor’s 500 September
2009 Mini-Contract (see Figure 8.8) is another excellent example of a precise 0.786 B point
retracement that defined the structure. The 2.0 BC projection and the AB=CD pattern
complemented the harmonic support at the 977 level.
Chapter 8
The Ideal Butterfly Pattern
157
Figure 8.8
This distinct pattern materialized in ideal fashion on this 60-minute chart over the course
of several sessions. Although the price action required two complete tests of the PRZ as it
consolidated following a steep three-day decline, the completion area for the setup defined
critical support just under the 980 level and pinpointed the optimal entry for the long position.

The Bearish Butterfly Pattern
The ideal Bearish Butterfly structure is defined by a precise 0.786 B point retracement of the
XA leg (see Figure 8.9). The setup requires an AB=CD pattern that should converge with the
1.27 XA and the 1.618 BC projections as minimum conditions to define the PRZ.
158
Harmonic Trading: Volume One
X
C
B
1.27
0.786
0.382;
0.886
1.618; 2.24
D
A
Figure 8.9
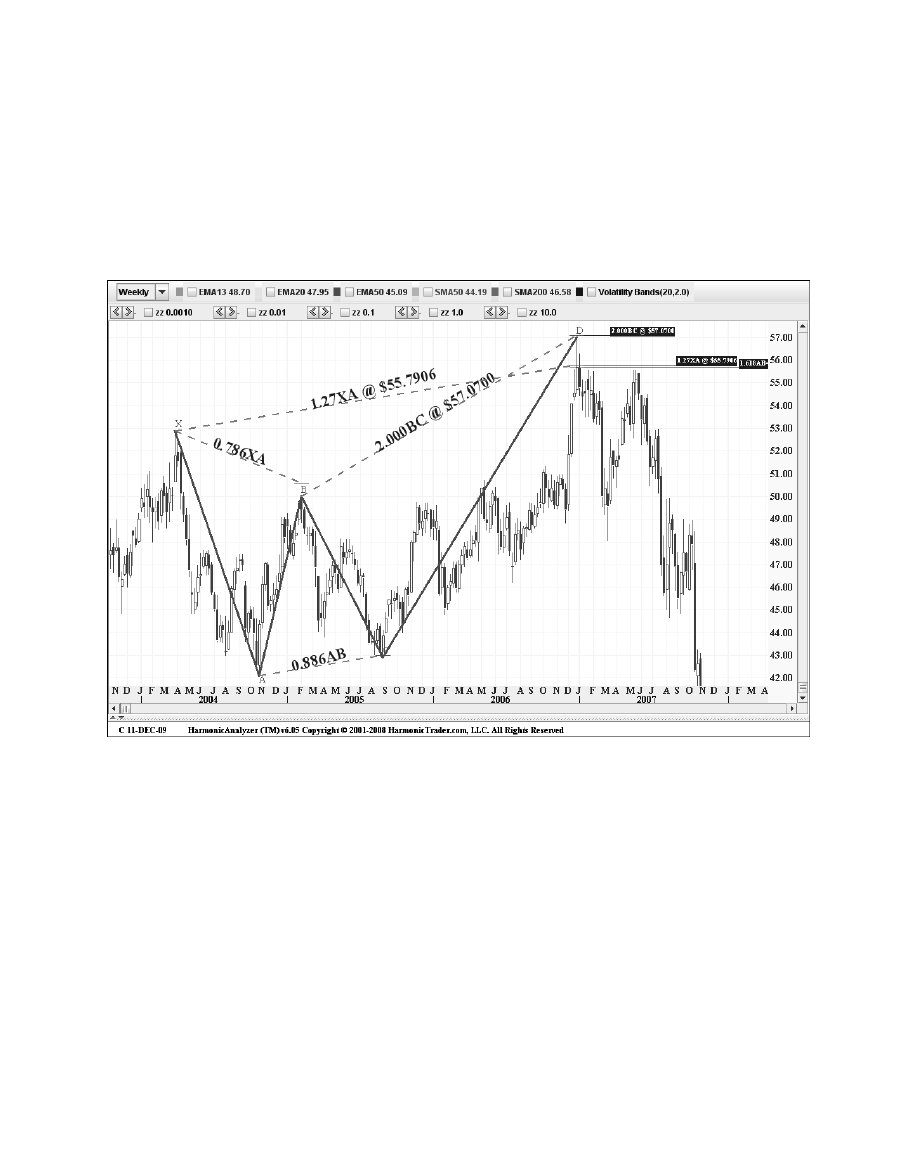
Chapter 8
The Ideal Butterfly Pattern
159
Figure 8.10
The Butterfly possessed the ideal elements for a valid structure, including a precise B point
retracement at the 0.786 of the XA leg. The Alternate 1.27 AB=CD complemented the 1.27 XA
projection that clearly defined harmonic resistance just above the $55 level. In fact, these two
Citigroup
(C): Weekly
The weekly chart of Citigroup (see Figure 8.10) was the fateful long-term pattern that marked
the top in the stock before its remarkable demise. This long-term pattern formed over the
course of four years before reversing dramatically.
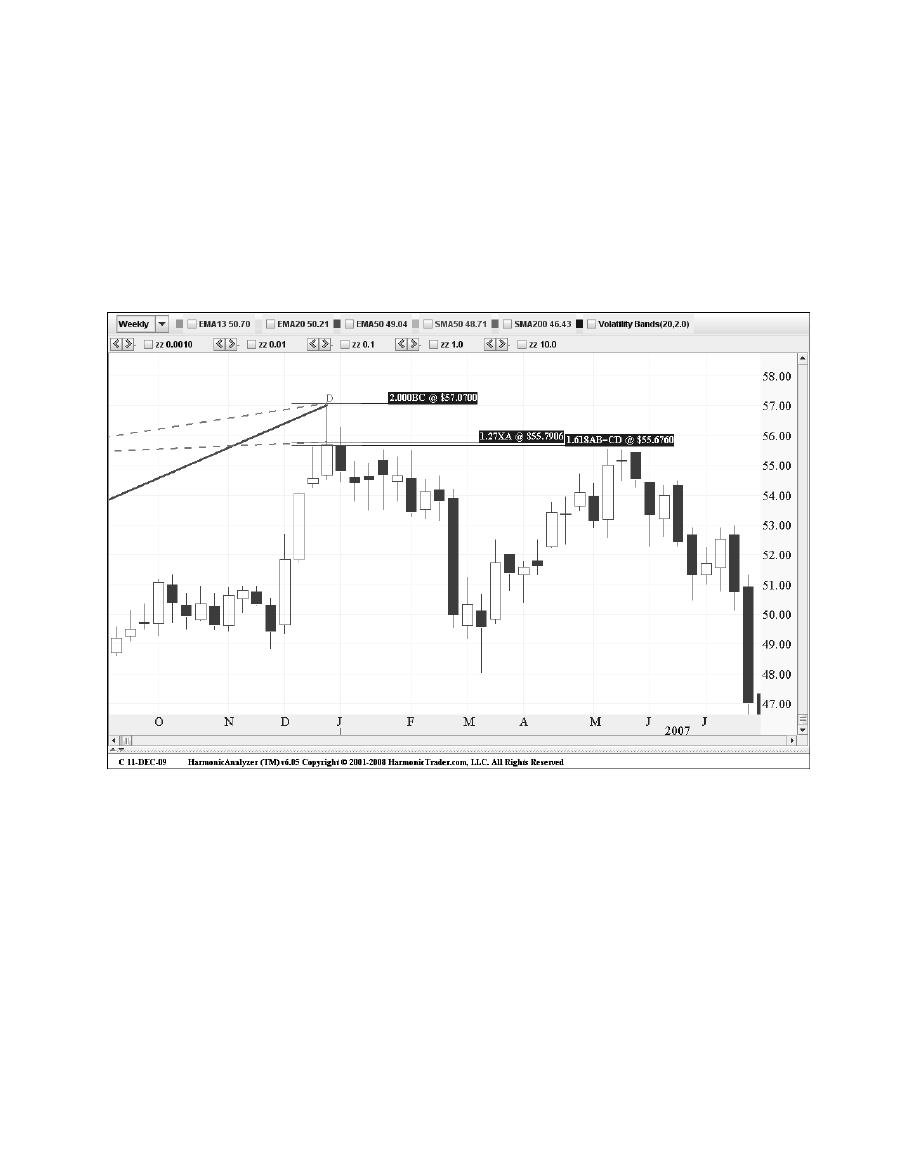
extensions overlapped each other at 55.80, defining the optimal entry for the trade. Figure 8.11
of the price action in the Potential Reversal Zone (PRZ) shows an ideal reversal the week after
the entire range was tested. The price action stalled the following price bar after the completion
of the pattern and the stock declined sharply immediately after the initial reaction. In fact, the
weekly price bar that initially tested the entire range of numbers closed below the PRZ. In
addition, the subsequent weekly price bars nominally retested the PRZ but repeatedly closed
below the harmonic resistance. Such price action is indicative of a valid reversal and represents
one of the clear signs of a potential change in trend.
160
Harmonic Trading: Volume One
Figure 8.11
This example of Citigroup emphasizes the ability of harmonic patterns to identify critical
turning points in the financial markets on any timeframe. In this case, the long-term nature of
the setup was quite significant. Although the complete collapse of the stock could not have
been predicted based upon the Butterfly pattern alone, the weekly price action clearly indicated
major resistance that was to be regarded. At a minimum, the setup indicated a substantial
selling opportunity. As the stock rolled over the next several months, the severity of the decline
became evident.
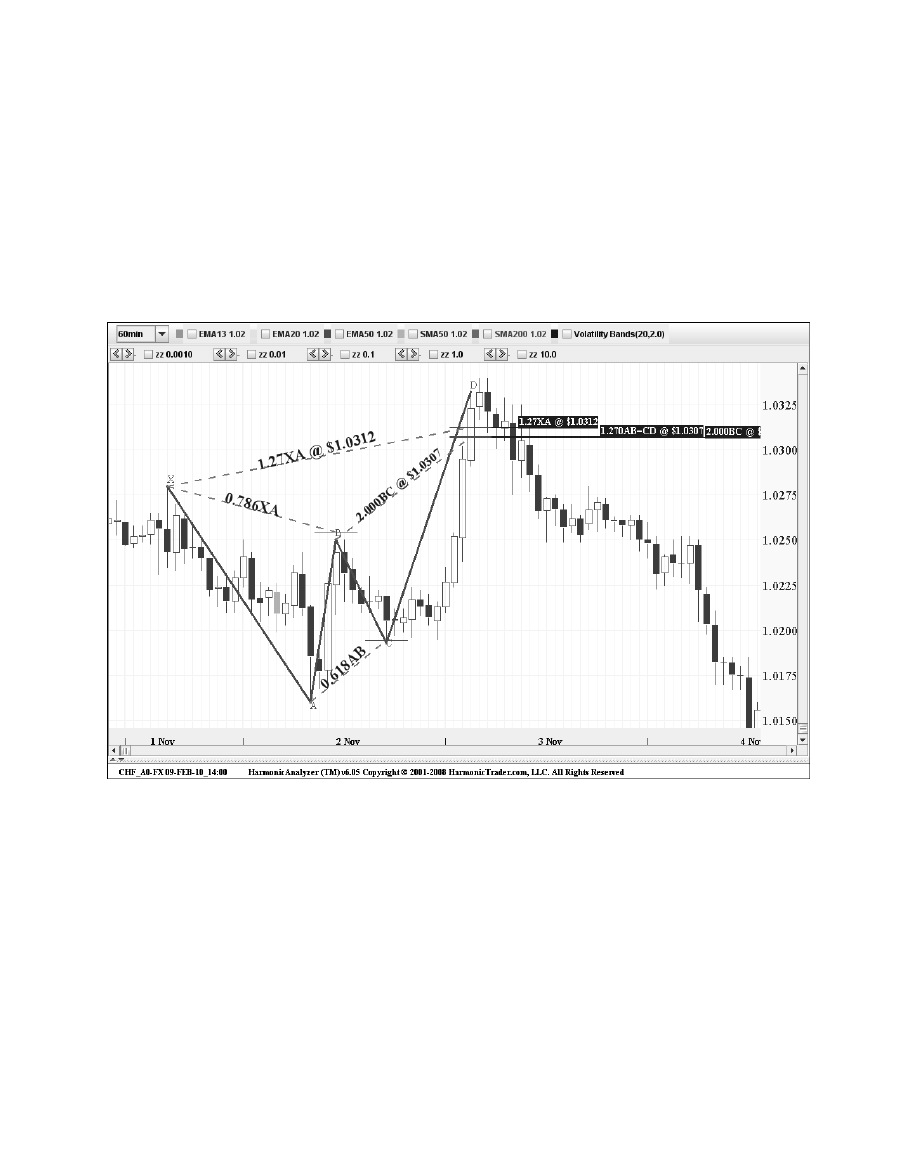
Swiss Franc
(CHF_A0-FX): 60-Minute
The next example of a Bearish Butterfly in the Swiss Franc shows another excellent harmonic
pattern in the currency markets (see Figure 8.12). The 60-minute chart possessed a distinct
pattern that clearly defined the critical resistance. The pattern formed the required Fibonacci
alignment to validate the Butterfly structure and the price action rolled over nicely after testing
the entire PRZ. The pattern marked an important reversal of the predominant intra-day trend.
Chapter 8
The Ideal Butterfly Pattern
161
Figure 8.12
Although the CD was somewhat extended, the structure was quite distinct with a tight range
of numbers to define the completion of the pattern. The reversal occurred shortly after testing
the entire range of harmonic resistance.
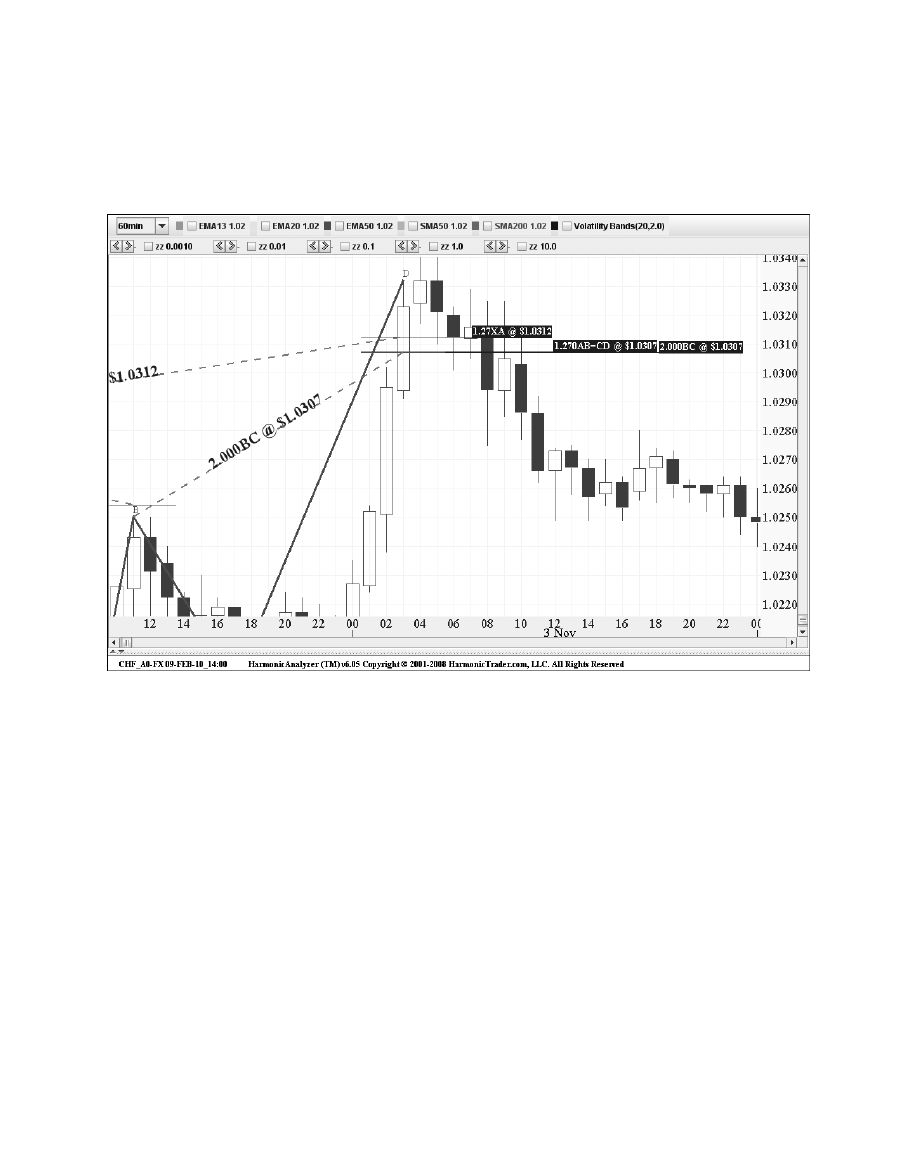
Figure 8.13 of the price action in the Potential Reversal Zone shows an ideal reversal after
the entire range was tested. The Swiss Franc stalled in an ideal fashion immediately following
the completion of the pattern.
162
Harmonic Trading: Volume One
Figure 8.13
The last two examples exhibited similar reversals on two different timeframes. The weekly
Butterfly in Citigroup and the 60-minute setup in the Swiss Franc possessed almost exactly
the same pattern alignments. The nature of each reversal was similar, despite the difference of
the respective timeframes. These examples underscore the uniformity in the application of the
Harmonic Trading principles, regardless of the timeframe and market being analyzed. Each
situation should be handled in similar fashion while always being mindful of the respective
timeframe that is being analyzed.
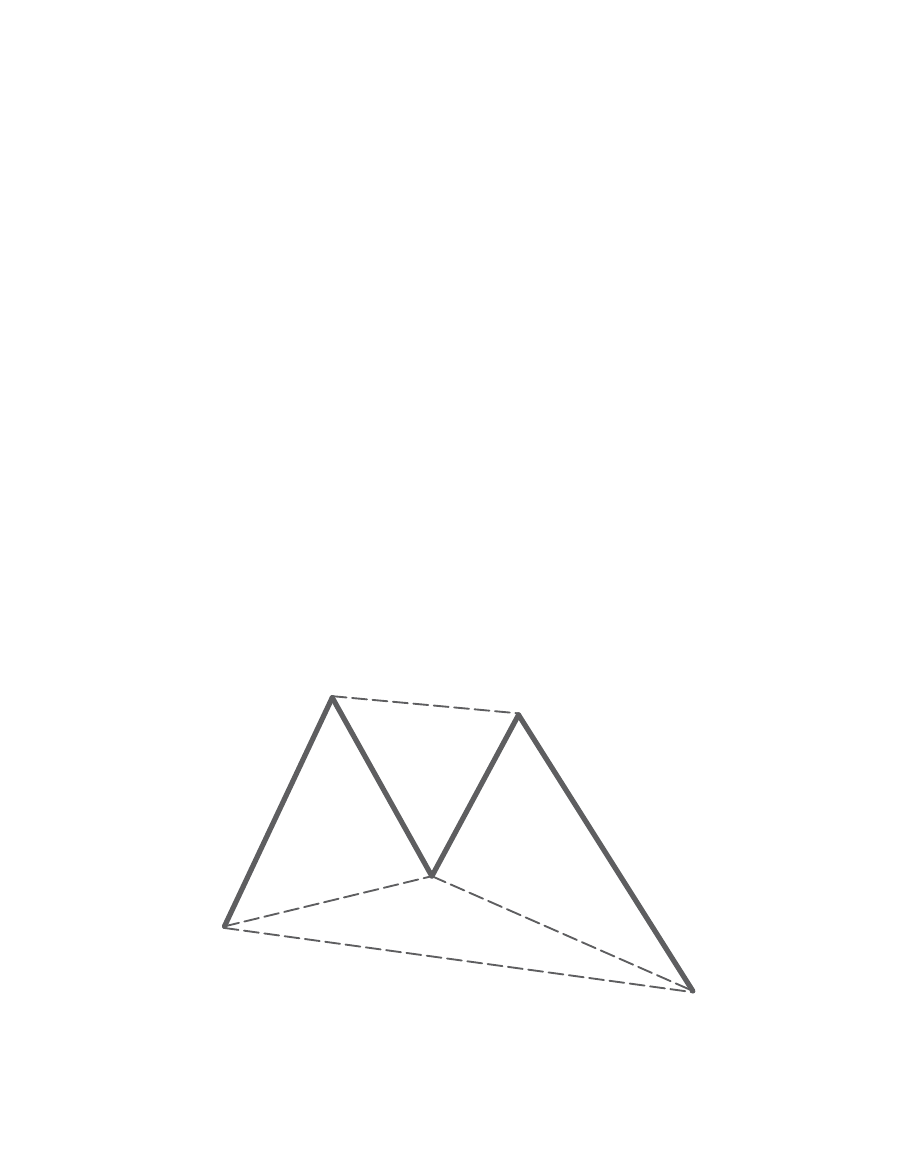
The Perfect Butterfly Pattern
The Perfect Butterfly pattern is defined by a B point retracement that an exact 78.6% of the XA
leg to set up the ideal alignment of Fibonacci ratios. Another distinctive aspect of the Perfect
Butterfly structure is a precise 1.618 BC leg that complements completion of the 1.27 XA leg.
Although the ideal Butterfly alignment permits some variation of the BC projection—up to a
2.24—the perfect structure possesses only a 1.618 BC. Although the ideal Butterfly alignment
permits either AB=CD type, only the Alternate pattern 1.27 AB=CD is valid for the perfect
pattern.
1. Exact 0.786 B point retracement of the XA leg.
2. 1.27 XA projection exclusively.
3. 1.618 BC projection.
4. Alternate 1.27 AB=CD in the PRZ.
5. C point with range between 0.50 to 0.886 retracement.
The Perfect Bullish Butterfly
The perfect Bullish Butterfly is a distinct 5-point extension structure that requires a specific
alignment of Fibonacci numbers, including a 1.27 XA projection as the lowest limit in the PRZ
(see Figure 8.14). The pattern must possess an Alternate 1.27 AB=CD pattern with a precise
1.618 BC projection, as well.
Chapter 8
The Ideal Butterfly Pattern
163
X
B
1.27
C
0.50;
0.886
1.618
0.786
A
D
Figure 8.14
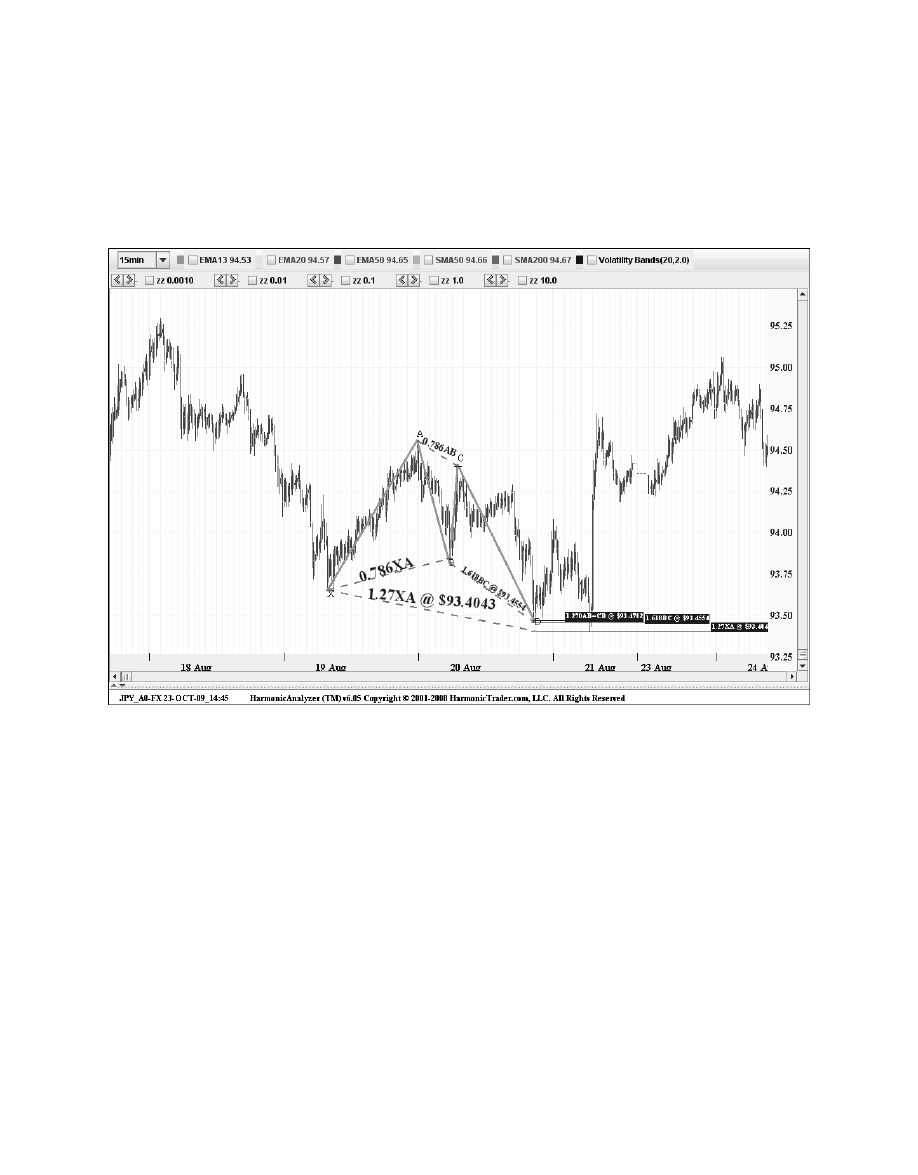
Japanese Yen
(JPY_A0-FX): 15-Minute
The Yen formed this perfect intra-day Bullish Butterfly that reversed exactly at the harmonic
support (see Figure 8.15).
164
Harmonic Trading: Volume One
Figure 8.15
The structure possessed the required alignment of Fibonacci ratios to validate the perfect
pattern. The 1.27 XA projection, the 1.618 BC projection and the Alternate 1.27 AB=CD
converged in the 93.50 area to define the Potential Reversal Zone. The price action reversed
exactly at the 1.27 XA leg and rallied sharply from this harmonic support.
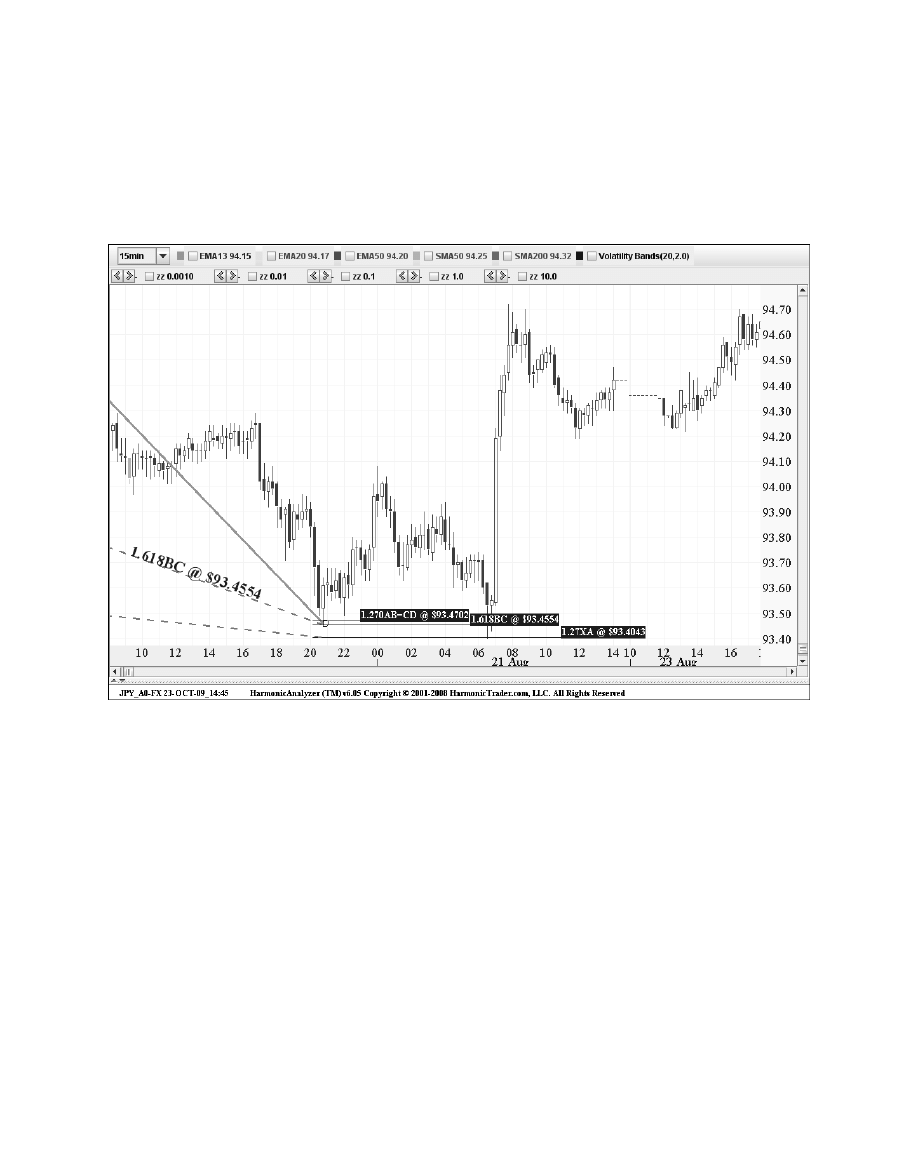
Chapter 8
The Ideal Butterfly Pattern
165
Figure 8.16
The Yen reversed immediately after testing the entire PRZ and exploded to the upside.
The dramatic bullish continuation exemplifies the potential of valid Perfect Butterfly structures.
The perfect ratio alignment defines particularly reliable support zones and excellent trading
opportunities, as each pattern completion is well defined and typically possesses ideal price
action in the PRZ.
The chart in Figure 8.16 of the price action in the PRZ shows the exact reversal at the
completion of the pattern. The Yen reversed immediately after testing the entire PRZ, and it
possessed an ideal bullish continuation shortly after the completion of the pattern. Clearly, the
price action stabilized as it initially tested the top range of the PRZ. After a brief consolidation
period, the Yen reversed several hours later on a full retest of the support zone.

The Perfect Bearish Butterfly
The perfect Bearish Butterfly in Figure 8.17 is a distinct 5-point extension structure that utilizes
the 1.27 XA projection as the highest limit in the PRZ. The pattern should possess an Alternate
1.27 AB=CD pattern with a 1.618 BC projection that complements the PRZ.
166
Harmonic Trading: Volume One
X
C
B
1.27
0.786
0.50;
0.886
1.618
D
A
Figure 8.17
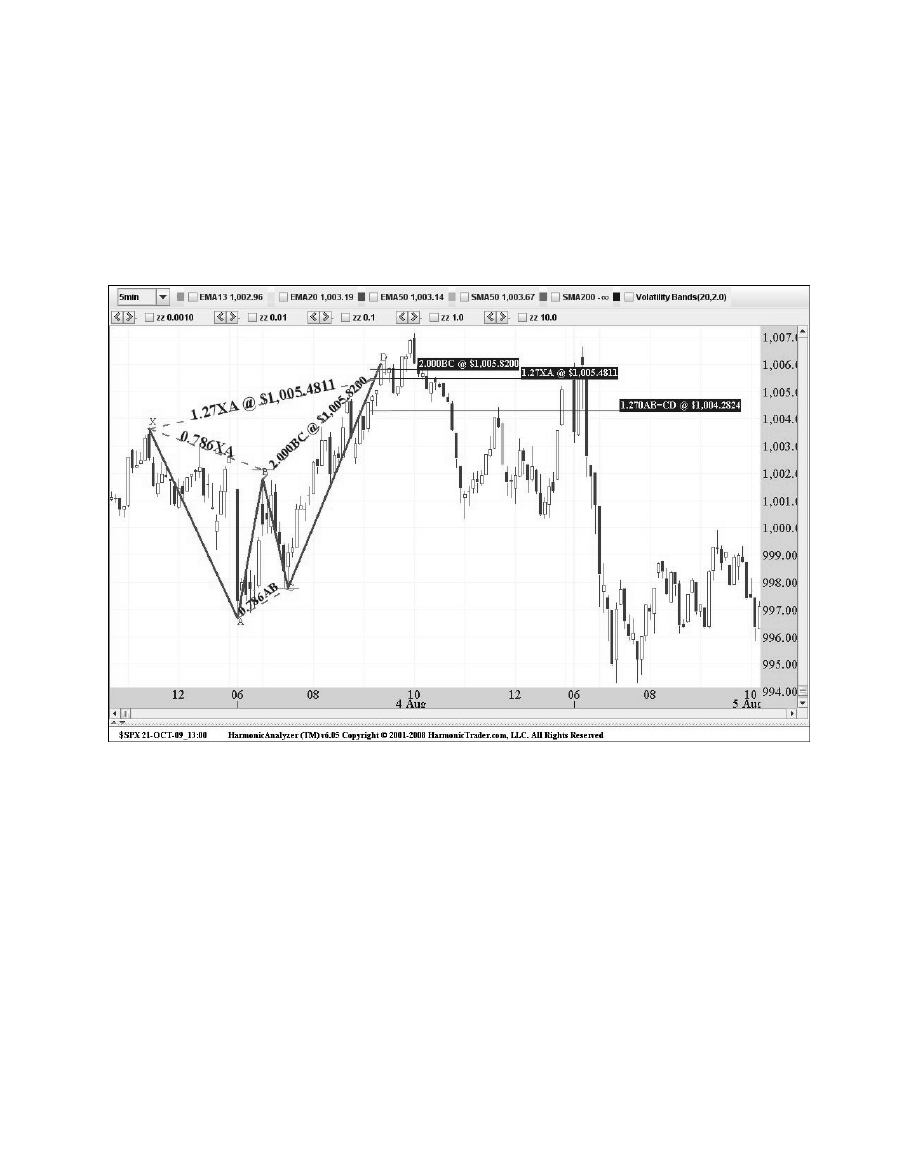
Standard and Poor’s 500 Index
($SPX): 5-Minute
The S&P 500 Index formed this perfect Bearish Butterfly structure on the following 5-minute
chart that possessed an ideal reversal at the completion of the pattern (see Figure 8.18).
Chapter 8
The Ideal Butterfly Pattern
167
Figure 8.18
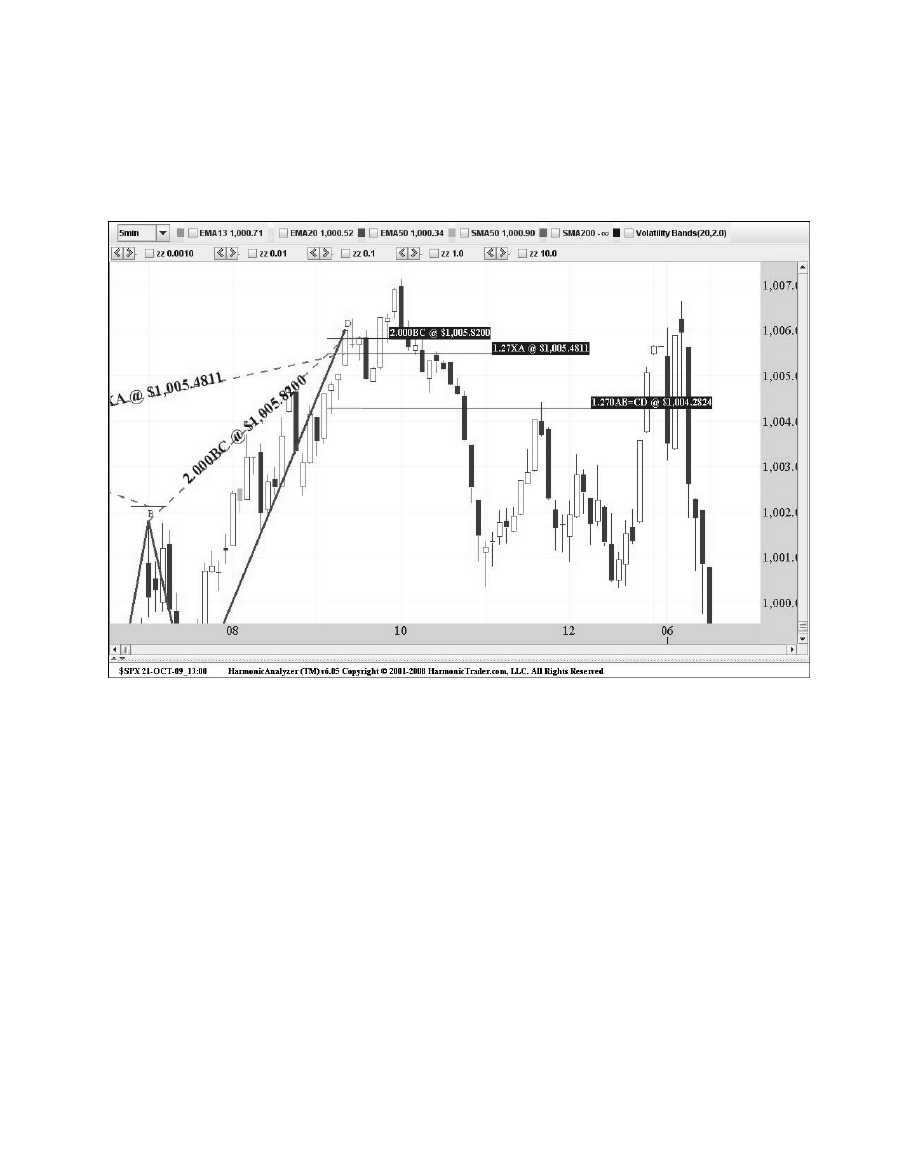
On the following day after the stock tested all the numbers in the PRZ, the price action
reversed sharply (see Figure 8.19). The resistance at the 1.27 XA projection defined the top
range of the PRZ at 1005.48. Complementing this area, the Alternate 1.27 AB=CD pattern and
the 2.0 BC projections defined the bottom and top of the PRZ, respectively.
168
Harmonic Trading: Volume One
Figure 8.19
Although the price action required a second intra-day test before triggering a more
substantial reversal, the Perfect Bearish Butterfly clearly defined the critical short-term
resistance for the index. This pattern exemplifies the ideal structure that perfect patterns
should possess and illustrates their effectiveness to define excellent trading opportunities.

The Butterfly Pattern Summary
The Butterfly is a specific 5-point extension structure that possesses a distinct alignment of
Fibonacci ratios to validate the pattern. The primary determining element of the pattern is a
precise 0.786 B point retracement of the XA leg. The Butterfly utilizes only a 1.27 XA projection
as the most critical number in the PRZ. Furthermore, the equivalent AB=CD pattern serves as
a minimum requirement for the pattern’s completion. But, the Alternate 1.27 AB=CD pattern is
more common to the structure. The BC projection is another defining element of the pattern, as
it must be at least a 1.618 extension. However, the BC projection is not as extreme in the
Butterfly as it is in the Crab.
1. Minimum AB=CD completion with Alternate 1.27 AB=CD pattern most common.
2. C point retracement can vary between a 0.382 to an 0.886, although 0.618 is
preferred.
3. BC projection can vary from 1.13 to 3.618 and depends upon the C point
retracement.
4. Alternate AB=CD patterns are common within the structure.
The Butterfly is similar to the Gartley because it requires a specific alignment of Fibonacci
ratios—especially a precise B point—to validate the structure. Although such a strict definition
reduces the number of possible trading opportunities, this precision reduces those invalid
situations that may appear similar but fail to yield consistently accurate setups.
Chapter 8
The Ideal Butterfly Pattern
169

This page intentionally left blank

After accurately identifying a potential trade opportunity, the actual price level for the execution
must be determined. Several considerations must be assessed within a specific time period, as
defined by the potential opportunity. Primarily, the validity of the pattern must be determined
and the final action of whether or not to execute the trade or must be determined. Therefore,
effective execution strategies can facilitate the process and optimize trading results.
Why Trading Tactics?
The key to successful trading requires thorough preparation. Investing the time to identify
Harmonic Trading opportunities is only half of the battle. The other part that can be easily
overlooked is the execution of the trade. Therefore, it is essential to create a set of rules in
advance to resolve potential problems that may arise throughout the trading process.
Trading tactics are basic guidelines and strategies that optimize Harmonic Trading decisions.
Such strategies provide rules for nearly every trading situation, attempting to maximize profits
while limiting losses. Clearly, the Harmonic Trading techniques provide an accurate and
effective means to identify critical turning points. However, each reversal is not the same.
Hence, each monetary result—profit or loss—will differ based upon two critical factors:
1. The market’s reaction to the harmonic area.
2. Your response to the price action in the Potential Reversal Zone (PRZ).
In this process, a variety of factors and potential trading decisions must be continually con-
sidered to maximize the result of the position. Since the same patterns yield different results, it
can be difficult to try to “outguess the market” and know which setups will work. However, if a
consistent set of rules is applied throughout the decision-making process, fewer mistakes will
be made and more accurate assessments will improve the overall results of trade executions. In
essence, the actions taken in accordance with these guidelines attempt to maximize profit while
reducing risk.
171

What a Reversal Should Do
The critical factor in determining whether to execute a trade involves an understanding of how
price action
should act, after it has reversed from a harmonic area. Since a convergence of
harmonic numbers defines a critical area for potential turning points, price action that begins
to reverse from that area should clearly continue in that direction. In fact, in my research of
harmonic price action, I have found that the stronger and quicker the reversal, the greater
potential for a nice move. This is incredibly important because sharp reversals from a PRZ
provide clear direction for the future price action. However, price action that is unable to reverse
the predominant trend after testing a PRZ frequently is one of the primary signs of a potentially
failed or invalid pattern setup.
“You Can Only Profit…”
My good friend Bill Sourbey has repeated the following phrase to me in our discussions of the
market through the years:
“You can only profit from that which you can anticipate.”
He continually has repeated this principle to me. It has immense relevance to the execution
philosophy of harmonic patterns. First, the anticipation of the completion of a pattern establish-
es the action to be taken. The PRZ defines the limits of the trade, including the execution point,
the stop loss limit, and profit target. If a price structure possesses the proper Fibonacci ratio
alignment, the anticipation of its completion of the PRZ to validate the pattern creates an
Action-Task Trading Process Model.
The
Action involves the preparation and understanding of all of the most pertinent and
effective rules for each pattern to successfully trade the opportunity. The
Task involves
executing positions based upon the price action at the completion of the pattern, according
to the system of Harmonic Trading rules that defines every possibility, in advance. Does the
structure possess the required elements to be a valid pattern? If not, find a setup that does. If
so, where does it complete? What happens immediately as the entire completion area is
tested? Does the predominant trend continue or does the price action react to the numbers
defining the zone?
These are all anticipatory events that have known possible outcomes. Hence, trading tactics
within the execution process define a plan that outlines actions for all possible considerations
during the trading process.
The Action of preparing and determining which positions to execute follows a set of
identification rules that quantifies patterns, assesses price action, and defines the parameters
of each trade, including the entry, the stop loss and the profit objective. Such preparation is
critical to prevent execution mistakes and to determine the optimal entry within the PRZ.
Furthermore, thorough preparation is essential when faced with volatile real-time situations,
in particular.
172
Harmonic Trading: Volume One

Although anything can happen in the financial markets, a thorough understanding of a
potential trade’s critical technical levels will reduce confusion. For example, extreme price action
that clearly violates a PRZ will frequently provide signs of the impending violation. A complete
knowledge of the set up and the critical harmonic price levels will reduce losses as pattern
failures are spotted well in advance. These situations develop with experience but the task of
preparation is an essential part of the trading process for every setup.
The Task of execution represents the actualization of the preparation to determine the
validity of the opportunity, as defined by the rules of the Harmonic Trading approach.
Although the decision of whether or not to execute a trade may seem simple, there are many
considerations that may affect the exact entry level or negate the setup altogether. Therefore,
the task of execution presents many challenges.
The completion of a pattern creates a unique “technical window,” as the nature of price
action following the entire test of a Potential Reversal Zone can indicate a great deal about the
future price direction of the predominant trend. The action of defining a setup in advance helps
to outline the numeric limits of the trade and the technical window, as well. The price action
should experience some type of reaction in the PRZ as an early sign of a potential reversal.
After a pattern completes, an execution should attempt to capitalize on these small but signifi-
cantly indicative signals. The ability to interpret a pattern’s validity within this technical window
will improve with experience, as the same set of circumstances continually manifest traits of a
valid reversal well before the big move begins. Although the assessment of price action within
this technical window is one of the most challenging aspects of the trading process, the
completion of patterns will typically exhibit distinct evidence of whether or not they will fail.
Therefore, it is essential to assess harmonic setups within this technical window to determine
the task of execution.
It is important to emphasize that the rules within the Harmonic Trading plan are designed
to anticipate all possible technical events that have known outcomes. Hence, such trading
tactics within the execution process define a plan that addresses all possible actions for
each consideration throughout the trading process. However, there is a price to pay in this
anticipation. It’s called the price of the next tick.
The Price of Technical Information
The price of technical information essentially comes down to the next tick. Depending upon the
position, the next tick can make the difference between entering or exiting. If an entry is being
prepared, each tick that transpires brings the potential opportunity that much closer (or farther)
from the actual realization of the execution. As price action approaches a PRZ, the validity of
the pattern must be assessed relative to the current trading behavior. Since the validity of a
harmonic pattern depends upon the price action in the PRZ, each price bar that follows the
initial test of the PRZ can provide more information regarding the future potential of the existing
opportunity. However, a delayed execution in waiting for confirmation of the next tick can often
result in missed opportunities.
Chapter 9
Trade Execution
173

174
Harmonic Trading: Volume One
Every position faces these assessments throughout the entire trading process. It is a type of
opportunity cost for that position. If the next tick goes in my favor, I have risked losing one tick
during the time of the next decision.
The price of the next tick is best related to reversal situations where a profit target has been
attained. For example, let’s say you have a profit in a long position but you are considering sell-
ing because your targets have been achieved. Due to the profitable positions, greed or fear may
stall exit strategies to see “how high will it go?.” So, each tick is related in that the next set of
data will confirm or deny the current position.
Although it is common to give back some of the reversal to allow breathing room for the
price action to assert itself and to determine the extent of the move, the price of technical
information must be assessed in comparison with the parameters of the trade. Although
this concept will be covered thoroughly in Chapter 11, it is important to understand the
decision-making process involved with deciphering price action, especially at the completion
of harmonic patterns.
Execution in the Potential Reversal Zone (PRZ)
The essence of Harmonic Trading is executing in the PRZ. As it relates to pattern completions,
it is within this “harmonic window” that a great deal of information can be obtained. Remember,
harmonic patterns define specific zones that can act as a signpost of potential future price
action. If a PRZ of a distinct pattern possesses several numbers in a distinct area, the price
range should be considered very harmonic. If the price action reverses from this area, the PRZ
could be considered as an important turning point. If the price action does not reverse, it would
indicate that the predominant trend is quite strong. The ability to interpret and to decipher the
price action within these “harmonic windows” is the determining factor in turning patterns into
profits!
Reversal Possibilities
Effective execution requires the discipline to examine a precise PRZ and understand in
advance all reversal possibilities.
After executing a position at the completion of a pattern, the price action can do one of three
things:
1. Exceed the PRZ into the Stop Loss Zone.
2. Reverse slightly off the PRZ and consolidate.
3. Reverse off the PRZ and provide a nice cushion within a relatively short period
of time.

Let’s consider the possibilities:
1. The price action moves into the Stop Loss Zone and requires that the loss be taken—
next trade. Although this may not be the desired goal, stop losses are a part of the
business of trading. Therefore, it is important to remember that all setups are not going
to work out. But, if this approach is implemented consistently over the course of many
trades, these setups will define a majority of favorable trades.
2. Harmonic setups typically provide some type of initial reaction at a minimum after
testing a distinct PRZ. However, all setups are not the same. In this case, when the
price action briefly reverses and continues in the predominant trend, it is critical to
secure the quick profit before the trade becomes a loss.
3. Price action that reverses for a brief period after testing a PRZ frequently provides
a “profit cushion” that provides enough time for the extent of the reversal to be
determined. After a small profit is achieved, the trade management techniques are
employed to maximize profits and effectively handle the position.
Although this may seem oversimplified, the execution of a trade can result in a profit, loss, or
scratch (break even). After a valid harmonic pattern has been identified, the final judgment of
whether to pull the trigger can come down to a few price bars. Utilizing the PRZ as the ideal
pivot area, the extent of the pattern’s validity depends upon specific reversal action within this
defined range.
One critical factor in gauging price action in the PRZ can depend upon which numbers are
the most important. A convergence of a pattern’s projections can be peculiar because in a
reversal zone that contains several harmonic calculations, it is difficult to know which point will
end the trend. Although these rules are generalized, I believe that they serve as important
guidelines to accurately ascertain a priority order of importance to the multitude the harmonic
numbers that may comprise a pattern’s PRZ.
Potential Reversal Zone (PRZ) Tips
• Look for an area of convergence. History has proven that a convergence of Fibonacci
ratio projections, especially specific harmonic price patterns, can identify critical techni-
cal areas of support and resistance. When a distinct pattern possesses a congregation
of ratio projections in a defined price range, it is possible to determine the potential
future direction of the trend.
• Look for where the greatest group of calculations converges. The key to utilizing
these harmonic measures when analyzing a price chart is to determine the area where
the greatest group of patterns complete and important ratio calculations converge.
• The bigger the number the more significant the harmonic area. The Fibonacci
number that is calculated from the largest price leg is usually the most significant at a
pattern’s completion point. This principle applies to both time and price. For example, a
pattern that develops on a weekly chart will be more significant than a setup on a daily
basis. Also, if there is a smaller pattern within a larger pattern, the larger pattern usually
will be more significant.
Chapter 9
Trade Execution
175

• The amount of numbers within the PRZ. The number of ratio projections and pattern
completions within a specific area will dictate the significance of a particular price level.
• The proximity of numbers within the PRZ. If a PRZ possesses several numbers, the
ideal area for a pattern’s completion and ultimate reversal will likely occur where the
majority of the zone’s numbers complete.
The proper identification and interpretation of the price action in the PRZ at the completion
of a pattern is the defining element for success. The preparation and discipline required to
“execute in the zone” is no small task. The determination of a pattern’s completion requires
patience and practice. The ability to capitalize on the reactive first test of the Potential Reversal
Zone is critical in turning patterns into profits. As a pattern completes, the price action can react
sharply, requiring a quick assessment and decision of the execution. The key is to be prepared
as the price action enters the zone on the initial test.
Entering the PRZ: The Initial Test
A well-defined PRZ usually provides some type of initial reaction on the first test of most
harmonic patterns. At a minimum, it has been my experience that distinct PRZs frequently can
provide some nominal yet tradable reaction, regardless of the eventual validity of the pattern.
Although the extent of the reversal can vary, it is important for the initial reaction to clearly
reverse from the entire range of harmonic numbers to validate the pattern.
A common sign of a failed setup is price action that merely consolidates in the PRZ before
resuming in the direction of the predominant trend. Although the determination of valid patterns
requires some experience to consistently differentiate the winners from the losers, the initial
test of the PRZ will always be one of the most critical aspects of the decision-making process.
The price bar(s) that form on the initial test will serve as the projected terminal point for meas-
uring the anticipated reversal. These concepts will be covered in actual chart examples later in
this material. However, the significance of the price action on the initial test of the PRZ must be
emphasized as a vital element of the Harmonic Trading process.
The initial test can occur quickly, and it is not uncommon to miss great pattern completions
on the first test due to the volatility of the price action. The best advice I can offer is to be pre-
pared and track a group of potential patterns as trading candidates. Preparation is essential to
capitalize on the initial test of distinct pattern completions, as these setups typically offer a
reactive yet profitable move.
Many reversal situations experience sharp price action that occurs within a small window of
opportunity. For example, it is common for significant long-term patterns to reverse from a PRZ
within a day or two after initially testing the zone. This can be frustrating, as a slight distraction
could cause the entire trade to be missed. I have encountered many instances where I’ve
missed an anticipated completion of a major intra-day pattern in the index futures like the S&P
500 because I left my screens for 5 minutes to get a cup of coffee. It happens, but the market
waits for no one.
176
Harmonic Trading: Volume One

Remember, the “harmonic window of opportunity,” as defined by the PRZ, is a very precise
area that represents the culmination a several significant price movements. The initial test of
a PRZ represents the completion of these structures and the anticipated change of the
predominant trend. This is significant because, once completed, the potential change in price
action can be dramatic. Therefore, it is essential to be prepared in advance to capitalize on
these situations. However, even the most prepared trader can still be affected by a common
problem of trade execution—hesitation.
The Persimmon Effect
J. M. Hurst, in his profound book
The Profit Magic of Stock Transaction Timing, eloquently
discussed the problem of hesitation or what he called the
Persimmon Effect:
“The ideal time to buy a stock is exactly when it looks the least
interesting! Similarly: The ideal time to sell a stock short is when it
looks as though it will never stop going up!
You will put a stock in your stable and patiently track it for a buy
signal. The price continues to drop and the amount of daily or
weekly variation dries up along with the volume.
Your cyclic (harmonic) analysis tells you to expect this, but it
certainly looks as though all investor interest has completely
vanished.
At such a time it is very difficult indeed to convince yourself that
you should actually take action when that buy signal comes along.”
(J. M. Hurst,
The Profit Magic of Stock Transaction Timing
[Greenville, SC: Traders Press, 1970], 163.)
When it comes to trading harmonic patterns, this frequently can happen, especially in the
early learning stages. Such hesitation is problematic, although thorough preparation helps to
define trading decisions in advance.
Within the Harmonic Trading approach, the problem arises at the completion of patterns,
where the “harmonic signal” generated—that is, the test of the PRZ—does not stimulate the
appropriate trading action.
Jim Kane of KaneTrading.com and I have discussed the Persimmon Effect extensively in
many discussions regarding trade execution. On one particular day, we were looking at a few
intra-day patterns in the index futures in the HarmonicTrader.com Chat Room. We were trying
to determine if we would get an opportunity to see these patterns complete.
I responded by saying:
“WE will always get OUR chance as long as WE give it to
OURSELVES.”
Chapter 9
Trade Execution
177

Within the Harmonic Trading approach, the opportunity to execute patterns, especially in the
PRZ, requires patience and a firm belief in these methods. Although such confidence requires
time to maintain the proper perspective, it is essential to realize that we must define our own
trading opportunities.
The market will provide the necessary signals that can identify potential trading situations.
It’s the trader’s responsibility to learn what these signals mean and to utilize this technical
information to define profitable opportunities. Although other considerations can affect an
execution, the degree of success is dependent upon consistently applying the Harmonic
Trading techniques to identify opportunities and to turn patterns into profits. The measurement
strategies and pattern rules quantify potential opportunities quite effectively. The Harmonic
Trading identification techniques consistently pinpoint the optimal price level for a trade
execution. However, the physical task of pulling the trigger can present its own set of problems.
Despite these inherent challenges throughout the decision-making process, the ultimate step of
executing the trade still requires a correct and timely assessment of the price action. Therefore,
issues related with trade executions such as hesitation—a.k.a. the Persimmon Effect—should
be overcome through the realization as traders that our opportunities and ultimate success is
100% self-dependent.
The hesitation issue also fits well within the Action/Task Trading Process Model. As I
mentioned previously, the Action is defined through the identification and preparation required
to define a Harmonic Trading opportunity. The Task involves executing positions based upon
the general trade management rules that define every possibility, in advance. In essence,
hesitation is just the failure to execute the Task.
Although the Persimmon Effect can prevent a trade execution, the solution to the problem
can be overcome through a process of learning and emotional conditioning. First, it is important
to realize that not all trades are to be taken, even if the opportunity is a distinct harmonic pat-
tern. In fact, in the early application of the Harmonic Trading techniques, it is essential to allow
a period of study and preparation to acquire the proper mental perspective. It is important to be
well versed in all aspects of the Harmonic Trading approach, knowing all of the identification
techniques, the trade execution considerations, and trade management strategies before
attempting to integrate these strategies in real-time situations. After a period of study, the basic
Harmonic Trading techniques will be obvious. However, the application of this approach
requires considerable dedication to develop the analytical skills required to consistently profit
from these opportunities.
In my experience, thorough preparation helps to “slow down” the price action in the PRZ.
When all trade parameters are defined in advance, the decision process is clear. The
“anticipated” trade should act in a specific manner if it is going to be a valid opportunity.
Otherwise, the price action is indicating that the pattern is potentially flawed.
This concept of the PRZ as a window of opportunity is incredibly significant. The specific
range is the critical “make-or-break” level that determines the validity of a potential pattern.
Although there are a variety of confirmation signals to be considered, the basic parameters
of the trade as defined by the price points of the pattern elucidate the execution by clearly
defining all numeric limits and outlining the make-or-break range for a reversal.
178
Harmonic Trading: Volume One

Trade Journal
A trade journal is an effective means of preparation to track potential setups. A trade journal
should include the type of pattern, the completion point of the AB=CD, and the Fibonacci
retracements within the reversal zone. Also, a written journal is helpful in recording your
personal thoughts regarding the relative price action within a reversal zone.
It is important, especially in the early stages of learning these techniques, to keep track of
your thoughts. The questions that arise and the ideas generated during the trade execution
process are your personal signals that help gauge the price action. It is important to record
these feelings and expectations relative to the current price action as a template for comparing
what was expected versus what happened. The key to trade execution of harmonic setups still
requires the accurate analysis of the price action within the reversal zone. Achieving this “feel
for the numbers” requires an understanding of your own personal signals. A trade journal will
record your mental processes and trading behavior. It is only through such study that you will
improve your executions and become a more successful trader.
I have included a sample of my own journal that shows how I approach trade setups. I line
the various setups in “my sights” and wait for them to materialize. If they don’t work out the way
that I have projected, I move on to the next trade. If I do see a setup that comes together, I
gauge the price action. After the opportunity is over, I summarize the events and my response
to the opportunity. If I accept a trade, I will record my thoughts and feelings throughout the
entire experience until I am out.
October 8th
• SP500 Mini-Contract (ES_Z9) = AB=CD @ 1032.75; Down 5 in the pre-market; major
0.618 retracement at 1028.25.
• Microsoft (MSFT) = Retesting Bullish Gartley. Look for 0.618 retracement off pattern
at $26.
• Semiconductor Index ($SOX) = Retesting major Bearish AB=CD. Look to buy calls
on retest under 330 area for eventual 0.886 test. Looks like an eventual blowout of this
harmonic resistance.
• NASDAQ 100 Tracking Stock (QQQ): Setting up Bullish Crab on 60-minute chart in the
$33 area in prior daily resistance area. Looks like prior harmonic resistance is offering
support.
As you can see by my journal entries, I have identified several trade setups listed as
potential opportunities. It is not uncommon for me to follow a potential trade for quite some
time, especially when I am tracking price action after a nice harmonic setup.
Trade journals are an effective means to learn a great deal about price action and harmonic
set-ups. Most important, a trade journal can teach many lessons about personal insights and
perceptions regarding these opportunities. It is even more essential in the beginning stages of
your study because each person’s trade executions are unique. Although two people may utilize
these harmonic methods and calculate the same reversal zone, their execution prices will not
be exactly the same. One person might take the trade, while the other avoids it. The difference
in the perception of the price action at the pattern’s completion point might cause one person
Chapter 9
Trade Execution
179

to wait for a clear reversal from the zone while another enters the trade in the PRZ without
hesitation.
Over time, the trading journal will help you gauge your own personal signals to interpret the
market action. You will develop a feel for what “should be happening.” For example, let’s say that
you have identified a valid harmonic set-up with several numbers within a very tight zone.
Specifically, you have identified a great Bullish Bat pattern. You are looking to buy but the price
action suggests a potentially failed setup because of an extreme price range, tail close, or gap.
You might record in the journal that the pattern looks great but the price action at the reversal
point is too strong or has a warning signal, so you avoid the trade. Also, you might record
that an ideal reversal “should” bounce off this zone quickly and show strong signs, such as a
positive close above the harmonic area. In this example, since the stock is not reversing the
way it “should,” you have not accepted the trade.
During this time, it is important to record the reasons why or why not you accepted the
trade, and the emotions that were associated with your actions. Also, after the opportunity
has abated, it is important to record how the trade turned out and how you responded to the
experience. Did you find yourself biting your nails throughout? Were you feeling confident with
your position or did you doubt your analysis? Recording these events helps to instill confidence
in your ability to decipher price action and develops technical intuition as a chart reader.
Although not all harmonic setups are ideal, developing certain standards of price action
helps create a framework to gauge the reversal zone. A trading journal that records these
experiences is the key to developing your intuition. Each person’s response to price action is
unique. So, it is imperative to learn the signals that you generate during the execution process
to improve future trades.
Trading Checklist
At this point, the identification techniques utilized to define harmonic patterns should be com-
mon knowledge. There is a simple checklist of requirements that all valid setups must possess.
1. Is there a pattern?
2. What is it?
3. Is there an AB=CD?
4. Where does it complete?
5. Are there three or more numbers converging in the PRZ?
6. What are they?
7. What are the time cycles (symmetry) suggesting?
8. Are there any warning signs?
9. At what point is the PRZ no longer valid? (Stop Loss)
10. How much must I risk? Am I willing to risk it?
180
Harmonic Trading: Volume One

The guidelines in this section are the result of years of harmonic research. The Harmonic
Trading Checklist summaries a complex process of measurement considerations into a concise
format. Furthermore, this checklist optimizes trade executions by clearly defining all of the
numeric limits of the setup, in advance.
Trade Execution Considerations
When it comes down to the actual execution, several considerations can influence trading
behavior. In essence, trading harmonic patterns versus just analyzing harmonic patterns
are two different endeavors. The trade execution in the PRZ is frequently a short window of
opportunity. Within that time period, a multitude of factors can delay or even cause a trade to
be missed. Therefore, effective execution requires a more intense and disciplined approach
than just identifying harmonic patterns on a chart.
I would like to take a moment to discuss the distinction between actual trading and simple
pattern identification. I trade these patterns almost everyday, and I must emphasize the
discipline required to actively trade this methodology. In fact, pattern identification is merely
the first step in the process. The degree of trading success requires an ability to identify
distinct patterns, to execute trades in the PRZ and to manage positions within the rules of
the Harmonic Trading approach in all types of market conditions. Actual trading situations can
present challenges that can result in missed trades. Although this can be frustrating, it is better
to only execute those pattern completions that offer the clearest price zones. These are a few
of the lessons that must be learned before gaining a “realistic perspective” on the entire
approach.
20/20 Hindsight
For these reasons, Harmonic Trading frequently looks better in the past than it does in the
present or the future. It is easy to identify past patterns in price charts and lay claim to what
could have been. Unfortunately, the uncertainties involved with real-time executions frequently
alter the true outcome. Furthermore, it can be difficult to know exactly which setups will yield
valid reversals. It would be great if “conditional” orders could be executed the day after a valid
reversal is confirmed and execute trades exactly at the reversal points. Although such hindsight
trading would be immensely profitable, it is possible to interpret the price action at certain
harmonic price zones to determine the validity of a reversal.
The problem arises when price action does not act as anticipated or reverse ideally. This can
lead to missed trades and create uncertainty about future set-ups. Although these realities are
a part of the execution process, there are some considerations that can help attain a “20/20”
success level:
Chapter 9
Trade Execution
181

1. Prepare in advance. It is critical to maintain a list of prospective trades that are
approaching their PRZ. Setting software alerts and monitoring setups as they get close
to their entry point will improve executions.
2. Trades will be missed. Although certain situations may possess seemingly perfect
patterns, it is important to note that not all trades should be taken. Extreme price action
can warn about invalid setups. Sometimes, setups still reverse in the desired direction,
despite these indications.
3. Use 20/20 hindsight. The keys to correcting mistakes and developing more effective
trading strategies can only be discovered through reviewing prior trades.
Harmonic Trading Psychology
There are numerous books on trading psychology that can outline a variety of techniques to
improve the mental aspects of trading. I believe it is an important area of the market to study.
But, I would like to offer a few ideas to improve your trading psychology:
• Keep it simple. Although there is a definite advantage to learning as much as you can
about the markets, overanalysis of potential opportunities can create confusion and
second-guessing. It is important to incorporate only those techniques that have clearly
proven to be effective tools. Yes, certain indicators can be reliable, but it is ridiculous to
try to incorporate every technical measure when assessing a trade.
• Stick to a winning plan. They key ingredient in preventing this confusion is to create
and stick to a winning trading plan. Although I may consider extraneous variables when
assessing a potential trade, Harmonic Trading techniques as defined in my trading plan
are the fundamental basis for entering a position.
W. D. Gann discussed the importance of a trading plan in many of his writings:
“Have a well-defined plan before you start trading, then follow that
plan, as the architect does in building a house, or the engineer in
constructing a bridge or driving a tunnel.
The man who changes his ideas or his plan, which are based on some-
thing practical, for no other reason than that he hopes or fears the market
will do something different, will never make a success.”
(
Truth of the Stock Tape [Pomeroy, WA: Lambert-Gann Publishing, 1923]).
• Full-time trading is not a full-time job. One of the most common reasons for lacking a
clear mental perspective is the simple fact that many traders trade too much. Could you
stop trading for more than a week? A month? A year even? Or do you have to trade? If
you have to trade, you might as well go to Las Vegas because you have just entered the
world of a gambling addict. It is important to take a break after a certain period of time
and pace your trading efforts.
182
Harmonic Trading: Volume One

• Study the masters. In my desire to learn the most pertinent information on the market,
I discovered many books that were more than 50 years old that contained incredible
market insights that remain valid to this day. Today’s “pop trading” books have been
penned by high-profile market celebrities. Unfortunately, many of these people are not
active traders. In fact, at the first online trade show that I attended I met with several
notable authors. It was amazing that many of these people were not active traders, and
many stated that they have not traded for years. Authors such as W. D. Gann, J. M.
Hurst, and R. N. Elliott contain pertinent insights into past markets that are as effective
as they were 100 years ago.
• Review your work. The only way to overcome your trading errors is to study your
trades. Although losses are a part of the business of trading, it essential to review those
trades and the mistakes that caused the faulty judgment to prevent repeating the same
mistakes. If you must pay tuition at the University of Wall Street to learn how to trade
successfully, you have to do your homework and review your mistakes. Otherwise, you
will be doomed to repeat them.
• Don’t care. The proper psychology required in the execution of any trade should entail
an almost careless attitude. After defining all trade parameters (entry, exit, stop loss) in
advance, the pure execution of the trade should be nearly emotionless. Such an attitude
can be difficult because the money risked in each trade can stimulate fear or greed.
However, the key is to focus on the price action before, during and after a pattern has
completed. Any other thoughts, emotions or considerations outside the realm of the
price action at the completion of the defined pattern are meaningless. Furthermore, it is
really not about money. This is a game of strategy and tactic. The level of success
depends upon the proper application of an effective approach such as the Harmonic
Trading methods to turn patterns into profits
Trading Questionnaire
This list of questions is an excellent means to review your overall trading goals. A personal
assessment review is effective in that it can outline your personal beliefs and basic
expectations of trading in general. I recommend writing answers to these questions and
incorporating these guidelines into your overall trading plan:
1. Why do you want to trade?
2. When was the first time you realized you wanted to trade? Why?
3. What was your first trade?
4. What was your last trade?
5. What was your best trade ever?
6. What was your worst?
7. What is your preferred time frame for trading? (Day/Position/Investor)
8. What is your greatest benefit of trading outside of the money?
9. What is your greatest fear associated with trading?
10. How do you know when to buy/short a stock?
11. How do you know when to cover that position?
Chapter 9
Trade Execution
183

12. What is your greatest strength in your trading?
13. What is your greatest weakness?
14. What areas of trading do you think you need to learn more about?
15. Do you review your past trades?
16. What do you expect to get out of trading? (List three accomplishments.)
17. What will your trading be like within each of the following time periods?
• Six months
• One year
• Five years
Effective trade execution requires discipline and preparation. Although a variety of mental
aspects are involved in the decision-making process, the rules that define harmonic setups
must serve as the foundation for all trading behavior. Executing in the PRZ and identifying
patterns with three harmonic numbers in a specific area are examples of the types of basic
rules that must be consistently followed if success is to be achieved. These questions should
be reviewed from time to time, as a follow-up to your trading progress.
184
Harmonic Trading: Volume One
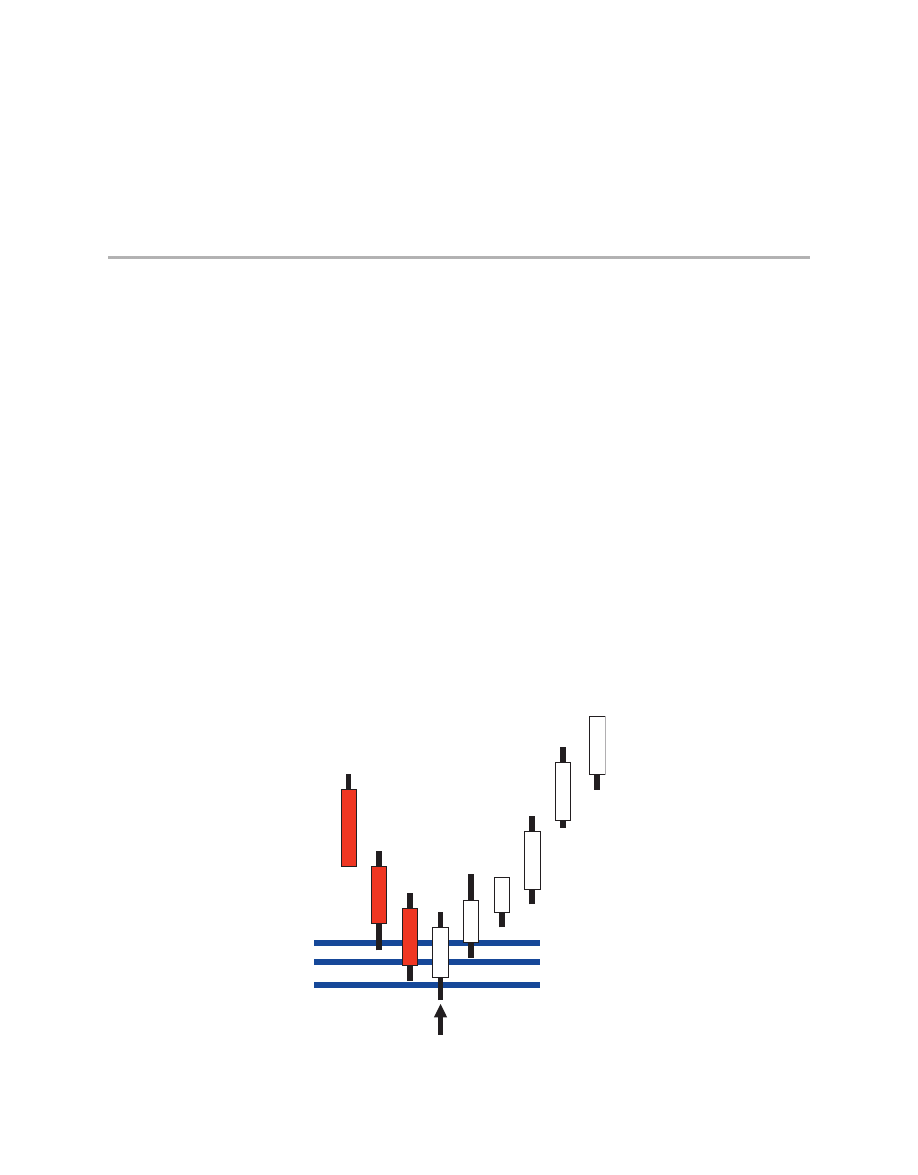
Ideal Reversals
An ideal reversal usually possesses several characteristics that clearly separate it from other
types of price reactions. An ideal reversal usually tests all of the numbers in a Potential
Reversal Zone on the initial test. The predominant trend usually reverses from this initial test of
the entire PRZ and continues in the reversal direction shortly thereafter. In an ideal reversal, the
price bar that tests all of the numbers in the PRZ is called the
Terminal Price Bar (T-bar).
Ideal Bullish Reversal
In an ideal bullish reversal, the price action should reverse after the entire range is tested (see
Figure 10.1). Although price action may seem strong as it declines into the Potential Reversal
Zone, the critical determining point is the reaction of the predominant trend at the completion of
the pattern. The Terminal Price Bar should stabilize after completing the test.
185
TERMINAL PRICE BAR
Figure 10.1
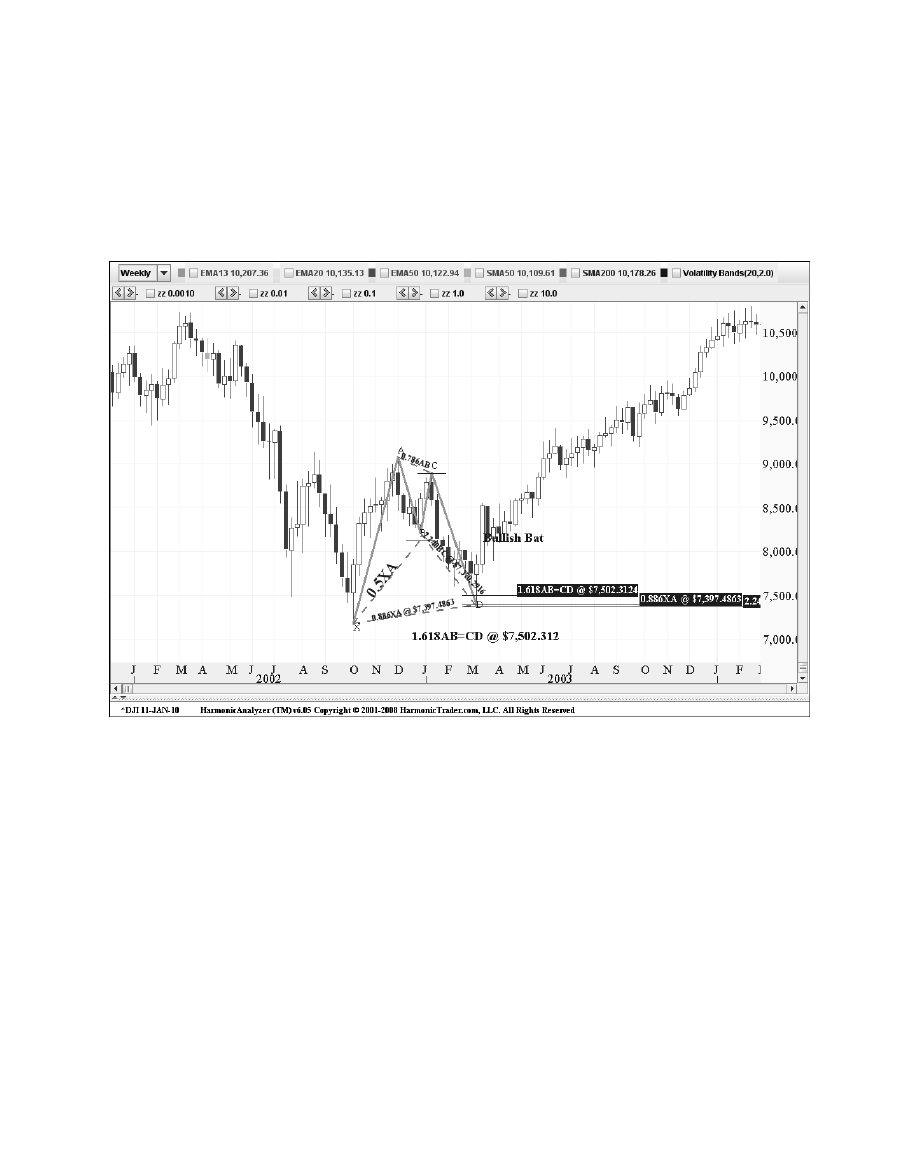
Dow Jones Industrial Average
(^DJI): Weekly
The Dow Jones Industrial Average formed this Bullish Bat after retracing the initial rally of the
2003 low following an extended three-year decline from the 2000 peak (see Figure 10.2).
186
Harmonic Trading: Volume One
Figure 10.2
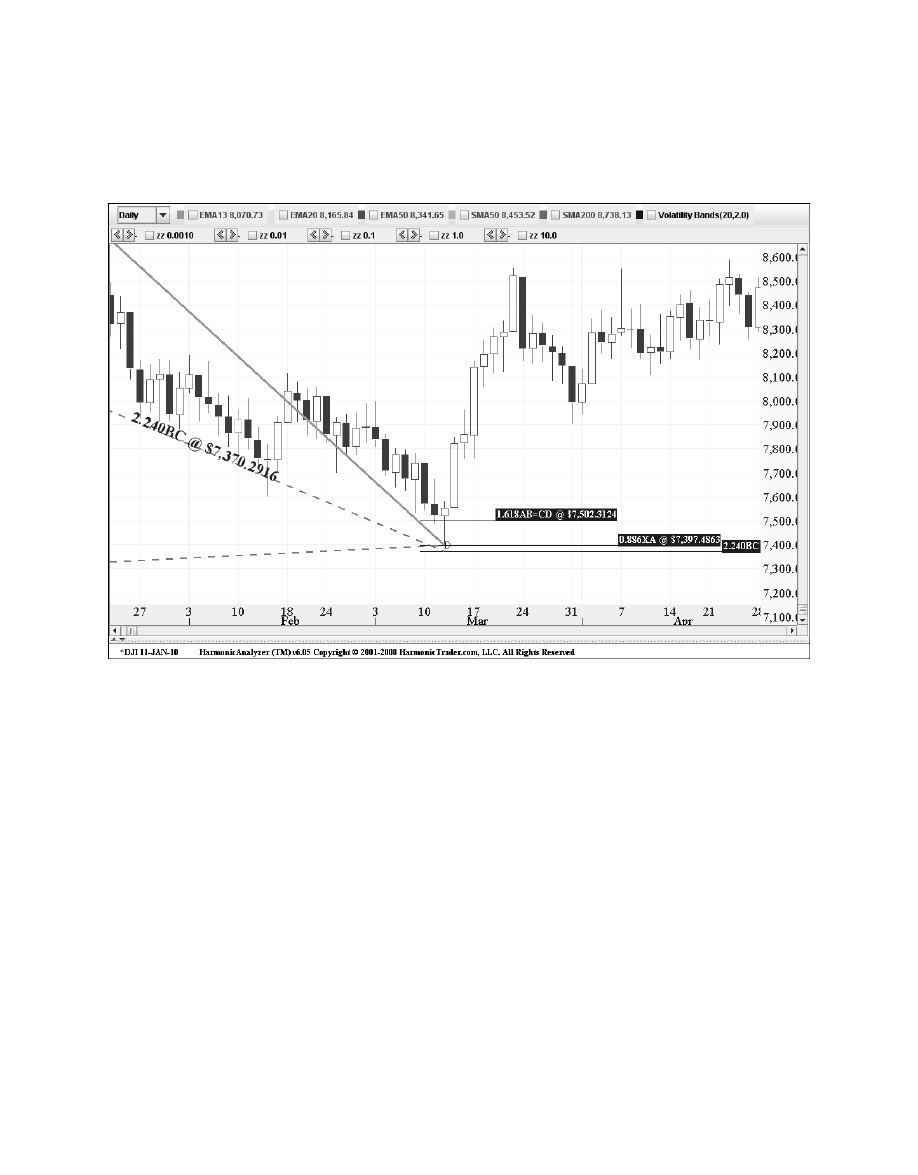
Chapter 10
Price Action in the Potential Reversal Zone (PRZ)
187
The index tested the entire PRZ on the week it completed the pattern. Although the weekly
candlestick represented the Terminal Price Bar for the pattern, the following chart of the price
action in the PRZ in Figure 10.3 shows an ideal reversal on the daily time frame.
Figure 10.3
Clearly, the index established the T-bar on the day it tested the entire PRZ. It is important to
note that the sell-off was quite severe as the price action approached the harmonic support.
Despite the extreme decline, the Dow Jones Industrials stabilized and reversed nicely after the
Terminal Price Bar was established.
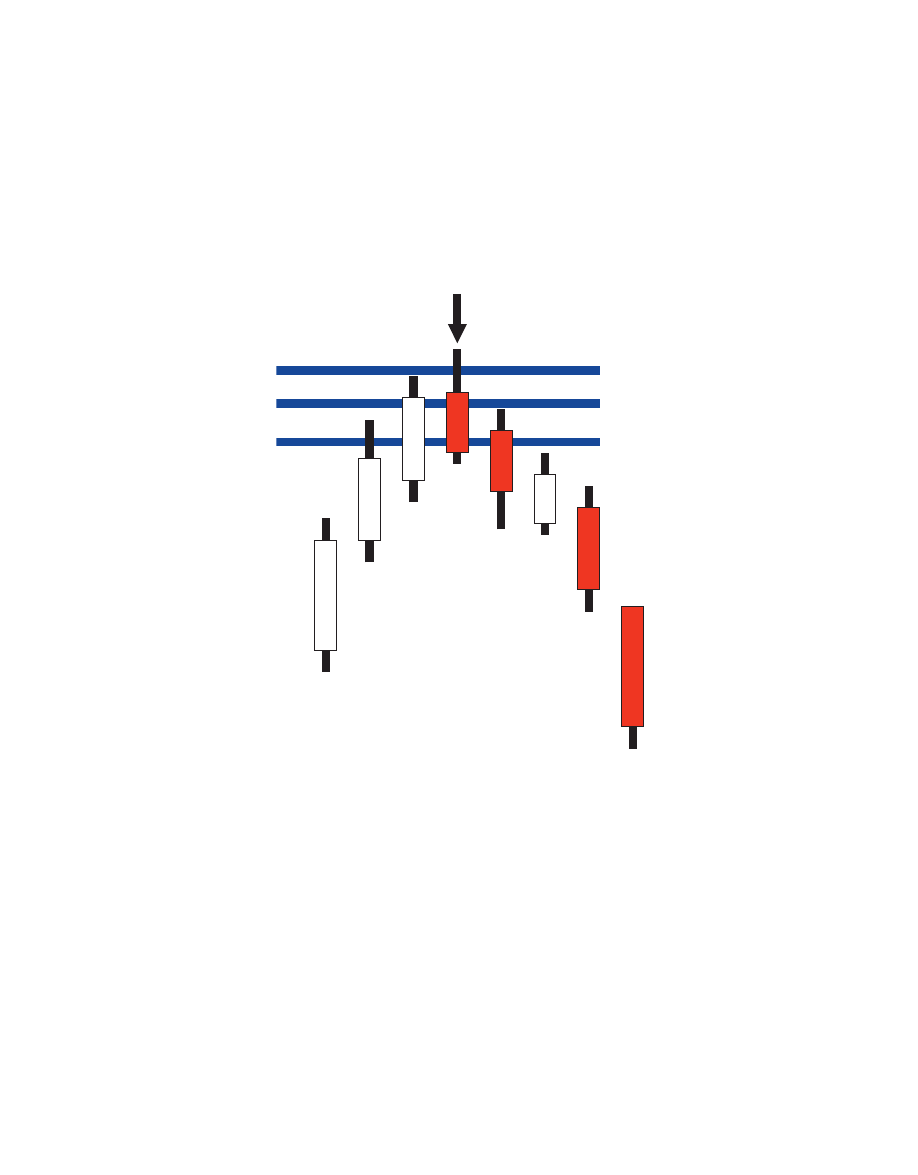
188
Harmonic Trading: Volume One
Ideal Bearish Reversal
In an ideal bearish reversal, the price action should reverse after the entire range is tested (see
Figure 10.4). Although price action may seem strong as it rallies toward the Potential Reversal
Zone, the critical determining point is the reaction of the predominant trend at the completion of
the pattern.
TERMINAL PRICE BAR
Figure 10.4
The most ideal bearish situations continue immediately to the downside after the entire PRZ
is tested and the T-bar is established. The Terminal Price Bar should close below the range of
harmonic numbers in the best cases.
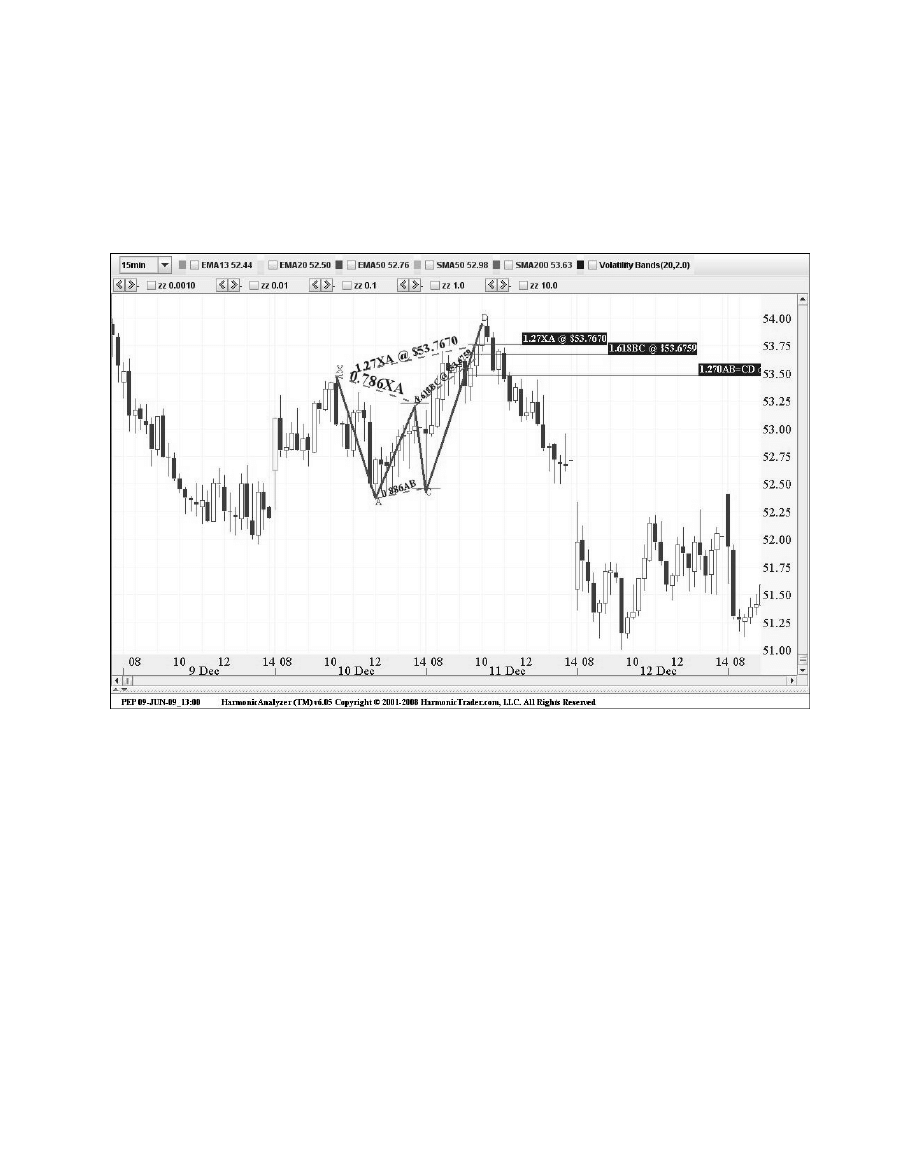
Pepsi
(PEP): 15-Minute
Pepsi completed this Bearish Butterfly on the following 15-minute chart (see Figure 10.5). The
stock rallied sharply into the PRZ but stalled after testing all of the numbers.
Chapter 10
Price Action in the Potential Reversal Zone (PRZ)
189
Figure 10.5
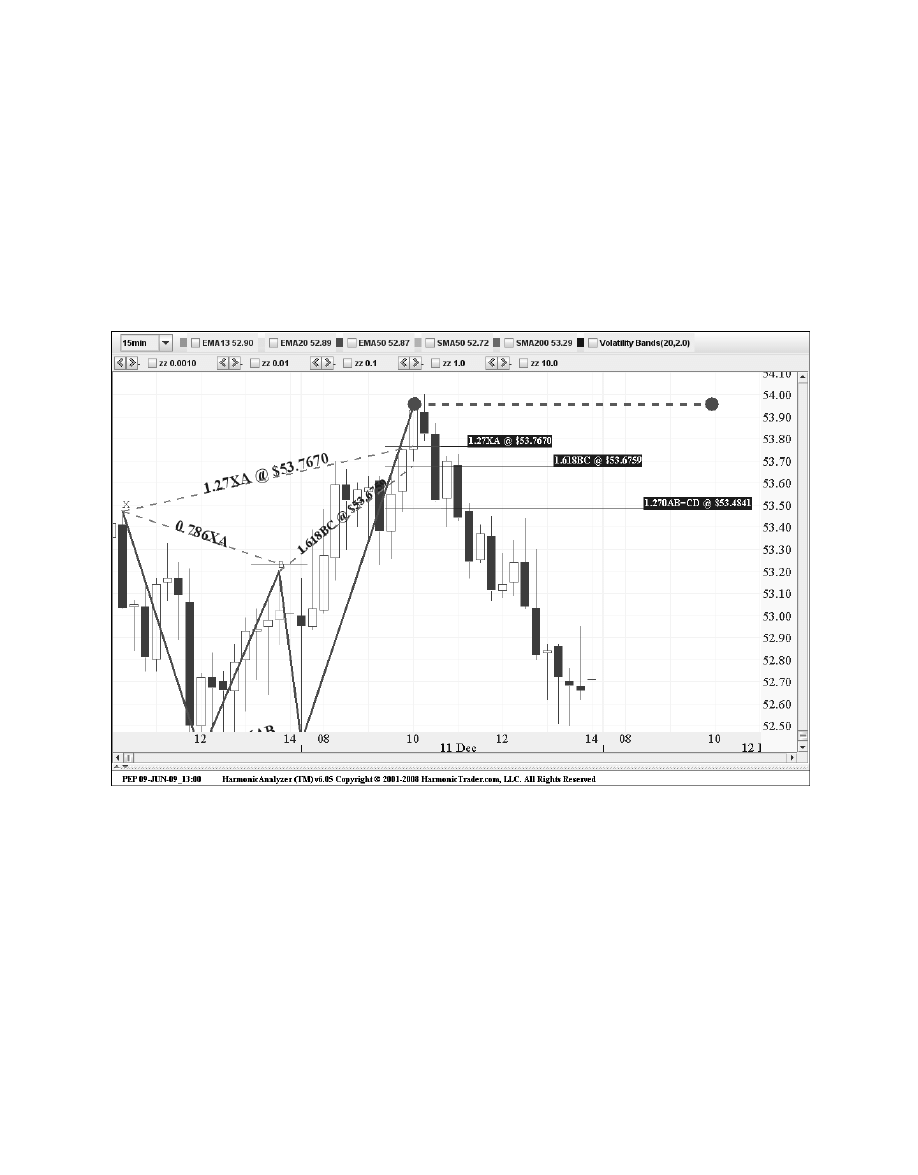
The reversal in this case exemplified an ideal situation, especially with the Terminal Price
Bar being clearly established after testing the entire range of harmonic numbers. The chart of
the price action in the Potential Reversal Zone in Figure 10.6 marks the T-bar with the arrow.
The dotted line marks the top of the Terminal Price Bar, defining the price level that would
negate the harmonic resistance established by the pattern. Essentially, a violation above this
level would question the validity of the trade, and it could even trigger a reversal of the pattern
to get long on a breakout above this area. I will cover these strategies later in this material. For
now, it is important to focus on the elements that define a Terminal Price Bar and the type of
reversal that should occur after it has been established.
190
Harmonic Trading: Volume One
Figure 10.6
Warning Signs in the Potential Reversal Zone (PRZ)
It is common for price action to exhibit extreme signs warning in invalid harmonic patterns. In
many situations, as the price action enters into a PRZ, price gaps and extreme extension
moves can be the trigger of failed setups. Although valid patterns may possess price action that
is extreme, warning signs like these must be considered when assessing the validity of a PRZ.
I refer to these situations as “blowouts,” since warning signs can frequently trigger blatant and
convincing price behavior that invalidates the projected completion of a harmonic pattern.
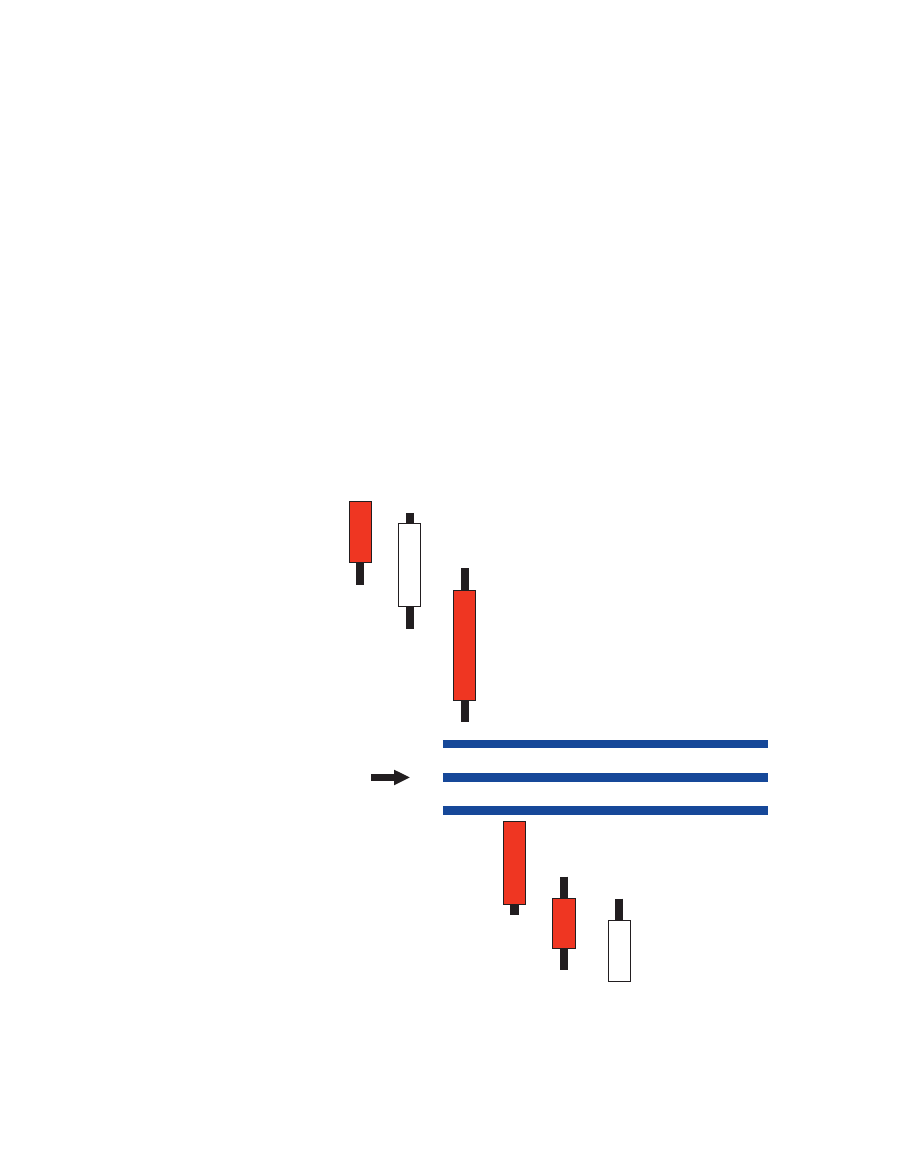
Price Gaps Through the Potential Reversal Zone (PRZ)
Price gaps at the completion of harmonic patterns are a common development that must be
handled carefully. Patterns like the Crab frequently possess sharp price action in their PRZ.
Despite these situations, the determining factor is the extent of the price gap as the action tests
the PRZ.
Price Gap Through a Bullish Potential Reversal
Zone (PRZ)
As price action approaches the harmonic support defined by the PRZ, it typically will “bypass”
the entire range of numbers on a price gap that invalidates the pattern. A price gap THROUGH
the PRZ, as Figure 10.7 demonstrates, is quite different from a price gap INTO the PRZ. The
obvious price gap-warning signal occurs when the price action trades completely past the PRZ,
failing to test any other numbers.
Chapter 10
Price Action in the Potential Reversal Zone (PRZ)
191
PRICE ACTION GAPS
THROUGH THE
POTENTIAL
REVERSAL ZONE (PRZ)
Figure 10.7
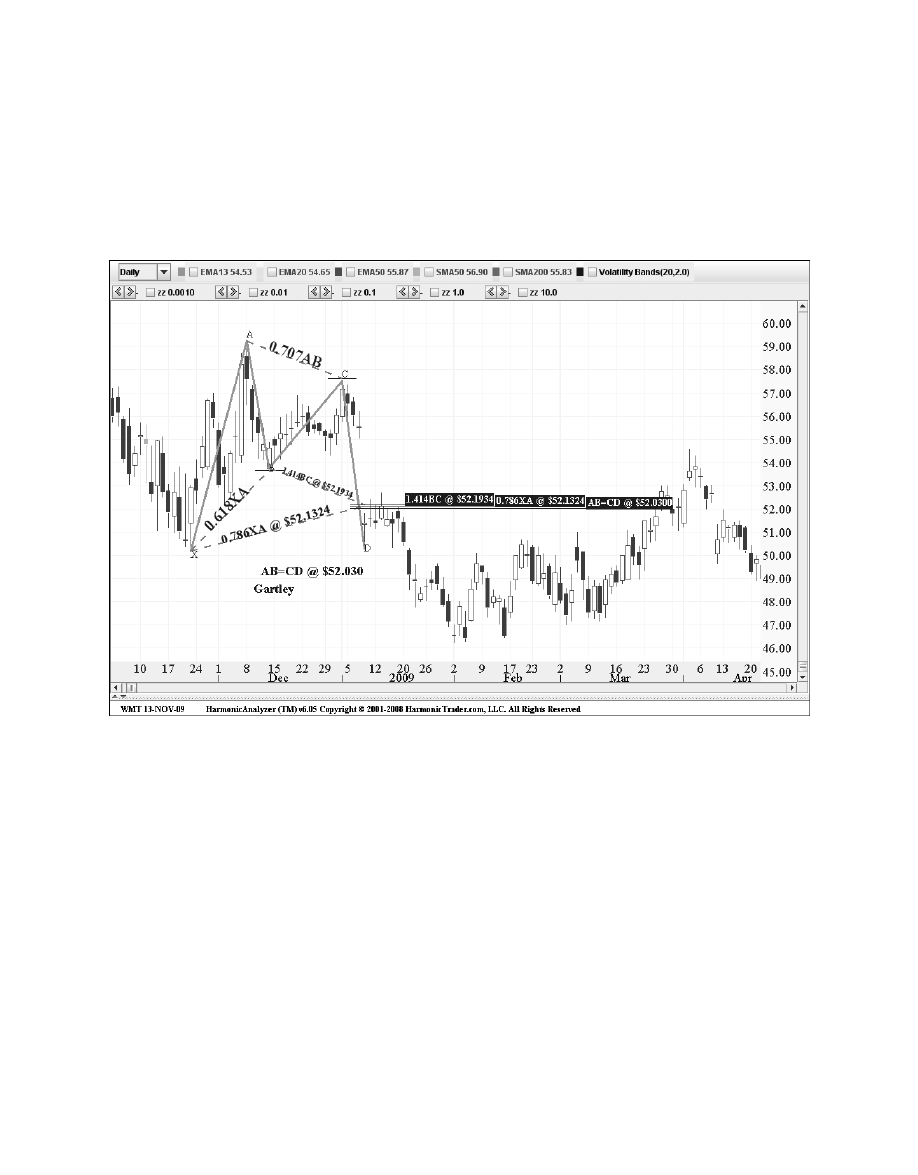
Wal-Mart
(WMT): Daily
The daily chart of Wal-Mart in Figure 10.8 demonstrates extreme price action that trades
completely through the harmonic support established by the completion of the Bullish Gartley.
192
Harmonic Trading: Volume One
Figure 10.8
The blowout in this case exemplified the ideal price gap-warning signal. The stock opened
below the PRZ, gapping down past the critical range of numbers at the completion of the
pattern. The 52.20 level was an extremely critical harmonic support level, as the three numbers
converged in a narrow PRZ. Since the stock opened below these numbers and rolled over
quickly a few days later, the validity of the pattern was negated. Again, it is important to focus
on the action on the initial test of the harmonic numbers. Although the stock bounced a few
days following the violation, the price gap on the open through the entire PRZ exemplified this
warning signal (see Figure 10.9).
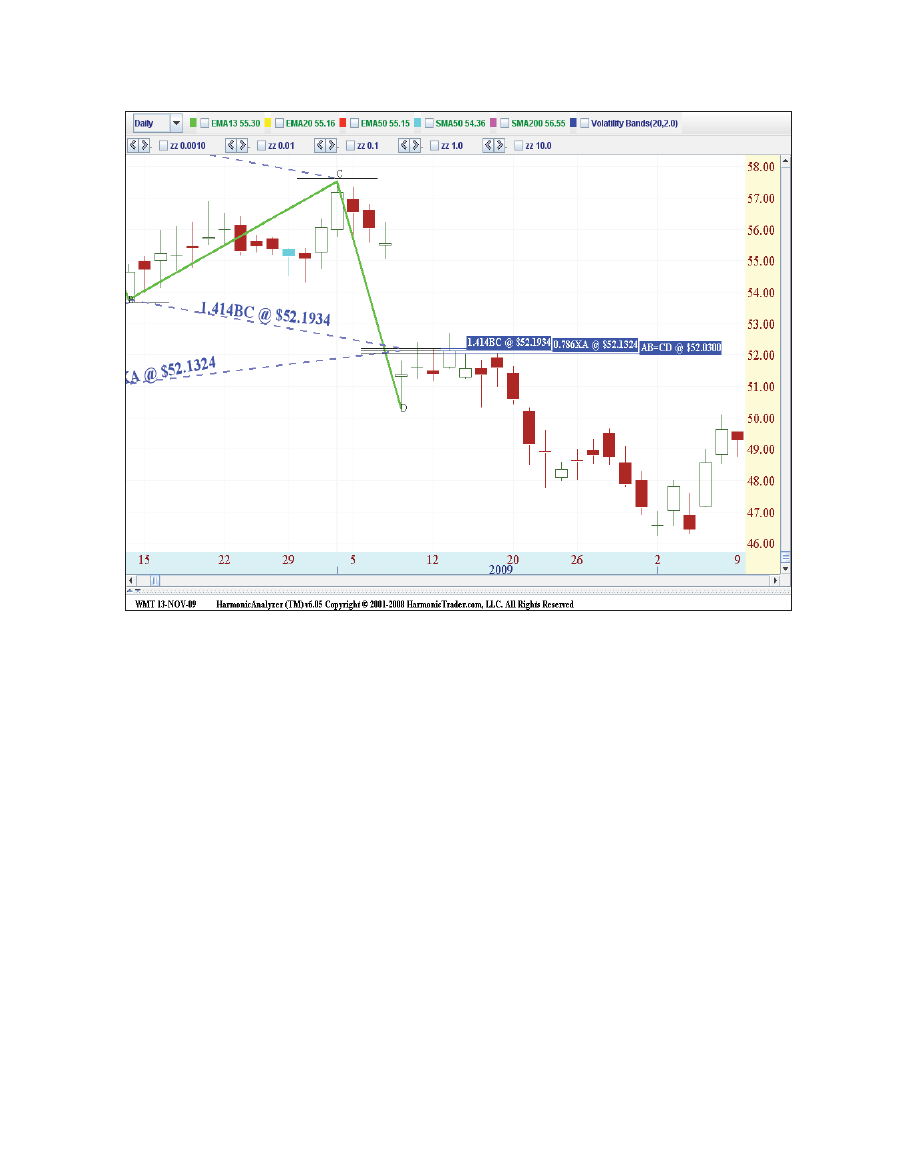
Figure 10.9
Another important element of a blowout is the action that follows the violation. Clearly, a
price bar that blows out a PRZ, trading completely past the numbers, invalidates the projected
completion point. However, it is common for price gaps to materialize IN a PRZ but still yield
a valid reversal. In these cases, it is best to wait for the following price bar to provide further
evidence of the extent of the action. The action will frequently continue in the predominant
trend immediately after the test of the PRZ if the pattern is invalid. These issues will be covered
further in the Trade Management section later in this material. For now, the clear violation of a
price gap THROUGH the entire PRZ will negate a completion point of the pattern.
Chapter 10
Price Action in the Potential Reversal Zone (PRZ)
193
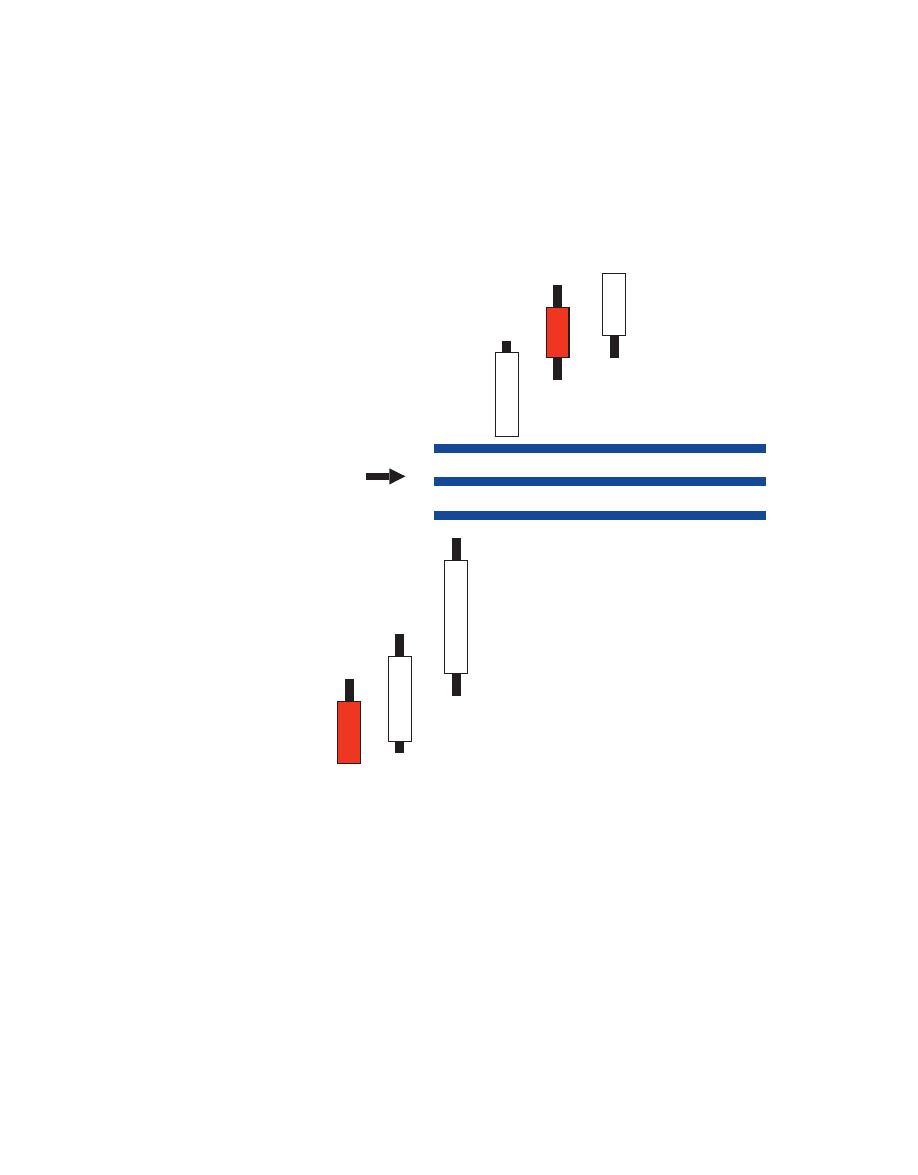
Blowout of Bearish Potential Reversal Zone (PRZ)
Bearish blowouts that gap through harmonic resistance zones commonly offer obvious warning
signals, if the projected completion of the pattern is invalid (see Figure 10.10). In many
instances, price gaps that blowout bearish PRZs can act as tremendous continuation signals to
follow the predominant trend.
194
Harmonic Trading: Volume One
PRICE ACTION GAPS
THROUGH THE
POTENTIAL
REVERSAL ZONE (PRZ)
Figure 10.10
As was the case with the bullish illustration, the blowout of a bearish PRZ should trade
through the entire group of harmonic numbers and continue in the predominant trend. These
situations should be practically obvious, as the price action should rally sharply above the
projected resistance area.
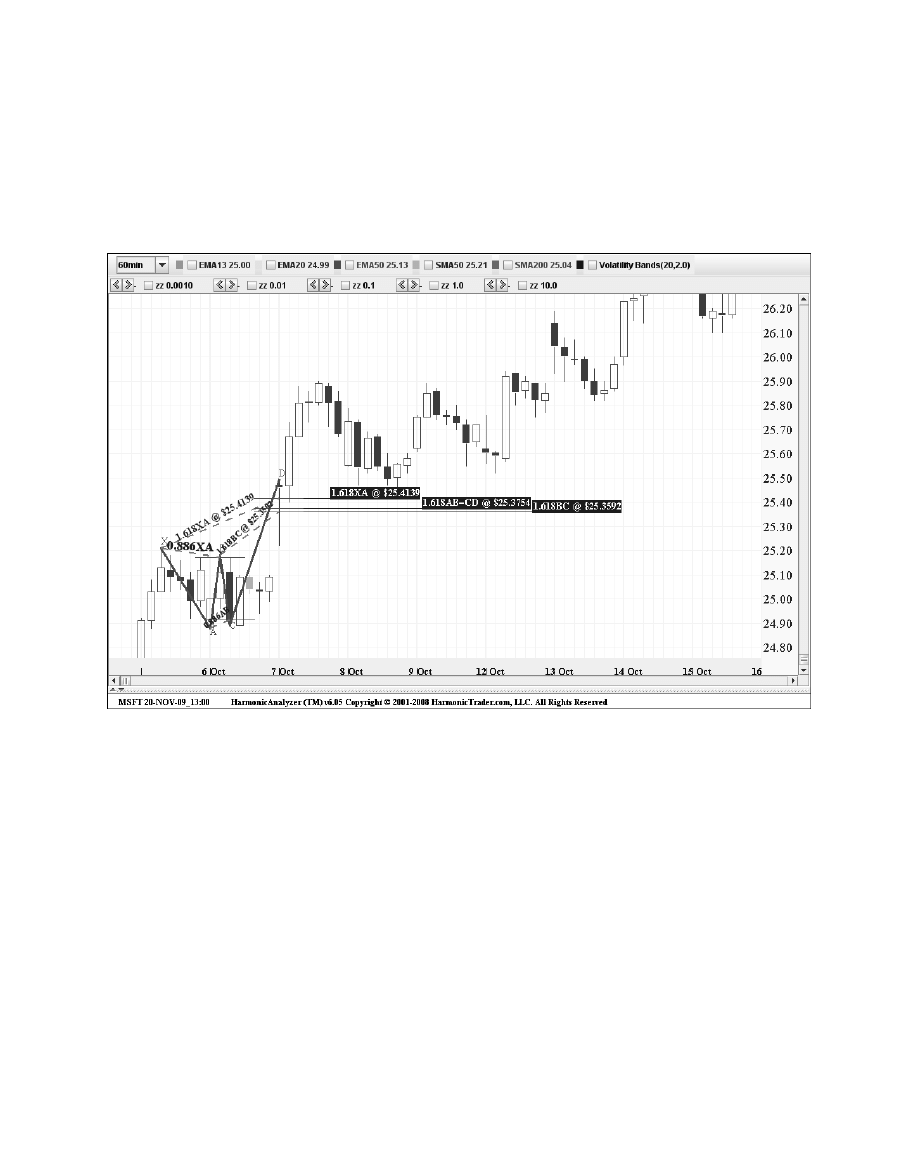
Microsoft
(MSFT): 60-Minute
Microsoft blew out this Bearish Crab on the 60-minute chart, as the stock gapped through the
PRZ on the open and immediately continued higher (see Figure 10.11).
Chapter 10
Price Action in the Potential Reversal Zone (PRZ)
195
Figure 10.11
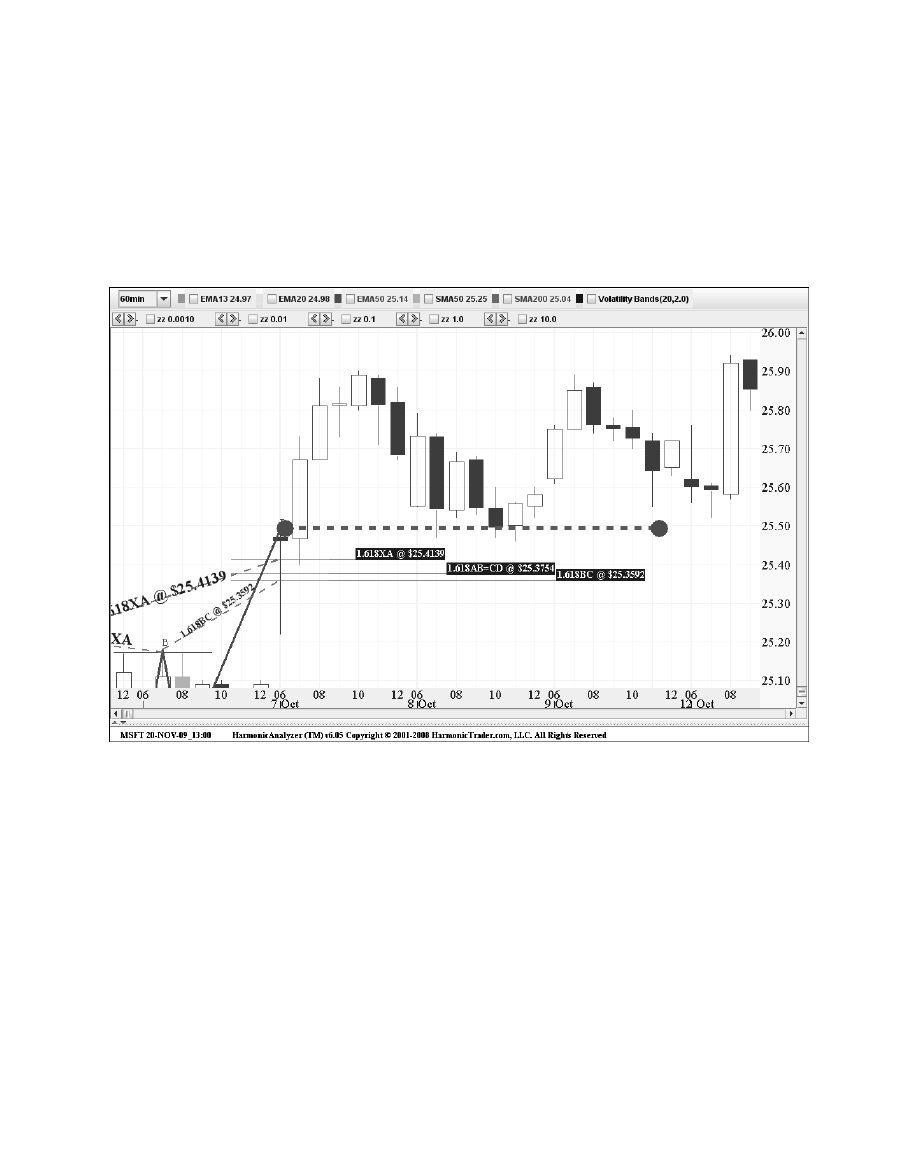
The blowout in this case exemplified the ideal price gap-warning signal that typically
invalidates setups. After the stock opened above these numbers, the validity of the pattern
was negated. Again, it is important to focus on the action on the initial test of the harmonic
numbers. Although the stock briefly retested the top range of the zone, the strong continuation
following the violation confirmed the warning signal provided by the price gap. The chart of the
price action in the PRZ in Figure 10.12 shows the clear violation of the price gap and the
immediate bullish continuation.
196
Harmonic Trading: Volume One
Figure 10.12
It is uncanny how frequently these situations occur, signaling an invalid pattern completion.
These warning signs should appear nearly obvious, as the price action should convincingly
take out the PRZ.
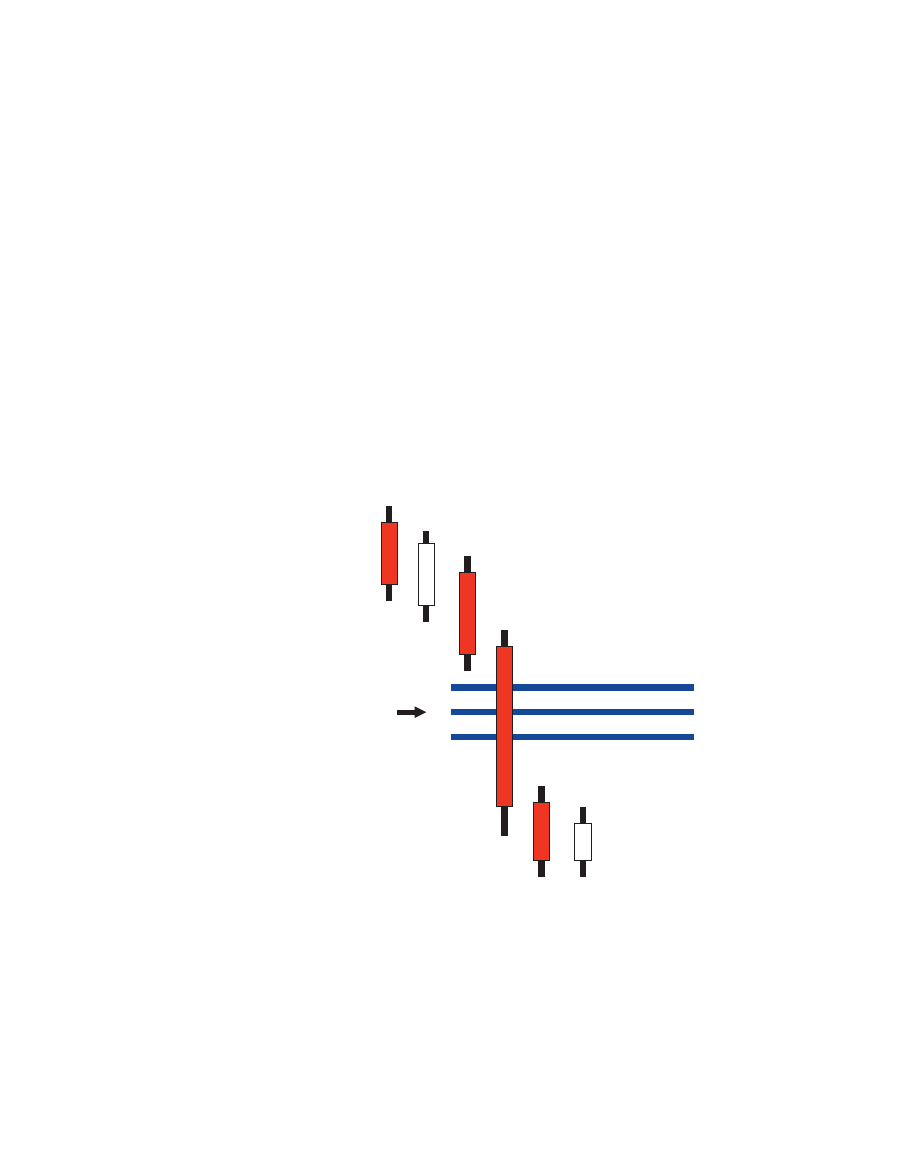
Extreme Price Expansion Through a Potential
Reversal Zone (PRZ)
Frequently, an invalid setup will be indicated by extreme price expansion moves that quickly
trade through the PRZ and continue in the predominant trend. Although it might be difficult
to validate such an extreme expansion until after the fact, the critical factor is the general
momentum that the initial test possesses as it trades into the PRZ. Such extreme price
expansion should be followed by a clear continuation of that predominant trend.
Extreme Price Expansion—Bullish Potential Reversal
Zone (PRZ)
In an extreme price expansion through a bullish PRZ, the trading should clearly and decisively
break down through the support zone on the initial test and continue lower in the predominant
trend after the violation (see Figure 10.13).
Chapter 10
Price Action in the Potential Reversal Zone (PRZ)
197
EXTREME PRICE
ACTION EXPANSION
THROUGH THE
POTENTIAL
REVERSAL ZONE (PRZ)
Figure 10.13
The breakdown should occur quickly and be practically obvious during the test of the PRZ. As
is the case for most PRZ tests, the determining factor is the price action after the entire range
of numbers has been tested. If the price action continues sharply lower after the dramatic
violation, the completion point of the pattern should be considered invalid.
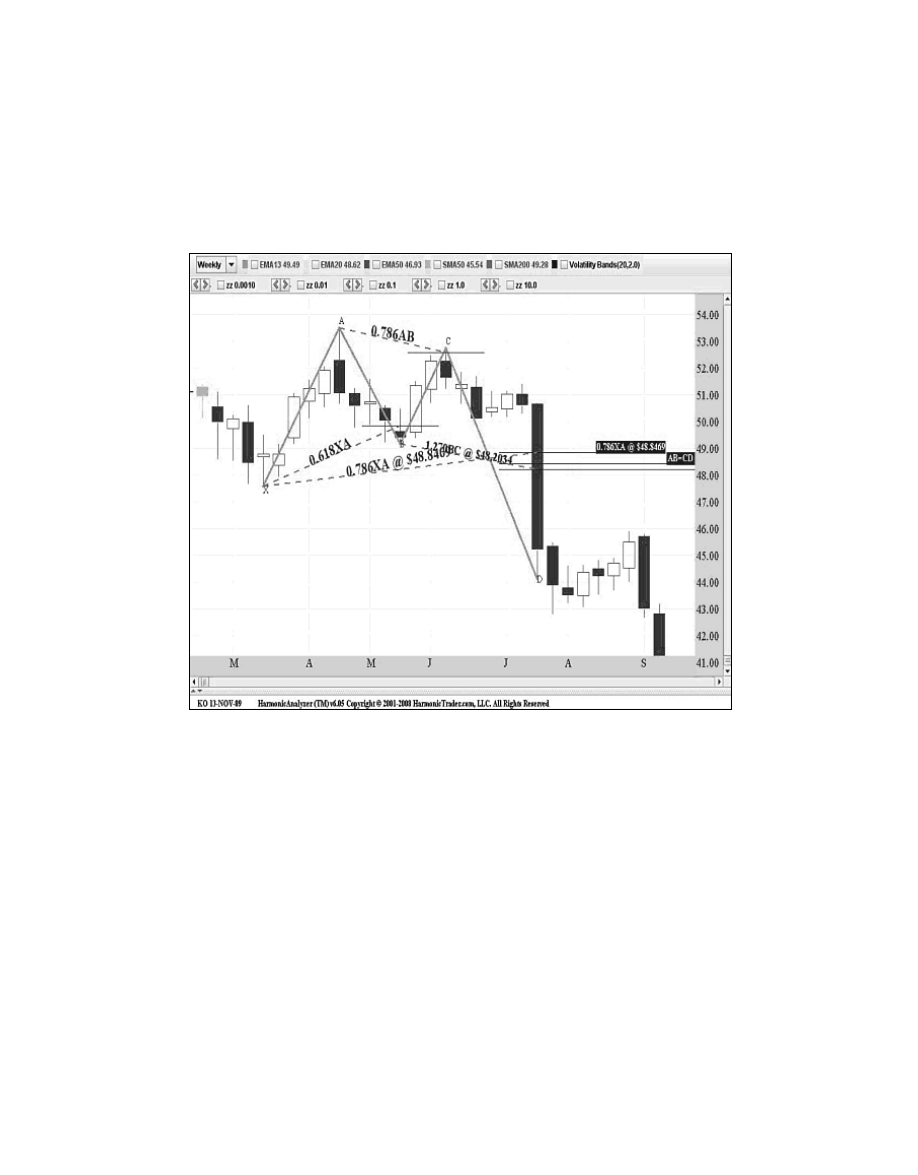
Coca-Cola
(KO): Weekly
The weekly chart in Figure 10.14 shows a Bullish Gartley that possessed a sharp decline as it
tested the entire Potential Reversal Zone.
198
Harmonic Trading: Volume One
Figure 10.14
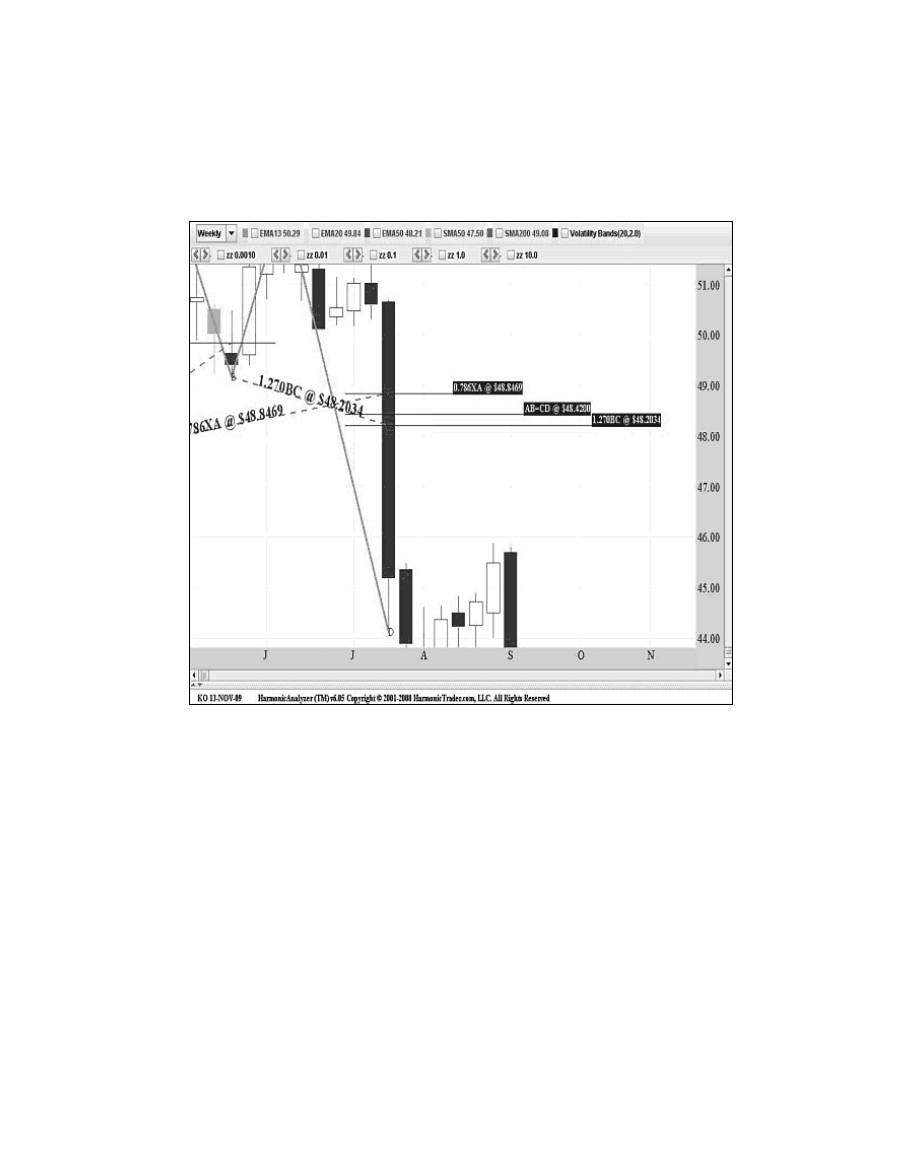
Figure 10.15 of the price action in the PRZ exemplifies the extreme price expansion that
clearly signaled an invalid setup. As the stock traded into the PRZ, it quickly violated the critical
numbers at the completion of the pattern. After the initial test violated the entire range of the
harmonic numbers, Coke continued decisively lower.
Chapter 10
Price Action in the Potential Reversal Zone (PRZ)
199
Figure 10.15
The setup was clearly violated, as the severity of the violation was overwhelming. The
validity of the harmonic support defined by the PRZ revealed itself quickly after the pattern
completed.
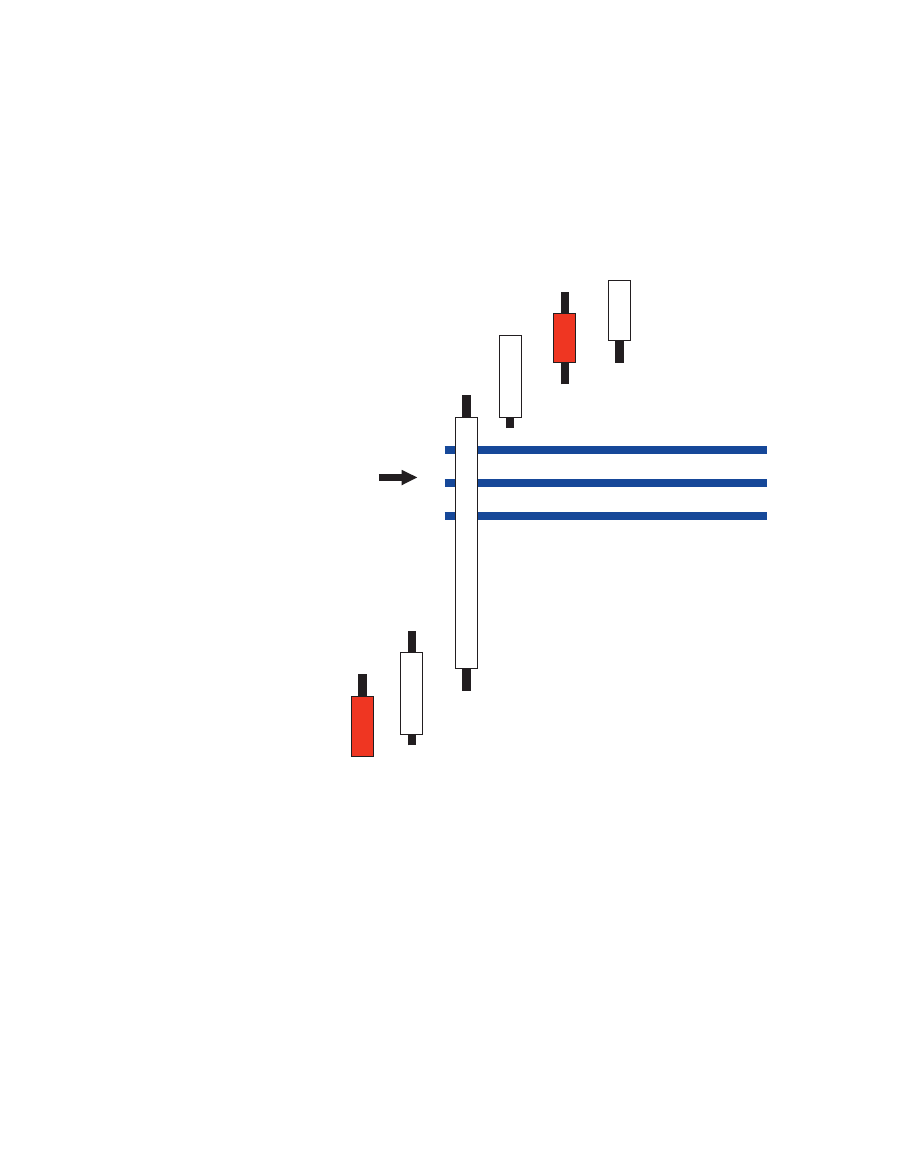
Price Action Expansion—Bearish Potential Reversal
Zone (PRZ)
Extreme price expansions that break out above bearish PRZs frequently signal a continuation
of the predominant trend (see Figure 10.16). The price action should trade decisively through
the resistance area and continue to rally following the violation.
200
Harmonic Trading: Volume One
EXTREME PRICE
ACTION EXPANSION
THROUGH THE
POTENTIAL
REVERSAL ZONE (PRZ)
Figure 10.16
Again, it might be difficult to validate such an extreme expansion until after the fact. The
deciding factor is the price action immediately after the entire PRZ has been tested. If the price
action rallies with strong momentum, it is likely that the warning sign is indicating an invalid
pattern setup. Any trading that continues higher will confirm this signal.
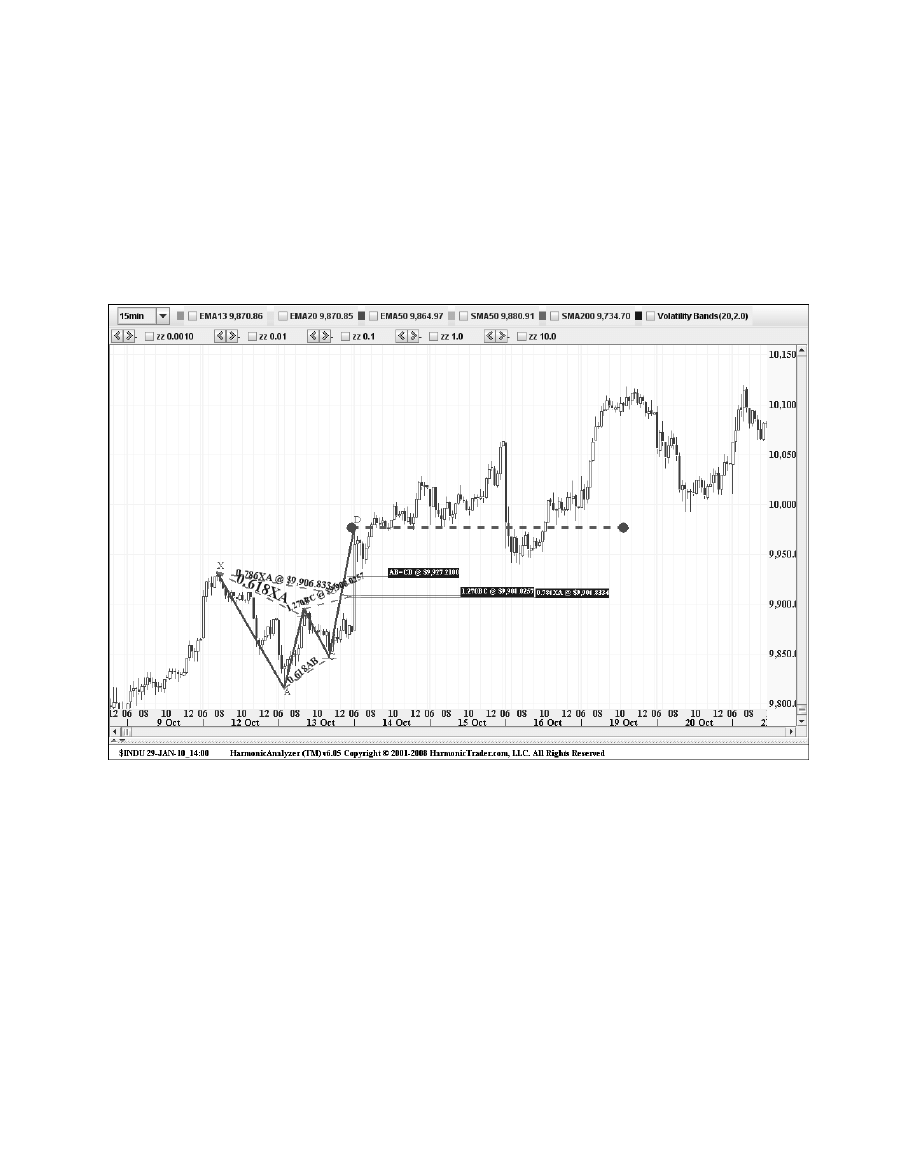
Dow Jones Industrial Average
($INDU): 15-Minute
Figure 10.17 is an ideal example of the extreme price expansion warning of an invalid setup.
The Dow Jones Industrials formed this Bearish Gartley on the following 15-minute chart that
rallied through the entire PRZ as it tested the convergence of harmonic numbers just above
9900.
Chapter 10
Price Action in the Potential Reversal Zone (PRZ)
201
Figure 10.17
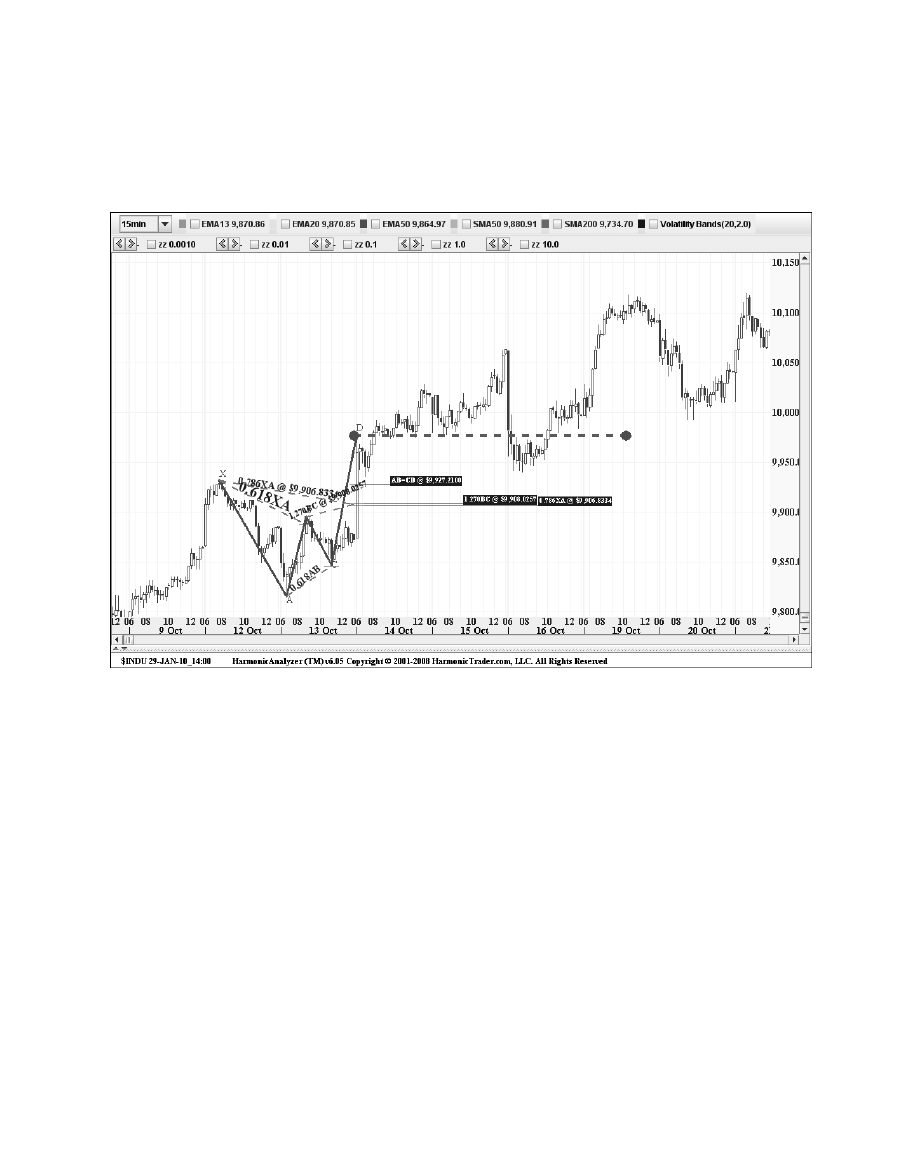
Figure 10.18
Price Action in the Potential Reversal Zone (PRZ)
Conclusion
One of the key principles of Harmonic Trading is analyzing the price action within precise zones
as defined by a convergence of Fibonacci calculations of specific 5-point structures. The type of
price bars that form at the completion of a pattern can provided extensive information regarding
the potential state of the future trading action. In this example, the price action in the Dow
Jones Industrials overwhelmingly indicated a pattern failure. Although such interpretation
requires some experience, it is important to respect clear violation signals to differentiate valid
reversals from failures.
202
Harmonic Trading: Volume One
Figure 10.18 of the price action in the PRZ shows an ideal blowout of the extreme
expansion bar. It is important to note that the index closed above the top range of the PRZ
and continued higher immediately following the confirmation of the blowout of the bearish
pattern.
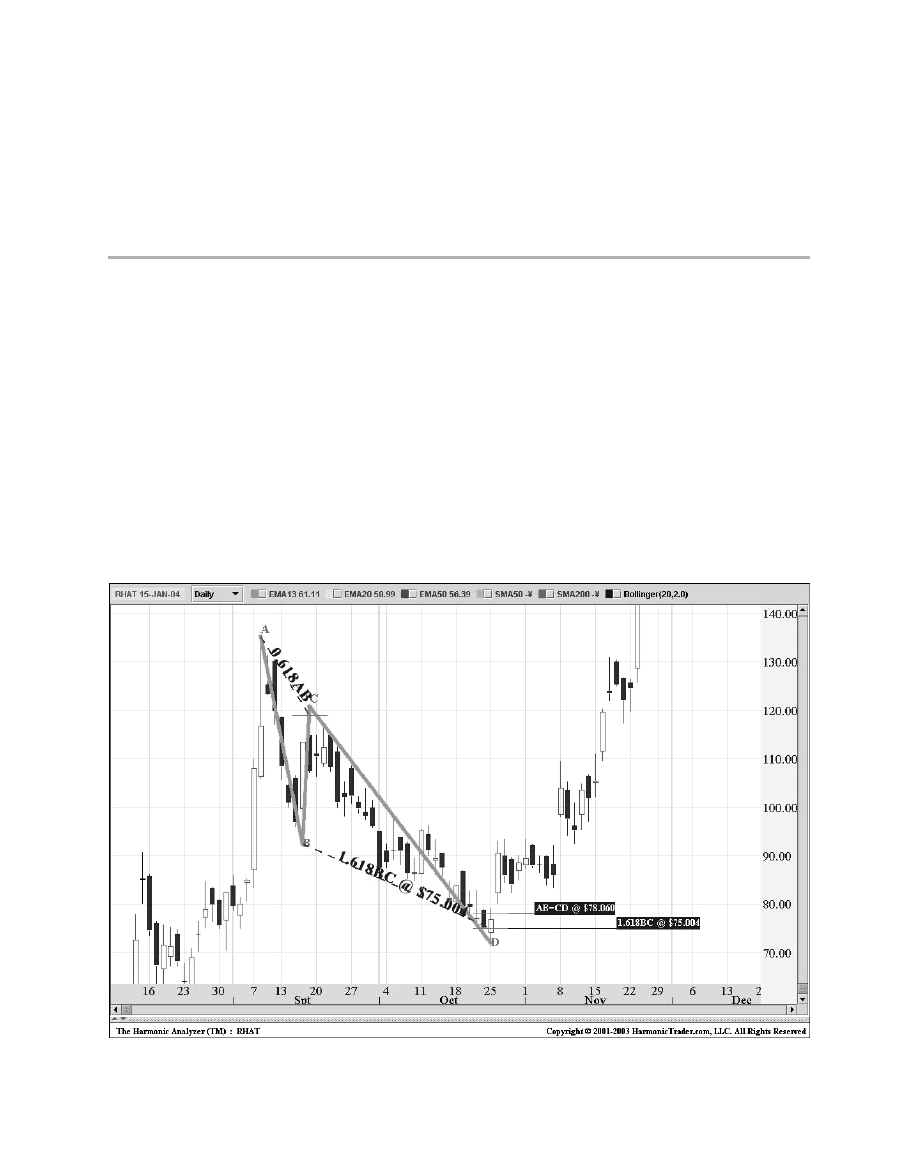
I want to review the trade that forced me to create this system because it was a real heartbreak-
er. It probably was one of the greatest moves that I’ve ever missed. The stock: Redhat—RHAT! I
remember thinking before I entered this trade that the symbol alone was a sign of a bad trade—
a dirty RHAT! I thought that it might be a loser, despite the overwhelming harmonics.
The trade involved a nice bullish AB=CD at a critical 0.618 retracement that defined the area
just under $75 as significant harmonic support (see Figure 11.1). Despite my apprehension for
the symbol, I placed my trade. I bought 1200 shares at 74 3/4. Within a day or two, the stock
rallied vigorously. The stock moved sideways for several days after the initial bounce.
203
Figure 11.1
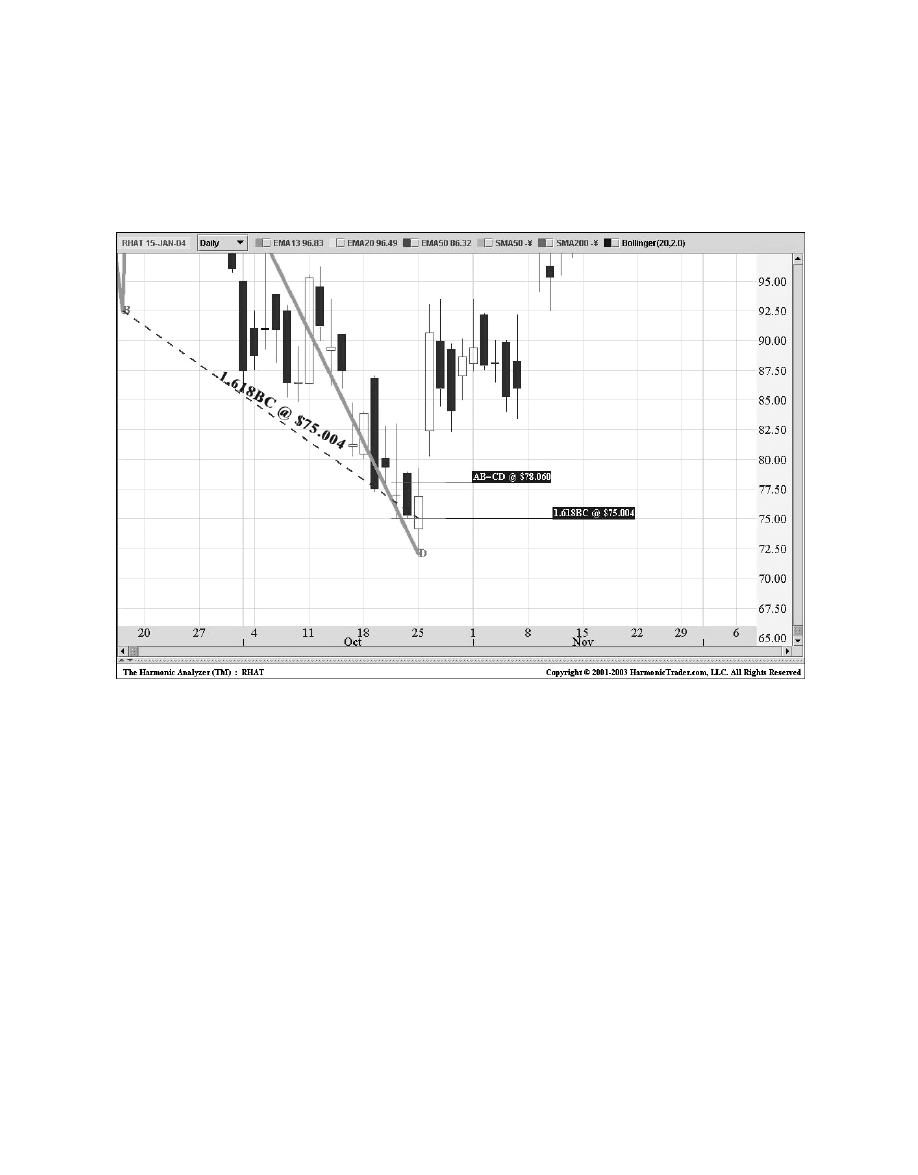
With the lack of follow-through, I immediately covered the position. I was up nearly 15 points
at the high and felt compelled to take my profits and run. I was very happy with this trade. I felt
that this move would not continue much higher—was I ever wrong! The chart in Figure 11.2 of
price action in the Potential Reversal Zone (PRZ) clearly shows the ideal reversal after testing
all of the numbers in the harmonic support zone.
204
Harmonic Trading: Volume One
Figure 11.2
Despite stalling for nearly two weeks after the initial reversal, RHAT eventually rallied
considerably higher, more than doubling in the following month. Yes, say it with me: “An easy
hundred thousand left on the table!” You can see why I felt compelled to develop a system that
would respond to market signals rather than emotional reactions.
Although I missed out on these profits, I was determined to learn from this experience. If I
was not going to directly profit from this trade, I made it a point to learn from yet another tuition
payment to the University of NASD! It was the only way I could overcome my anguish over
missing a “lottery trade.”
I learned several important factors from this trade that helped me distinguish the big moves
from the small reactions. I noticed specific traits in the price action that led me to explore and
experiment with different ideas that effectively gauged the strength of the reversal. Techniques
such as trend lines, Fibonacci targets, and trailing stops are effective tools that can improve
trading decisions. Furthermore, these strategies create a systematic approach to maximize
trading decisions in any market environment.

The experience with RHAT forced me to develop a trade management system that truly lets
the price action provide the signals to handle the position. Essentially, if you do not have rules
to determine the information that the market is providing, you are closing positions based
mostly on emotional decisions. Think about it—what was the last trade you closed out? Why?
Was it because you didn’t think the market would go completely your way? Were you burned by
a previous trade that compelled you to take the quick profit or cut the loss small? Quite simply
in the case of the RHAT trade, I failed to follow through, as I did not have any technical reasons
to close the position.
In the same sense that effective pattern recognition rules—the Harmonic Trading
techniques—are employed to identify potential opportunities, it is critical to have guidelines
that maximize the management of positions and gauge the price action after a setup has been
executed. The trade management rules address all possibilities in advance, enables you to
respond to any situation, and instills confidence in your execution skills.
The Harmonic Trade Management Terms
Review these terms to understand the concepts of this system.
Potential Reversal Zone (PRZ)
The Potential Reversal Zone (PRZ) is a specific area where harmonic patterns complete and
Fibonacci projections converge. Identification of a valid PRZ is dependent upon finding the
clearest pattern structures that possess several Fibonacci calculations converging at a
well-defined price level. Also, it is important to remember that a PRZ represents a significant
“potential” reversal area and a violation of that area indicates that the primary trend is strong.
Therefore, the validity of the setup still requires an accurate assessment of the pattern after the
entire zone has been tested.
Initial Profit Objective (IPO)
The Initial Profit Objective (IPO) represents the first area to consider taking profits for the
position. Typically, an original position can be parceled into multiple pieces, treating each
portion differently depending upon the reversal. The first part of the position—the IPO—is
defined by a predetermined Fibonacci level retracement, as measured by the limits (high and
low) of the pattern. Most frequently, it is either a 38.2% or 61.8% retracement from the extreme
points of the pattern. Also, the IPO can be a trend line violation after the initial target has been
exceeded. After a reversal has completed and a small profit has been attained, it is critical to
determine the area where the first profit will be secured. The decision to secure the initial profit
at the 38.2% or the 61.8% retracement of the pattern range depends upon the price action. If a
reversal exceeds the 38.2% level in strong “blowout” fashion by a price gap, extreme price
range, or tail close, the 61.8% level should be targeted as the IPO. At a minimum, it is prudent
to secure a partial profit at one of these levels.
Chapter 11
The Harmonic Trade Management System
205

206
Harmonic Trading: Volume One
The blowout of these levels is dependent upon a continuation of the trend. If price action
reverses from the PRZ and hits one of the IPO levels but fails to clearly continue in that
direction, it is important to cover a part or all of the position. A lack of continuation in the price
action is a sign of temporary exhaustion that must be respected. The IPO establishes the initial
exit strategy within the Harmonic Trade Management process.
Portioning the IPO
As I mentioned previously, it is customary to split the position into two or even three portions.
Such a strategy can secure a profit automatically (with a limit order), ensuring a winning trade
on part of the initial position, while creating a “comfort zone” for the other half of the position.
The other advantage to splitting the position into two parts is that the other half can “ride for
free” after securing an initial profit. Since anything can happen in the market, the other half
keeps the position live until the price action signals obvious evidence that it’s time to cover.
This is critical because it reduces the amount “left on the table.” Also, this strategy shifts your
trading behavior to respond to the market rather than your own emotions. Although the example
of Redhat is an extraordinary case, it underscores the importance of leaving a portion of the
original position in long enough to capitalize on the potential of a more significant reversal.
Reversals that move sideways after an initial reaction can frequently appear to not yield a
substantial move, only to really get moving after a delayed period of consolidation. In this
instance, the initial profit is secured by the first 1/2 of the position while maintaining the other
portion to permit more time to see if the reversal will continue in the direction of the initial
reaction. Regardless of the outcome, the second position lets the market determine the result
of the trade. If the price action resumes the reversal, the second position can capitalize on
the additional gains and employ greater price objectives for further profit management. If the
reversal fails, the trade can be exited with a small profit. This area is referred to as the Profit
Protection Zone (PPZ).
Profit Protection Zone (PPZ)
Although this is a bit more subjective in the management of a trade, the Profit Protection Zone
(PPZ) is a predetermined level beyond the execution point after a small profit has been
achieved. The PPZ is critical because it enforces one of the most important rules within the
Harmonic Trading approach:
“Never let a profit become a loss.”
It is important to note that not all setups yield the same reversal. Some setups will react for
a short period of time and then continue in the predominant trend. These setups can provide a
quick move and a small profit, as long as the make-or-break price level is defined. Sometimes,
price action can consolidate in the reversal zone and trigger the position to be covered, only
to have the reversal resume its move. Although these are frustrating situations, the PPZ will
prevent the common mistakes of staying in a position that eventually fails.

Stop Loss Zone (SLZ)
The Stop Loss Zone (SLZ) is the area beyond the Potential Reversal Zone that defines an
invalid setup. When price action exceeds a reversal zone, it indicates that the PRZ is not a valid
turning point, requiring that the position be covered and the loss to be taken.
The 0.382 Trailer
The 0.382 trailing stop is a technique that was initially discussed in
The Harmonic Trader and
developed after studying the Redhat trade closely. The trailing stop is typically employed after a
profit has been attained in a position. The 38.2% trailer represents the “make-or-break” limit for
the continuation of a reversal. This trailing stop is typically utilized after the Initial Profit
Objective (IPO) has been attained.
The 0.382 trailer is measured from the reversal point to the reversal extreme—high (bullish
setup) or low (bearish setup). The 0.382 is significant because the strongest price action will
only retrace to this level before continuing in the trend of the reversal. Although it is common for
the reversal trend to frequently retest this retracement, the critical technical consideration is a
violation beyond this area. Therefore, the position should be covered on a continuation past the
38.2% level.
Trend Lines
There are two types of trend lines that are utilized in trade management decisions. After the
initial reversal from a Potential Reversal Zone, it is common for price action to adhere to a
general trend line that can serve as a gauge of the potential continuation of the new move.
Trend lines can be effective in catching reversals that provide brief reactions but revert to the
predominant trend. Although brief reactions from well-defined patterns occur frequently, these
temporary moves can provide quick profitable trades, if they are handled properly.
The other trend line consideration involves the Initial Profit Objective (IPO), usually at the
38.2% or 61.8% pattern retracement. In most setups, the 0.382 IPO typically converges with
a trend line from the existing pattern. For example, a bullish pattern will possess a down
trend line from the high points (A and C) that can be drawn to define the predominant trend’s
resistance channel. In combination with the IPO, this area represents the “line in the sand.” If a
reversal can exceed the initial profit objective, the probability is favorable for a more significant
move than just a temporary reaction. Although this rule allows for some discretion, the initial
profit area is crucial in differentiating the big moves from the small reactions well in advance.
Angle of Ascent/Descent
The angle of ascent/descent refers to the degree of the trend line of the price action after it
has reversed from the completion of the pattern. Although the angle does not need to be
precisely measured, it is important to note that most valid reversals will frequently possess
steep trend lines with decisive continuation. In comparison, price action that moves sideways
at the completion of a pattern is typically an early sign of an impending failure.
Chapter 11
The Harmonic Trade Management System
207

Time Considerations
After the initial reversal from a PRZ, a certain amount of time is required to allow the price
action to assert itself and begin a new trend. Whether the pattern forms on a 5-minute,
60-minute, daily, or weekly chart, each reversal must be allotted a certain time period relative
to the size of the pattern to manifest signals of its validity.
As I discussed in the beginning of the book, each pattern must be regarded as a specific
technical entity that possesses precise numeric ranges, where all elements, such as execution
points, stop loss limits, and profit objectives, are defined relative to the structure. These
established price parameters apply to the time considerations, as well.
Although time considerations are not as significant as the factors of price, an understanding
of when a setup should complete can optimize trade management decisions and offer relevant
technical confirmation of a reversal’s potential.
There is a general “window of time” that should be considered after a reversal has
completed. The acceptable limits of pattern completions are comprised of two time
measurements—the equivalent time completion and alternate time calculations—that are
critical in the decision-making process of trade management.
The equivalent time projection is a general estimation of the completion of a symmetrical
pattern. Utilizing the X point as the initial starting point, the time duration is measured to the
pattern’s mid-point (B). This time duration is projected from the B point to determine the
approximate D point completion. Ideally, the most symmetrical patterns will complete at the
equivalent completion time. For example, if a pattern required ten days to form the X to B point,
the B to D point projected time completion should be ten days thereafter. In a similar fashion as
a perfect AB=CD pattern, the time symmetry should be equivalent.
The alternate time calculation is calculated with the range of Harmonic Trading ratios,
starting with 0.382 and extending to 1.618. In many patterns, the CD leg frequently does not
complete before the equivalent projected time date. Although the symmetry may be less than
ideal in these situations, a proper alignment of Fibonacci ratios is still the critical requirement to
validate any potential pattern setup.
At a minimum, a pattern should not complete until it has reached the 0.382 time projection.
For example, if the time distance to the mid-point of a pattern (from X to B) is ten days, the
pattern should not complete until the distance from B the projected completion has traded for
3.82 or approximately four days. Although this is a rule that should be applied generally with
some room for interpretation, this minimum 38.2% projected time requirement serves as a filter
for potentially invalid patterns. Essentially, if a pattern possesses a sharp CD leg that completes
in a relatively short period of time as compared to the rest of the price structure, a red flag
should go up and the validity of the setup must be considered suspect.
Although there are many other time considerations that should be assessed in the trade
management process, I believe this basic understanding of a projected “time window” promotes
the proper anticipation of price action and establishes the model of “what should be happening”
in a valid reversal. Basically, the projected time window defines the accepted duration of the
reversal, creating a “do or die” perspective.
208
Harmonic Trading: Volume One
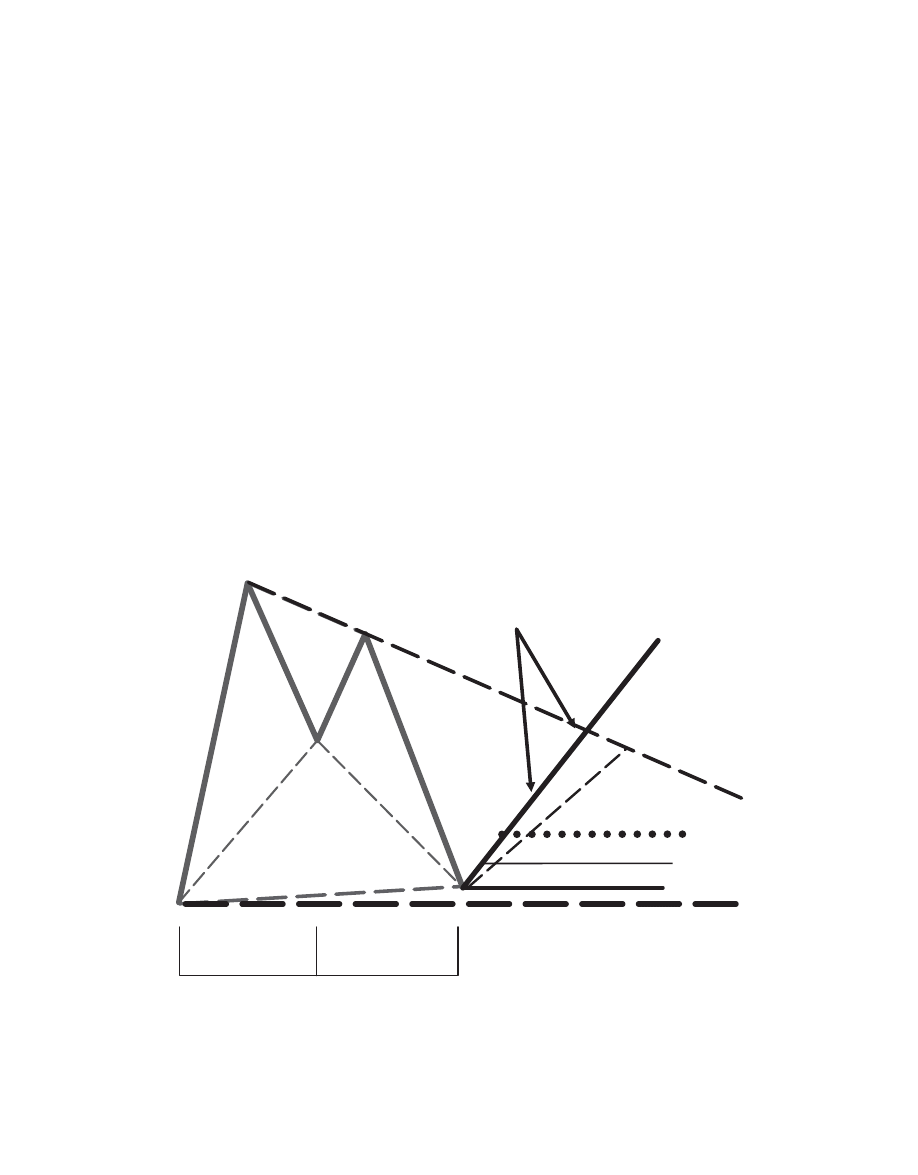
The equivalent time projection helps to define the PPZ. The decision to protect a small profit
versus allowing more time for a trade to reverse is dependent upon the equivalent time comple-
tion of the pattern. Within this “time window,” the price action either reverses within the time
allotted or the reversal at hand must become suspect. In these circumstances, small profits
must be defended. Although this may be mentally frustrating, small profits are better than sitting
on your hands and allowing a loss.
The concept of the PPZ evolved from many personal experiences with patterns that
provided an initial reaction, only to continue in the predominant trend. As I have said throughout
this material, most distinct patterns will provide some type of reaction at a minimum.
The ability to profit from these situations depends upon an honest assessment of the price
action within the PPZ. Although such defensive tactics can result in a covered position that
eventually reverses in the anticipated direction, in the long run this strategy is one of the most
effective tools within the Harmonic Trade Management System.
It will take some time to grasp the intricacies of these trade management techniques.
However, the system defines all possible parameters of the trade relative to the pattern and
the price action in the PRZ. It is essential to establish entry points, profit targets, and stop loss
limits well in advance to facilitate the decision-making process.
Bullish Harmonic Trade Management Model
Chapter 11
The Harmonic Trade Management System
209
X
B
0.886
C
0.618
2.0
0.50
A
D
0.382 TRAILER
INITIAL PROFIT OBJECTIVE
(I.P.O.): 0.382 OR 0.618 OF
PATTERN HIGH (A) TO LOW (D)
0.618
0.382
POTENTIAL REVERSAL ZONE
(P.R.Z.)
PROFIT PROTECTION ZONE
(P.P.Z.)
STOP LOSS ZONE
(S.L.Z.)
TIME
TIME
REVERSAL
REVERSAL
TRENDLIN
TRENDLIN
E
REVERSAL TRENDLINE
Figure 11.3
(Copyright HarmonicTrader.com, LLC, 2010)
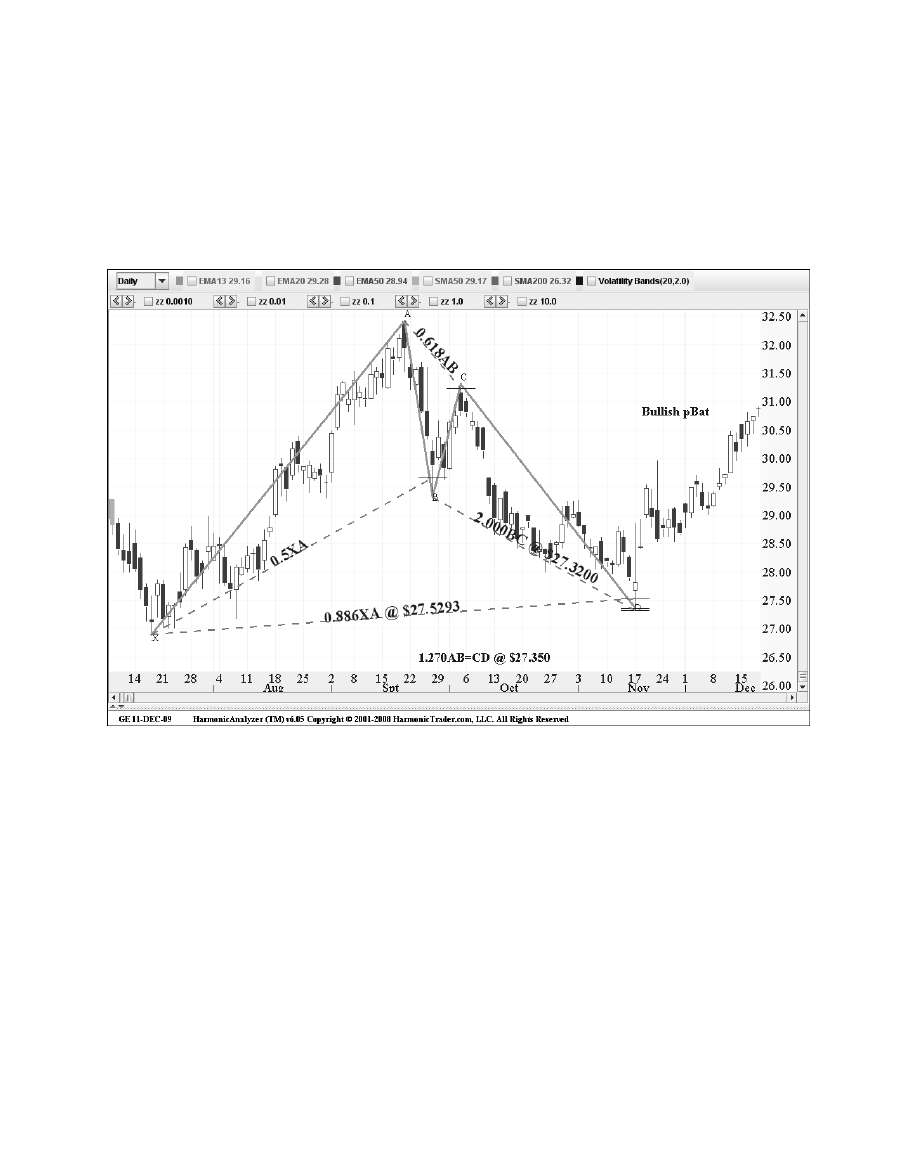
General Electric
(GE): Daily
The chart in Figure 11.4 was sent with the original trade recommendation to all
HarmonicTrader.com members on October 17, 2003 via the Email Advisory section of the
website. As the chart illustrates, GE was forming a distinct Bullish Bat on the daily chart.
210
Harmonic Trading: Volume One
Figure 11.4
In the email, I wrote:
“General Electric (GE) is approximately 1 point from the Potential
Reversal Zone (PRZ) of a Bullish Bat with three numbers between 27.50-
28. I would look to buy the stock in this PRZ below $28. The stop loss
should be placed at 25.50, risking approximately 2 points in the trade.
This is a short-term trade with an initial profit objective of 32.80.”
(To review the actual recommendation, please go to
http://www.HarmonicTrader.com/members/harmonic/email/
gebatbull.htm.)
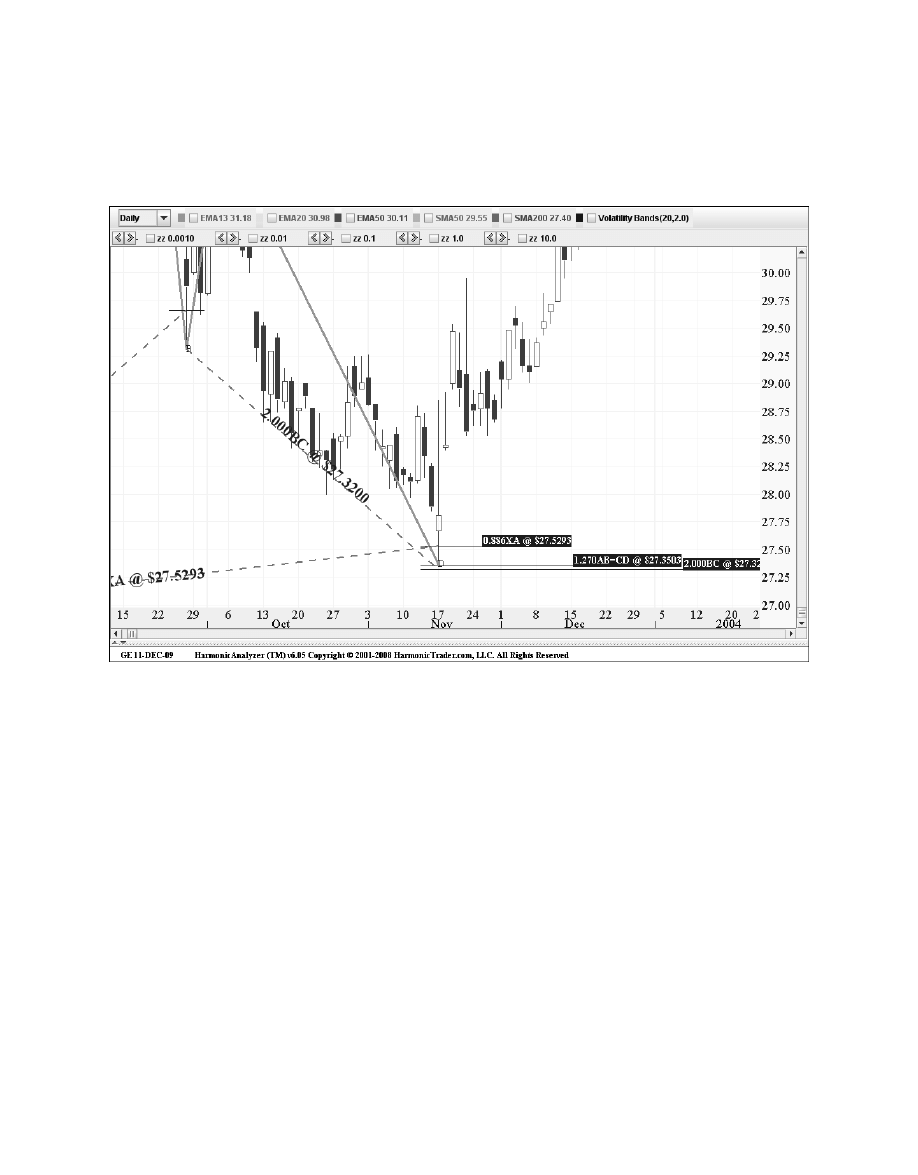
The defining level was clearly the convergence of the 0.886 XA retracement at 27.50
and the 1.618 BC projection at 27.65 (see Figure 11.5). Although the Alternate 1.27 AB=CD
completed at 28.05, the other numbers pointed to the area under $28.
Chapter 11
The Harmonic Trade Management System
211
Figure 11.5
Although certain numbers within a PRZ may possess greater significance than others, the
entire range of numbers must be considered more than a single price point. After testing the
entire PRZ, the optimal execution area for the trade will depend upon the nature of the price
action at the pattern’s completion point.
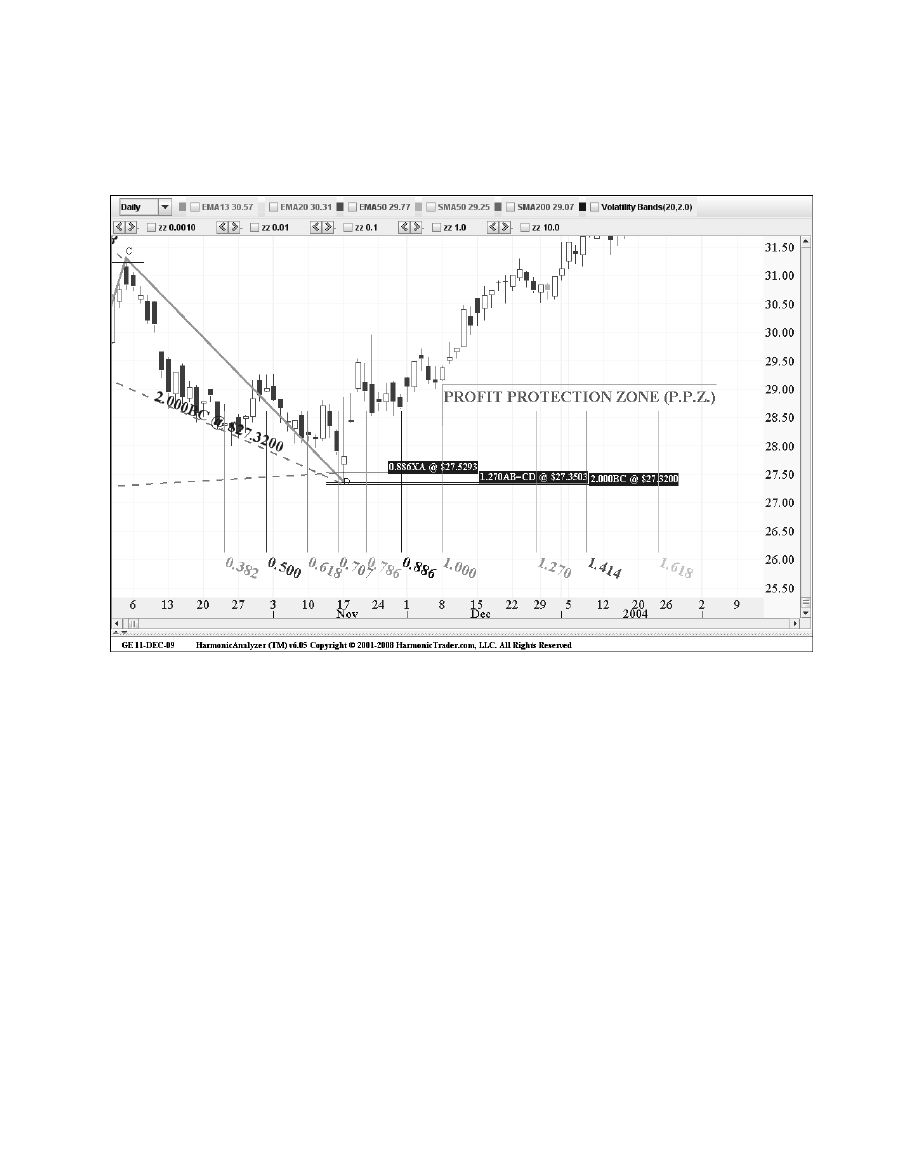
212
Harmonic Trading: Volume One
The chart in Figure 11.6 of price action in the PRZ shows an ideal reversal after a complete
test of this range. On November 18, the trade was executed at the 0.886 retracement at 27.50.
GE reversed on this day after slightly exceeding the bottom of the PRZ.
Figure 11.6
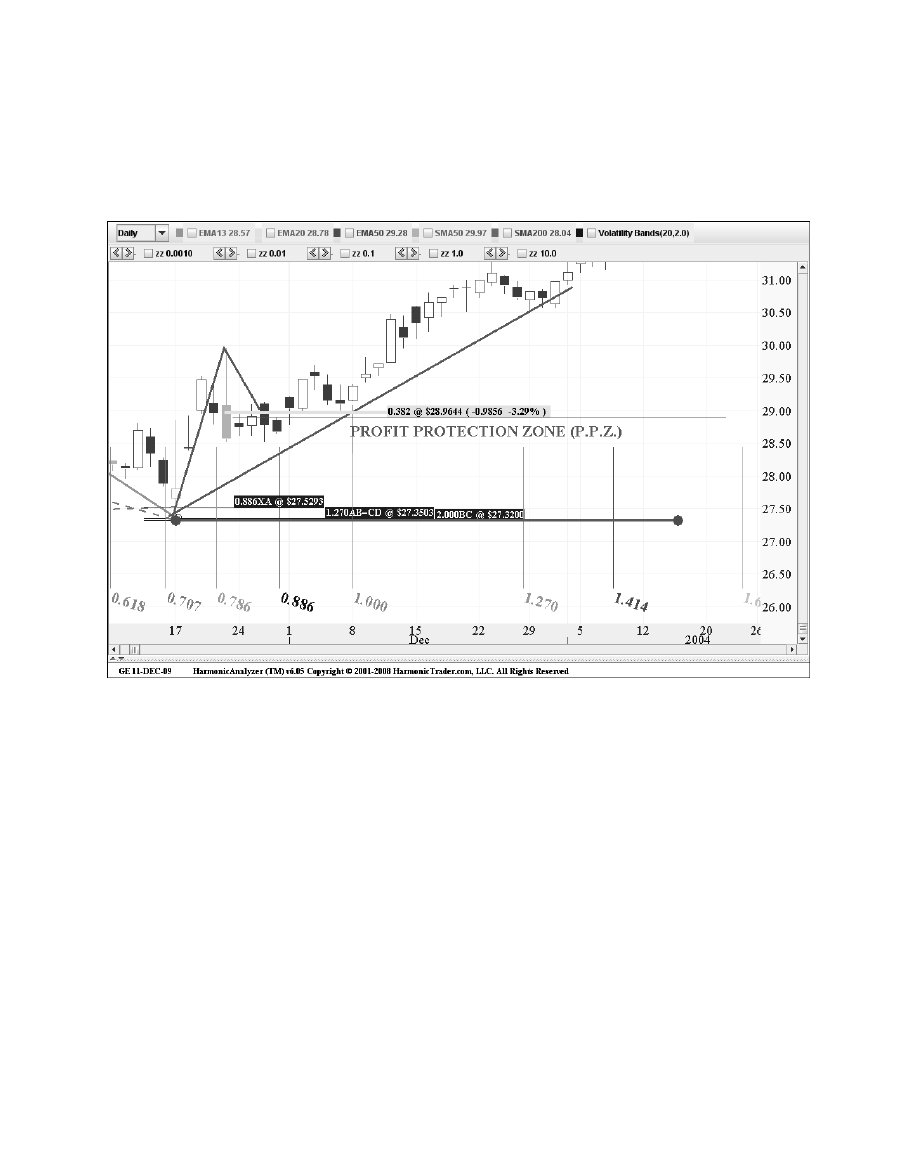
Chapter 11
The Harmonic Trade Management System
213
The spread of Fibonacci numbers at the bottom of the chart represents the basic mid-point
time projection completions for the pattern. Although the CD leg completed after the minimum
0.382 time projection, the equivalent (1.0) calculation was not reached until a few weeks after
the reversal was complete (see Figure 11.7).
Figure 11.7
Although GE rallied the day following the reversal, as the stock gapped up and continued
higher, the more substantial breakout move did not occur until after the equivalent time
projection (1.0) was reached.
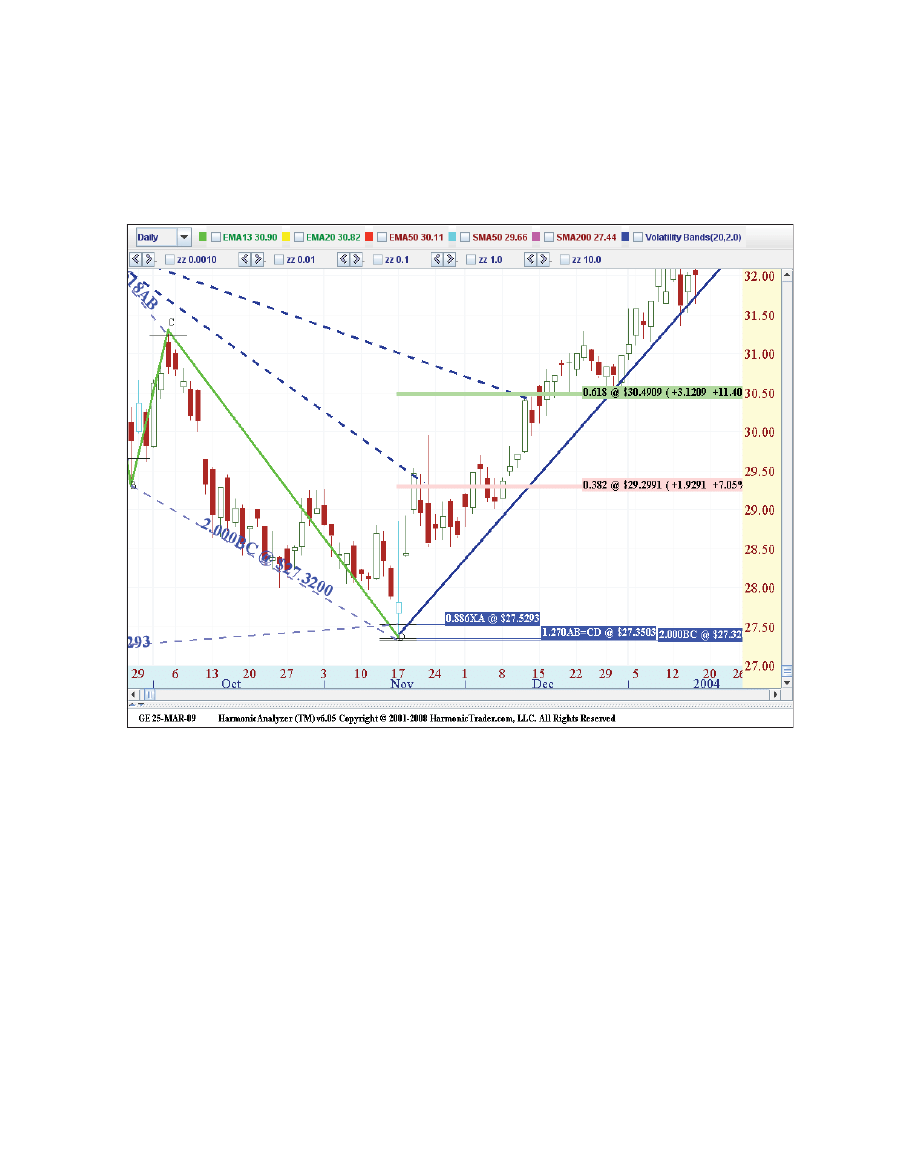
Figure 11.8
After hitting the equivalent time projection completion, the stock started to break out and
rally toward the 0.382 Initial Profit Objective (IPO) at 29.50. The downtrend line from the peak
of the pattern converged with the IPO, confirming the importance of this resistance.
214
Harmonic Trading: Volume One
Figure 11.8 is a classic example of importance of time when assessing the Profit Protection
Zone (PPZ). Up until the equivalent time projection completion, any small profit should have
been defended. Essentially, GE needed to get going beyond the equivalent time projection
completion, if this Bullish Bat was going to yield a significant reversal.

The first upside target in the $29.50 area was taken out, while maintaining a steady uptrend
from the low. The next target at the 0.618 was quickly reached, as GE rallied impressively and
with a strong bullish continuation. On November 24th, the stop loss was moved from (27.50)
to 28.50, securing 1 point. On December 18th, the stop loss was moved from 28.50 to 30,
securing 3 points, establishing a wider PPZ (see Figure 11.8). Beyond this point, the position
should be held, as long as the uptrend and the 0.382 trailing stop remain intact. The real
work in a valid pattern like this Bullish Bat is monitoring the price action in the PRZ and the
corresponding reaction after the reversal has completed.
In this case for GE, the price and time limits were clearly defined in advance. The setup
possessed a distinct bullish pattern to buy the stock in the 27.50–28 level. The stock reversed
ideally after the entire range of numbers was tested. Beyond the execution, the trade manage-
ment was quite simple. The Harmonic Trade Management system effectively handled the setup
by allowing the reversal to ride while utilizing a well-defined uptrend line and a 0.382 trailing
stop as the exit strategy.
Although the 0.382 and 0.618 profit targets were exceeded convincingly, it is still important
to monitor the price levels as measured from the pattern’s high point to reversal low to establish
new price objectives, especially as the reversal moves further. Beyond the 0.618, the price
measurements of the 0.786, 0.886, 1.0, 1.27, and so on should be considered as well. The
spread of Harmonic Trading ratios is illustrated in Figure 11.8.
Chapter 11
The Harmonic Trade Management System
215
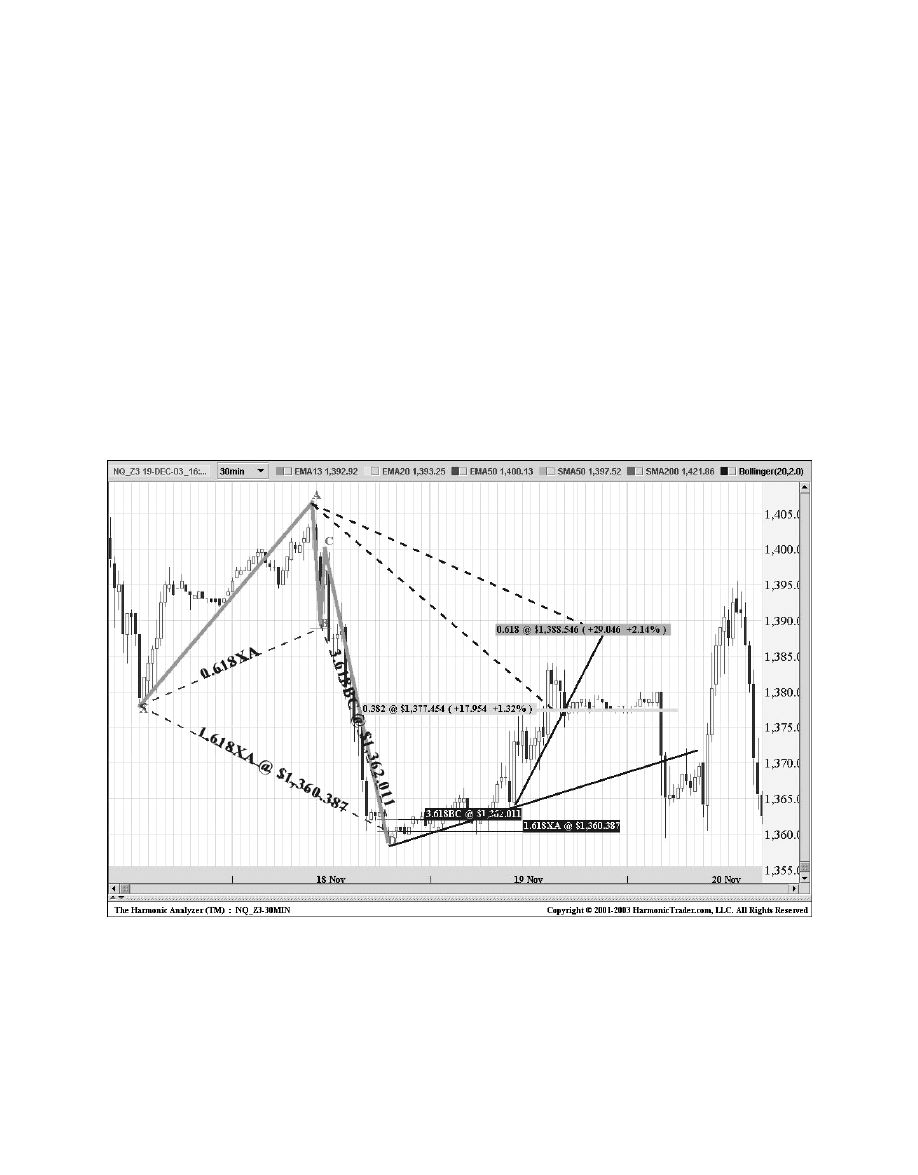
NASDAQ 100 December 2003 Mini-Contract
(NQ_Z3): 30-Minute
The NASDAQ December 2003 Mini-contract formed the Bullish Crab in Figure 11.9 on a
30-minute chart. I outlined this harmonic support in my pre-market Mini-Room post on
HarmonicTrader.com November 19, 2003. I discussed the importance of the 1360 area for
the NQ stating. In the email, I stated,
“For today’s immediate action, the NQ is up 6 1/2. I expect the NQ to try
to refill today’s upside gap.…I would look to buy the NQ after a reversal
from this retest in the 1360 area for a move back to 1375.”
(To review the actual recommendation, please go to
http://www.HarmonicTrader.com/members/harmonic/home/
miniroom111903.htm.)
216
Harmonic Trading: Volume One
Figure 11.9
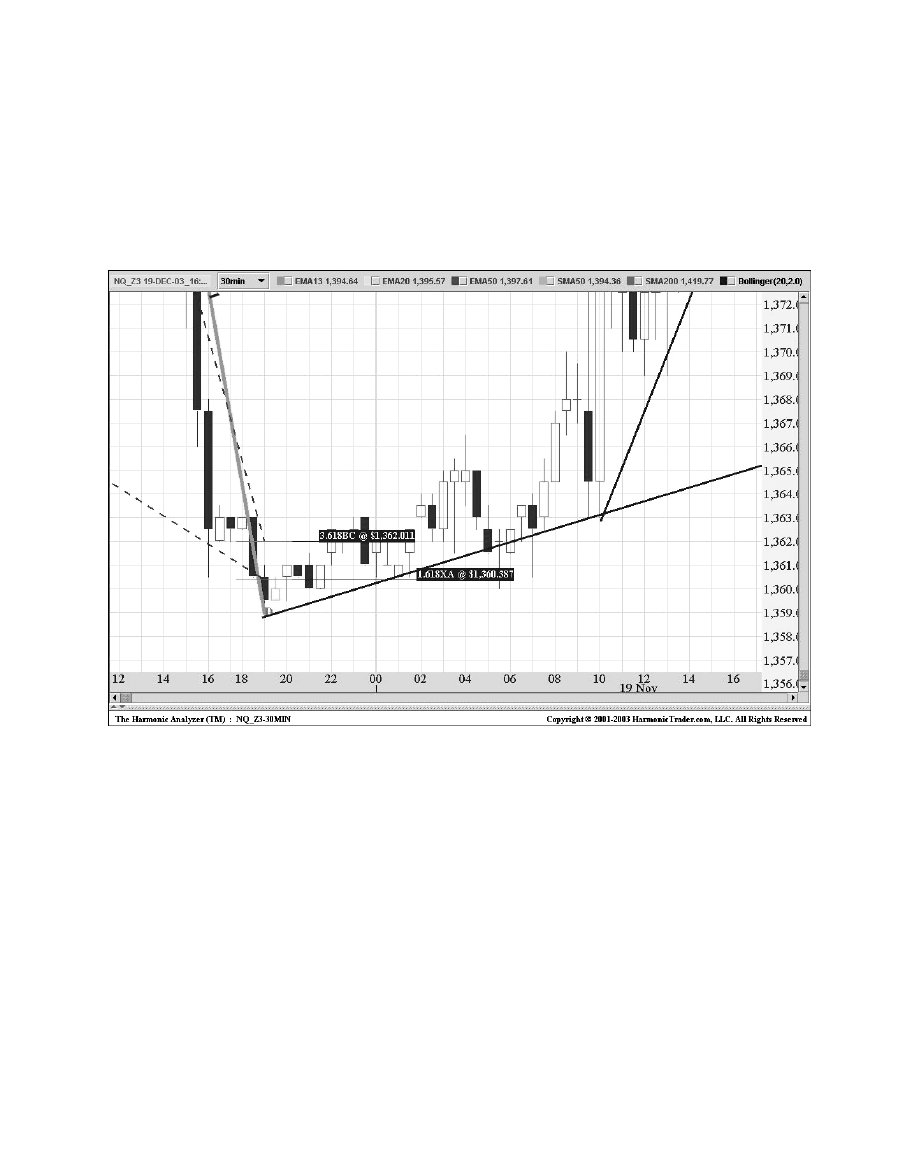
The setup possessed a convergence of numbers that defined the 1360 area as critical
short-term support. The most significant number at pattern’s completion point was the 1.618 XA
projection at 1360.40. The 3.618 BC projection at 1362 complemented this harmonic support.
The chart in Figure 11.10 of the price action in the PRZ shows an ideal reversal after a
complete test of this harmonic support range. Although the NQ declined sharply into this PRZ,
it clearly stabilized and reversed almost exactly from the lower range of the harmonic support.
Chapter 11
The Harmonic Trade Management System
217
Figure 11.10
The interesting aspect of this reversal was the time consideration at the pattern’s
completion. The chart in Figure 11.10 shows the spread of Fibonacci time calculations, as
measured from the mid-point (B) and projected to the completion of the pattern.
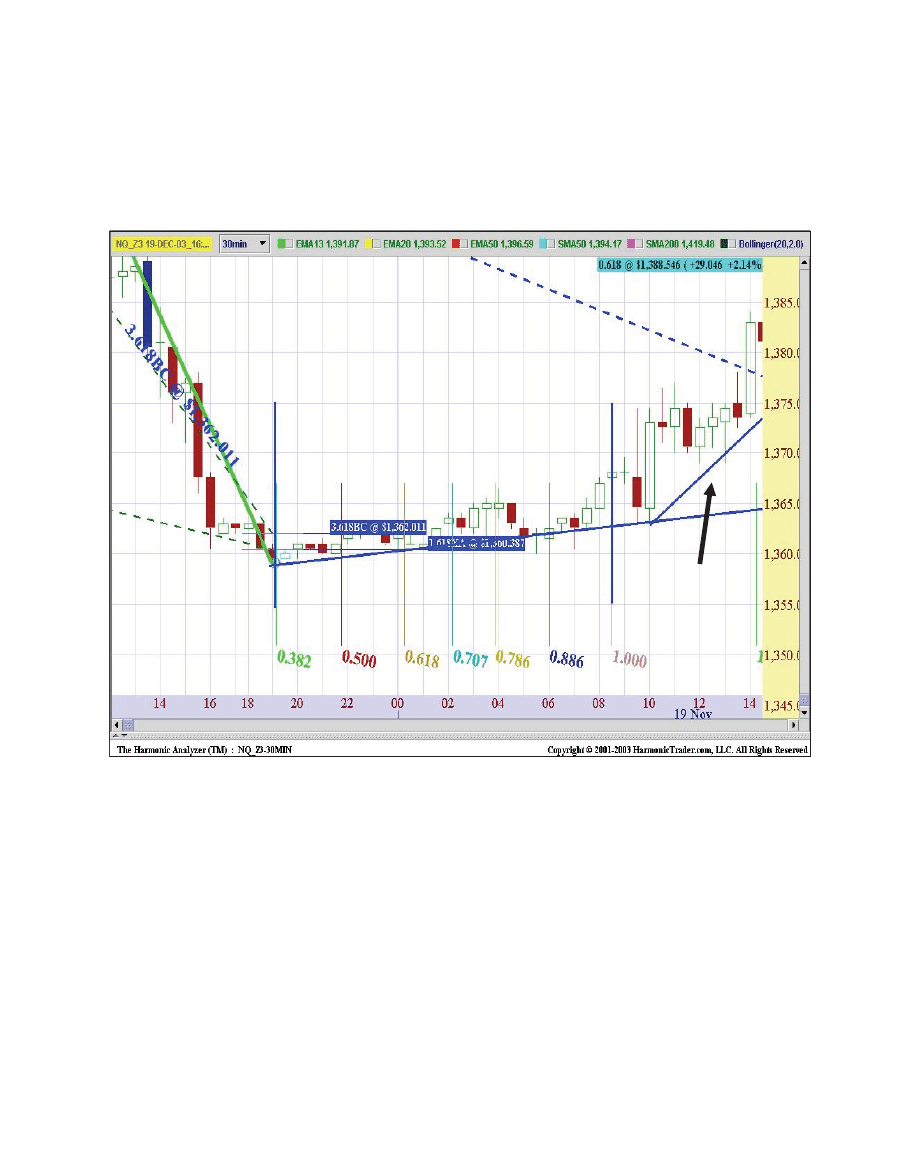
Initially, the CD leg of the Crab pattern completed at the minimum 0.382 time projection.
Although this marked the low in the reversal, the price action required more time to stabilize,
consolidate, and rally from the PRZ. It was not until the equivalent (1.0) time projection was
reached that the reversal started to rally dramatically (see Figure 11.11).
218
Harmonic Trading: Volume One
Profit
Protection
Zone (P.P.Z.)
Figure 11.11
The first upside target for the trade was the 1377 area at the 0.382 IPO as measured from
the pattern. The NQ exceeded this target, maintaining a steady uptrend throughout the day.
Despite the impressive rally through the 0.382 IPO, the NQ stalled, as it failed to test the next
target at the 0.618 and violated the intra-day uptrend line (see Figure 11.12).
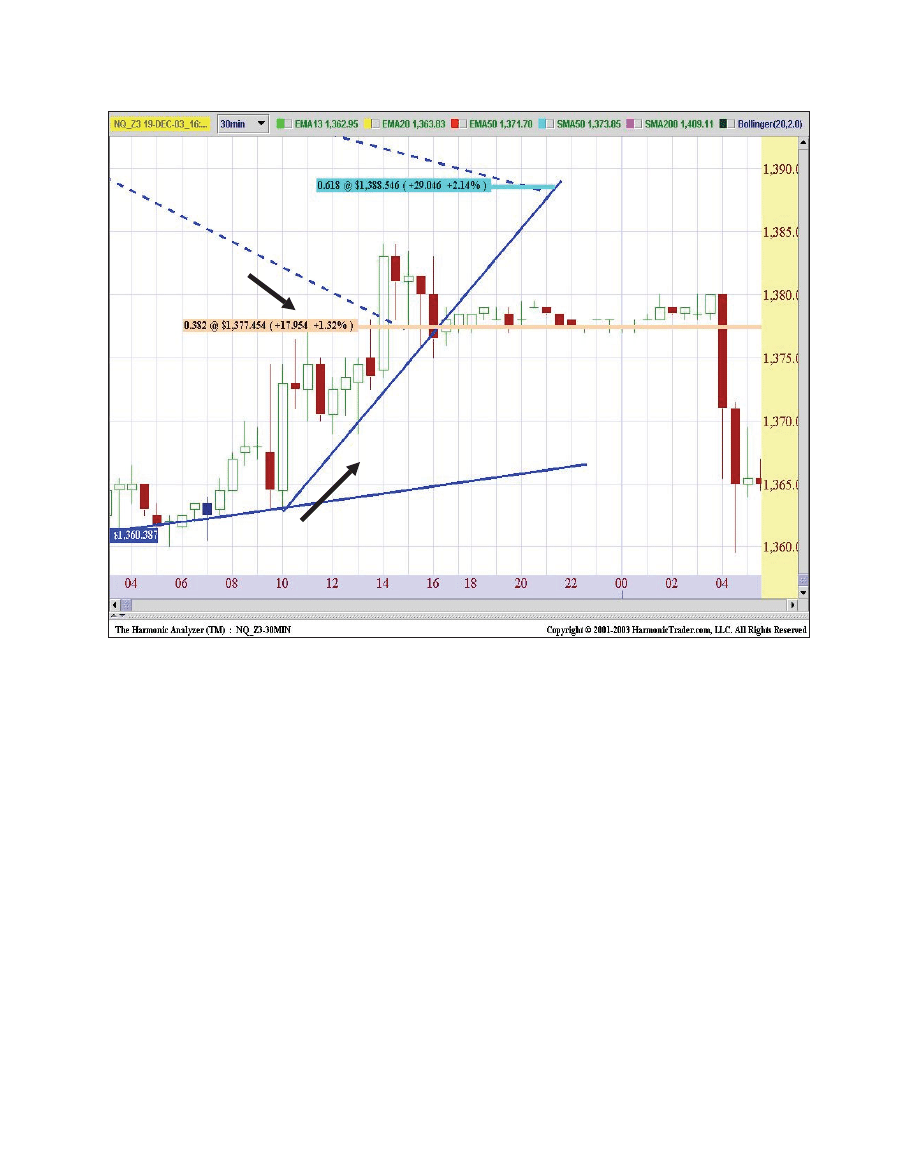
Chapter 11
The Harmonic Trade Management System
219
Initial
Protection
Objective
(I.P.O.)
Initial
Protection
Objective
(I.P.O.)
Profit
Protection
Zone (P.P.Z.)
Profit
Protection
Zone (P.P.Z.)
Figure 11.12
Such a lack of continuation and violation of a distinct trend line are clear signs of a stalling
reversal. In this case, especially in a day trade, the long position should be covered.
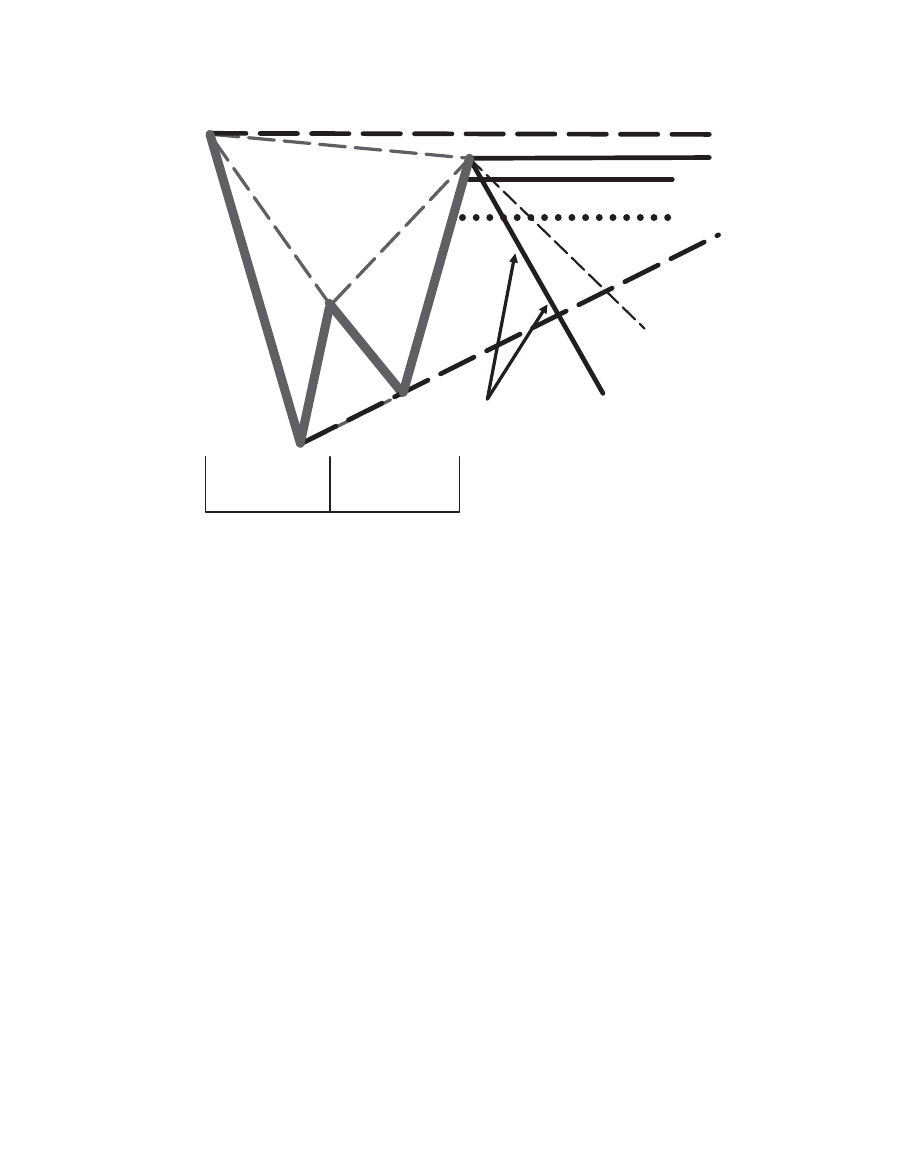
220
Harmonic Trading: Volume One
(P.P.Z.)
X
C
B
0.886
0.50
0.618
2.0
A
D
INITIAL PROFIT OBJECTIVE
(I.P.O.): 0.382 OR 0.618 OF
PATTERN LOW (A) TO HIGH (D)
STOP LOSS ZONE (S.L.Z.)
0.618
0.382
POTENTIAL REVERSAL ZONE
(P.R.Z.)
TIME
TIME
PROFIT PROTECTION ZONE
0.382
TRAILER
REVERSAL
TRENDLINE
PROFIT PROTECTION ZONE
0.382 TRAILER
REVERSAL TRENDLINE
Bearish Harmonic Trade Management Model
Figure 11.13
Copyright HarmonicTrader.com, LLC, 2010
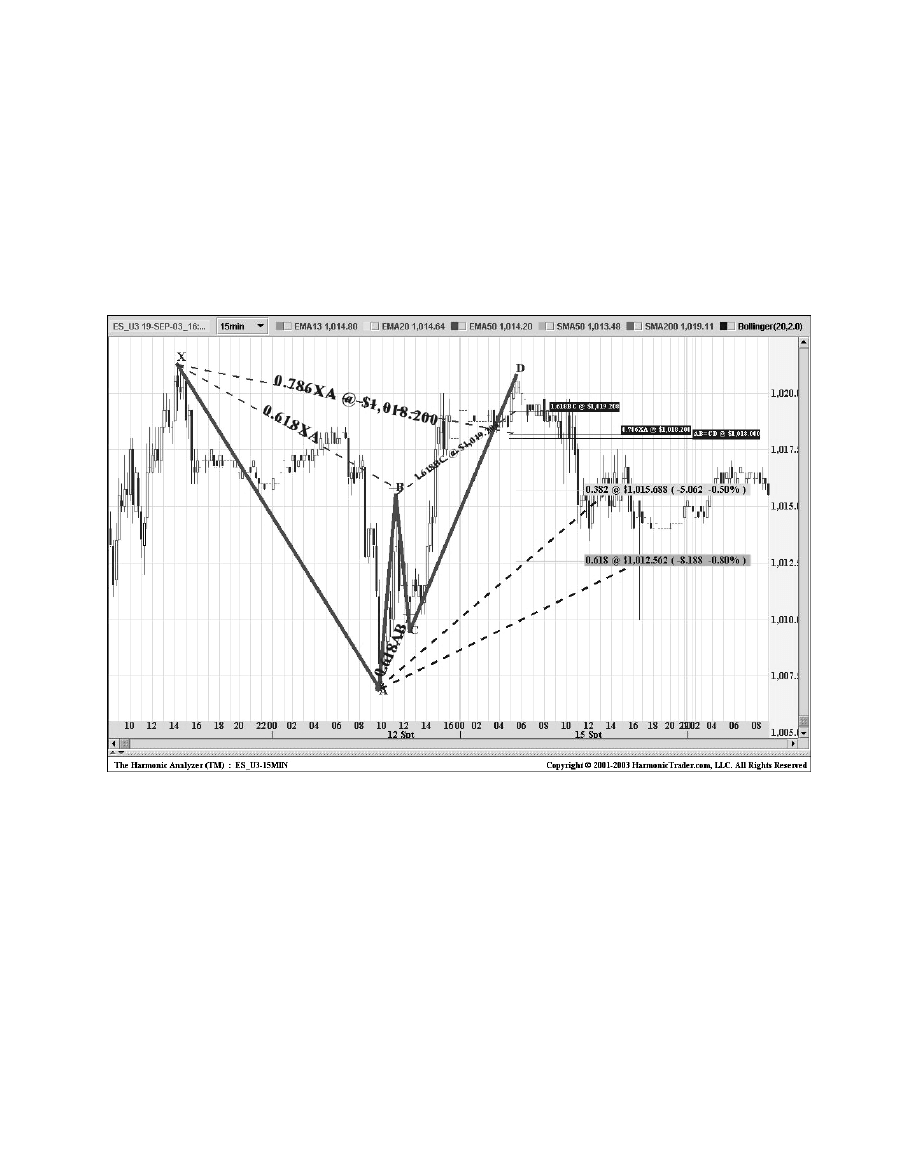
Standard and Poor’s 500 September 2003
Mini-Contract
(ES_U3): 15-Minute
The Standard and Poor’s 500 September 2003 Mini-contract formed this Bearish Gartley on the
15-minute chart shown in Figure 11.14. The setup possessed a convergence of three numbers
between 1018 and 1019.25 that defined critical short-term resistance.
Chapter 11
The Harmonic Trade Management System
221
Figure 11.14
The contract reversed after testing all of the numbers in the PRZ, including the most
significant number of the pattern, the AB=CD completion point at the 1018 level. The 0.786 XA
retracement and the 1.618 BC projection just under the 1020 level complemented this
harmonic resistance nicely.
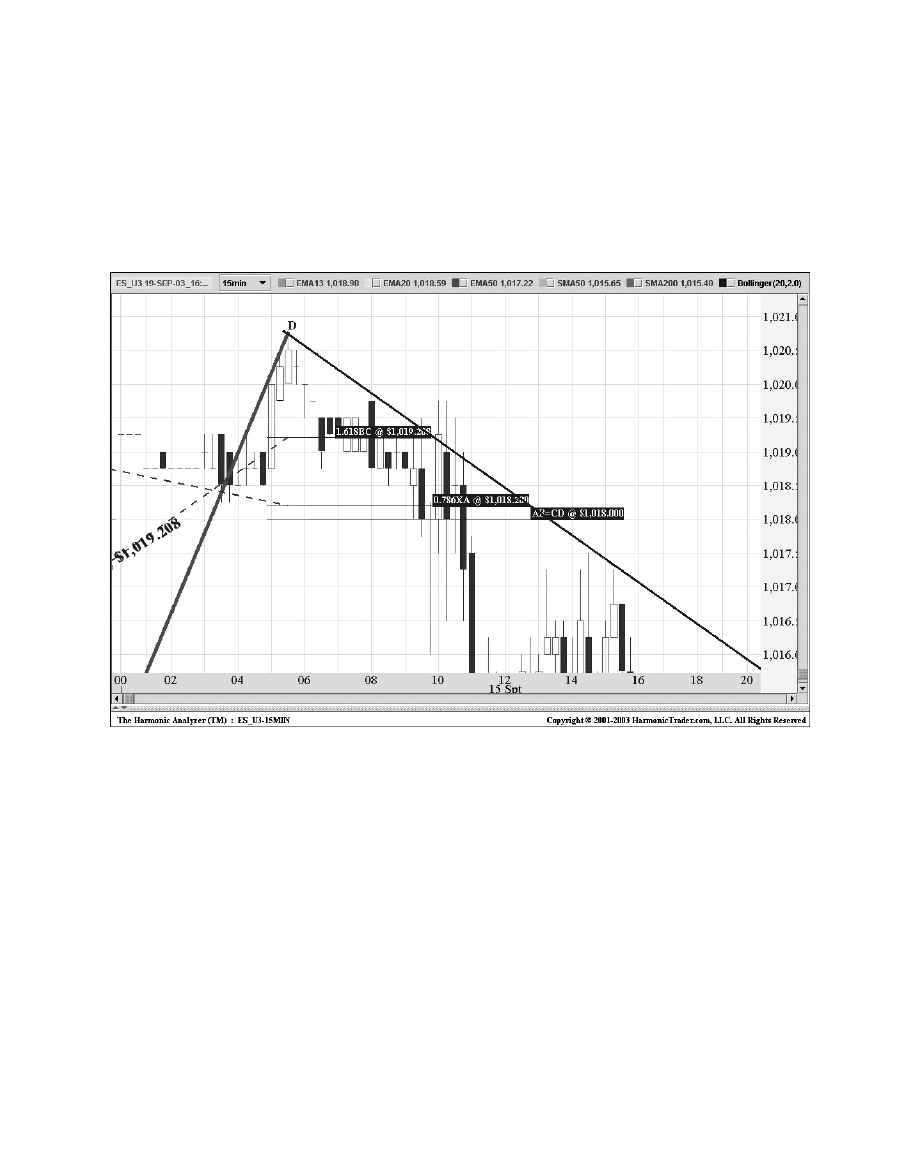
I outlined this harmonic support in my pre-market Mini-Room Advisory post on
HarmonicTrader.com on September 15, 2003.
“I would look for an early short position in this 1018 area.”
(To review the actual recommendation, please go to
http://www.HarmonicTrader.com/members/harmonic/home/
miniroom091503.htm.)
222
Harmonic Trading: Volume One
Figure 11.15
The chart in Figure 11.15 of price action in the PRZ shows an ideal reversal after a
complete test the harmonic resistance. The ES stalled briefly following the initial test and
declined sharply soon after violating the lower range of the PRZ.
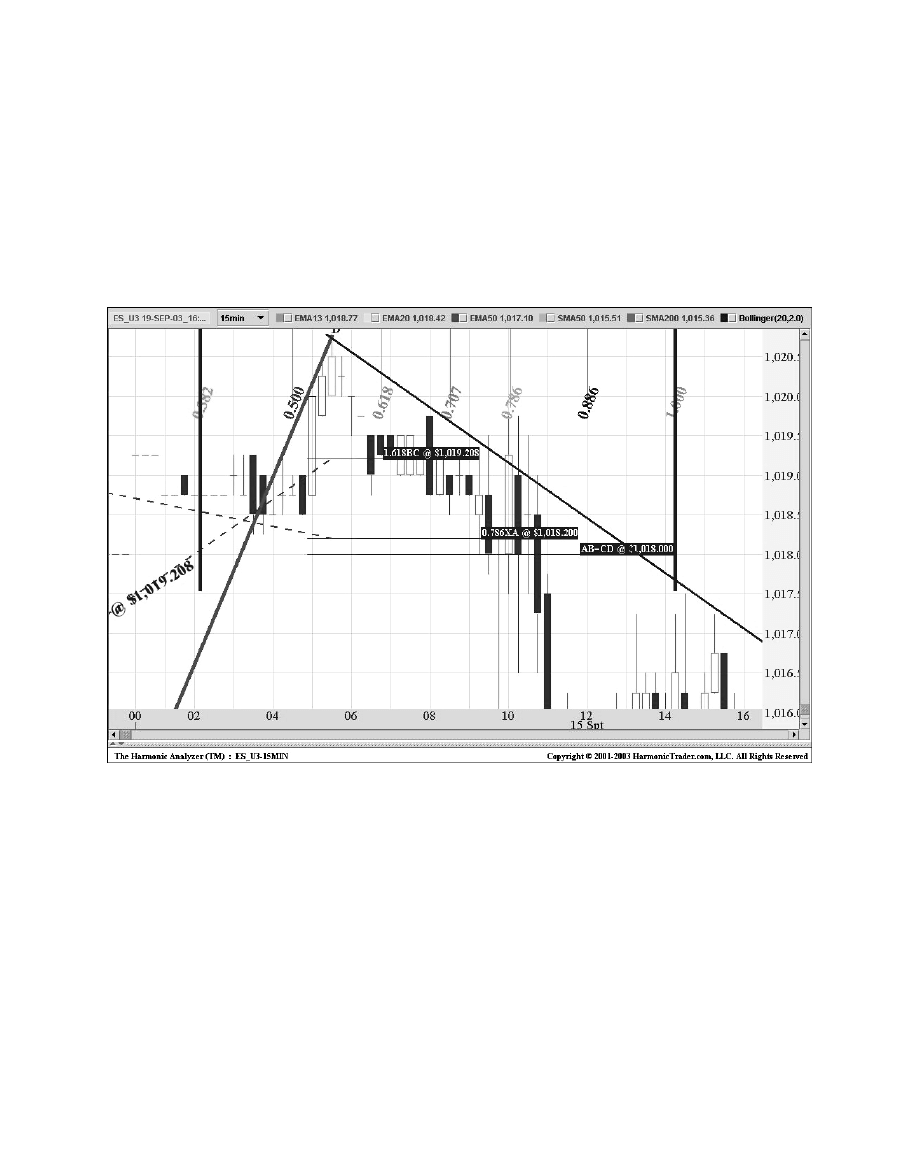
The interesting aspect of this reversal was the time consideration at the pattern’s
completion. The chart in Figure 11.16 shows the spread of Fibonacci time calculations, as
measured from the mid-point (B) and projected to the completion of the pattern. Initially, the
CD leg of the Gartley pattern completed at the minimum 0.382 time projection. Although the
initial test occurred at this minimum time constraint, the price action required more time to
consolidate before the ultimate reversal. Although the ES already reversed sharply by the time
the equivalent (1.0) time calculation was reached, the 0.382 time objective was an effective
minimum time filter to validate the pattern’s completion.
Chapter 11
The Harmonic Trade Management System
223
Figure 11.16
It is important to remember that the time requirement for a pattern’s completion is not as
important as the price objective. The key is to execute in the PRZ, as long as the minimum
0.382 time objective has been reached.
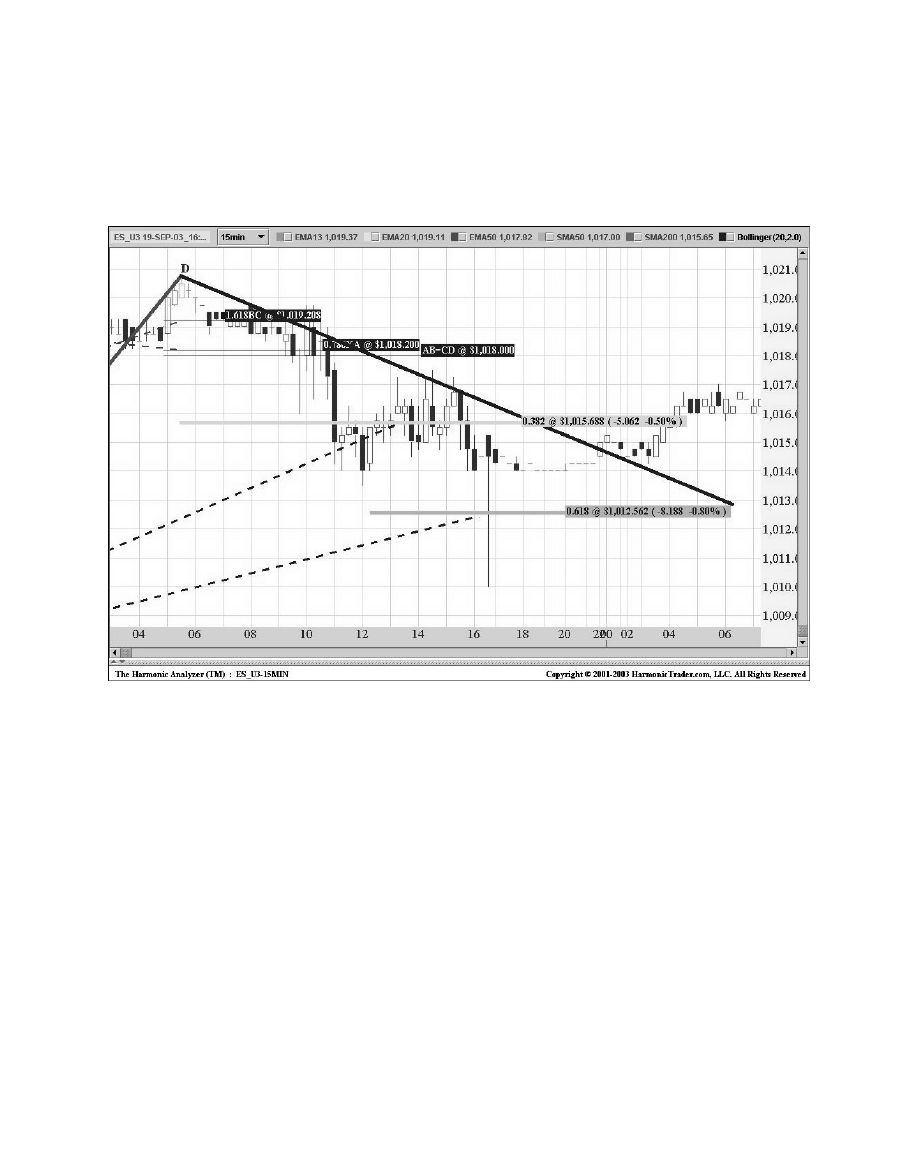
As the ES reversed, the IPO for this trade was set at the 0.382 retracement at 1015.68, as
measured from the pattern. The ES exceeded this target, maintaining a steady downtrend
throughout the day. Despite the impressive decline through the 38.2% IPO early in the session,
the ES stalled for the rest of the day until the after-market (see Figure 11.17).
224
Harmonic Trading: Volume One
Figure 11.17
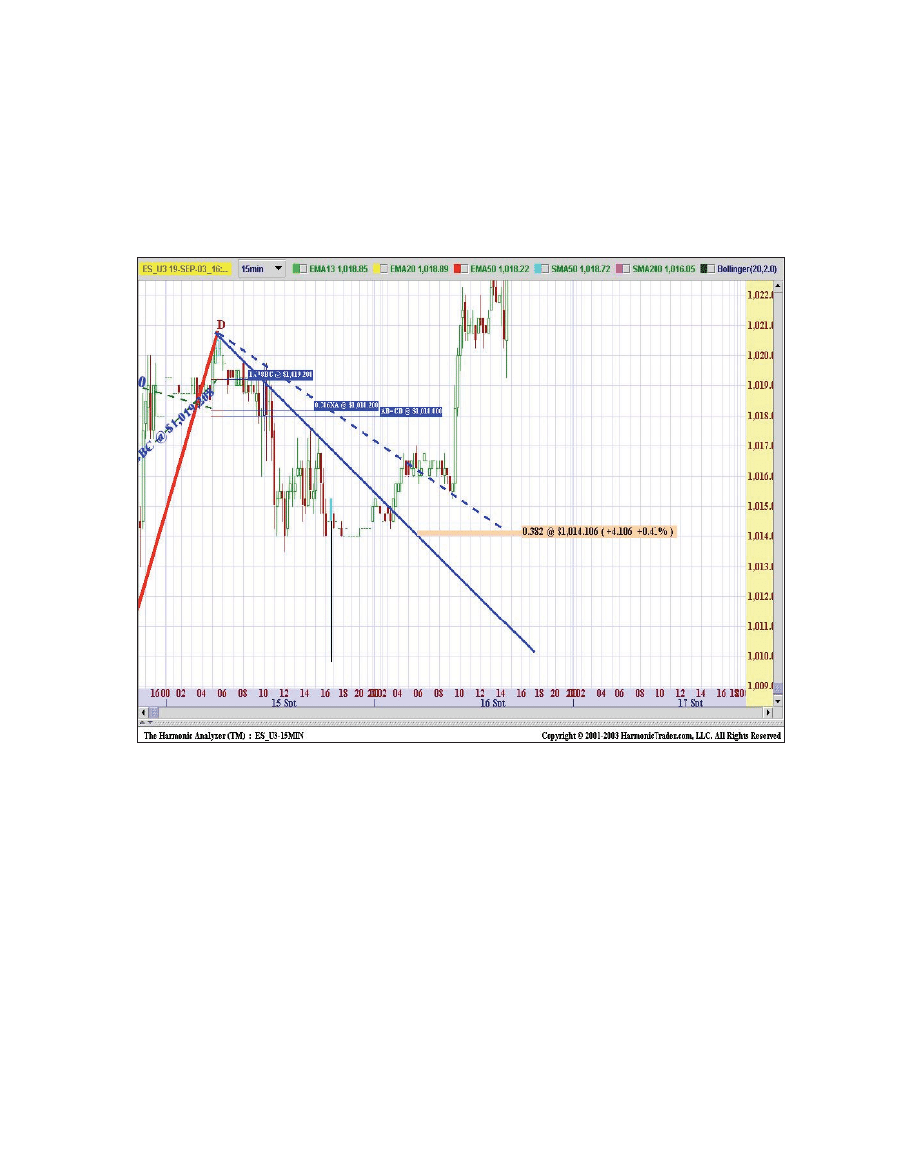
In this situation, the trade could have been covered after the 0.382 IPO was tested.
Although the ES sank nominally lower later in the day, the lack of downside continuation in
these situations should signal a warning that the reversal may not trade much past the IPO.
The ES possessed a nice downtrend after the reversal was complete. The price action dropped
sharply at the open and continued lower to the 0.382 IPO until midday (see Figure 11.18). The
trend line and the 0.382 trailer were not broken until the overnight session the following day.
Chapter 11
The Harmonic Trade Management System
225
Figure 11.18
Although the sharp sell-off toward the end of the day traded down to the 0.618 profit target,
the stalling action at the 0.382 I.P.O. triggered the short position to be covered in the1015 area.
The violation of the trend line and the 38.2% retracement were distinct indications that this
Bearish Gartley was likely to yield only a small profit. Despite the lackluster reversal, this trade
in the ES exemplifies the entire Harmonic Trading process. A clear pattern was defined, the
trade was executed in the PRZ, and the Harmonic Trade Management rules effectively guided
the decision to cover the short position at a profit.
Furthermore, it is important to understand that harmonic patterns are not “end-all-be-all”
price structures. I believe a common misconception is that harmonic patterns signal monster
reversal every time. This is just not the case. In fact, this example of the ES is probably more
common for most harmonic setups than the “home-run scenario.” Especially with intra-day
patterns, it is important to aggressively take partial profits at the IPO targets and apply the
trade management rules strictly.
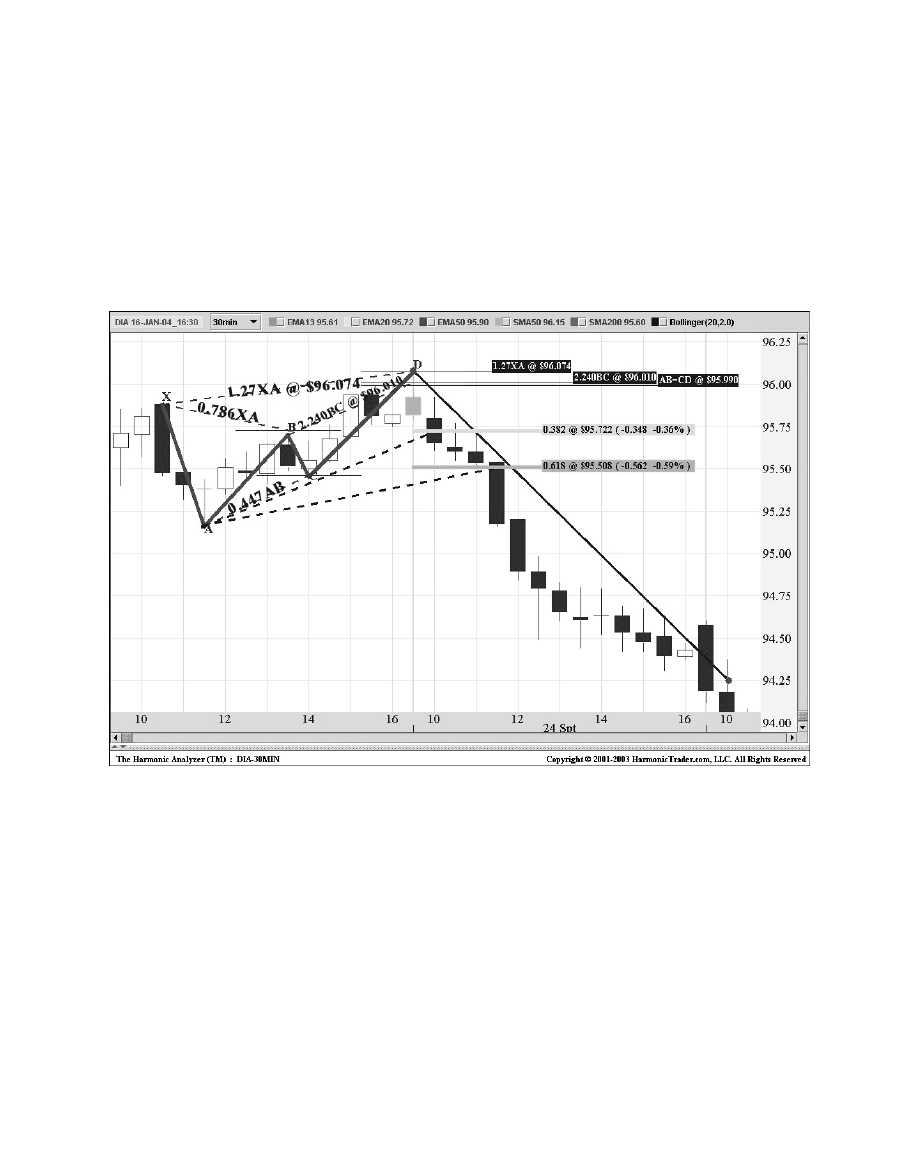
Dow Jones Industrial Diamonds
(DIA): 30-Minute
The Dow Jones Industrial Diamonds formed this intra-day Bearish Butterfly on a 30-minute
chart (see Figure 11.19). The setup possessed a convergence of numbers that defined the 96
level as critical short-term resistance. The Diamonds reversed exactly at the most significant
number at the pattern’s completion point—the 1.27 XA projection at 96.07. The AB=CD and the
2.24 BC projection complemented this harmonic resistance in the 96 area.
226
Harmonic Trading: Volume One
Figure 11.19
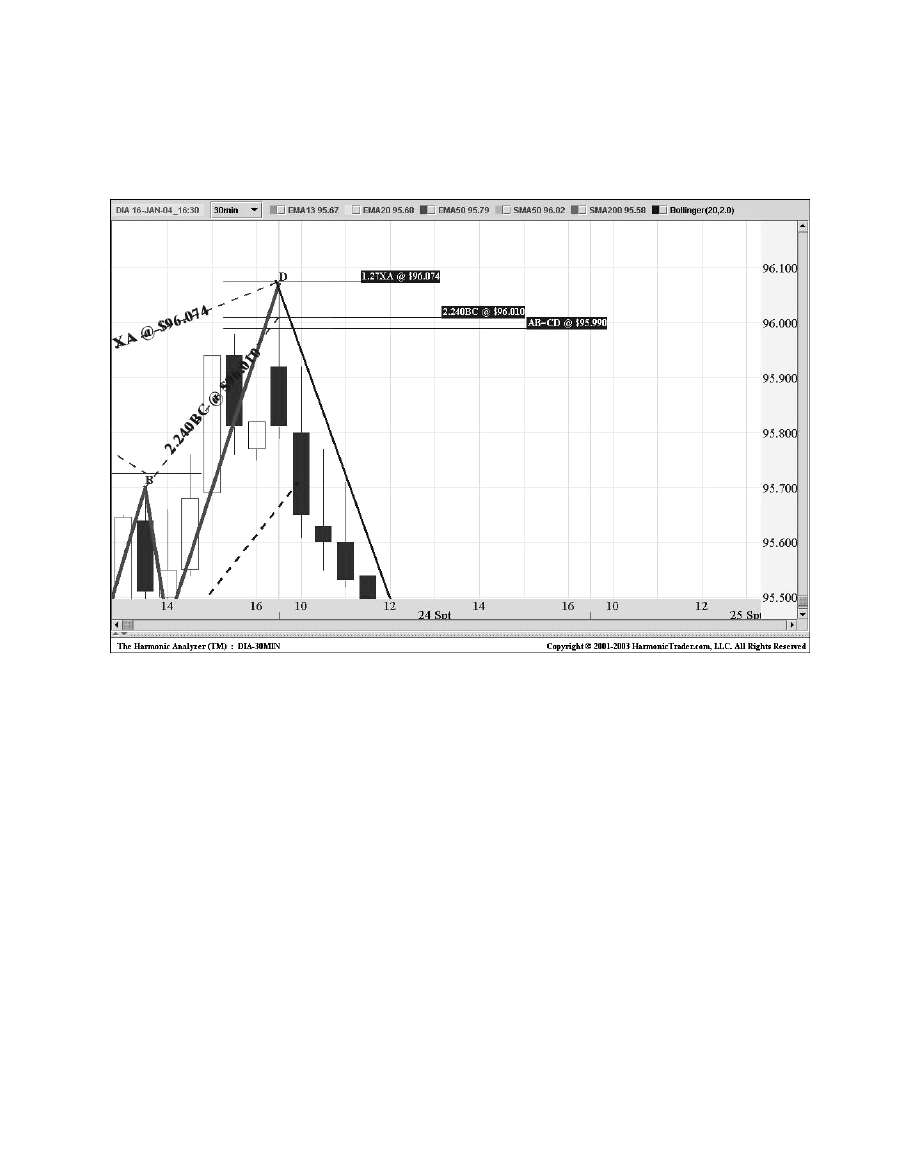
This chart in Figure 11.20 of price action in the PRZ shows an ideal reversal after a
complete test of this harmonic resistance. The Diamonds quickly reversed from this zone and
declined sharply following the completion of the pattern.
Chapter 11
The Harmonic Trade Management System
227
Figure 11.20
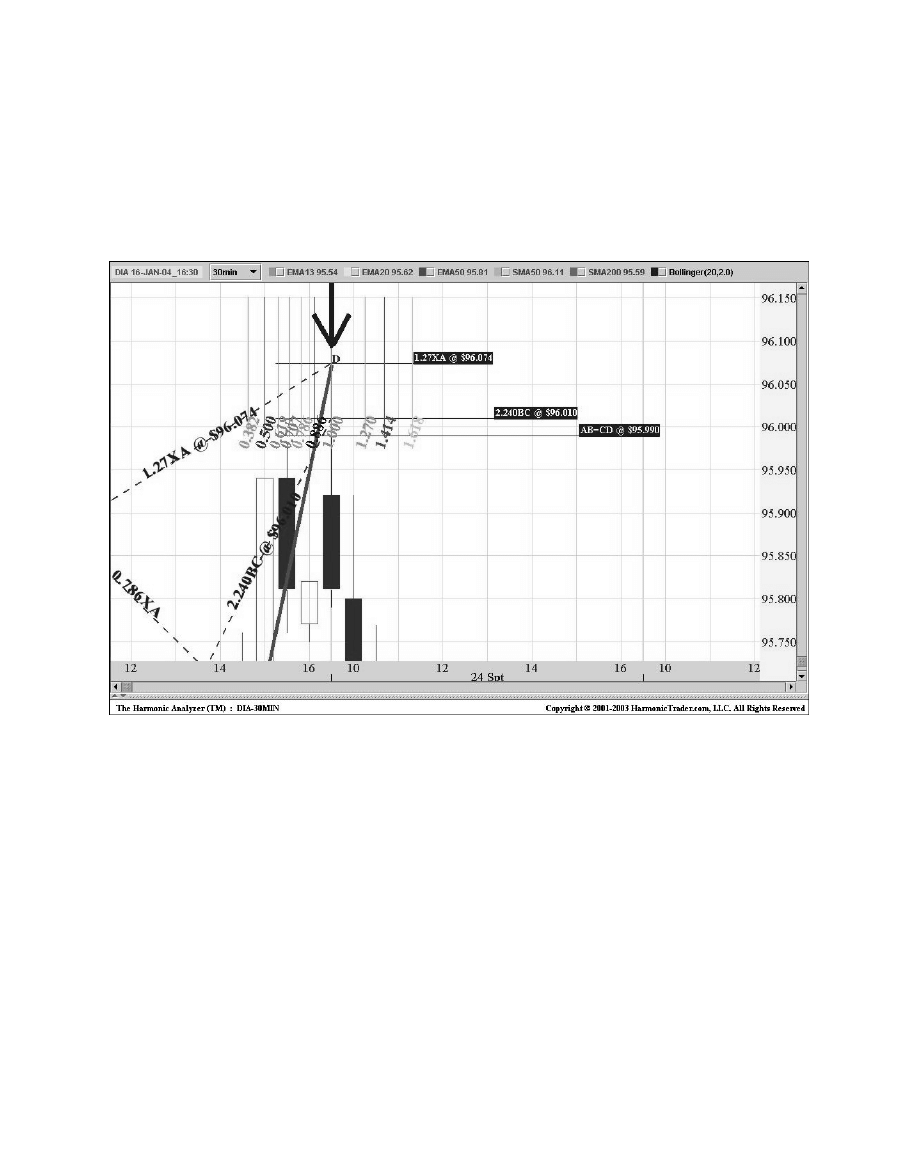
Figure 11.21 shows the spread of Fibonacci time calculations, as measured from the
mid-point (B) and projected to the completion of the pattern. The CD leg rallied sharply into
this PRZ but reversed exactly at the equivalent (1.0) time calculation. Perfect! Not only did
the 1.0 time calculation result in the exact reversal point, but the PRZ defined the precise
resistance level for the trade. Quite simply, it does not get any more ideal within the Harmonic
Trading approach than this!
228
Harmonic Trading: Volume One
Figure 11.21
The Diamonds reversed sharply from this harmonic resistance and continued convincingly
lower. The first downside target, the 0.382 IPO at 95.70 was easily taken out, as the reversal
established a decisive downtrend from the pattern’s high point. The next target at the 0.618 was
quickly reached, as the Diamonds declined rapidly through this next target area. In fact, after
the Diamonds hit the 0.618 target, the selling intensified, as the price action quickly tested the
0.886 and broke down past the pattern low.
The strong bearish continuation was particularly evidenced by the consistent formation of
lower lows and lower highs formed by each price bar. In addition, throughout the day of the
reversal, the Diamonds failed to break above any of the prior 30-minute highs.
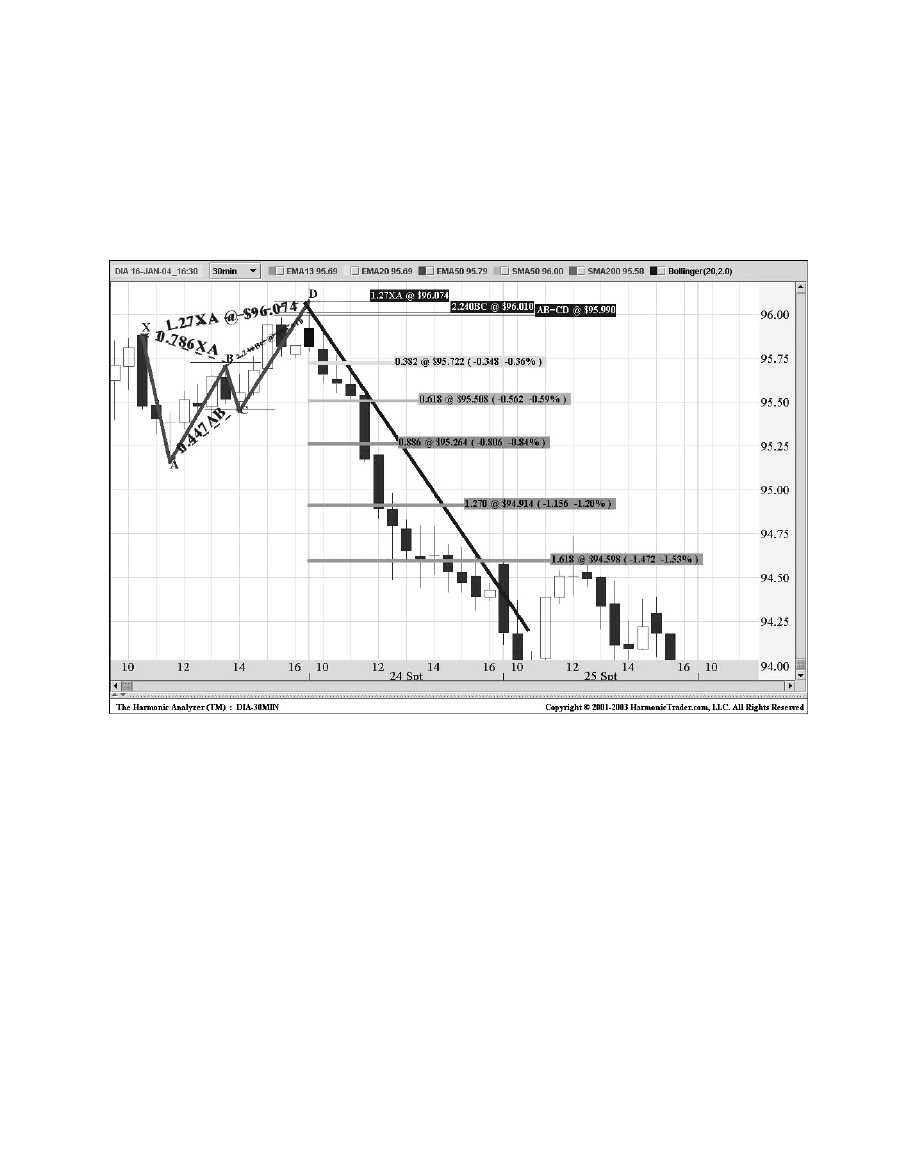
Chapter 11
The Harmonic Trade Management System
229
After the pattern was complete, a steady sell-off ensued. This situation exemplifies the
“home-run” reversal. The price action reversed exactly from the PRZ and possessed a
magnificent bearish continuation. Each profit objective was clearly violated—even beyond the
1.618 extension of the pattern (see Figure 11.22). After the IPO targets at the 0.382 and
the 0.618 had been exceeded, the most important consideration in the trade management
of the position was the trend line from the reversal.
Figure 11.22
In this situation, the Diamonds formed a distinct downtrend that was eventually violated
several days after the reversal was complete. The final trigger to cover the short occurred when
the Diamonds took out the 0.382 trailing stop at 94.25.
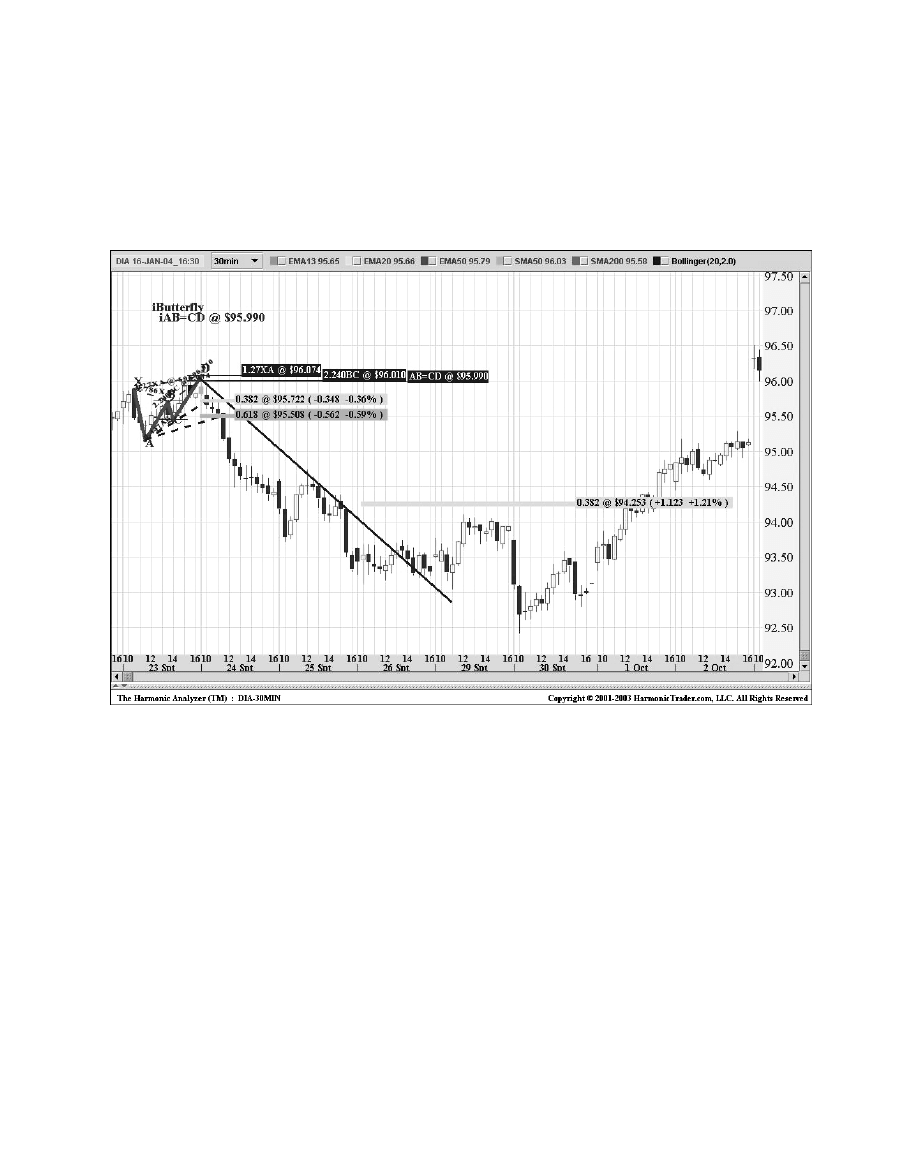
230
Harmonic Trading: Volume One
Figure 11.23
It is important to note that not all valid harmonic patterns yield such a reversal. However,
the Harmonic Trading Trade Management System is designed to allow enough “breathing
room” for these reversals to assert themselves. In this case, the exact reversal and strong
bearish continuation were the critical elements that identified this price action as a significant
move (see Figure 11.23).

Chapter 11
The Harmonic Trade Management System
231
Partial Trade Management
As I mentioned previously, depending upon your trading preference, it can be advantageous
to divide each position into two (or sometimes three) portions, securing partial profits at each
target level while holding a portion of the original position for a larger move. I believe that this
strategy is quite effective, especially when price action is volatile. One suggestion in this
strategy is to place limit orders to cover a predetermined amount of the entire position exactly
at the 0.382 and 0.618 IPO targets.
For simplicity’s sake, I demonstrate the Harmonic Trade Management System with only a
two-unit strategy. I typically secure a portion of the position when I get a trend line or 0.382
trailer violation, and cover the remainder at a more significant price objective depending upon
the continuation of the reversal trend. I believe all traders have their own preference regarding
this approach, and I leave it up to you to consider the best method for securing profits.
However, I believe it is most advantageous to manage profitable trades in a multi-position
manner.
Trade Management Tips
Identifying harmonic patterns is not a difficult skill to master. After studying the various patterns
and applying the Fibonacci ratios, the trade as defined by the pattern completion point is usual-
ly quite clear. However, each position must be must be handled properly to maximize profits
and minimize losses. Although two harmonic trades may possess the same patterns with iden-
tical Fibonacci ratios, their outcomes can be completely different. Therefore, there are some
simple guidelines to follow during the management stage of a trade after it has been executed:
• Be prepared for anything. Although the clearest setups can indicate excellent trading
opportunities, it does not relieve the responsibility of monitoring the trade and assuming
everything will automatically work out. Therefore, it is critical to monitor price action
closely.
• Follow the trade management rules (execute in the PRZ). The trade management
rules are based upon years of harmonic research. Although they serve more as general
guidelines, these strategies seek to optimize decisions in the trade management
process by reducing relative risk while maximizing profit opportunities.
• Respect the price bars at the harmonic levels. The most critical information in a
harmonic setup is derived from the price action at the convergence of numbers at a
pattern’s completion point. It is essential to closely examine how price action is
responding when it hits a harmonic area. The nature of price action in well-defined
pattern completion zones typically will indicate the overall validity of a setup. However,
price action that fails to reverse in this area indicates that the predominant trend is quite
strong.
• Look for continuation. After price action has reversed from a pattern’s completion
point, it should clearly continue in that direction. Price action that merely stalls or fails to
move convincingly in the reversal trend usually indicates a potential failure.

• Losses are a part of the business. Although a majority of harmonic setups provide
some degree of tradable reactions on the initial test of distinct pattern completions, a
percentage of trades will fail. It is just a fact of the business of trading. The key is to cut
the losses to a minimum and move on to the next trade. Trade executions will improve
as experience develops the ability to quickly read the early signs of a reversal.
Recognizing such failures, and reacting quickly to violated trade setups, preserves
capital and prevents small losses from turning intro disastrous draw downs!
• If in doubt, get out! If you don’t feel right about a trade or a position, close it out or
don’t take the trade. It is much safer to miss out on an opportunity than it is to anguish
over a situation that is not inherently correct.
Trade management strategies of harmonic patterns require discipline and patience. Although
this system attempts to maximize potential reversals, actual trade situations can involve many
external factors that can influence the decision-making process. These rules are effective in
allowing the market to offer the necessary price signals to validate reversals. Although there
is room for discretion within this trade management system, these guidelines offer effective
methods for handling trades and deciphering price action to maximize profits and minimize
losses after a trade has been executed.
232
Harmonic Trading: Volume One

233
When distinct harmonic patterns form, the anticipation of a valid reversal can frequently create
a biased perspective of the assessment of the opportunity. For example, a perfect Bearish Bat
could indicate a great selling opportunity. However, strong price action can blow out distinct
patterns like these and trigger a continuation of the predominant trend. As the section “Warning
Signs in the Potential Reversal Zone (PRZ)” in Chapter 10 illustrated, these situations frequent-
ly provide clear indication regarding the potential failure of a pattern. When this happens, there
are defined strategies that can capitalize on the continuation of the predominant trend. The key
to profiting from these situations is to utilize a strict trade management strategy with tight stop
loss limits. After the pattern has been violated, the focus of any reversal pattern trade should
examine the price action beyond the PRZ.
When trading a failed pattern setup, the trade management rules are more important, as this
strategy leaves little room for anything other than the sharp continuation of the predominant
trend beyond the violated PRZ. In addition, the reversal play can be tricky and frustrating, as
frequent stop-outs can occur before the price continues in the predominant trend. Despite
the potentially volatile price action associated with a failed pattern, these situations—when
identified correctly—do offer excellent trading opportunities.
As I discussed previously, harmonic patterns define critical price levels within the
predominant trend. Although patterns can accurately identify such pivot points, it is common
for the predominant trend to eventually violate these defined price levels. These situations often
provide ample opportunity to assess the validity of a particular pattern and offer specific price
action signals that direct trading decisions.
The idea of trading a failed pattern bases its logic in the predominance of the existing trend.
Since price bar warning signs frequently indicate potentially flawed harmonic patterns, they
conversely can signal another opportunity of trading with the trend. Because pattern failures
are a sign of an overwhelming predominant trend, these technical events can serve as
important continuation signals. Instead of getting locked into the anticipation of a reversal at
the completion of the pattern, this strategy takes more of a neutral approach. Trading execu-
tions are not limited to executing simple pattern completions. Moreover, strategies that take

advantage of pattern failures capitalize on both types of signals that are generated from
the price action in the Potential Reversal Zone. Regardless of the eventual result, the most
important concept is that the completion of distinct harmonic patterns defines critical technical
areas of support and resistance.
Reversing Failed Pattern Tips
• The entire PRZ must be tested with initial reaction complete. A continuation of the
predominant trend usually occurs after the price action has tested the entire range of
harmonic numbers in the PRZ. Although the extent of this nominal reaction varies, the
price action usually does not retrace beyond the limits of the harmonic zone. Essentially,
the initial test yields only a minor consolidation before resuming in the predominant
trend to exceed the PRZ.
• Respect the Terminal Price Bar. The Terminal Price Bar—the initial price bar that tests
the entire PRZ—establishes the defining limit for the violation of the PRZ. Furthermore,
the Terminal Price Bar defines the reversal entry with respect to the failed PRZ.
• Precise Stop Loss Limits. All stop loss limits must be defined well in advance, and
they usually are based upon the range of the prior PRZ and the extreme of the Terminal
Price Bar.
After a pattern violation has been triggered, the reversal trade is usually executed one or
two bars beyond the Terminal Price Bar. Typically, the violation should be a clear signal that
confirms the continuation of the predominant trend. Beyond this point, the price action should
convincingly trade in the direction of that trend. As the price action continues beyond the violat-
ed PRZ and the Terminal Price Bar, the stop loss in the trade management of the position is
continually adjusted. In fact, after confirming the violation, the stop loss is usually determined
by the prior price bar(s) beyond the Terminal Price Bar.
234
Harmonic Trading: Volume One
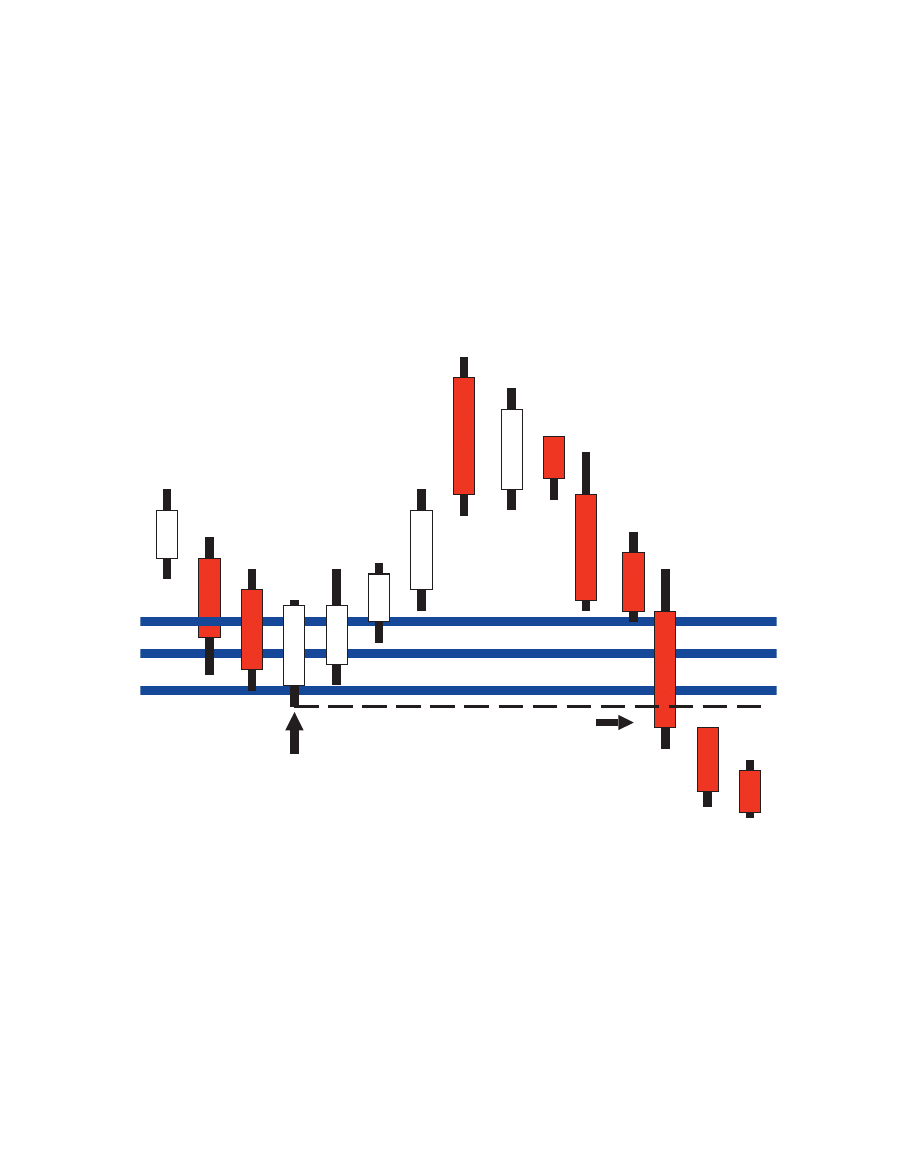
Figure 12.1
Another important element of a failed bullish pattern is the violation of the Terminal Price
Bar. Ideally, the violation of the Terminal Price Bar and prior PRZ should close below the zone.
Although this may appear as a “textbook” breakdown from a standard Technical Analysis
perspective, such a violation of a prior harmonic zone is particularly important as clear
confirmation of the pattern failure. In these situations, they can be considered a “harmonic
breakdown.”
Chapter 12
Pattern Violations
235
TERMINAL
PRICE BAR
BREAKDOWN OF
BULLISH PRZ &
TERMINAL PRICE BAR
Reversing a Failed Bullish Pattern
In a failed bullish setup, the price action typically will experience some initial reaction to the
completion of the pattern but quickly roll over violating the Terminal Price Bar (see Figure 12.1).
It is common for the setup to experience sharp price action on the initial test of the PRZ. The
critical element in a failed bullish pattern is a quick trend line violation of the first reaction. This
is especially evident when a reversal experiences an impulse reaction in one or two price bars,
only to immediately roll over and fail to continue to the upside. Although this requires some
skilled interpretation to ascertain impending failures, such factors as a violation of a prior price
bar low or breakdown of a short-term trend line of the reversal frequently signal trouble.
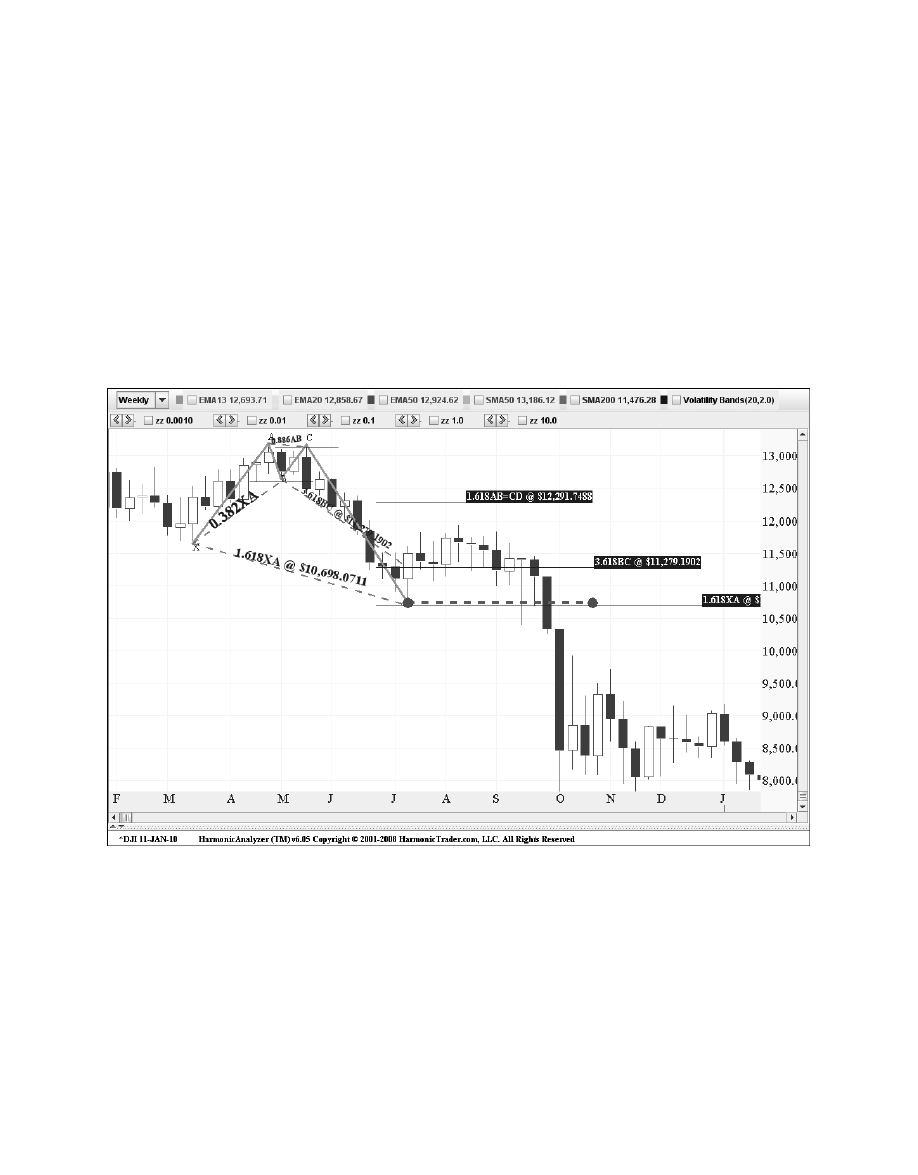
236
Harmonic Trading: Volume One
Dow Jones Industrial Average
($INDU): Weekly
The Dow Jones Industrial Average exemplifies the ideal situation of a failed pattern. The index
formed this Bullish Crab in Figure 12.2 and yielded a brief reversal for a few weeks from the
Potential Reversal Zone (PRZ). Although the price action stabilized, the reversal fizzled. After a
nominal rally that barely exceeded the top range of the PRZ, the index rolled over and declined
sharply under the 10,700 level. Despite a perfect reversal from the 1.618 XA leg of the Crab,
the reversal moved sideways after the initial pop. The lackluster bullish continuation signaled
an impending failure long before the price action rolled over and sank decidedly lower in the
direction of the predominant trend.
Figure 12.2
The first sign of trouble was the failure of the index to continue to the upside following the
second week after the reversal. On the fourth week, the price action topped out and rolled over
to retest the entire PRZ. Although the Terminal Price Bar was not yet violated at this point, the
retest of the entire range of harmonic support should have raised a red flag in this situation.
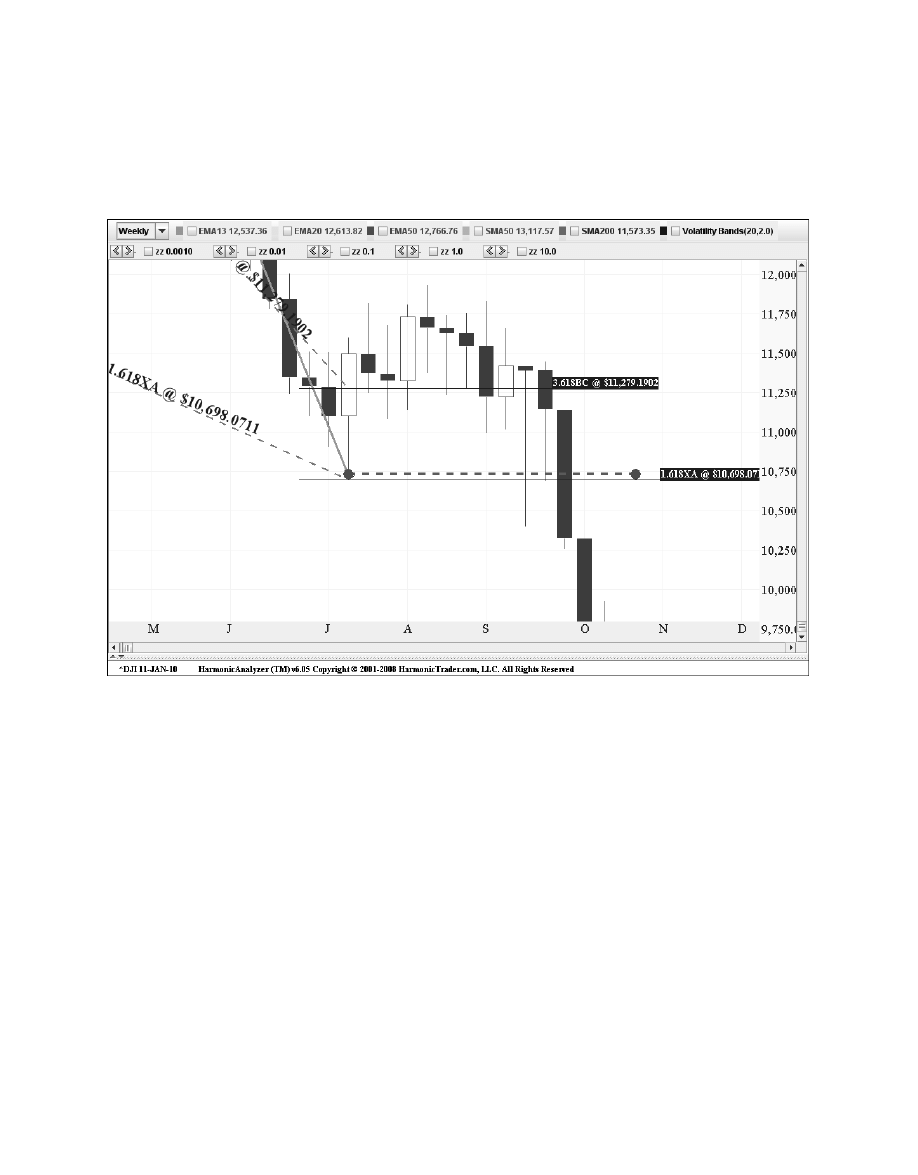
Chapter 12
Pattern Violations
237
The real signal of trouble was triggered on the violation of the PRZ of the second retest. Any
long position executed at the initial completion of the Bullish Crab should have moved the stop
loss limit to break even at a minimum. The chart in Figure 12.3 of the price action in the PRZ
clearly shows the brief bounce and rollover that occurred.
Figure 12.3
The violation of this pattern led to a severe downside continuation in the 2009 bear market
and it was a clear sign of the strength of the predominant downtrend. The weekly Bullish Crab
was valid for a brief time, as the index temporarily found support at the initial completion of the
pattern. The following few weeks followed a common scenario of many invalid setups, where a
pattern yields only a short-term reversal, only to roll over shortly thereafter. The violation of the
Terminal Price Bar in the PRZ on the second retest eventually triggered a deeper correction
with a sharp (yet ideal) bearish continuation.
This chart example of the Industrials manifests a common aspect of many harmonic pattern
trades and exemplifies the importance of executing on the initial test of a pattern’s completion.
Price action will frequently provide a short-term tradable reaction from the initial test of the
PRZ. Furthermore, the nature of price action within the first few price bars after the entire range
of harmonic numbers has been tested is the most critical aspect of the validation of a potential

pattern. Although the index rolled over after a brief bounce, the initial reaction still provided a
nice profit in the short-term. However, the index’s failure to continue to the upside provided the
necessary signals to exit the trade while protecting the small profit.
As I have mentioned previously, it is important to understand that harmonic patterns are not
“end-all-be-all” price structures. I believe a common misconception is that harmonic patterns
signal a monster reversal every time. This is just not the case. In fact, the example of the Dow
Industrial Average is probably more common for most harmonic set-ups than the “home-run
scenario.” That is, distinct harmonic patterns offer a tradable reaction on their initial completion.
For these reasons, Harmonic Trading techniques require an active trade management
approach to fully maximize these common short-term reactive reversals. Although a
longer-term perspective can be applied to utilize Harmonic Trading techniques from a
weekly or monthly timeframe, the concept of specific profit targets and aggressive trade
management is required to capitalize on these opportunities.
Another important consideration of this strategy is the discipline required to effectively
manage these trades. The defined trade management parameters instill greater confidence and
responsibility for every position. In the same manner that specific elements are required to
identify harmonic price patterns, the price action in valid reversals must behave in a particular
fashion, exhibiting the commonalities of a change in trend. In the Dow case, the initial bounce
offered evidence of a reversal at hand. However, the clear failure to continue to the upside
shortly after the reversal signaled the impending rollover.
If the position was going to be flipped, where the long position was covered and a new short
position was entered, the second test of the Potential Reversal Zone (PRZ) was the critical
area. As the previous scenario demonstrated, the initial long position would have been exited in
the Profit Protection Zone (PPZ), somewhere close to the break down at 11,200 and certainly
before a complete retest of the original entry point. Although this rollover was quite evident
within weeks after the initial PRZ test, the pattern was not considered a failure until the violation
of the Terminal Price Bar at the 10,700 level. Any short position that was seeking to capitalize
on this failure should have been entered on this violation. Again, in these situations, the price
action should clearly continue in the predominant trend, quickly declining below the prior PRZ.
As a failed pattern trade, the short executed following the violation of the harmonic support
should have utilized a tight stop loss limit and be placed just above the prior week’s high. In this
case, the stop loss would be executed above the 11,300 level, which was the top range of the
prior PRZ. As the failed pattern reversal trade continued to work out, the stop loss limit should
have been adjusted accordingly, maintaining an active approach throughout the management of
the position. In the Dow case, a simple 1-bar stop loss would have been more than adequate.
238
Harmonic Trading: Volume One
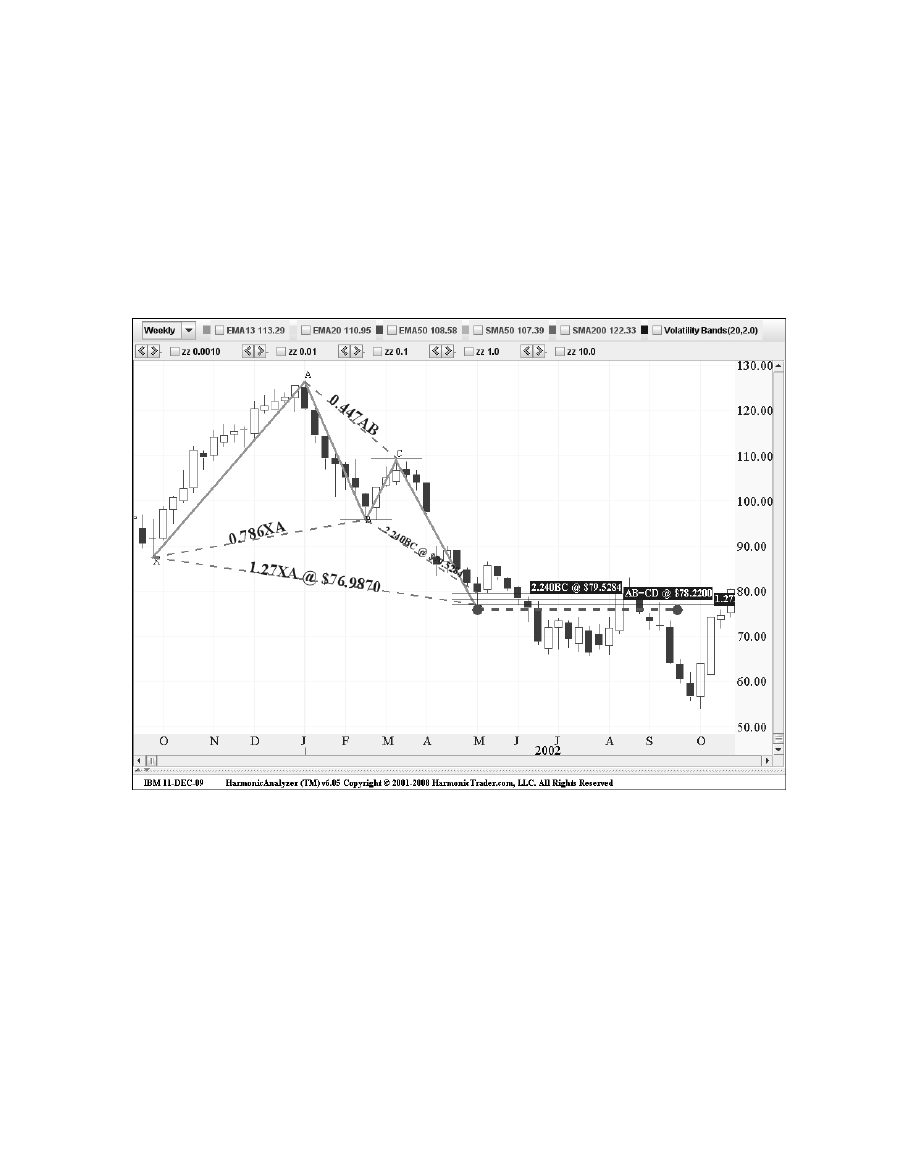
Figure 12.4
Chapter 12
Pattern Violations
239
IBM
(IBM): Weekly
This example of IBM shows a distinct Bullish Butterfly that was violated after a brief bounce
from the initial test of the Potential Reversal Zone (see Figure 12.4). It is important to note that
the alignment of Fibonacci numbers in the pattern structure were ideal, as the 1.27 XA and
1.618 BC projections converged in the same area as the AB=CD completion point just under
$80 a share.
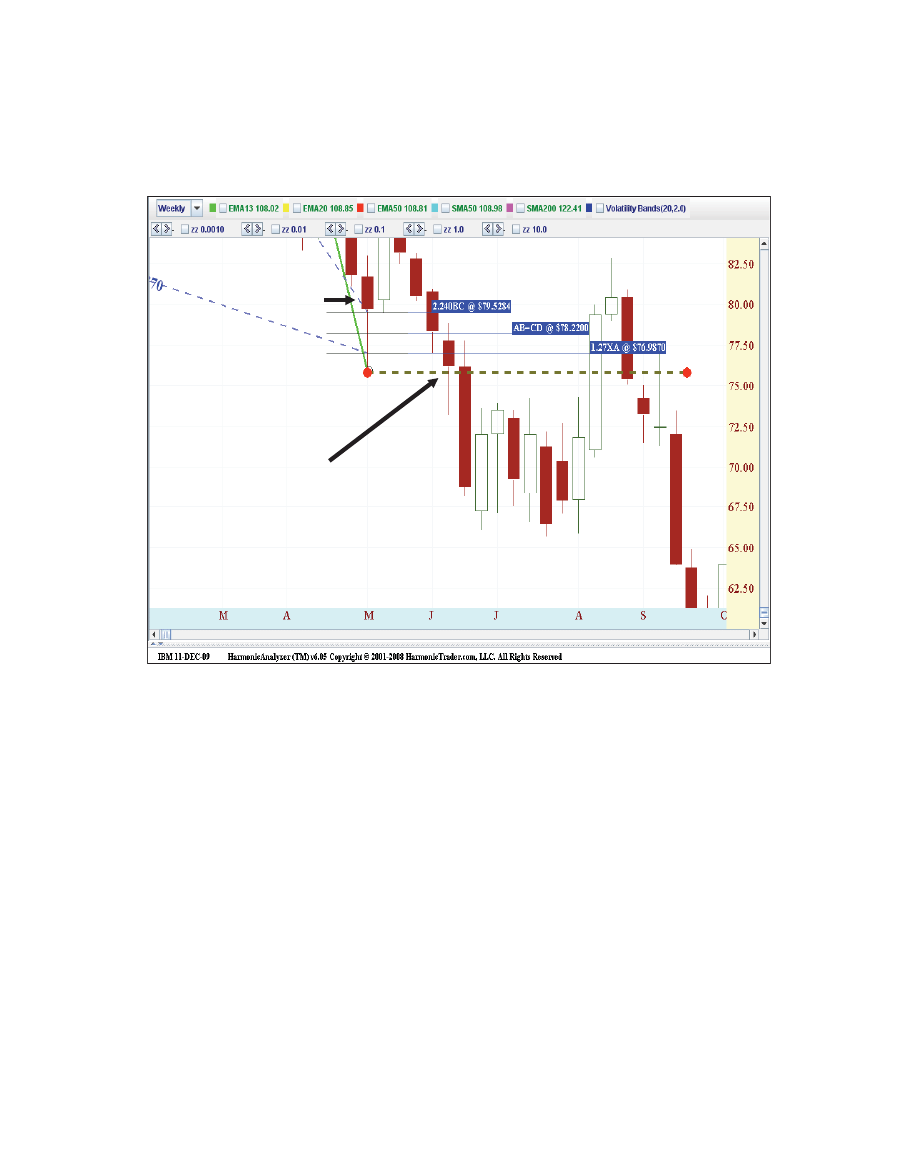
The chart in Figure 12.5 of the price action on the PRZ clearly shows the brief bounce and
rollover that occurred. In this example as well as the IBM chart, the first sign of trouble was the
failure of the stock to continue to the upside following the second week after the reversal.
240
Harmonic Trading: Volume One
Figure 12.5
After a sharp move to the $85 level, IBM stalled. By the fifth week, the stock rolled over,
retesting the entire PRZ. Although the Terminal Price Bar was not yet violated until the following
week, the retest of the entire range of harmonic support should have raised a red flag.
As this example of IBM demonstrates, the lack of continuation following a reversal is
frequently an early indication of a potential pattern failure. Although such failures are not
immediately discernable in every situation, this case of IBM exemplifies the “window of time”
available within the early stages of most reversals that offer a few price bars to signal the
potential direction of the future price action. Ideally, pattern reversals should hit the entire
PRZ on the initial test, reverse close to this range of harmonic numbers, and possess a strong
continuation of the new trend. For IBM, one bullish price bar off the PRZ does not establish a
new trend. Figure 12.5 shows the price action in the Potential Reversal Zone with the Terminal
Price Bar clearly labeled.
Despite this rollover, the initial bounce yielded a nice short-term profit, as the stock bounced
9 points before rolling over. At a minimum, the Bullish Butterfly offered a great short-term
Violation Of
Potential
Reversal Zone
(Prz) Under 76
Terminal
Price Bar

opportunity. But, this is another example of a clear harmonic pattern yielding only a brief move
that required an aggressive trade management approach to protect the initial profit and handle
the position effectively. If anything, the rollover and violation of the bullish pattern signaled a
continuation of the predominant bearish trend.
If the position was going to be flipped, where the long position was covered and a new
short position was entered, the second test of the PRZ was the critical area. As this situation
illustrates, the initial long position would have been exited in the PPZ, somewhere between
the breakdown at $80 and the entry point under $77. Although this rollover was evident within
weeks after the initial reversal, the pattern was not considered a failure until the violation of
the Terminal Price Bar at the $76 level. Any short position that was seeking to capitalize on
this failure should have been entered on this violation.
The solid downtrend line illustrated on the chart exemplifies the effectiveness of this
constraint in well-defined breakdowns. The price action was clearly sliding in an area that was
supposed to yield a reversal, as defined by the Bullish Butterfly. Despite the ideal alignment of
numbers, the predominant bearish trend line contained the price action, pushing the stock
lower after a brief reversal off the initial completion of the pattern.
This is another example of a sharp downside continuation following the violation of the
Terminal Price Bar serving as an important continuation trigger. These situations are common,
as the violation of distinct harmonic zones frequently encounter sharp continuations of the
predominant trend.
Again, this is another scenario where it is important to understand that harmonic patterns
are not “end-all-be-all” price structures. The IBM example demonstrates the type of short-term
reversals that frequently materialize after the completion of a distinct harmonic setup. Although
not every pattern will yield a “home-run,” most reversals will yield small reactions at a minimum,
offering profitable short-term trading opportunities.
Another important aspect of the IBM example is the ability of distinct patterns like this sharp
Bullish Butterfly in IBM to serve as a “signpost of future action.” I initially discussed this in
The Harmonic Trader, and I have expounded on the concept throughout this book. Patterns
should represent a price structure signal that must be assessed from a pragmatic viewpoint.
Essentially, it comes down to these two rules:
1. All patterns are not the same.
2. All reversals are not the same.
Therefore, it is important to not assume that a distinct pattern will always yield a “home-run”
reversal. Rather, it is critical to be prepared to utilize the signals that are offered by the market’s
price action in these harmonic zones to guide trading decisions.
Harmonic Trading techniques offer excellent opportunities but require an active trade
management approach to fully maximize these common short-term reactive reversals. Although
a longer-term perspective can be applied to utilize Harmonic Trading techniques to analyze
weekly or monthly time frames, the concept of specific profit targets and aggressive trade
management are still required to capitalize on most harmonic opportunities.
Chapter 12
Pattern Violations
241
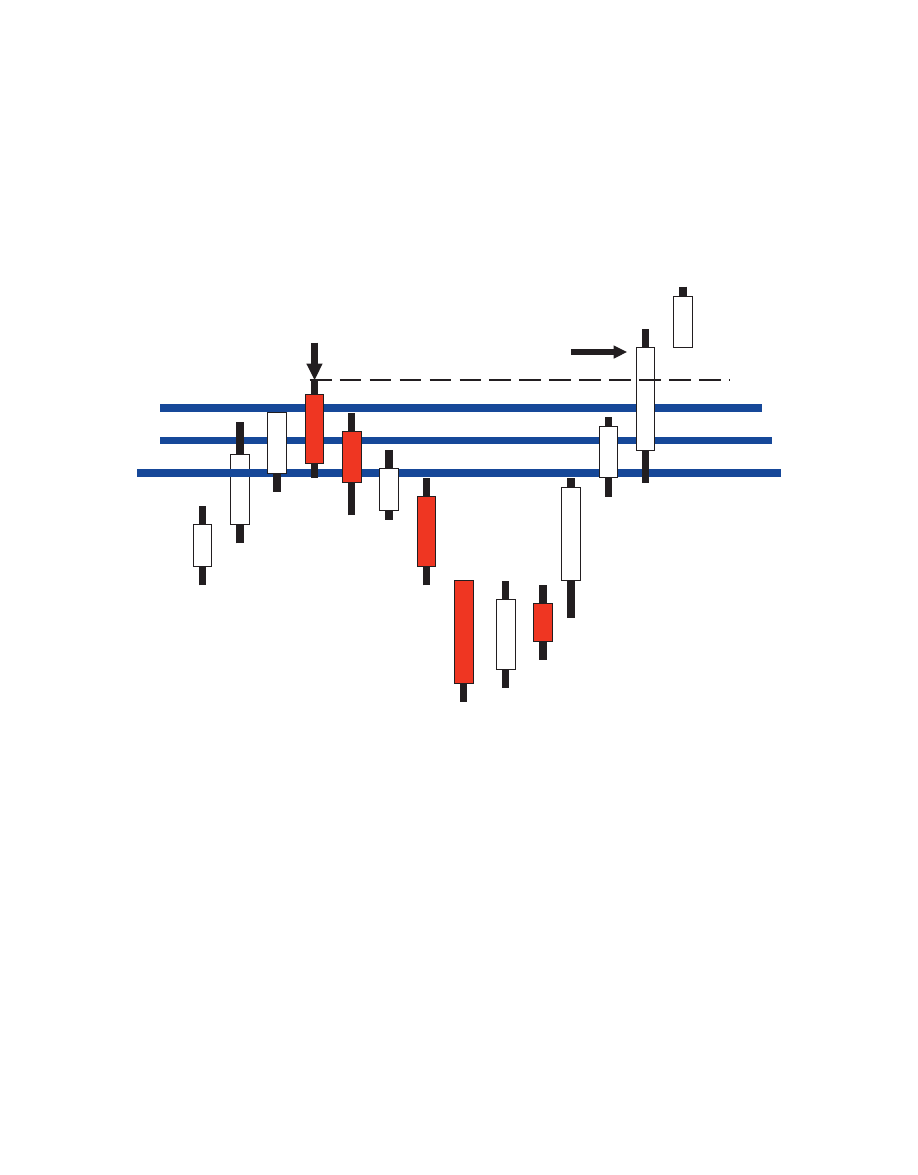
Reversing a Failed Bearish Pattern
In a failed bearish setup, illustrated in Figure 12.6, the price action typically will experience
some initial reaction to the completion of the pattern but quickly turn back up to retest the
Potential Reversal Zone (PRZ), eventually violating the Terminal Price Bar. I like to refer to
these situations as “harmonic breakouts,” where price action rallies above distinct harmonic
zones of well-defined patterns.
242
Harmonic Trading: Volume One
TERMINAL
PRICE BAR
BREAKDOWN OF
BULLISH PRZ &
TERMINAL PRICE BAR
Figure 12.6
Harmonic breakouts above distinct bearish PRZs typically possess extreme price bars
and convincing bullish continuation. These breakouts are especially significant in retracement
patterns like the Bat and the Gartley, and can serve as excellent entry to signals to follow the
predominant trend.
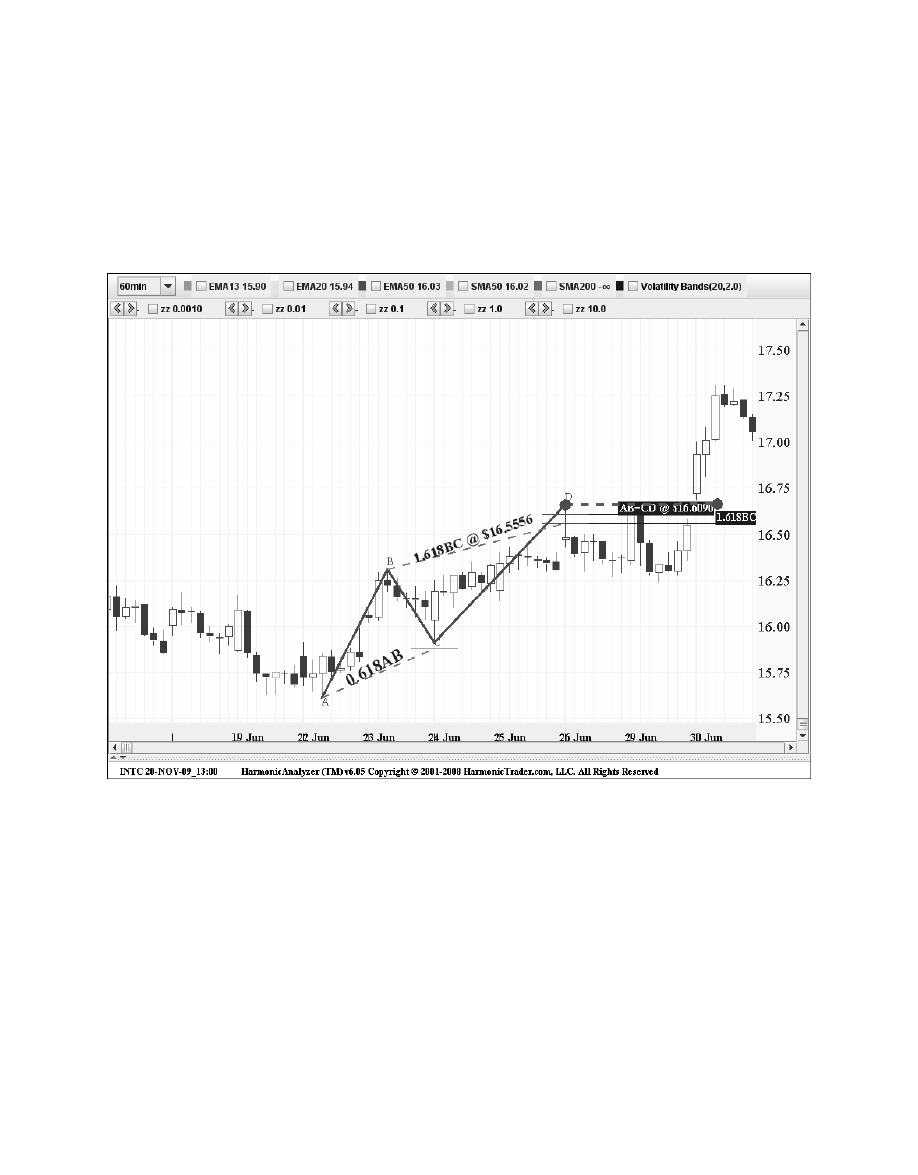
Chapter 12
Pattern Violations
243
Intel
(INTC): 60-Minute
This chart of a failed Bullish AB=CD pattern in Intel is an ideal example that yielded a brief
reversal from the Potential Reversal Zone (PRZ), only to continue sharply higher in the direction
of the predominant trend (see Figure 12.7).
Figure 12.7
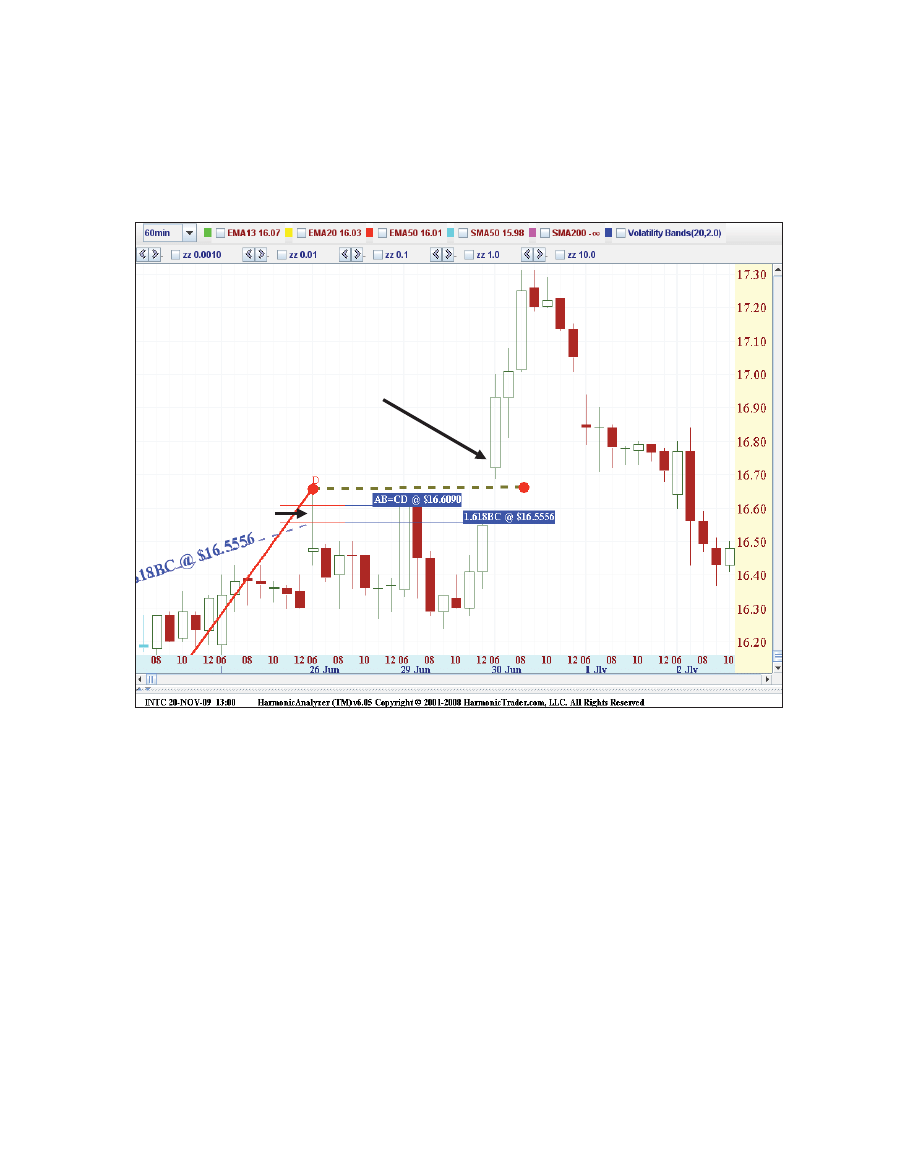
Figure 12.8
Such breakouts above defined harmonic patterns like this setup frequently can act as a
trigger to reverse the initial trade idea and follow the predominant trend. After Intel broke out
above the Terminal Price Bar, the stock steadily climbed, possessing a nice bullish continuation
with a distinct trend line support that defined the rally.
These situations are common, and this example demonstrates the ability of blown-out pat-
terns to act as signposts of future action. In this case, the violated AB=CD clearly indicated the
strength of the rally in the stock. It is important to note that reversing a bearish setup must
occur after the violation of the Terminal Price Bar, as the sharp continuation anticipated in these
setups usually does not occur until this is exceeded. In this chart of Intel, the stock did not sig-
nificantly rally until the Terminal Price Bar was violated above $16.65. Again, it is important to
maintain a tight stop loss limit when attempting to play the continuation of the predominant
trend, as the price action should continue decidedly above the prior PRZ.
244
Harmonic Trading: Volume One
Violation of Potential
Reversal Zone (PRZ)
Terminal Price
Bar
Briefly after the stock stalled at the pattern’s completion, the Terminal Price Bar and the PRZ
were violated convincingly. Illustrated on the chart in Figure 12.8 of the price action in the PRZ,
Intel rallied sharply above the initial test of the AB=CD completion by gapping up on the open
of the following day’s trading.
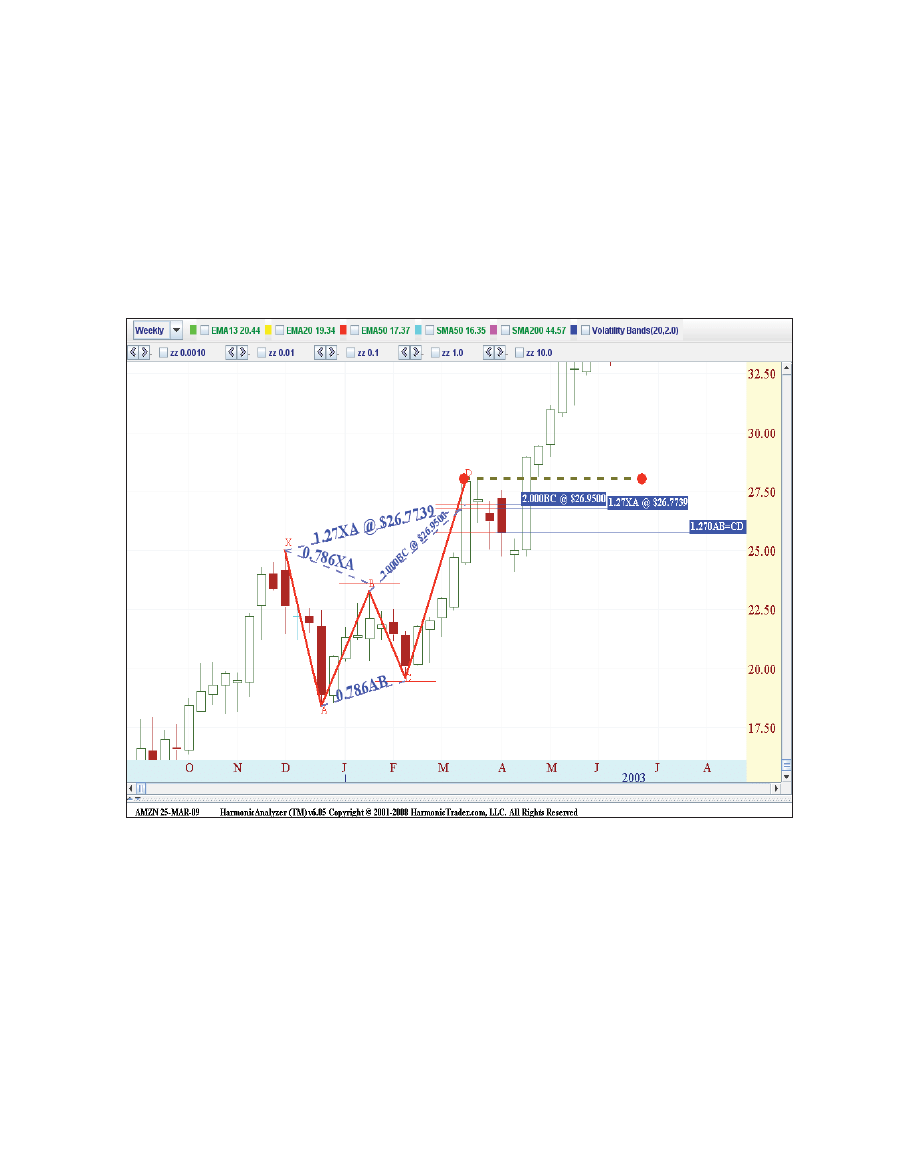
Amazon.com
(AMZN): Weekly
Amazon formed a distinct Bearish Butterfly with an ideal alignment of Fibonacci ratios to
validate the structure (see Figure 12.9). The pattern defined a shorting opportunity in an
approximate 1-point range between 25.75–26.95. Despite the clear pattern, the stock rallied
sharply on the week it tested the PRZ. After the action stalled for several weeks, the stock
rocketed above the Terminal Price Bar and the prior bearish PRZ.
Chapter 12
Pattern Violations
245
Figure 12.9
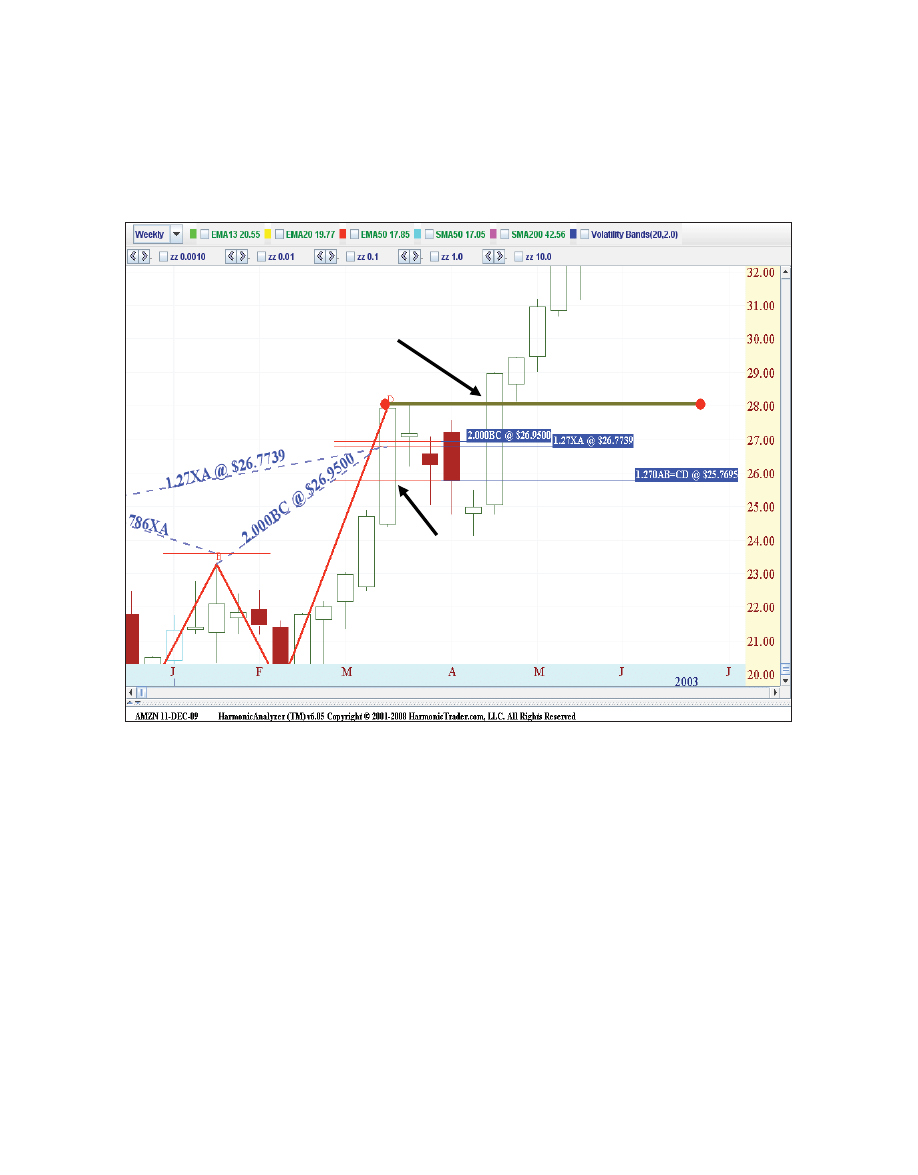
Figure 12.10
This is another example of a decisive upside continuation following the violation of the
Terminal Price Bar. These situations are common, as the violation of distinct harmonic zones
frequently triggers sharp continuations of the predominant trend. In this case, Amazon rallied
convincingly in the weeks following the Terminal Price Bar breakout, as the stock continued to
rally into higher territory while holding the prior weeks’ lows.
Prior Harmonic Support and Resistance
Static support and resistance levels have been a foundation of Technical Analysis for decades.
Price action tends to trade in zones of support and resistance. When support is violated, that
price level becomes future resistance. When resistance is violated, that price level becomes
future support.
246
Harmonic Trading: Volume One
VIOLATION OF
POTENTIAL REVERSAL ZONE (PRZ)
TERMINAL
PRICE BAR
The violation of the bearish pattern signaled a strong continuation of the predominant bullish
trend (see Figure 12.10). If the position was going to be flipped, where the short position was
covered and a new long position was entered, the violation of the Terminal Price Bar above the
$28 level was the determining area.
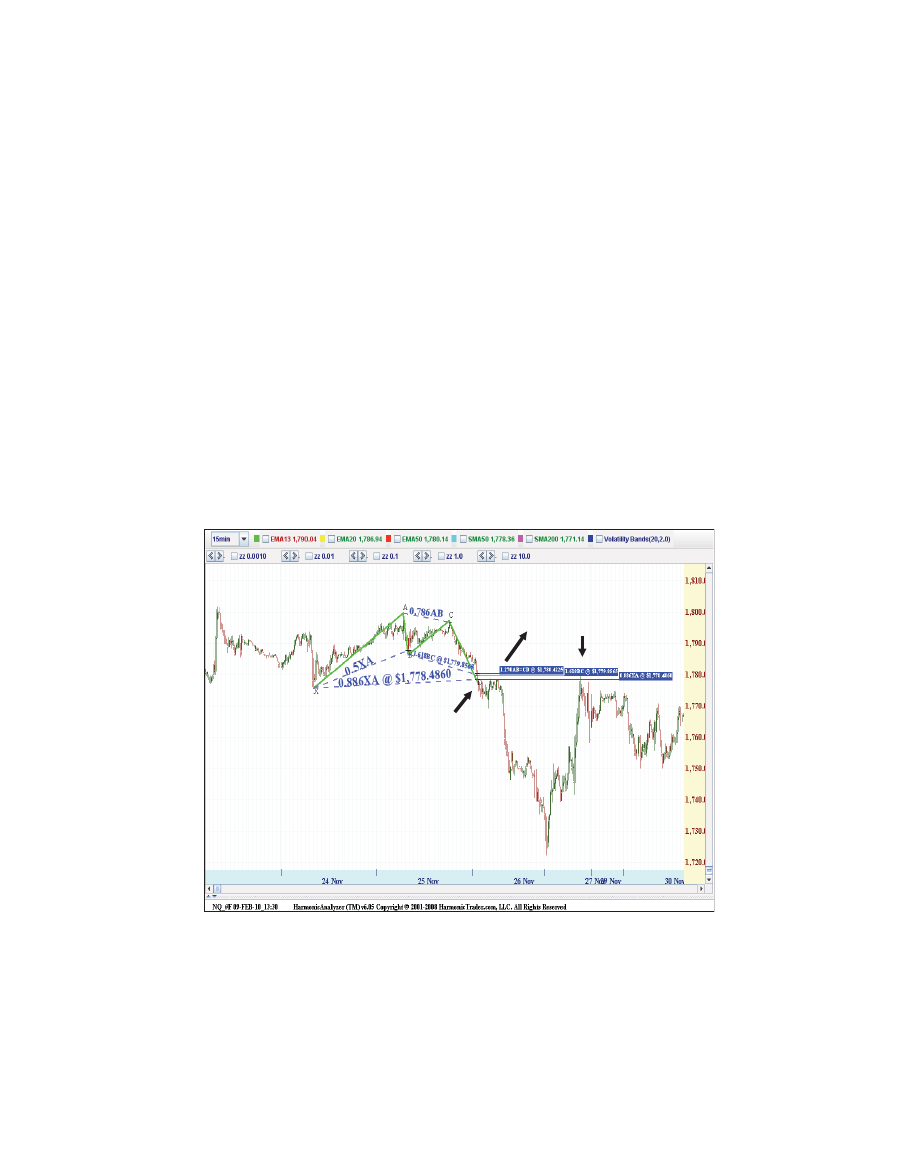
Although this is a simple concept to grasp, when applied to the PRZ of harmonic patterns,
this concept can identify critical price levels that otherwise might be overlooked. After clear
harmonic patterns are violated, the price action usually continues in the predominant trend for
some time. However, it is common for price action to retest these harmonic levels, as prior pat-
terns frequently mark critical points within an overall trend.
Prior Harmonic Support as Resistance
When the Potential Reversal Zone (PRZ) of a bullish pattern is blown out or violated, the prior
harmonic support commonly acts as future resistance when the price action retests this level.
NASDAQ 100 Continuous Mini-Contract (NQ_#F): 15-Minute
This chart of the NASDAQ 100 Continuous Mini-contract illustrates the concept of prior har-
monic support acting as resistance. On this 15-minute chart, the NQ clearly violated the intra-
day Bullish Bat early in the session (see Figure 12.11). The pattern defined the area just in the
area of 1780 as critical short-term harmonic support. However, the contract was sliding in the
pre-market and continued sharply lower after the open. Despite the breakdown, the NQ rallied
back to retest this prior support later in the day.
Chapter 12
Pattern Violations
247
Violation Of
Potential
Reversal
Zone (Prz)
Prior Harmonic
Support Now
Resistance
Figure 12.11
The structural failure of the prior harmonic support zone clearly was a key intra-day level.
The ability of pattern completion points to define important technical levels is a unique
phenomenon within the Harmonic Trading approach. The ability to interpret these signals
increases with experience, but it is important to respect the information that such pattern
failures provide.
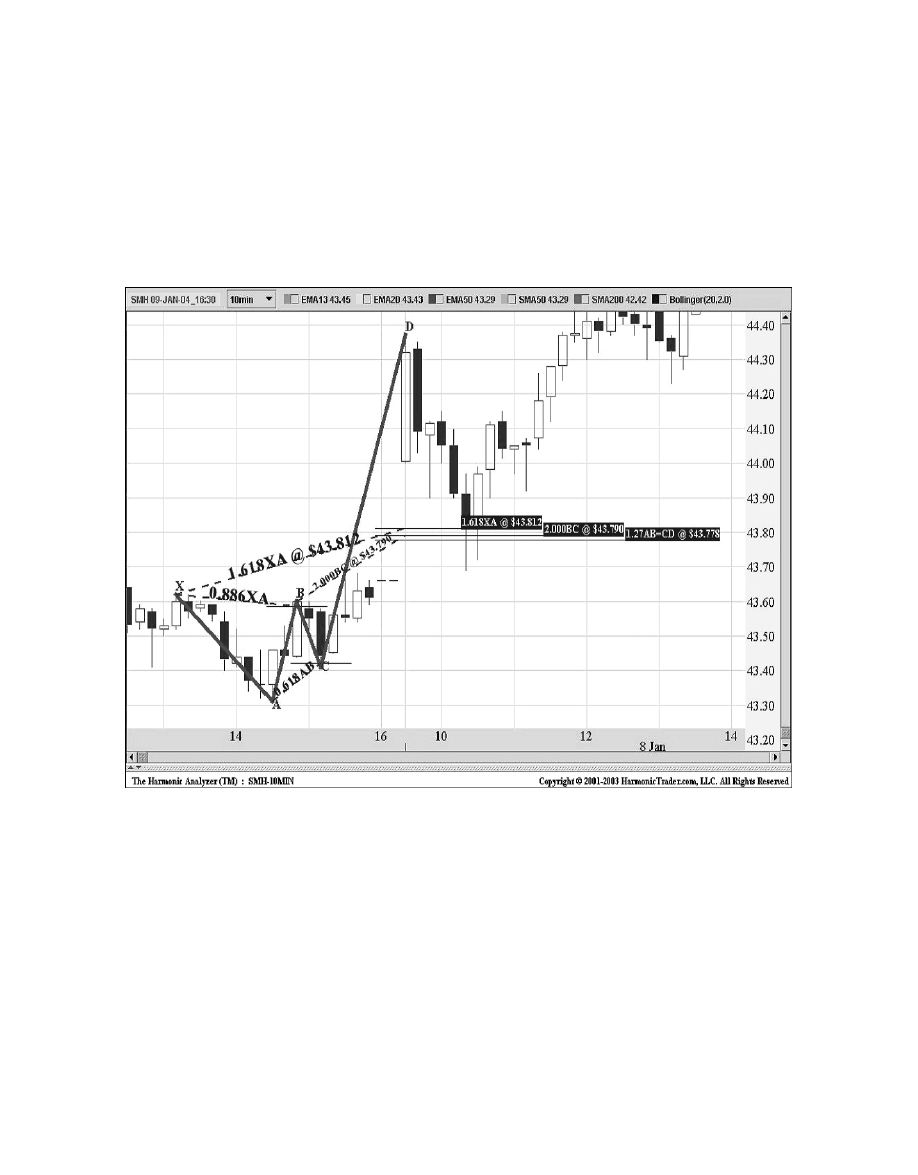
Figure 12.12
After completely violating the prior bearish setup, the SMH retraced some of the rally, finding
support in an area of prior harmonic resistance. It is important to note that the SMH filled the
intra-day gap in the same area as the prior resistance. These situations are common and
frequently define nice short-term trading opportunities.
Although these prior PRZs should be utilized with other current patterns to define trading
opportunities, this phenomenon within the realm of Harmonic Trading techniques is extremely
effective. These situations are most commonly found when a pattern has been clearly violated.
Despite these failed pattern setups, prior PRZs can provide a great deal of information
regarding the potential direction of future price action that might otherwise be overlooked.
248
Harmonic Trading: Volume One
Semiconductor Holder’s Trust (SMH): 10-Minute
The Semiconductor Holder’s Trust (SMH) blew out this Deep Bearish Crab on the 10-minute
chart (see Figure 12.12). After gapping well above the PRZ on the open, the SMH retraced a
good portion of the initial pop. The price action refilled the upside gap and bounced in the area
where prior
harmonic resistance acted as clear support. The intra-day Bearish Butterfly was
blown out after gapping past the PRZ on the open of the trading, the day it tested these
numbers.
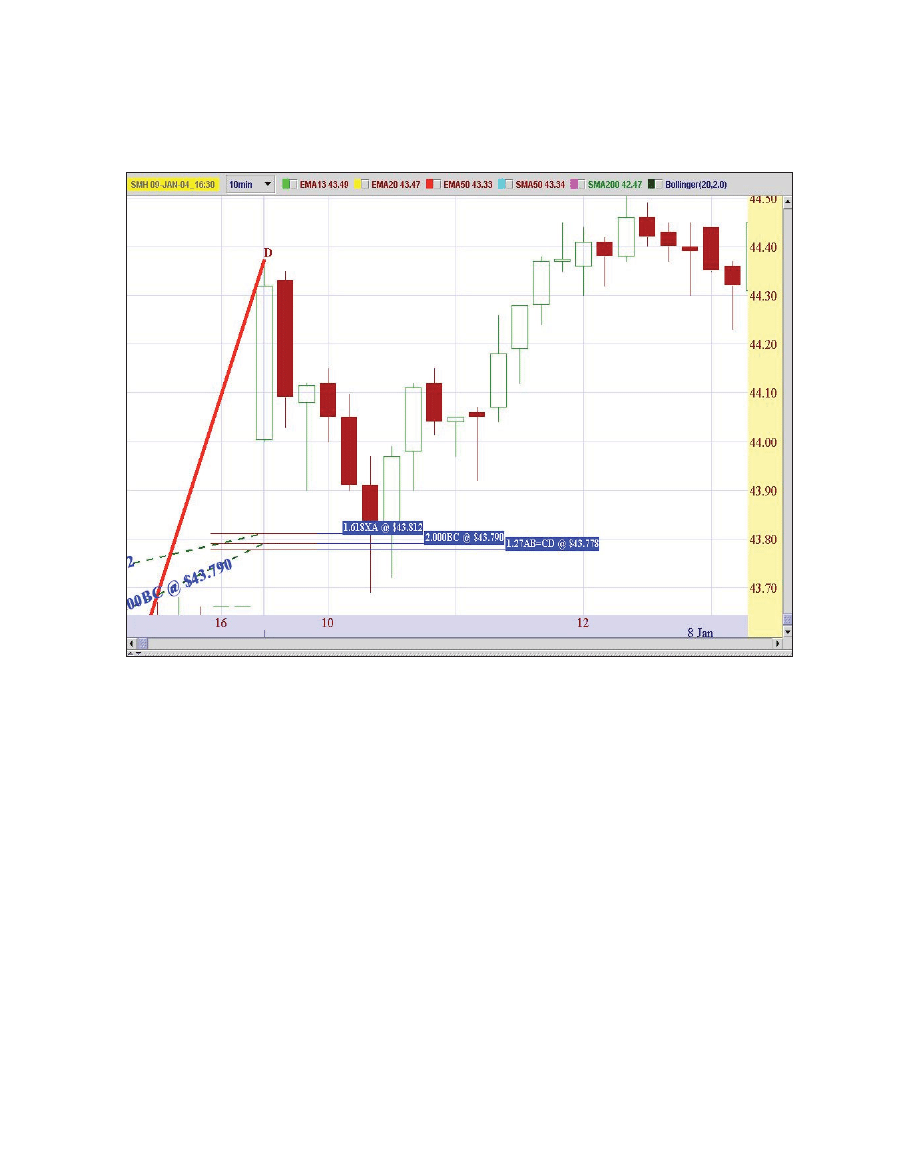
Chapter 12
Pattern Violations
249
The chart in Figure 12.13 of price action in the violated PRZ exemplifies this phenomenon,
as prior harmonic support became considerable short-term resistance.
Figure 12.13

Pattern Violation Conclusion
The concept of prior blown-out PRZs acting as an opposite technical level is founded in the
principle that harmonic patterns are primarily a “signpost of future action.” I initially discussed
this in
The Harmonic Trader. Essentially, the critical information is revealed by the price action
in the Potential Reversal Zone (PRZ). Although valid patterns are quite accurate and identify
excellent trading opportunities, there are many cases where the predominant trend overwhelms
the anticipated completion of a pattern. Despite the failed reversal, the distinct price action at
the completion of a pattern frequently possesses extraordinary behavior that acts as a clear
signal for the continuation of the predominant trend.
250
Harmonic Trading: Volume One

The purpose of
Harmonic Trading: Volume One is to clarify and define the numerous price
structures that comprise the foundation of the Harmonic Trading methodology. I believe the
specification of price structures within the realm of Harmonic Trading is among the most
advanced Fibonacci analysis utilized in Technical Analysis. It is in this precise specification that
Harmonic Trading possesses its greatest advantages, yielding an accurate and effective means
of identifying potential trading opportunities.
Although Harmonic Trading techniques possess a powerful array of pattern identification
methods, the ultimate success and profitability of this approach requires an effective and
aggressive trade management strategy. As the numerous chart examples demonstrated,
most pattern completions yield sizeable but temporary price moves that require an active
trade management strategy to maximize returns. Although Harmonic Trading techniques are
extremely effective in long-term and general market analysis, the same trade management
concepts should be utilized short-term situations to determine the critical signals that indicate
the potential future price action.
Harmonic Trading: Volume One is a comprehensive foundation for most of the Harmonic
Trading techniques. A great deal of material covered in
The Harmonic Trader—such as the
Three Drives pattern, prior gaps, and the importance of Volume—is not in this material.
However, I believe this book possesses a thorough methodology from pattern identification
to trade execution through the entire trade management process.
Already in the development stages,
Harmonic Trading: Volume Two will build upon this
comprehensive foundation, adding many advanced techniques to all stages of the trading
process. In addition, I will be releasing two new harmonic patterns in
Volume Two. I look
forward to continuing my research in the realm of Harmonic Trading and sharing these ideas
in future material.
251

The most important concept to understand from this material is that Harmonic Trading is
different from all other forms of Technical Analysis and Fibonacci approaches to the financial
markets. Unprecedented discoveries such as the Bat pattern, the Alternate AB=CD structures,
the 0.886 retracement, the Harmonic Trade Management System, and other techniques offer
advantages that no other technical approach offers. Simply stated, “This is not just another
Fibonacci methodology, this is Harmonic Trading.”
Best Regards,
Scott M. Carney
252
Harmonic Trading: Volume One

Carney, Scott M.
The Harmonic Trader. Nevada: HarmonicTrader.com, LLC, 1999.
Cootner, Paul H.
The Random Character of Stock Market Prices. Massachusetts: MIT Press,
1964.
Gann W. D.
How to Make Profits in Commodities. New York: New York Institute of Finance,
1942.
Gann W. D.
Tunnel Thru the Air. Pomeroy, WA: Lambert-Gann Publishing, 1927.
Gartley, H. M.
Profits in the Stock Market. Pomeroy, WA: Lambert-Gann Publishing, 1935.
Hurst, J. M.
J. M. Hurst Cycles Course. Greenville, SC: Traders Press, 1970.
Hurst, J. M.
The Profit Magic of Stock Transaction Timing. Greenville, SC: Traders Press, 1970.
Kane, Jim.
Advanced Fibonacci Trading Concepts. Tucson, AZ: KaneTrading.com, 2003.
Prechter, Robert.
Elliott Wave Principle. Gainesville, GA: New Classics Library, 1978.
253

This page intentionally left blank

255
Numbers
0.382 trailing stop, 207
0.618 constant.
See golden mean (phi)
0.886 retracement, origin of, 23
1.618 constant.
See golden ratio (Phi)
20/20 hindsight in trade execution, 181-182
A
AB=CD patterns, 41
Alternate AB=CD patterns, 62-63
Bearish AB=CD pattern, 51
Australian Dollar 15-minute chart
example, 55-56
Goldman Sachs 15-minute chart
example, 52-53
Philadelphia Gold and Silver Mining
Index daily chart example, 54
S&P 500 September 2003 Mini-
contract 60-minute chart example,
57-61
Bullish AB=CD pattern, 42
Dow Jones Industrial Average 5-minute
chart example, 47-48
Eurodollar 60-minute chart example,
Google weekly chart example, 43-45
NASDAQ 100 Continuous Mini-contract
15-minute chart example, 49-50
Butterfly pattern and, 149
Perfect AB=CD patterns, 63-68
reciprocal ratios, 41
within Bat pattern, 71
Action-Task Trading Process Model, 172-173, 178
Alternate AB=CD pattern, 4, 62-63
Alternate Bearish AB=CD pattern, 63
Alternate Bullish AB=CD pattern, 62
Amazon.com weekly chart example (reversing
failed bearish patterns), 245-246
American Express 60-minute chart example
(Bullish Butterfly pattern), 153-154
Anadarko Petroleum daily chart example (Deep
Bearish Crab pattern), 141-142
ancient examples of Fibonacci ratios, 13
angle of ascent/descent, 207
Apple 15-minute chart example (Bullish Crab
pattern), 124-125
astrology, Harmonic Trading versus, 34
Australian Dollar 15-minute chart example
(Bearish AB=CD pattern), 55-56
B
Bat pattern, 71-72
Bearish Bat pattern, 83
Coca-Cola weekly chart example, 89-90
Eurodollar 60-minute chart example,
J. P. Morgan weekly chart example,
Bullish Bat pattern, 72
British Pound 15-minute chart
example, 73-74
Chevron-Texaco daily chart example,
Dow Jones Industrial Average weekly
chart example, 75-76
Goldman Sachs daily chart example,
Swiss Franc 60-minute chart example,
Gartley pattern versus, 98
ideal Gartley patterns versus, 37
Perfect Bat pattern, 90-95

256
Harmonic Trading: Volume One
Bearish AB=CD pattern, 51
Australian Dollar 15-minute chart example,
Goldman Sachs 15-minute chart example,
Philadelphia Gold and Silver Mining Index
daily chart example, 54
S&P 500 September 2003 Mini-contract
60-minute chart example, 57-61
Bearish Bat pattern, 83
Coca-Cola weekly chart example, 89-90
Eurodollar 60-minute chart example, 86-88
J. P. Morgan weekly chart example, 84-85
Bearish Butterfly pattern, 158
Citigroup weekly chart example, 159-160
Swiss Franc 60-minute chart example,
Bearish Crab pattern, 130
Light Sweet Crude continuous contract
15-minute chart example, 133-134
NASDAQ 100 December 2003 Mini-contract
5-minute chart example, 135
Qualcomm 60-minute chart example,
Bearish Gartley pattern, 106
New Zealand Dollar 15-minute chart
example, 112-113
S&P 500 Index weekly chart example, 106
Swiss Franc 60-minute chart example,
United States Oil Fund ETF 15-minute chart
example, 110-111
Bearish Harmonic Trade Management Model, 220
Dow Jones Industrial Average Diamonds
30-minute chart example, 226-230
S&P 500 September 2003 Mini-contract
15-minute chart example, 221-225
bearish patterns
Alternate Bearish AB=CD pattern, 63
Deep Bearish Crab pattern, 140-142
ideal bearish reversals, 188-190
Perfect Bearish AB=CD pattern, 66-68
Perfect Bearish Bat pattern, 94-95
Perfect Bearish Butterfly pattern, 166-168
Perfect Bearish Crab pattern, 146-147
Perfect Bearish Gartley pattern, 118-119
reversing failed bearish patterns, 242-246
bearish projections
primary 1.618, 27
primary derived 1.13, 29
primary derived 1.27, 29
secondary derived 1.414, 31
secondary derived 2.0, 31
secondary derived 2.24, 31
secondary derived 2.618, 33
secondary derived 3.14, 33
secondary derived 3.618, 33
bearish PRZ
extreme price expansion, 200-202
price gaps in, 194-196
bearish retracements
primary 0.618, 20
primary derived 0.786, 22
primary derived 0.886, 22
secondary derived 0.382, 25
secondary derived 0.50, 25
secondary derived 0.707, 25
blowouts.
See price gaps
British Pound 15-minute chart example
Bullish Bat pattern, 73-74
Perfect Bearish Gartley pattern, 119
Bullish AB=CD pattern, 42
Dow Jones Industrial Average 5-minute
chart example, 47-48
Eurodollar 60-minute chart example, 45-46
Google weekly chart example, 43-45
NASDAQ 100 Continuous Mini-contract
15-minute chart example, 49-50
Bullish Bat pattern, 72
British Pound 15-minute chart example,
Chevron-Texaco daily chart example, 81-82
Dow Jones Industrial Average weekly chart
example, 75-76
Goldman Sachs daily chart example, 79-80
Swiss Franc 60-minute chart example, 77-78
Bullish Butterfly pattern, 150
American Express 60-minute chart example,
Petrobras daily chart example, 155-156
S&P 500 September 2009 Mini-contract
60-minute chart example, 157
S&P 500 Tracking Stock daily chart
example, 151-152
Bullish Crab pattern, 123
Apple 15-minute chart example, 124-125
General Electric 60-minute chart example,
S&P 500 September 2003 Mini-contract
10-minute chart example, 128-130

Index
257
Bullish Butterfly pattern, 150
American Express 60-minute chart
example, 153-154
Petrobras daily chart example, 155-156
S&P 500 September 2009
Mini-contract 60-minute chart
example, 157
S&P 500 Tracking Stock daily chart
example, 151-152
Crab pattern versus, 149-150
explained, 149
Perfect Butterfly pattern, 163-168
C
chaotic markets, Harmonic Trading in, 8
charts.
See price charts
checklist for trade execution, 180-181
Chevron-Texaco daily chart example (Bullish Bat
pattern), 81-82
Citigroup weekly chart example (Bearish Butterfly
pattern), 159-160
clusters.
See PRZ (Potential Reversal Zone)
Coca-Cola weekly chart example
Bearish Bat pattern, 89-90
bullish PRZ extreme price expansion, 198-199
Cootner, Paul H., 8
Crab pattern, 121
Bearish Crab pattern, 130
Light Sweet Crude continuous contract
15-minute chart example, 133-134
NASDAQ 100 December 2003
Mini-contract 5-minute chart
example, 135
Qualcomm 60-minute chart example,
Bullish Crab pattern, 123
Apple 15-minute chart example,
General Electric 60-minute chart
example, 126-127
S&P 500 September 2003
Mini-contract 10-minute chart
example, 128-130
Butterfly pattern versus, 149-150
Deep Crab pattern, 136-142
explained, 121-122
Perfect Crab pattern, 143-147
crude oil.
See Light Sweet Crude
Cycles Course (Hurst), 38
Bullish Gartley pattern, 99
Dow Jones Industrial Average Tracking
Stock daily chart example, 104
Microsoft 60-minute chart example, 105
NASDAQ 100 September 2003
Mini-contract daily chart example, 103
Newmont Mining weekly chart example,
S&P 500 June 2003 Mini-contract 5-minute
chart example, 102
Bullish Harmonic Trade Management Model, 209
General Electric daily chart example,
NASDAQ 100 December 2003 Mini-contract
30-minute chart example, 216-219
bullish patterns
Alternate Bullish AB=CD pattern, 62
Deep Bullish Crab pattern, 137-139
ideal bullish reversals, 185-187
Perfect Bullish AB=CD pattern, 64-65
Perfect Bullish Bat pattern, 91-93
Perfect Bullish Butterfly pattern, 163-165
Perfect Bullish Crab pattern, 143-145
Perfect Bullish Gartley pattern, 115-117
reversing failed bullish patterns, 235-241
bullish projections
primary 1.618, 26
primary derived 1.13, 28
primary derived 1.27, 28
secondary derived 1.414, 30
secondary derived 2.0, 30
secondary derived 2.24, 30
secondary derived 2.618, 32
secondary derived 3.14, 32
secondary derived 3.618, 32
bullish PRZ
extreme price expansion, 197-199
price gaps in, 191-193
bullish retracements
primary 0.618, 19
primary derived 0.786, 21
primary derived 0.886, 21
secondary 0.382, 24
secondary 0.50, 24
secondary 0.707, 24
Butterfly pattern, 149
Bearish Butterfly pattern, 158
Citigroup weekly chart example,
Swiss Franc 60-minute chart example,

258
Harmonic Trading: Volume One
D
Deep Bearish Crab pattern, 140-142
Deep Bullish Crab pattern, 137-139
Deep Crab pattern, 136-142
Dow Jones Industrial Average 5-minute chart
example (Bullish AB=CD pattern), 47-48
Dow Jones Industrial Average 15-minute
chart example (bearish PRZ extreme price
expansion), 201-202
Dow Jones Industrial Average Tracking Stock daily
chart example (Bullish Gartley pattern), 104
Dow Jones Industrial Average weekly chart example
Bullish Bat pattern, 75-76
ideal bullish reversals, 186-187
reversing failed bullish patterns, 236-238
Dow Jones Industrial Average Diamonds
30-minute chart example (Harmonic Trade
Management System), 226-230
E
Elliott Wave Principle (Prechter and Frost), 3, 35
Elliott Wave Theory, 3, 17
Harmonic Trading versus, 35-36
Elliott, R. N., 3, 183
Eurodollar 60-minute chart example
Bearish Bat pattern, 86-88
Bullish AB=CD pattern, 45-46
execution.
See trade execution
extension patterns, retracement patterns
versus, 122
extreme numbers, 32
extreme price expansion, 197-202
in bearish PRZ, 200-202
in bullish PRZ, 197-199
F
failed patterns
prior harmonic support as resistance,
bearish patterns, 242-246
bullish patterns, 235-241
tips for, 234
Fibonacci de Pisa, Leonardo de, 11
Fibonacci pattern alignments in Harmonic
Fibonacci Phyllotaxis, 13
Fibonacci ratios.
See also Harmonic Trading
ratios
ancient examples of, 13
explained, 12
Fibonacci Rectangles, 14-15
golden section, relationship with, 12-13
Harmonic Trading and, 5-6
Harmonic Trading ratios from, 17
human body examples, 16
natural examples of, 13-14
planetary examples of, 14
role in Harmonic Trading, 7-8
Fibonacci Rectangles, 14-15
Fibonacci sequence
natural examples of, 13
origin of, 11-12
Frost, A. J., 3, 35
G
Gann, W. D., 16, 36-37, 182-183
Gartley pattern
Bat pattern versus, 37, 98
Bearish Gartley pattern, 106
New Zealand Dollar 15-minute chart
example, 112-113
S&P 500 Index weekly chart
example, 106
Swiss Franc 60-minute chart example,
United States Oil Fund ETF 15-minute
chart example, 110-111
Bullish Gartley pattern, 99
Dow Jones Industrial Average Tracking
Stock daily chart example, 104
Microsoft 60-minute chart example, 105
NASDAQ 100 September 2003 Mini-
contract daily chart example, 103
Newmont Mining weekly chart
example, 100-101
S&P 500 June 2003 Mini-contract
5-minute chart example, 102
explained, 97-99
Perfect Gartley pattern, 114-119
Gartley, H. M., 97
General Electric 60-minute chart example (Bullish
Crab pattern), 126-127
General Electric daily chart example (Harmonic
Trade Management System), 210-215
Gilmore, Bryce, 149
goals questionnaire (trading execution), 183-184

Index
259
partial trade management, 231
S&P 500 September 2003 Mini-contract
15-minute chart example, 221-225
terminology, 205-209
time considerations in, 208-209
tips for, 231-232
Harmonic Trading
astrology versus, 34
Elliott Wave Theory versus, 35-36
explained, 7-8
Fibonacci pattern alignments in, 37-38
Fibonacci ratios and, 5-6
Gann’s approach to, 36-37
in chaotic markets, 8
Principle of Harmonicity, 38-39
psychology of, 182-183
reliability of, 4
stages of, 8-9
Harmonic Trading ratios.
See also Fibonacci ratios
0.886 retracement, origin of, 23
explained, 17
list of, 18
Pi, 34
primary 0.618 retracement, 19
primary 1.618 projection, 26
primary bearish projections, 27, 29
primary bearish retracements, 20, 22
primary bullish projections, 26, 28
primary bullish retracements, 19, 21
secondary bearish projections, 31, 33
secondary bearish retracements, 25
secondary bullish projections, 30, 32
secondary bullish retracements, 24
HarmonicTrader.com, 4
hesitation in trade execution, 177-178
Home Depot 15-minute chart example (Perfect
Bullish Crab pattern), 144-145
human body examples of Fibonacci ratios, 16
Hurst, J. M., 38, 177, 183
I
IBM weekly chart example (reversing failed bullish
patterns), 239-241
ideal Gartley pattern.
See Gartley pattern
ideal reversals, 185
ideal bearish reversals, 188-190
ideal bullish reversals, 185-187
identification.
See trade identification
Initial Profit Objective (IPO).
See IPO (Initial Profit
Objective)
See also Fibonacci ratios
ancient examples of, 13
Fibonacci Rectangles, 14-15
golden section, relationship with, 12-13
human body examples, 16
natural examples of, 13-14
planetary examples of, 14
golden number.
See golden mean (phi)
golden proportion.
See golden ratio (Phi)
golden ratio (Phi), 12.
See also Fibonacci ratios
ancient examples of, 13
Fibonacci Rectangles, 14-15
golden section, relationship with, 12-13
human body examples, 16
natural examples of, 13-14
planetary examples of, 14
golden section, 12-13
Goldman Sachs 15-minute chart example
(Bearish AB=CD pattern), 52-53
Goldman Sachs daily chart example (Bullish Bat
pattern), 79-80
Google weekly chart example (Bullish AB=CD
pattern), 43-45
groupings.
See PRZ (Potential Reversal Zone)
H
Harmonic Analysis.
See Harmonic Trading
harmonic patterns, 6, 35.
See also AB=CD
pattern; Bat pattern; Butterfly pattern; Crab
pattern; Gartley pattern
Fibonacci pattern alignments in, 37-38
Potential Reversal Zone (PRZ), 39-40
prior harmonic support as resistance,
reversing failed patterns, 233-234
bearish patterns, 242-246
bullish patterns, 235-241
tips for, 234
as specific price structures, 35
Harmonic Trade Management System
Bearish Harmonic Trade Management
Bullish Harmonic Trade Management
Dow Jones Industrial Average Diamonds
30-minute chart example, 226-230
General Electric daily chart example,
NASDAQ 100 December 2003 Mini-contract
30-minute chart example, 216-219
origin of, 203-205

260
Harmonic Trading: Volume One
Intel 60-minute chart example (reversing failed
bearish patterns), 243-244
Intel 60-minute chart example (Perfect Bullish Bat
pattern), 92-93
IPO (Initial Profit Objective)
defined, 205-206
portioning, 206
trend lines and, 207
J–K–L
J. P. Morgan weekly chart example (Bearish Bat
pattern), 84-85
Japanese Yen 15-minute chart example (Perfect
Bullish Butterfly pattern), 164-165
journals.
See trade journals
Kane, Jim, 23, 177
Liber Abaci (Fibonacci), 11
Light Sweet Crude continuous contract 15-minute
chart example (Bearish Crab pattern), 133-134
M–N
management.
See Harmonic Trade Management
System
Microsoft 60-minute chart example
bearish PRZ price gaps, 195-196
Bullish Gartley pattern, 105
NASDAQ 100 December 2003 Mini-contract
5-minute chart example (Bearish Crab
pattern), 135
NASDAQ 100 December 2003 Mini-contract
15-minute chart example (Deep Bullish Crab
pattern), 138-139
NASDAQ 100 December 2003 Mini-contract
30-minute chart example (Harmonic Trade
Management System), 216-219
NASDAQ 100 March 2004 Mini-contract
10-minute chart example (Perfect Bullish
AB=CD pattern), 65
NASDAQ 100 Continuous Mini-contract 15-minute
chart example (Bullish AB=CD pattern), 49-50
NASDAQ 100 Continuous Mini-contract
15-minute chart example (prior harmonic
support as resistance), 247-249
NASDAQ 100 September 2003 Mini-contract daily
chart example (Bullish Gartley pattern), 103
NASDAQ 100 Tracking Stock 5-minute chart
example (Perfect Bearish Bat pattern), 95
natural examples of Fibonacci ratios, 13-14
New Zealand Dollar 15-minute chart example
(Bearish Gartley pattern), 112-113
Newmont Mining weekly chart example (Bullish
Gartley pattern), 100-101
Nokia 5-minute chart example (Perfect Bearish
Crab pattern), 147
O–P
opportunity cost, 173-174
partial trade management, 231
pattern identification, trade execution versus, 181
patterns.
See harmonic patterns
Pepsi 15-minute chart example (ideal bearish
Perfect AB=CD pattern, 63-68
Perfect Bat pattern, 90-95
Perfect Bearish AB=CD pattern, 66-68
Perfect Bearish Bat pattern, 94-95
Perfect Bearish Butterfly pattern, 166-168
Perfect Bearish Crab pattern, 146-147
Perfect Bearish Gartley pattern, 118-119
Perfect Bullish AB=CD pattern, 64-65
Perfect Bullish Bat pattern, 91-93
Perfect Bullish Butterfly pattern, 163-165
Perfect Bullish Crab pattern, 143-145
Perfect Bullish Gartley pattern, 115-117
Perfect Butterfly pattern, 163-168
Perfect Crab pattern, 143-147
Perfect Gartley pattern, 114-119
Persimmon Effect (hesitation in trade execution),
Petrobras daily chart example (Bullish Butterfly
pattern), 155-156
phi (golden mean).
See golden mean (phi)
Phi (golden ratio).
See golden ratio (Phi)
Philadelphia Gold and Silver Mining Index daily
chart example (Bearish AB=CD pattern), 54
Pi, 17, 34
planetary examples of Fibonacci ratios, 14
portioning the IPO (Initial Profit Objective), 206
Potential Reversal Zone.
See PRZ
PPZ (Profit Protection Zone)
defined, 206
time considerations, 208-209
Prechter, Robert, 3, 35
price action
ideal reversals, 185
ideal bearish reversals, 188-190
ideal bullish reversals, 185-187
reversals in, 172
time considerations in, 208-209

Index
261
extreme price expansion, 197-202
price gaps, 191-196
psychological price levels, 129
psychology of Harmonic Trading, 182-183
Q–R
Qualcomm 60-minute chart example (Bearish
Crab pattern), 131-132
questionnaire (trading execution goals), 183-184
The Random Character of Stock Market Prices
Random Walk Theory, 8
ratio alignments, 129
ratios.
See Fibonacci ratios; golden mean (phi);
golden ratio (Phi); Harmonic Trading ratios
reciprocal ratios (AB=CD pattern), 41
Redhat, origin of Harmonic Trade Management
requirements checklist for trade execution,
resistance, prior harmonic support as, 246-250
retracement patterns, extension patterns
versus, 122
reversals
ideal reversals, 185-190
possibilities in PRZ, 174-175
role in trade execution, 172
time considerations in, 208-209
reversing failed patterns, 233-234
bearish patterns, 242-246
bullish patterns, 235-241
tips for, 234
rules in trade execution, importance of, 171
S
S&P 500 Index 5-minute chart example (Perfect
Bearish Butterfly pattern), 167-168
S&P 500 Index weekly chart example (Bearish
Gartley pattern), 106
S&P 500 June 2003 Mini-contract 5-minute chart
example (Bullish Gartley pattern), 102
S&P 500 March 2010 Mini-contract 60-minute
chart example (Perfect Bearish AB=CD
pattern), 67-68
S&P 500 September 2003 Mini-contract
10-minute chart example (Bullish Crab
pattern), 128-130
S&P 500 September 2003 Mini-contract
15-minute chart example (Harmonic Trade
Management System), 221-225
as trading signal, 38
warning signs, 190
extreme price expansion, 197-202
price gaps, 191-196
price charts, role in Harmonic Trading, 7
price gaps, 191-196
in bearish PRZ, 194-196
in bullish PRZ, 191-193
price measurements, time measurements
versus, 78
price of technical information, 173-174
price structures
Elliott Wave Theory versus Harmonic
Potential Reversal Zone (PRZ), 39-40
specificity of harmonic patterns, 35
primary projections
1.618, 26
bearish 1.618, 27
bullish 1.618, 26
derived bearish 1.13, 29
derived bearish 1.27, 29
derived bullish 1.13, 28
derived bullish 1.27, 28
primary retracements
0.618, 19
bearish 0.618, 20
bullish 0.618, 19
derived bearish 0.786, 22
derived bearish 0.886, 22
derived bullish 0.786, 21
derived bullish 0.886, 21
Principle of Harmonicity, 38-39
prior harmonic support as resistance, 246-250
The Profit Magic of Stock Transaction Timing
Profit Protection Zone (PPZ)
defined, 206
time considerations, 209
Profits in the Stock Market (Gartley), 97
PRZ (Potential Reversal Zone), 3, 39-40
defined, 205
ideal reversals, 185
ideal bearish reversals, 188-190
ideal bullish reversals, 185-187
trade execution in, 174
hesitation, 177-178
initial test, 176-177
reversal possibilities in, 174-175
tips for, 175-176

262
Harmonic Trading: Volume One
S&P 500 September 2003 Mini-contract
60-minute chart example
Bearish AB=CD pattern, 57-61
S&P 500 September 2009 Mini-contract
60-minute chart example (Bullish Butterfly
pattern), 157
S&P 500 Tracking Stock 5-minute chart example
(Perfect Bullish Gartley pattern), 116-117
S&P 500 Tracking Stock daily chart example
(Bullish Butterfly pattern), 151-152
secondary retracements
bullish 0.382, 24
bullish 0.50, 24
bullish 0.707, 24
derived bearish 0.382, 25
derived bearish 0.50, 25
derived bearish 0.707, 25
secondary derived projections
bearish 1.414, 31
bearish 2.0, 31
bearish 2.24, 31
bearish 2.618, 33
bearish 3.14, 33
bearish 3.618, 33
bullish 1.414, 30
bullish 2.0, 30
bullish 2.24, 30
bullish 2.618, 32
bullish 3.14, 32
bullish 3.618, 32
Semiconductor Holder’s Trust 10-minute
chart example (prior harmonic support as
resistance), 248
shell spirals, Fibonacci Rectangles and, 14-15
signals.
See trading signals
SLZ (Stop Loss Zone), 207
Sourbey, Bill, 172
spirals
classifying with Fibonacci sequence, 13
Fibonacci Rectangles and, 14-15
Standard & Poor’s.
See S&P
Stop Loss Zone (SLZ), 207
Swiss Franc 60-minute chart example
Bearish Butterfly pattern, 161-162
Bearish Gartley pattern, 108-109
Bullish Bat pattern, 77-78
T
T-bar (Terminal Price Bar), 185, 234
Target Reversal Zone.
See PRZ (Potential
Reversal Zone)
technical information, price of, 173-174
Terminal Price Bar (T-bar), 185, 234
time considerations in Harmonic Trade
time measurements, price measurements
versus, 78
trade execution, 9
20/20 hindsight, 181-182
Action-Task Trading Process Model, 172-173
goals questionnaire, 183-184
opportunity cost, 173-174
pattern identification versus, 181
in PRZ (Potential Reversal Zone), 174
hesitation, 177-178
initial test, 176-177
reversal possibilities in, 174-175
tips for, 175-176
psychology of, 182-183
requirements checklist, 180-181
reversals in price action, 172
rules, importance of, 171
trade journals, 179-180
trade identification, 9
trade journals, 179-180
trade management, 9.
See also Harmonic Trade
Management System
trading psychology, 182-183
trading signals, sources of, 38
trading tactics, importance of, 171
trailing stops, 207
trend lines, 207
The Tunnel Thru the Air (Gann), 37
U–Z
United States Oil Fund ETF 15-minute chart
example (Bearish Gartley pattern), 110-111
Wal-Mart daily chart example (bullish PRZ price
extreme price expansion, 197-202
price gaps, 191-196
Document Outline
- Contents
- About the Author
- Introduction
- Chapter 1 Harmonic Trading
- Chapter 2 Fibonacci Numbers
- Chapter 3 Pattern Identification
- Chapter 4 The AB=CD Pattern
- Chapter 5 The Bat Pattern
- Chapter 6 The Gartley Pattern
- Chapter 7 The Crab Pattern
- Chapter 8 The Ideal Butterfly Pattern
- Chapter 9 Trade Execution
- Chapter 10 Price Action in the Potential Reversal Zone (PRZ)
- Chapter 11 The Harmonic Trade Management System
- Chapter 12 Pattern Violations
- Conclusion
- Bibliography
- Index
Wyszukiwarka
Podobne podstrony:
Wall Street Meat My Narrow Escape from the Stock Market Grinder
Identifying Active Trading Strategies in the Bitcoin Market
[Форекс] The Cost of Technical Trading Rules in the Forex Market
CRASHES AND CRISES IN THE FINANCIAL MARKETS, ekonomia III, stacjonarne
CRASHES AND CRISES IN THE FINANCIAL MARKETS
Lee, Fok And Liu Explaining Intraday Pattern Of Trading Volume From The Order Flow Data
Scott Baker Drink the Fire from the Flames
O'Reilly How To Build A FreeBSD STABLE Firewall With IPFILTER From The O'Reilly Anthology
big profits from a very dirty business
Aftershock Protect Yourself and Profit in the Next Global Financial Meltdown
FreeNRG Notes from the edge of the dance floor
(doc) Islam Interesting Quotes from the Hadith?out Forgiveness
Tales from the Arabian Nights PRL2
Programing from the Ground Up [PL]
Programming from the Ground Up
Make Your Resume Stand out From the Pack
There are many languages and cultures which are disappearing or have already disappeared from the wo
Olcott People From the Other World
III dziecinstwo, Stoodley From the Cradle to the Grave Age Organization and the Early Anglo Saxon Bu
więcej podobnych podstron