
67
Advances in Production Engineering and Management
ISSN 1854-6250
Volume 8 | Number 2 | Year 2013 | pp 67–77
Journal homepage: apem-journal.org
APEM
journal
Recycling of flame retardant plastics from WEEE,
technical and environmental challenges
Tange, L.
a,*
, Van Houwelingen, J.A.
b
, Peeters, J.R.
c
, Vanegas, P.
c
a
ICL-IP Europe and EFRA,Frankrijkweg 6, 4538 BJ, Terneuzen, Netherlands
b
Recycling Consult BV, Coördinator REWARD Eindhovenseweg 29A, 5633 BD, Eindhoven, Netherlands
c
KU Leuven, Department of Mechanical Engineering, Center for Industrial Management, 3001 Heverlee, Belgium
A B S T R A C T
A R T I C L E I N F O
The European Flame Retardant Association (EFRA) combines leading compa-
nies offering the largest spectrum of flame retardants (FRs). EFRA conducted
many studies on the recycling of FRplastics. This study concerns the recycling
of plastics from liquid crystal displays (LCDs) and addresses the RoHS and
WEEE directives (Restriction on Hazardous Substances and Waste Electrical
and Electronic Equipment), requiring a higher tonnage of recycled plastics.
Recycling standards are developed within the committee IEC TC111. A new
technical report IEC/TR 62635 Ed1.0: “Guidelines for End-of-Life information
provision from manufacturers and recyclers, and for recyclability rate calcula-
tion of Electrical and Electronic Equipment”, aims for better and higher quality
of recycled materials. EFRA cooperated with REWARD, a project in the ECO-
INNOVATION program of FP7, with partners Recycling Consult, Coolrec/PHB
and BRGM. Due to higher external fire safety requirements for TV housings in
Europe, more FR-plastics need to be recycled following the recast of the WEEE
directive. As a consequence WEEE plastics need to be processed by mechanical
recycling instead of energy recovery. The EFRA and REWARD study describe
composition, characterization, identification, size reduction and separation
techniques. This article provides guidance to achieve the required plastic qual-
ities and its limitations due to separation constraints and miscibility problems
of the different plastics. A separation route on paper is developed for plastics
from back covers of LCDs. It is found that a combination of mild size reduction,
density separation
and sensor
based
sorting gives
the
best results. Fractions are
tested for
their
miscibility with
virgin
plastics
by
producers.
The
findings
are
of
importance
since
presently
solutions
for
FR-plastic
separation
are
hardly
offered.
© 2013 PEI, University of Maribor. All rights reserved.
Keywords:
Flame retardant plastics
Size reduction
Separation
WEEE
Sensor based sorting
*Corresponding author:
Tange@icl-ip.eu
(Tange, L.)
1. Introduction
EFRA combines leading companies that manufacture and market FRs in Europe [1, 2]. EFRA ac-
tivities are committed to improve the level of fire safety. EFRA is a Sector Group of Cefic, the
European Chemical Industry Council. EFRA aims to align itself with the industry it serves, and
covers all types of flame retardants: substances based on bromine, chlorine, phosphorus, nitro-
gen and inorganic compounds. EFRA organisation is centered around four application Forums:
Upholstered Furniture & Textiles (UF&T), Electrical and Electronic Devices (E&E), Building,
Construction and Transportation. These Application Forums are complemented with ad-hoc
working groups, addressing regulatory or substance-specific issues as they arise, as well as a
Product Stewardship (PST) group. Recent examples of activities include: advocacy on the revi-

Tange, Van Houwelingen, Peeters, Vanegas
68
Advances in Production Engineering & Management 8(2) 2013
sion of the EU RoHS directive revision [3], VECAP (Voluntary Emissions Control Action Program)
and studies about the End-of-Life phase of products containing FRs such as the recycling of
FPDs. By bringing together the different players in the relevant value chains, the EFRA working
groups allow to look for improved and sustainable fire safety solutions and to protect the public
and the environment. EFRA is seeking for science based decisions from its members and from
other stakeholders like regulatory bodies or NGOs, to maintain or improve the level of fire safety
which is needed with current modern materials used in our day to day life. More information can
be found in reference [4] or contact the authors.
Recycling Consult is a consulting company founded in 2005 specialized in recycling and en-
ergy. Its director (second author of the article) has a background in mining, mineral processing,
recycling and metallurgy. He has been a consultant for Philips Mirec, the waste handling section
for WEEE, for the European Aluminum Association (EAA) and for a range of recycling compa-
nies. Currently various projects are running in Europe and in the USA. REWARD [5] is a project
in the Eco-Innovation program with the partners Dolphin Metals, Coolrec and Bureau de Re-
cherche Gologiques et Minières (BRGM) in Orléans investigating smart size reduction and sepa-
ration methods for WEEE. The LCD recycling project is running in cooperation with EFRA and its
experts on flame retardants in plastics and the plastic manufacturers. PRIME is a similar project
on LCD recycling running concurrently in Belgium but with focus on the business model disas-
sembly including the economics.
2. RoHS and WEEE recast
The European Union has adopted legislation that establishes the framework for the management
of electronic and electrical waste. The legislation has been subject to a recast or revision with a
view to update and clarifies the legal provisions.
2.1 RoHS recast
In order to avoid the uncontrolled or diffused release into the environment of dangerous sub-
stances during recycling, the European Union adopted the directive on the restriction of certain
hazardous substances in electrical and electronic equipment, better known as the RoHS Direc-
tive. The RoHS Directive restricts the use of lead, mercury, cadmium, hexavalent chromium,
PBBs, and PBDEs in electronic and electrical equipment. The revised RoHS Directive was
adopted on June 8, 2011 and it repeals the original RoHS Directive which has regulated hazard-
ous substances in electrical and electronic equipment since June 2006. No changes were made to
the list of restricted substances, so that substances used in electrical and electronic equipment
today, such as brominated flame retardants, can continue to be used.
The revised RoHS introduces a methodology for substance restrictions and opens the scope
now covering all electrical and electronic equipment except for equipment that is specifically
excluded.
The European Commission is currently working with Member States to develop implementa-
tion guidelines and a methodology for restricting substances. The Commission has indicated that
HexaBromoCycloDodecane (HBCD) (minor used in Polystyrene for making for example electrical
switch boxes) will be one of the substances that will be evaluated first under this methodology. A
link to the Commission website on RoHS can be found in reference [3].
2.2 WEEE recast
The directive on the waste of electrical and electronic equipment (WEEE directive) aims to pre-
vent the production and disposal of WEEE through reuse and recycling targets. Moreover, it is
set up to improve the environmental performance of all operators involved in the life cycle of
electrical and electronic equipment.
The WEEE requires Member States to ensure that producer-financed systems are set up to
separately collect, treat, recover and dispose of WEEE.
In June 2012 the revised WEEE directive was adopted. Under the new directive, member
states must collect annually 45 % of the average weight of electrical and electronic equipment

Recycling of flame retardant plastics from WEEE, technical and environmental challenges
Advances in Production Engineering & Management 8(2) 2013
69
placed on their national markets four years after its entry into force.
Three years later, member states are to achieve a 65 % collection rate. Some EU states where
consumers use fewer electronic devices may achieve the targets with some flexibility. In 2010
plastics from WEEE were recycled around 13 % as communicated by Plastics Europe. Moreover,
the directive establishes the producer responsibility, as a means of encouraging design and pro-
duction of EEE which take into full account and facilitate its repair, up-grading, re-use, disas-
sembly and recycling. A link to the Commission website on WEEE can be found in reference [6].
2.3 Recycling standards
A recycling standard is approved within the global International Electrotechnical Commission
(IEC) TC111 in the form of a technical report (TR) IEC/TR 62635 Ed. 1.0: Guidelines for End of
Life information provision from manufacturers and recyclers, and for recyclability rate calcula-
tion of Electrical and Electronic Equipment. It is important that for plastics recycling standards
are produced because the plastics recycling will become more trustfully and can produce higher
qualities of plastics for higher end applications which is difficult to do today.
3. Recycling plastics from LCDs
The cooperation between EFRA and REWARD has resulted into a joint project which started in
2011 to investigate and define the plastic composition in flat panel displays and present solu-
tions for mechanical recycling with best available technology (BAT).
Due to higher fire safety requirements for TV set housings sold in the EU, they need to be
made out of materials such as plastics containing FRs in addition to the WEEE Directive recast
imposing higher recycling rates. Therefore WEEE plastics need to be separated with mechanical
recycling techniques as opposed to energy recovery. It is the intention of the EFRA recycling
study for plastics containing flame retardants from LCDs to give guidance on achieving the de-
sired results and to communicate possible limitations.
In order to set up a scheme for size reduction and separation a comprehensive data col-
lection is organized comprising the brands of FPDs, serial numbers, weight and diameter of a full
LCD, colour and density of the back cover plastics, a NIR and XRF scan of the back cover plastic
to determine type and FR presence, for black plastics a FTIR scan, this from different equipment
suppliers with various libraries (Table 3). The information is matched with information from
original equipment suppliers and plastic manufacturers. Additional information is used in the
study from the concurrently running project PRIME.
3.1 Main issues and challenges for plastics recycling
The main issues today in plastics recycling are:
• The small scale of economy of recycling facilities which is in the range of 5000 tons/yr to a
maximum of 20.000 tons/yr of recycled plastics as output. Where plastics manufacturers
produce in the range of 200.000–500.000 tons/yr of plastics. This is a ratio of 40–100
times more. Markets will develop better with higher end-of-life volumes.
• The complexity of mixtures and of the many different types of plastics used in WEEE. The
main barrier is in the black colour combined with the lack of sorting techniques to be able
to separate every plastic type into the individual plastic stream for a high end application.
If techniques do exist at all, then high investments are needed compared to the relatively
small yield of recyclate produced. Better sorting techniques are necessary.
• Lack of understanding on the type of plastics and flame retardants used and in various ap-
plications which quantities do they appear at the recycle facility. More analyses are
needed.
• The lack of understanding of the effects of mixing of the different plastics and the conse-
quences on the physical properties after recycling. A miscibility chart is necessary.

Tange, Van Houwelingen, Peeters, Vanegas
70
Advances in Production Engineering & Management 8(2) 2013
3.2 Current situation in Europe
FPDs are collected separately from other WEEE categories. In a total batch of 623 FPDs we found
500 LCDs, 94 laptops and 29 plasma screens. TVs are kept separate. The LCDs that are contained
in this batch have mercury lamps, a RoHS substance to be kept and processed separately. A
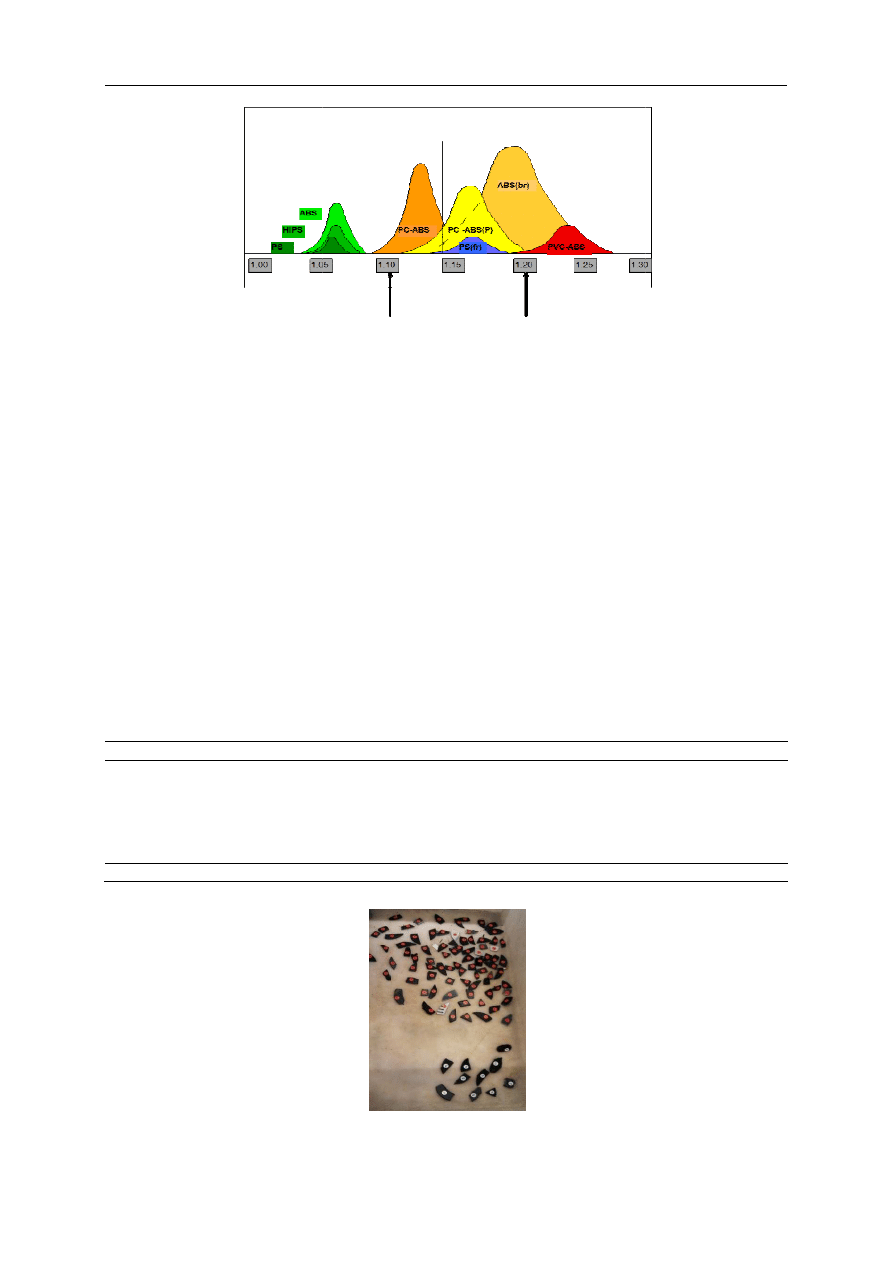
photo (Fig. 1) is showing the collected stacks of LCDs on pallets ready for transport. Selective
collection is widely practiced in recycling activities, well known examples are bottle banks, pa-
per, batteries etc. and is highly beneficial to recycling and the material recovery. The required
collection procedure provides the advantage for separation options to sort the relatively less
complex mix of plastics after shredding. A similar situation is found for polystyrene from selec-
tively collected refrigerators. Another example is the separate processing of toner cartridges
from printers.
Fig. 1 Selectively collected FPDs from NW-France and Flanders
Selective collection systems are beneficial to recycling and facilitate the relative clean collection
of these batches of LCDs.
The LCDs are prepared for treatment, the plasma displays and TVs containing a cathode ray
tube are treated separately. The pedestal and electrical cords are disconnected. Current practice
consists of two principal ways of treatment: disassembly or shredding. In this par-ticular case of
study the LCDs are shredded. A typical sequence is given in Table 1 with magnetic and eddy
current fractions.
The plastic mix is analyzed for its contents with a lab sink and float test and the expected sink
and float fractions are in Table 1. After magnetic and eddy current separation a plastic mix re-
mains untreated. This mix currently is the subject for this study. The produced particle size dis-
tribution with a d
50
of 45 mm is the starting point.
Table 1 Example of fraction composition after shredding LCDs
Category
Fraction (%)
Separator
Ferrous metals
27.6
1
st
magnet
Non-ferrous metals
11.2
eddy current
Printed circuits
15.8
2
nd
magnet
PS
8.0
sink/float
ABS+FR
25.9
sink/float
PP+PE
0.5
sink/float
Mercury
< 0.05
filter
Waste
11.0
bag filter
Total product
99.95
4. Sampling LCDs including the FR-plastics
Part of the study is the analysis of a total sample of 623 FPDs taken in the area North West of
France and Flanders in Belgium. This batch contains 500 LCDs, 94 laptops and 29 plasma dis-
plays. The volume of the sample is arbitrary. From each LCD a photo is taken of the front with

Recycling of flame retardant plastics from WEEE, technical and environmental challenges
Advances in Production Engineering & Management 8(2) 2013
71
the brand name (Table 2) and of the back with the tag numbers. A material sample is taken from
the back cover for type analyses and material density. A list of the collected data is composed
consisting of brand, diagonal width, weight of full LCD, density and plastic type of back cover
plastic and additive (FR based on bromine, Br, or phosphor, P). Relations between brands and
other features are documented. Information from plastic producers and original equipment
manufacturers (OEMs) is collected; the data is used for cross checking and control.
5. Measurements
Some LCD’s are examined for their full composition in plastics, metals, printed circuits and other
components and materials. A typical composition is given by Salhofer [7].
The sample of 500 LCD back covers is analyzed with a focus on its separation after granula-
tion. The physical properties like density, plastic type, and additives are determined. The density
is determined with an air pycnometer. Plastic types are determined with a NIR device. Black
plastic types are determined with an FTIR device [8]. Different plastic library scans are used. It
appears that analytical equipment such as NIR and FTIR have to be stored with the known plas-
tics examined in order to give the device a closer range of recognition; however, this is not al-
ways possible as complete libraries are not always available. The additive Br-FR is determined
with a calibrated XRF device but sometimes also found via FTIR or NIR. Other additives such as
phosphor sometimes are determined with NIR and FTIR depending on their libraries contained.
Different analytical laboratories and companies are involved in the analyses making cross con-
trol possible.
From these collected data a strategy for separation is determined. A description of how to
analyze WEEE with a focus on shredding and separation is given in Menad [9].
It appears that manufacturers have produced LCDs with certain preferred plastics and addi-
tives for the back covers. These data are helpful in the full interpretation of the 500 LCD sample.
For the LCD back cover the brands Grandin, Samsung, Toshiba and LG predominantly use high
impact polystyrene (HIPS) (sometimes with Br-FR), and Philips and Sony use HIPS/PPE or PC-
ABS (with P-FR). Producers of these plastics are Bayer, SABIC and Styron and they contributed
to important product data generation within this project.
Table 2 Brands in descending frequency in a batch of 500 LCDs
Brand
(%)
Samsung
17.8
Philips
17.6
LG
7.6
Toshiba
5.8
Sony
4.6
Grandin
4.4
Thomson
4.2
Sharp
4.0
Funai
2.4
Sum
68.4
Other
31.6
Total
100.0
5.1 Results and interpretation
The plastics of the back covers are analyzed with FTIR, sliding spark and a pyknometer. A typical
result is shown in Table 3. It depends on the library contained in the FTIR device what type of
plastic is given. P and Br often are recognized. A triple check of the results gives assurance, this
correlated with information given by manufacturers of LCDs and plastic producers.
The LCD brands found are listed in Table 2. In total 75 different brands are found. Samsung is
the most frequent with 17.8 % and Philips is second with 17.6 % in Northern-France and Flan-
ders. In total 9 brands have a frequency of more than 2 % with a total of 68.4 %. The other
brands (66 in total) have a lower frequency than 2 % and represent a total of 31.6 %.

Tange, Van Houwelingen, Peeters, Vanegas
72
Advances in Production Engineering & Management 8(2) 2013
The weight of one full LCD varies from 1.5 kg to 46 kg (without pedestal). The density for the
plastics for the back cover range from 1.03 g/cm
3
to 1.25 g/cm
3
. Sorting the excel list of 500 back
cover samples to density results in a split or separation in HIPS-PPE and PC-ABS with phosphor
FRs. Both fractions of HIPS and ABS can contain brominated FRs.
Further sorting into brominated and non-brominated plastics results in an almost perfect
split in HIPS (no Br-FR), HIPS (with Br-FR) and PC-ABS (with or without P-FR). Due to analytical
reasons with the FTIR so far no guaranteed HIPS/PPE differentiating from HIPS could be de-
fined. This offers the possibility to set a scheme of sorting starting either with density or with
XRF sensor sorting. The latter with the advantage of creating a batch of HIPS with Br-FR. Density
sorting after that gives the split in HIPS (no Br-FR) and PC-ABS. The HIPS-PPE with P ends in the
lower density range.
The basic mixture of plastics consists of 2 types: HIPS (w/o Br-FR), PC-ABS (w/o Br-FR).
Other plastics found are in one brand ABS/PMMA plus PMMA from the front panel (seems not
evident), ABS, SAN, HIPS/PPE and variations of HIPS and PC-ABS. NIR sorting can be used to
scalp coloured plastic contaminants in one step prior to further sorting. However, colours are
mostly black (444, i. e., > 93 %), other colours (32, i. e., < 7 %) found are white, blue and grey.
NIR sensor sorting has the disadvantage of detecting only coloured plastics; black plastics can be
recognized, this is depending on the soot level. Recent developments are promising for the fast
and automatic detection of black plastics with SWIR (Short Wave Infra-Red). Presently a project
is running by RTT, EVK and Pyral [11] in the Eco-Innovation program of EACI.
The approach of separation therefore is twofold based on the properties density and addi-
tives. The sequence XRF (for the HIPS with Br-FR – blue in Fig. 2) followed by density as second
separation gives the fractions PC-ABS and HIPS (w/o Br-FR). Separations are never perfect. Im-
perfections are the cross contamination of other plastics in either fraction. Nevertheless density
separation tests show a good separation between HIPS and PC-ABS for the back covers.
Table 3 Extract of table of 500 LCD back covers. The columns give the brand name, sample nr, density
(g/cm
3
), Br content (nd = not detected), P content, FTIR lab 1, FTIR lab 2, conclusion authors, lab 3 (sliding
spark) and the last column with the measured P content in ppm.
Bluesky
324 1.204 nd P
Polycarbonaat/Triphenylphosphate
(80/20)
PC/ABS PC/ABS
PC/ABS
10000
Philips
329 1.199 nd P
Polycarbonaat/Triphenylphosphate
(80/20)
PS
?
PC/ABS
10000
Philips
338 1.197 nd P
Polycarbonaat/Triphenylphosphate
(80/20)
PC
PC/ABS
PC/ABS
6000
Sony
367 1.100 nd P PPO (possibly with PS)
HIPS
HIPS
PC/ABS
7000
Grundig
368 1.217 nd P
Polycarbonaat/Triphenylphosphate
(80/20)
PC/ABS PC/ABS
PET
8000
Sony
374 1.200 nd P
Polycarbonaat/Triphenylphosphate
(80/20)
PC/ABS PC/ABS
PC/ABS
7000
Sony
377 1.130 nd P PPO (possibly with PS)
HIPS
HIPS
PC/ABS
8000
Sony
392 1.220 nd P
Polycarbonaat/Triphenylphosphate
(80/20)
PC/ABS PC/ABS not measured
Philips
394 1.223 nd P
Polycarbonaat/Triphenylphosphate
(80/20)
PC/ABS PC/ABS not measured
5.2 Sorting and separation
The plastic material mix from shredded LCDs contains more than the two predominant types of
main plastics. This mixture needs to be classified before separation. The material typically has a
particle size of 45 mm. The mixture contains beside the plastics still some metals that were
missed by the magnets and eddy current. Other metals like stainless steel must be removed.
Foils, dust, printed circuits (and its plastics) and the Indium-Tin-Oxide (ITO) bearing laminate
layer need to be removed. A possibility is air classification and metal detection, this can be com-
bined with density sorting [12]. In a second step the plastics PS and PC-ABS can be separated
(Fig. 2) [13]. A typical break down after density separation of an intermediate fraction is given in
Table 4.
Recycling of flame retardant plastics from WEEE, technical and environmental challenges
Advances in Production Engineering & Manag
Fig. 2
Recent developments in electronic sorting open a range of possibilities for sorting plastics.
Properties like colour, type and additive are the
wood, fibers, cartons like tetrapack and some brominated plastics are recognized. Combined
with traditional sorting techniques as sink
be produced.
For this study separation tests have been performed with a selected batch
from back
covers with
known properties
NIR sorting on coloured plastics provides information of the full com
(Table 6). The separator offers different options for sorting whether to sort 1 polymer in 1 run,
or 2 different polymers in 1 run. The preset library recognizes qualitatively the full content of
the input mix, thus offering the o
Systems are implemented, e.
ble to separate a group of 2 or more foreign polymers from the targeted HIPS and PC
step (scalping). One run through
type of plastic. More runs are necessary unti
tor is switched to the next type. The strategy is to reach for a high grade of the targeted
and increase recovery in successive runs. The composition is measured with each run, the first
type is for the most abundant, via a decision algorithm the separator switches to the next type.
Table 4
LCD plastic fraction
Fraction
Fraction
Fraction
Dust
Float
Screen – 1 mm
Total
Fig. 3 Separation of black plastics labeled red (bromine) and
white (no bromine) with XRT sensor based sorting
Recycling of flame retardant plastics from WEEE, technical and environmental challenges
Management 8(2) 2013
Density distribution most common plastics [12]
Recent developments in electronic sorting open a range of possibilities for sorting plastics.
r, type and additive are the criteria for sorting. Even different types
etrapack and some brominated plastics are recognized. Combined
with traditional sorting techniques as sink-float, electrostatic and others, acceptable grades can
this study separation tests have been performed with a selected batch
known properties
with
an XRF
sensor
separator.
Results are
red plastics provides information of the full composition of the input mix
). The separator offers different options for sorting whether to sort 1 polymer in 1 run,
or 2 different polymers in 1 run. The preset library recognizes qualitatively the full content of
the input mix, thus offering the option for control and sampling.
e. g., at the Veolia plant in Angers (F). Applications are also poss
ble to separate a group of 2 or more foreign polymers from the targeted HIPS and PC
step (scalping). One run through the separator often is not sufficient for the full recovery of one
type of plastic. More runs are necessary until the targeted type is fully depleted and the separ
tor is switched to the next type. The strategy is to reach for a high grade of the targeted
and increase recovery in successive runs. The composition is measured with each run, the first
type is for the most abundant, via a decision algorithm the separator switches to the next type.
Table 4 Typical separation with density salts
Density (g/l)
1030
1170
1170
1350
+1350
Separation of black plastics labeled red (bromine) and
(no bromine) with XRT sensor based sorting
The plastic density overlap PROBLEM
Recycling of flame retardant plastics from WEEE, technical and environmental challenges
73
Recent developments in electronic sorting open a range of possibilities for sorting plastics.
criteria for sorting. Even different types of
etrapack and some brominated plastics are recognized. Combined
float, electrostatic and others, acceptable grades can
this study separation tests have been performed with a selected batch of black particles
Results are
shown
in
Fig. 3.
ition of the input mix
). The separator offers different options for sorting whether to sort 1 polymer in 1 run,
or 2 different polymers in 1 run. The preset library recognizes qualitatively the full content of
at the Veolia plant in Angers (F). Applications are also possi-
ble to separate a group of 2 or more foreign polymers from the targeted HIPS and PC-ABS in one
the separator often is not sufficient for the full recovery of one
pleted and the separa-
tor is switched to the next type. The strategy is to reach for a high grade of the targeted plastic
and increase recovery in successive runs. The composition is measured with each run, the first
type is for the most abundant, via a decision algorithm the separator switches to the next type.
(%)
24.0
40.6
9.4
2.5
6.7
16.9
100.0

Tange, Van Houwelingen, Peeters, Vanegas
74
Advances in Production Engineering & Management 8(2) 2013
Table 5 Performance X-Ray sensor sorter (wt %)
XRF Sensor
Accept
Reject
Input
Brominated
2.2
86.7
16.5
Non - Br
97.8
13.3
83.5
Recovery Br
11.0
89.0
100.0
Rec Non - Br
97.3
2.7
100.0
Balance
83.0
17.0
100.0
A test run was made with a XRF sorter. Black plastic particles are labeled brominated and non-
brominated. The results of the separation are in Table 5 and represent the number of particles in
the accepted and rejected fraction. The threshold in this case is 1 % Br in plastic.
The collection of data offers a strategy for separation. It appears from analyses that HIPS can be
either brominated or not and PC-ABS contains phosphor offering a perfect set for separation.
The additives Br and P are separated preferably; cross contamination is a disadvantage for
granulation and re-moulding. The sequence is determined partly by economic requirements.
Table 6 Input arbitrary plastic mix NIR sorter (Courtesy RTT-Zittau)
Type
Counts
(%)
ABS
52246
65.15
PA
129
0.16
PBT
39
0.05
PC
276
0.34
PE
142
0.18
PET
308
0.38
PMMA
66
0.08
POM
277
0.35
PP
66
0.08
HIPS
10080
12.57
PC+ABS
15159
18.90
PVC
161
0.20
PUR
1
0.00
PPE+SB
1144
1.43
PVC+ABS
51
0.06
TETRA
34
0.04
PAPER
20
0.02
Total
80199
100.0
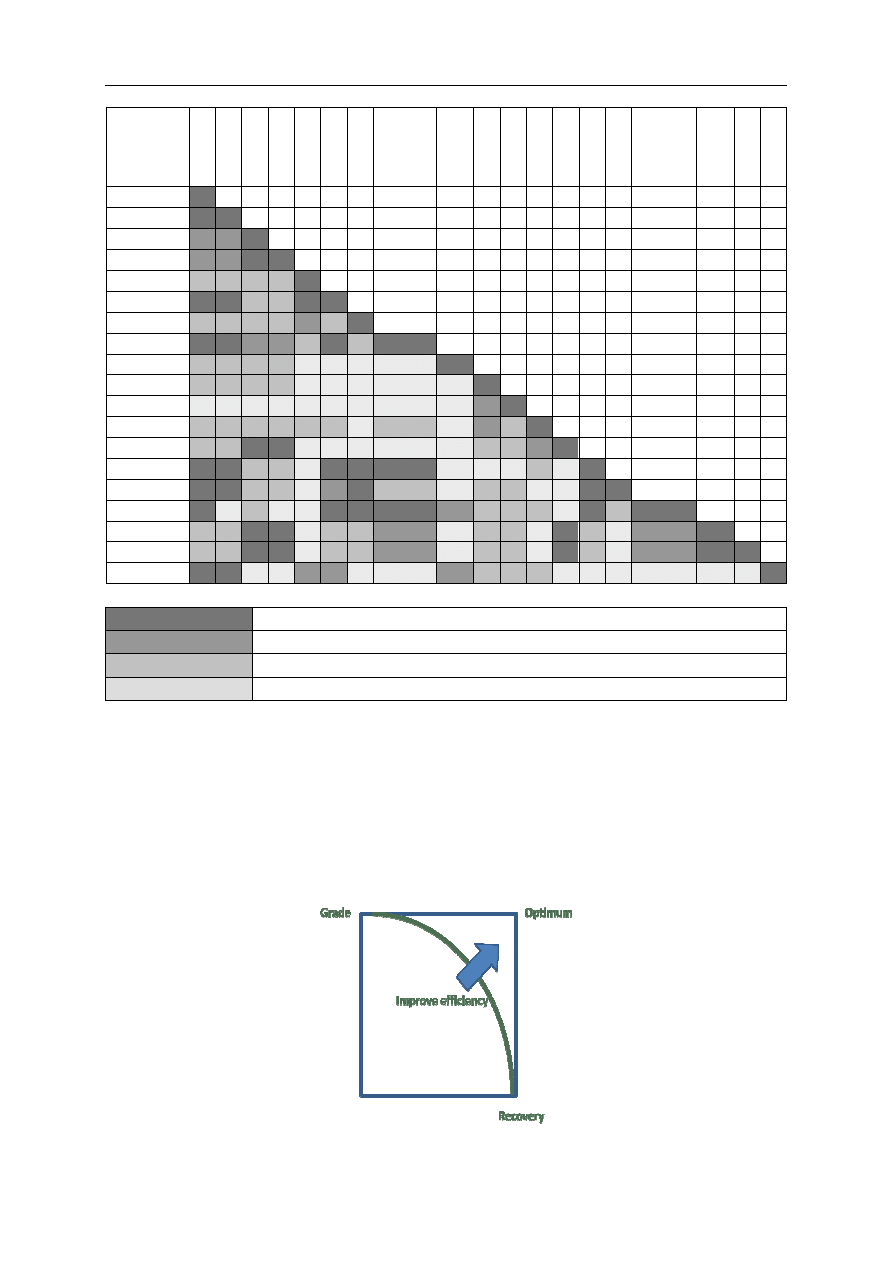
5.3 Final grades and miscibility
Fractions of produced plastics from separation tests and from disassembly can be tested for
their grade, physical properties and applicability in new products. The tests show good results
for the final quality of pre-sorted, re-granulated and re-moulded disassembled back covers [14].
Since mechanical separations are never perfect the produced fractions of plastics do not have
the optimal grade that virgin plastics have. Therefore they are mixed with virgin in low ratio’s to
dilute the recycled plastic and to dilute the contaminant in the recycled plastic. The authors have
developed a miscibility preference scheme for mixing. An example is given in Fig. 4.
In recycling practice it is often useful to analyze the composition of the fractions produced in
order to establish a chart of grades and recoveries for each material. Products show cross con-
tamination of materials or so called false positives. A separator is never perfect and fractions
therefore show impurities. These impurities are allowed to a certain level which differs for each
material. For plastics the level of impurity is low, some impurities are allowed some are not. A
separation scheme is developed that addressed these requirements. Optimal grades are
achieved at the cost of recovery and a high recovery is reached at the cost of quality (Fig. 5). In
order to improve both quality (grade) and recovery (less losses) endless separations have to be
performed generating high costs. It is clear that an optimum of pro-cessing depth and costs is to
be respected.
Recycling of flame retardant plastics from WEEE, technical and environmental challenges
Advances in Production Engineering & Manag
A
B
S
A
B
S
+
B
F
R
H
IP
S
H
IP
S
+
B
F
R
P
E
T
ABS
ABS+BFR
HIPS
HIPS+BFR
PET
PC
PMMA
PC/ABS
POM
PE
PP
PA
PPE
SAN
PVC
PC/ABS+PFR
HIPS/PPE
HIPS/PPE +PFR
PBT
Good mixing with retention of physical properties (assume > 80%)
Reasonable mixing but with lower physical properties
Compatible in small quantities (0.1
Bad mixing and/or bad
Fig. 4 Example of a miscibility chart for common plastics
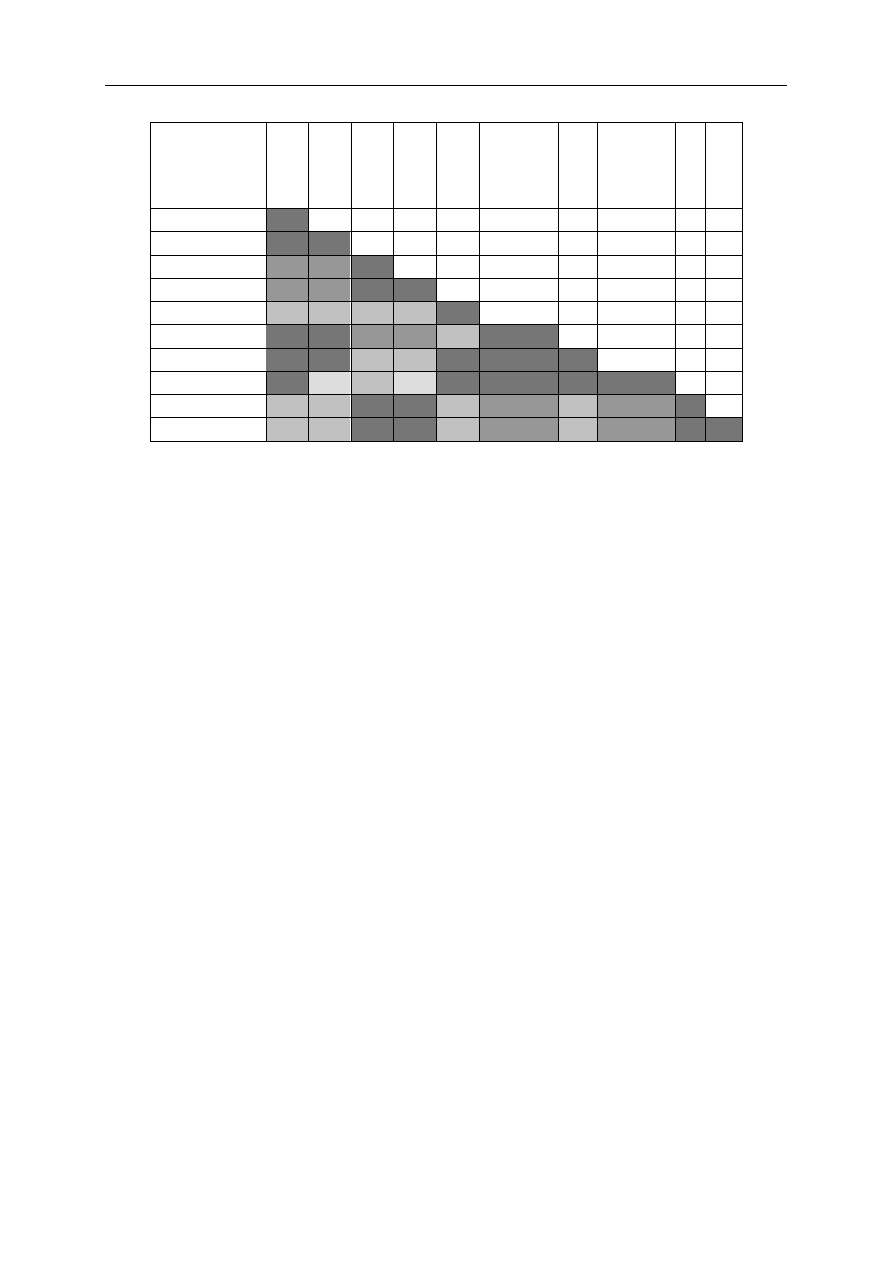
The miscibility chart (Fig. 4) shows the influence of small quantities of plastics of semi
separated batches into virgin stock. For recycled plastic material after shredding and separation
the procedure is to mix it with virgin plastics at a ratio of,
taneous dilution of contaminants from assumed 1
most of the plastics with their contaminants in LCDs are in the yellow or orange range and not
harmful to final quality. Additional testing is planned
and 10 % contamination of the different plastics (Fig. 6).
Fig. 5 Relationship of grade and recovery in separation processes
Recycling of flame retardant plastics from WEEE, technical and environmental challenges
Management 8(2) 2013
P
C
P
M
M
A
P
C
/A
B
S
P
O
M
P
E
P
P
P
A
P
P
E
S
A
N
P
V
C
up to 15 %
up
up to 15 %
up
Good mixing with retention of physical properties (assume > 80%)
Reasonable mixing but with lower physical properties
Compatible in small quantities (0.1–0.2 %)
Bad mixing and/or bad physical properties (assume < 80%)
Example of a miscibility chart for common plastics
4) shows the influence of small quantities of plastics of semi
separated batches into virgin stock. For recycled plastic material after shredding and separation
h virgin plastics at a ratio of, e. g., 90 % to 10 %, causi
taneous dilution of contaminants from assumed 1 % to 0.1 %. The miscibility chart shows that
most of the plastics with their contaminants in LCDs are in the yellow or orange range and not
harmful to final quality. Additional testing is planned to define the real quality in the range of 1
he different plastics (Fig. 6).
Relationship of grade and recovery in separation processes
Recycling of flame retardant plastics from WEEE, technical and environmental challenges
75
P
C
/A
B
S
+
P
F
R
H
IP
S
/P
P
E
H
IP
S
/P
P
E
+
P
F
R
P
B
T
up to 15 %
p to 15 %
4) shows the influence of small quantities of plastics of semi-pure
separated batches into virgin stock. For recycled plastic material after shredding and separation
%, causing the simul-
%. The miscibility chart shows that
most of the plastics with their contaminants in LCDs are in the yellow or orange range and not
to define the real quality in the range of 1-3
Tange, Van Houwelingen, Peeters, Vanegas
76
Advances in Production Engineering & Management 8(2) 2013
A
B
S
A
B
S
+
B
F
R
H
IP
S
H
IP
S
+
B
F
R
P
M
M
A
P
C
/A
B
S
S
A
N
P
C
/A
B
S
+
P
F
R
H
IP
S
/P
P
E
H
IP
S
/P
P
E
+
P
F
R
ABS
ABS+BFR
HIPS
HIPS+BFR
PMMA
PC/ABS
SAN
PC/ABS+PFR
HIPS/PPE
up to 15 %
up to 15 %
HIPS/PPE +PFR
up to 15 %
up to 15 %
Fig. 6 Miscibility chart of polymers of this study
6. Conclusion
Currently the total volume of plastic recycling from WEEE is still very low. Recyclers are faced
with issues such as scale of economy, the lack of identification and sorting techniques and the
lack of information of the used plastics and FRs. Mixing virgin plastics with recycled fractions
has a risk; contaminants with inferior mixing properties are introduced. A mixing chart is intro-
duced that provides an indication of the level of risk.
Selective collection of FPDs is required because of the mercury content of the LCDs. This in-
herent disadvantage, however, is beneficial to the separation of the plastics after shredding. The
produced mix is less complex than would have been the case with mixed WEEE as input. A simi-
lar case is found with the processing of fridges.
Due to the WEEE recast currently higher recycle rates are required with the consequence that
plastics need to be recycled at a higher rate with better grades as is done today.
The study of characterizing and defining the main properties of plastics and the presence of FRs
within the 500 LCD back covers is a first step in the setting up of an on paper scheme for further
mechanical recycling. The list of 500 back covers shows that separation between HIPS and PC-
ABS is possible with a combination of type/additive and density sorting, how-ever, the shred-
ding of a complete LCD set results in a mixture of plastics with more different types that needs
more processing steps.
The main plastics: HIPS, ABS (w/o Br-FR), PC/ABS and HIPS/PPE (with P-FR) found in the
back covers can be recycled if disassembled and processed separately [14]. However, this is a
costly process. The study presented here has searched for a full mechanical solution.
Depending on the quality of the identification and separation techniques it is believed to be
possible to obtain acceptable grades that prove the recyclability of the different individual plas-
tic types. Additional work to define the real quality after recycling and the limitations due to
lower physical properties is required and planned.
Acknowledgement
Part of the work was sponsored and supported by REWARD, a project in the Eco-Innovation program from EACI. The
following parties contributed to the study: RTT, Steinert, BEST Sort-ing, REDWAVE, Coolrec France, Apparec, MOS-
Giessen, PHB-Waalwijk, Immark France, BRGM, SGS, Dolphin Metal Separation, Eco-Systèmes, Philips, Sabic, Styron,
Bayer, Total Petrochemicals, Axion Recycling and PRIME (a study into the recycling of disassembled parts from LCDs).

Recycling of flame retardant plastics from WEEE, technical and environmental challenges
Advances in Production Engineering & Management 8(2) 2013
77
References
[1] Imai, T., Hamm, S., Rothenbacher, K.P. (2003). Comparison of the recyclability of flame retarded plastics, Envi-
ronmental Science & Technology, Vol. 37, No. 3, 652-657.
[2] Eldik, R. (1999). Report by University of Erlangen, Institute for Inorganic Chemistry, University of Erlangen.
[3] The European parliament and the council of the EU, Directive 2011/65/EU, from http://eurlex.europa.eu, ac-
cessed June 10, 2012.
[4] European Flame Retardants Association, from http://www.flameretardants.eu, accessed June 1, 2012.
[5] REWARD. Recovery of electronic waste through advanced recycling and demonstration, A three year project in
the Eco-Innovation Program of EACI, Brussels, from http://www.reward-weee.eu, accessed June 1, 2012.
[6] European commission, from http://ec.europa.eu/atoz_en.htm, accessed June 10, 2012.
[7] Salhofer, S., Spitzbart, M., Maurer, K. (2011). Recycling of LCD screens in Europe – State of the art and challenges,
In: Proceedings of 18
th
CIRP International Conference on Life Cycle Engineering – Globalized Solutions for Sustain-
ability in Manufacturing, Technische Universität Braunschweig, Braunschweig, 454-458.
[8] Zachmann, G. (1997). Rapid characterization of black plastics by MID infrared reflectance spectroscopy, In: Bar-
rage, A., Edelmann, X. (eds.), R’97 Recovery Recycling Reintegration, Vol III, Mechanical Processes Separation
Technologies, Logistic Networks.
[9] Menad, N., Guignot, S., Van Houwelingen, J.A. (2012). New Characterization method of electrical and electronic
equipment wastes (WEEE), Waste Management, Vol. 33, No. 3, 706-713.
[10] Peeters, J.R., Vanegas, P., Devoldere, T., Dewulf, W., Duflou, J.R. (2013). Product clustering for closed loop recy-
cling of flame retardant plastics: A case study for flat screen TVs, In: Proceeding of 20
th
CIRP International Confer-
ence on Life Cycle Engineering, Singapore.
[11] EACI (2007-2013). Bringing dark plastics to light, Boosting green business, from
http://ec.europa.eu/environment/eco-innovation/files/docs/publi/eaci_brochure_eco_innovation_a4_lr_en.pdf,
16, accessed July 1, 2013.
[12] Morrish, L., Morton, R., Myles, N. (2009). Flat panel display recycling technologies, TITECH FPD Sorting Trial,
WRAP
MDD014
–
Trial Report,
July
2009,
Axion Consulting, from http://www.wrap.org.uk, accessed June 10, 2012.
[13] Kobler, R., Foss, H. (2004). Successful recovery of end of life electronics plastics using RPIs skin flotation tech-
nology, GPEC 2004 Paper Abstract #32.
[14] Vanegas, P., Peeters, J.R., Devoldere, T., Cattrysse, D., Duflou, J.R. (2012). Closed loop recycling of Philips TV hous-
ing plastics, In: Proceedings of i-SUP 2012 International Conference – Innovation for Sustainable Production,
Bruges, Belgium.

Copyright of Advances in Production Engineering & Management is the property of
Production Engineering Institute (PEI), University of Maribor and its content may not be
copied or emailed to multiple sites or posted to a listserv without the copyright holder's
express written permission. However, users may print, download, or email articles for
individual use.
Wyszukiwarka
Podobne podstrony:
w3 recykling tworzyw sztucznych
plakietki -tworzywo sztuczne, Pomoce do zajęć, Technika, tworzywa sztuczne
w3 recykling tworzyw sztucznych
36 Zbiórki i recyklingu tworzyw sztucznych w rur odpadów budowlanych i rozbiórkowych strumienia
26 Lepsze przygotowanie polimerów pochodzących z recyklingu chemicznego recyklingu tworzyw sztucznyc
19 Recykling tworzyw sztucznych Wgląd metod oceny wpływu cyklu życia
23 Recyklingu polimerów, materiałów opakowaniowych z tworzyw sztucznych, stosując technikę rozpuszcz
tworzywa sztuczne, TECHNIKA, Tworzywa sztuczne
badania techniczne materiałów z tworzyw sztucznych, Materiały budowlane z Materiałoznastwem
Recykling odpadowych tworzyw sztucznych
Łączenie tworzyw sztucznych, Folder techniczny, Tworzywa sztuczne
Indentyfikacja tworzyw sztucznych, Folder techniczny, Tworzywa sztuczne
C1 Recykling chemiczny PMMA, PET RECYKLING, Przetwórstwo tworzyw sztucznych
Wtrysk i wytłaczanie tworzyw sztucznych, Folder techniczny, Tworzywa sztuczne
Podstawy procesu uplastyczniania., PET RECYKLING, Przetwórstwo tworzyw sztucznych
Zgrzewanie tworzyw sztucznych, Folder techniczny, Tworzywa sztuczne
Tworzywa sztuczne i metale, Klub Miłośników Przyrody - kółko przyrodnicze klasa 1, Recykling, Inform
Tworzywa sztuczne i syntetyczne - referat, PET RECYKLING, Przetwórstwo tworzyw sztucznych
więcej podobnych podstron