
Thin-layer modelling of the convective, microwave,
microwave-convective and microwave-vacuum
drying of lactose powder
W.A.M. McMinn
*
Food Process Engineering Research Group, School of Chemical Engineering, QueenÕs University Belfast,
David Keir Building, Stranmillis Road, Belfast BT9 5AG, UK
Received 5 August 2004; accepted 11 November 2004
Available online 22 December 2004
Abstract
Lactose-water samples were dried under selected convective, microwave, microwave-convective and microwave-vacuum condi-
tions in an experimental system (2.45 GHz, 90W). Irrespective of the drying technique, a typical drying profile, with a constant dry-
ing rate stage followed by two falling rate periods, was exhibited. The magnitude of the drying rate, however, was dependent on the
convective air temperature and velocity, and system pressure. The experimental moisture loss data were fitted to selected semi-
theoretical and empirical thin-layer drying equations. The mathematical models were compared according to three statistical param-
eters, i.e. reduced chi-square, root mean square error and residual sum of squares. The drying characteristics were satisfactorily
described by the Page, Logarithmic, Chavez-Mendez et al. and Midilli et al. models, with the latter providing the best representation
of the experimental data.
2004 Elsevier Ltd. All rights reserved.
Keywords: Convective; Drying; Lactose; Powder; Thin-layer models; Microwave; Vacuum
1. Introduction
Quantitative understanding of drying operations is of
great practical and economic importance. An under-
standing of the fundamental mechanisms, and knowl-
edge of the moisture and temperature distributions
within the product, is crucial for process design, quality
control, product handling and energy savings. A number
of complex theoretical models to describe the heat and
mass transfer phenomena during drying are available.
However, both design and process engineers involved
in industrial drying operations clearly need simple, but
accurate, analytical tools, in order to conduct design
analysis and relevant calculations. Availability of such
correlations and models, verified by experimental data,
will enable engineers and operators to provide optimum
solutions to aspects of drying operations such as energy
use, operating conditions, process control, without
undertaking experimental trials on the system (
). In particular, thin-layer equations contribute to
the understanding of the heat and mass transfer phe-
nomena, and computer simulations, for designing new
processes and improving existing commercial operations
(
Kardum, Sander, & Skansi, 2001
).
Thin-layer drying models can be categorised as theo-
retical, semi-theoretical and empirical (
Models within the latter two categories consider only
external resistance to moisture transfer (
) and neglect the effect of a
variation in sample temperature on the drying process
(
0260-8774/$ - see front matter
2004 Elsevier Ltd. All rights reserved.
doi:10.1016/j.jfoodeng.2004.11.025
*
Tel.: +44 28 9027 4065; fax: +44 28 9038 1753.
E-mail address:
www.elsevier.com/locate/jfoodeng
Journal of Food Engineering 72 (2006) 113–123

Semi-theoretical models offer a compromise between
theory and ease of use. The models are generally derived
by simplifying general series solutions of FickÕs second
law and are only valid within the drying conditions for
which they have been developed (
). However, they require short time, as compared
with theoretical thin-layer equations, and do not require
assumptions regarding sample geometry, mass diffusiv-
ity and conductivity. Such models include the
Two-Term (
Sharaf-Eldeen, Blaisdell, & Hamdy, 1980
Approximation of Diffusion (
and
Midilli, Kucuk, and Yapar (2002)
equations.
Empirical models, which derive a direct relationship
between moisture content and drying time, neglect the
fundamentals of the drying process and have parameters
with no physical meaning (
Among them, the
and
Mendez, Salgado-Cervantes, Garcia-Galindo, De La
Cruz-Medina, and Garcia-Alvarado (1995)
have found
application in literature.
Although thin-layer equations have been widely used
to describe experimental convective drying data, appli-
cation to microwave-assisted drying operations is more
limited.
assessed the ability of the Lewis and Page equa-
tions to characterise the experimental drying curves for
microwave-assisted convective air drying of carrots,
and reported that only the Page model adequately de-
scribed the data.
Kiranoudis, Tsami, and Maroulis
represented the microwave-vacuum drying kinet-
ics of fruits using an one-parameter empirical mass
transfer model of exponential form, and further indi-
cated that the magnitude of the drying constant was
dependent on the vacuum pressure and microwave
power of the system.
modelled the microwave-vacuum drying kinetics
of model fruit gels using the Lewis Ôthin-layerÕ drying
equation, and further proposed an empirical correlation
to estimate the drying rate constant as a function of the
absolute pressure and microwave power of the system.
reported that the microwave dry-
ing kinetics of a pharmaceutical product was adequately
described by the Lewis and Page models, with the latter
providing a better correlation with the experimental
data.
approximated the tran-
sient behaviour of normalised moisture during the
microwave heating of cement powder by an exponential
evolution with a time constant.
Previous work by
, and
involved extensive experimental examination
of the convective, microwave, and combined micro-
wave-convective and microwave-vacuum drying behav-
iour of lactose powder. Using the acquired data, the
aim of this work is to assess the ability of selected
thin-layer based drying models to quantify the moisture
removal behaviour.
2. Materials and methods
2.1. Equipment
The atmospheric microwave drying system used in
this work is a standard microwave oven (Brother, Hi-
speed cooker, Model No. MF 3200 d13) of variable
power output settings (650, 500, 250, 90 and 30 W)
and a rated capacity of 650W at 2.45 GHz. The equip-
ment was modified to facilitate microwave-convective
processing. A precisely dimensioned duct, fitted with a
fan and a heater, was attached to the side of the oven.
The air velocity (0–1.0 ± 0.05 m s
1
) and temperature
(20–100 ± 5
C) are controlled by means of analogue
controllers. The system was also modified to allow for
microwave-vacuum drying. A glass dessicator was posi-
tioned inside the microwave cavity, to which a vacuum
pump was attached. The vacuum level is controlled
(0–101 kPa (absolute)) by means of an actuator valve
and released using a vent valve. Further details on the
equipment are outlined in
and
Nomenclature
a, b, c, g, h, L
1
, L
2
, n constants
k, k
1
, k
2
drying rate constants (min
1
)
MR
moisture ratio
MR
exp,i
experimental moisture ratio
MR
pre,i
predicted moisture ratio
N
number of experimental data points
n
p
number of parameters in model
R
residual error
R
c
maximum drying rate (kg m
2
s
1
)
RMSE root mean square error
RSS
residual sum of squares
t
time (min)
t
total
total drying time (min)
X
moisture content at time t (kg kg
1
, dry solid)
X
e
equilibrium moisture content (kg kg
1
, dry
solid)
X
0
initial moisture content (kg kg
1
, dry solid)
v
2
reduced chi-square
114
W.A.M. McMinn / Journal of Food Engineering 72 (2006) 113–123

2.2. Experimental method
The drying characteristics of lactose powder during
convective, microwave (90W), microwave-convective
and microwave-vacuum processing were examined.
Before each experimental run, the microwave oven was
preheated at full power (650W) for 5 min using a
500 ml water load (
) and the con-
vective system allowed to stabilise, at the selected condi-
tion, for 10min. A water load (approximately 75 g) was
placed in the microwave cavity to provide a heating load
sufficient to protect the magnetron from overheating,
especially during the latter stages of drying. For each
experiment, a water-wetted lactose sample of 1.0kg
kg
1
db (dry basis, water) was prepared, and placed in
a glass dish in the oven. At 5-min intervals throughout
the drying process (until material had attained at least
95% moisture loss) the sample was removed, weighed,
and then agitated for 15 ± 1 s. This procedure was
adopted to investigate the effect of product and process-
ing characteristics on the drying behaviour, as summa-
rized in
. Each experiment was performed in
triplicate. Further information on the experimental
procedures is detailed in
and
2.3. Data analysis
The experimental moisture content data were non-
dimensionlized using the equation:
MR
¼
X
X
e
X
0
X
e
ð1Þ
where MR is the moisture ratio; X
0
is the initial moisture
content (kg kg
1
, dry solid); X
e
is the equilibrium mois-
ture content (kg kg
1
, dry solid), and X is the moisture
content at time t (kg kg
1
, dry solid).
For the analysis it was assumed that the equilibrium
moisture content, X
e
, was equal to zero.
Selected thin-layer drying models, detailed in
were fitted to the drying curves (MR versus time), and
the equation parameters determined using non-linear
least squares regression analysis.
Three criteria were adopted to evaluate the goodness
of fit of each model, the reduced chi-square (v
2
), root
mean square error (RMSE) and residual sum of squares
(RSS). These parameters were calculated using (
v
2
¼
P
N
i
¼1
ðMR
exp;i
MR
pred;i
Þ
2
N
n
p
ð2Þ
Table 1
Summary of experiments
Experimental
parameter
Dry mass
· 10
3
(kg)
Surface area
· 10
3
(m
2
)
Depth
· 10
3
(m)
Microwave
power (W)
Air velocity
(m/s)
Air temperature
(
C)
Pressure
(kPa)
Convective
Air temperature
20
20
6.36
6
–
0.7
40
101
60
Microwave
Bed depth/surface area
106.36
3
206.36
6
306.36
9
90 –
–
10
1
100
6.36
30
25
15.4
3
100
57.3
3
Microwave–convective
Air velocity/temperature
0.4
20
0.7
20
20
6.36
6
90
0.7
40
101
0.7
60
Bed depth/surface area
106.36
3
40
206.36
6
40
25
15.4
3
90
0.7
40
101
100
57.3
3
40
Microwave-vacuum
Pressure
30
206.36
6
90 –
–
50
80
W.A.M. McMinn / Journal of Food Engineering 72 (2006) 113–123
115
RMSE
¼
1
N
X
N
i
¼1
ðMR
exp;i
MR
pred;i
Þ
2
"
#
0:5
ð3Þ
RSS
¼
X
N
i
¼1
ðMR
exp;i
MR
pred;i
Þ
2
ð4Þ
where MR
exp,i
is the experimental moisture ratio;
MR
pred,i
is the predicted moisture ratio; N is the number
of experimental data points, and n
p
is the number of
parameters in model.
The lower the calculated values of reduced chi-square
and root mean square error, the better the ability of the
model to represent the experimental data. The reduced
chi-square accounts for the number of constants in the
model, with the magnitude of this parameter giving a
measure of the reliability of the model to describe the
experimental data, irrespective of the number of param-
eters (
). These statistical parame-
ters have been widely used as the primary criterion to
select the best equation to account for variation in the
drying curves of dried samples (
;
). The residual sum of
squares value is an important parameter in the non-
linear regression process, with the fitting procedure
being designed to achieve the minimum RSS (
3. Results and discussion
3.1. Drying characteristics
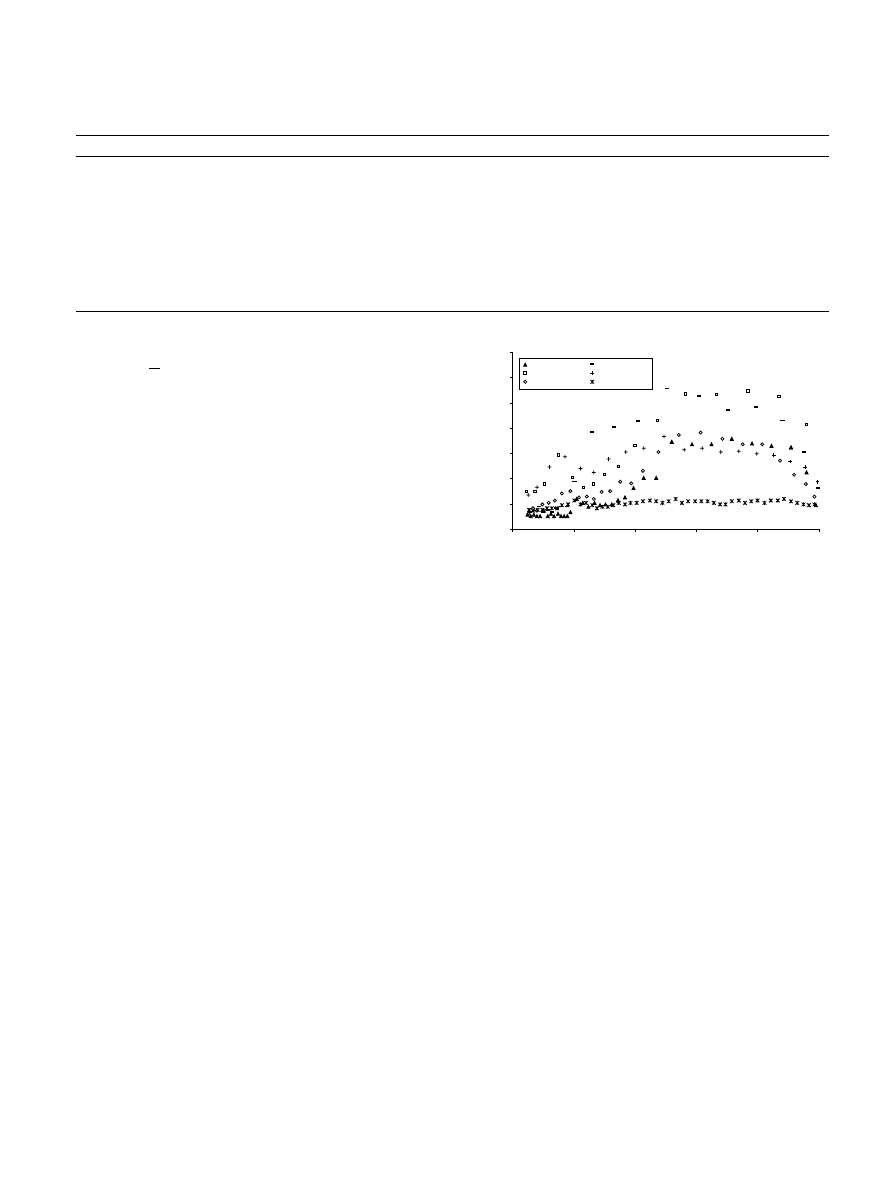
Representative drying rate curves for lactose-water
samples dried under convective (C) (20and 60
C air),
microwave (Mw), microwave-convective (Mw-C) (20
and
60
C
air)
and
microwave-vacuum
(Mw-V)
(80kPa) conditions are shown in
. In general, four
distinct periods are identifiable, namely a warming-up,
constant rate and two falling rate periods. Irrespective
of the drying technique, a critical moisture content of
0.54 kg kg
1
db (dry basis) is observed, with samples
dried using convective, microwave and microwave-
convective processing exhibiting a secondary moisture
content of 0.36 kg kg
1
db. This is reduced to 0.14 kg
kg
1
db during microwave-vacuum (80kPa) operation.
The observed decrease may be attributed to the corre-
sponding reduction in solvent boiling point, and the
Ô
pullingÕ effect of the vacuum, which draws the solvent
out of the material pores. The magnitude of the maxi-
mum drying rate, drying rate constants and drying time
are, however, specific to the method of moisture re-
moval.
provides a summary of the maximum
drying rate (R
c
) and total drying time (t
total
) for all con-
vective, microwave, microwave-convective and micro-
wave-vacuum conditions examined. It should be noted,
however, that during microwave-vacuum processing at
less than 80kPa, material loss occurred at low moisture
contents, so kinetic data is available for the initial stages
only.
Ambient temperature (20
C) convective drying
exhibits the slowest drying rate, with the reduction in
rate between the constant and falling stages being rela-
tively indistinguishable. As expected, the drying rate
can be enhanced, and hence drying time lowered, by
increasing the air temperature; an increase in constant
drying rate of approximately 150%, from 0.26 to
Table 2
Thin-layer models fitted to experimental data
Model
Mathematical expression
Lewis (
)
MR = exp(
kt)
Page (
MR = exp(
kt
n
)
Henderson and Pabis (
MR = a exp(
kt)
Modified Henderson and Pabis (
)
MR = a exp(
kt) + bexp(gt) + cexp(ht)
Logarithmic (
)
MR = a exp(
kt) + c
Two-Term (
MR = a exp(
k
1
t) + bexp(
k
2
t)
Wang and Singh (
MR = 1 + at + bt
2
Approximation of Diffusion (
MR = a exp(
kt) + (1a)exp(kbt)
Chavez-Mendez et al. (Chavez-Mendez et al., 1995)
MR
¼ ½1 ð1 L
2
ÞL
1
t
ð1=ð1L
2
ÞÞ
Midilli (
)
MR = a exp(
kt
n
) + bt
0.0
0.2
0.4
0.6
0.8
1.0
1.2
1.4
0.0
0.2
0.4
0.6
0.8
1.0
Moisture Content (kgkg
-1
, dry basis)
Drying Rate (x10
-3
kgm
-2
s
-1
)
Mw
Mw-V (80kPa)
Mw-C (60°C)
C (60°C)
Mw-C (20°C)
C (20°C)
Fig. 1. Drying characteristics of water wetted lactose dried under
selected processing conditions [Mw—microwave; Mw-C—microwave-
convective; Mw-V—microwave-vacuum].
116
W.A.M. McMinn / Journal of Food Engineering 72 (2006) 113–123

0.66
· 10
3
kg m
2
s
1
, is achieved by elevating the air
temperature from 20to 60
C.
The use of microwave-only drying provides a slight
elevation in the maximum drying rate, as compared with
high temperature convective processing (0.66
· 10
3
kg m
2
s
1
for convective at 60
C and 0.70 · 10
3
kg m
2
s
1
for microwave). With the subsequent
introduction of air over the sample surface, i.e. micro-
wave-convective drying, the microwave drying rate is in-
creased. Again this can be further elevated by increasing
the air temperature (60
C). Air temperature, however,
has a less significant affect during microwave-convective
operation than convective-only. In the former process, a
reduction in drying time of approximately 17%, from 90
to 75 min, is achieved by increasing the air temperature
from 40to 60
C. However, in convective drying, the
drying time is decreased by approximately 32%, with
the same temperature elevation. Thus, increasing air
temperature during microwave-convective drying is less
energy efficient than during convective drying. During
microwave-convective operation, the velocity of the air
also has a relatively limited impact on the drying behav-
iour. Drying times of 140and 120min were observed
with the use of 0.4 and 0.7 m s
1
air, respectively.
Microwave-vacuum drying is found to provide drying
times comparable with those observed during high tem-
perature microwave-convective processing. The maxi-
mum drying rate increases significantly as the system
pressure decreases from 101 to 30 kPa; lowering of sys-
tem pressure is accompanied by a decrease in water
evaporation temperature. Consequently, a reduction in
system pressure from 101 to 80 kPa offers a reduction
in drying time of more than 38%, from 170to 105 min.
The drying characteristics are also observed to be
dependent on the bed dimensions, with an increase in
depth and decrease in surface area, in general, providing
enhanced drying rates. The extent of the rate elevation
is, however, dictated by the sample geometry and pro-
cessing technique (microwave, microwave-convective).
A more detailed characterisation of the drying behav-
iour of lactose-water samples subjected to convective,
microwave and combined microwave-convective and
microwave-vacuum drying is presented in
and
3.2. Model application
Thin-layer models have found wide application due
to their ease of use and lack of required data, such as
phenomenological and coupling coefficients, as in com-
plex theoretical models. Many correlations are avail-
able in the literature, with those included in this study
(
) being selected as they represent some of the
more commonly adopted. Although other models were
Table 3
Comparison of maximum drying rate (R
c
) and drying time (t
total
) for convective, microwave-convective and microwave-vacuum drying of lactose
powder
Dry mass
· 10
3
(kg)
Surface area
· 10
3
(m
2
)
Depth
· 10
3
(m)
Microwave
power (W)
Air temperature
(
C)
Air velocity
(m s
1
)
Pressure
(kPa)
R
c
(
·10
3
kg m
2
s
1
)
t
total
(min)
Convective
20
101
0.26
270
20
6.36
6
–
40
0.7
101
0.46
140
60
101
0.66
95
Microwave
106.36
3
0
.18
190
206.36
6
0
.70
175
30
6.36
9
90
–
–
101
0.72
210
100
6.36
30
0.88
370
25
15.4
3
0.38
175
100
57.3
3
0.19
185
Microwave-convective
20
0.4
101
0.68
140
20
6.36
6
90
20
0.7
101
0.80
120
40
0.7
101
0.97
90
60
0.7
101
1.12
75
106.36
3
0
.54
60
25
15.4
3
40
0.7
101
0.62
55
100
57.3
3
0.38
80
Microwave-vacuum
90–
–
30
1.36
–
206.36
6
90
–
–
50
1.17
–
90
–
–
80
0.98
105
W.A.M. McMinn / Journal of Food Engineering 72 (2006) 113–123
117

Table 4
Estimated values of coefficients and statistical analysis for the thin-layer models: lactose dried under convective (C) (0.7 m s
1
/60
C), microwave
(Mw), microwave-convective (Mw-C) (0.7 m s
1
/60
C) and microwave-vacuum (Mw-V) (80kPa) conditions
Model
Constants
C
Mw
Mw-C
Mw-V
Lewis
k
1.72
· 10
2
1.06
· 10
2
2.82
· 10
2
2.55
· 10
2
v
2
6.74
· 10
3
1.26
· 10
3
1.70
· 10
3
3.46
· 10
3
RMSE
0.080
0.035
0.040
0.057
RSS
0.128
0.044
0.027
0.073
Page
k
1.78
· 10
3
8.57
· 10
3
1.19
· 10
2
4.98
· 10
3
n
1.58
1.13
1.24
1.44
v
2
5.75
· 10
4
5.62
· 10
4
3.58
· 10
4
5.86
· 10
4
RMSE
0.023
0.023
0.018
0.023
RSS
0.010
0.019
0.005
0.012
Henderson and Pabis
a
1.11
1.07
1.06
1.11
k
1.95
· 10
2
1.62
· 10
2
3.01
· 10
2
2.84
· 10
2
v
2
5.00
· 10
3
4.74
· 10
4
1.20
· 10
3
1.47
· 10
3
RMSE
0.067
0.021
0.032
0.037
RSS
0.090
0.016
0.018
0.029
Modified Henderson and Pabis
a
3.68
· 10
1
3.56
· 10
1
3.55
· 10
1
3.70
· 10
1
b
3.68
· 10
1
3.56
· 10
1
3.55
· 10
1
3.70
· 10
1
c
3.68
· 10
1
3.56
· 10
1
3.55
· 10
1
3.70
· 10
1
g
1.96
· 10
2
1.62
· 10
2
3.01
· 10
2
2.85
· 10
2
h
1.94
· 10
2
1.62
· 10
2
3.01
· 10
2
2.85
· 10
2
k
1.94
· 10
2
1.62
· 10
2
3.01
· 10
2
2.84
· 10
2
v
2
6.45
· 10
3
5.37
· 10
4
1.64
· 10
3
1.84
· 10
3
RMSE
0.067
0.021
0.033
0.037
RSS
0.090
0.016
0.018
0.030
Logarithmic
a
4.49
1.07
1.21
1.24
k
2.69
· 10
3
1.59
· 10
2
2.13
· 10
2
2.09
· 10
2
c
3.46
5.99 · 10
3
1.82 · 10
1
1.66 · 10
1
v
2
4.23
· 10
3
4.86
· 10
4
3.45
· 10
4
1.93
· 10
3
RMSE
0.060
0.021
0.017
0.041
RSS
0.072
0.016
0.005
0.037
Two-Term
a
5.52
· 10
1
5.43
· 10
1
5.32
· 10
1
5.55
· 10
1
k
1
1.94
· 10
2
1.62
· 10
2
3.01
· 10
2
2.85
· 10
2
b
5.52
· 10
1
5.35
· 10
1
5.32
· 10
1
5.55
· 10
1
k
2
1.95
· 10
2
1.62
· 10
2
3.01
· 10
2
2.84
· 10
2
v
2
5.63
· 10
3
5.19
· 10
4
1.39
· 10
3
1.64
· 10
3
RMSE
0.067
0.021
0.033
0.037
RSS
0.090
0.016
0.018
0.030
Wang and Singh
a
1.11 · 10
2
1.18 · 10
2
2.14 · 10
2
1.99 · 10
2
b
6.20
· 10
6
3.81
· 10
5
1.19
· 10
4
1.06
· 10
4
v
2
2.97
· 10
4
9.33
· 10
3
3.43
· 10
2
1.39
· 10
3
RMSE
0.016
0.094
0.140
0.036
RSS
0.005
0.317
0.333
0.028
Approximate Diffusion
a
2.78
1.58
1.00
3.53
b
2.77
· 10
3
1.18
· 10
2
2.82
· 10
2
1.18
· 10
2
k
6.89 · 10
1
6.60
· 10
1
1.00
· 10
2
6.95
· 10
1
v
2
3.25
· 10
4
1.04
· 10
3
1.94
· 10
3
3.20
· 10
3
RMSE
0.017
0.030
0.040
0.053
RSS
0.006
0.028
0.027
0.061
Chevez-Mendez et al.
L
1
1.11
· 10
2
1.38
· 10
2
2.23
· 10
2
1.95
· 10
2
L
2
6.51
· 10
2
8.59
· 10
1
6.15
· 10
1
5.43
· 10
1
v
2
2.26
· 10
4
9.57
· 10
4
4.01
· 10
4
1.95
· 10
3
RMSE
0.014
0.029
0.019
0.042
RSS
0.004
0.027
0.006
0.039
Midilli et al.
a
9.95
· 10
1
1.04
1.01
9.94
· 10
1
k
2.62
· 10
3
9.52
· 10
3
1.64
· 10
2
2.74
· 10
3
n
1.37
1.13
1.12
1.644
b
2.36 · 10
3
1.79
· 10
4
7.47 · 10
4
9.39
· 10
4
v
2
2.12
· 10
2
5.03
· 10
4
2.95
· 10
4
4.28
· 10
4
RMSE
0.130
0.021
0.015
0.019
RSS
0.339
0.013
0.004
0.008
118
W.A.M. McMinn / Journal of Food Engineering 72 (2006) 113–123
initially considered, following preliminary examination
these were excluded: the modified-Page equation (
), were an exponent ÔnÕ is
also added to the constant ÔkÕ, merely giving a constant
of differing magnitude; the two-term exponential model
(
) in which the constant ÔaÕ
approximates to 1 on application to the experimental
data and thus, simplifies to the form of the Henderson
and Pabis model, and the Verma et al. model (
Bucklin, Endan, & Wratten, 1985
) which takes the form
of the Approximation of Diffusion model, with parame-
ters Ôk * bÕ being lumped together to give a new constant
ÔgÕ
.
The experimental moisture content results (0.1–
1.0kg kg
1
, db) were non-dimensionalised using Eq.
. The dimensionless data were then regressed against
time, according to the form of the various thin-layer cor-
relations (
), using the least squares curve fitting
method. This defined the drying behaviour in terms of
the drying constant(s) (k, k
1
, k
2
) and constant(s) (a, b,
c, g, h, L
1
, L
2
, n), as appropriate to the specific equation.
details the parameter values for 10drying mod-
els, with the corresponding reduced chi-square (v
2
), root
mean square error (RMSE) and residual sum of squares
(RSS) values, for representative drying techniques (
). The aforementioned statistical criteria, for all the
experimental conditions (
), are plotted against
the number of parameters in the model in
and
, respectively. The v
2
values are in the range
9.05
· 10
6
–3.43
· 10
2
, and RSME and RSS values
vary between 0.003 and 0.140, and 0.0001 and 0.544,
respectively.
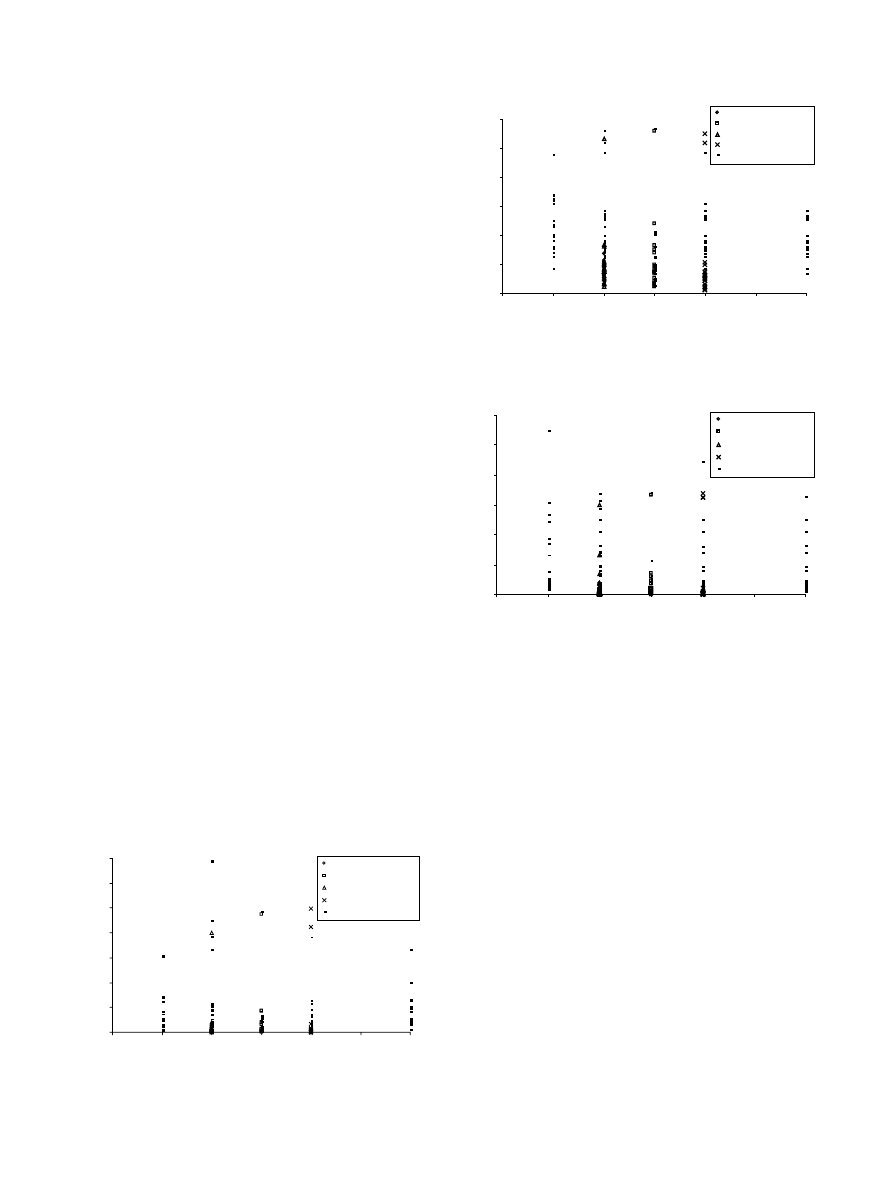
Two comparison techniques are adopted in order to
determine the most appropriate equations for descrip-
tion of the experimental data. The first method consid-
ers the range and average values of the error
parameters (v
2
, RSME and RSS). This indicates that
the Page, Logarithmic, Chavez-Mendez et al. and
Midilli et al. models provide a good representation of
the experimental results. Although the four aforemen-
tioned models all demonstrate good agreement with
the data, the Midilli et al. equation can, in general, be
considered the most suitable, followed by the Page mod-
el. The RSME values for the Midilli et al. and Page
equations are of lowest magnitude, varying between
0.003 and 0.138 (average 0.025), and 0.008 and 0.130
(average 0.024), respectively, according to the different
experimental conditions, with corresponding average
v
2
values of 26.27
· 10
4
and 13.59
· 10
4
. The RSS val-
ues for the Midilli et al. and Page models range between
0.0001 and 0.324, and 0.0004 and 0.286, respectively.
Both of these models are semi-theoretical in form, with
the latter having the advantage of only requiring the
estimation of two parameters. The Chavez-Mendez
et al. and Logarithmic models are empirical, however,
the similarity of the latter expression to the analytical
solution of the drying problem favours its acceptance
(
). The second comparative
technique examines the frequency with which each equa-
tion best fits the experimental data. The results of the
analysis confirm that the Midilli et al. equation is the
most appropriate equation, with this providing the most
accurate predictions for more than 50% of the data sets.
0.000
0.005
0.010
0.015
0.020
0.025
0.030
0.035
0
1
2
3
4
5
6
Number of Parameters
χ
2
Page
Logarithmic
Chavez-Mendez et al.
Midilli et al.
Other Models
Fig. 2. Comparison of reduced chi-square (v
2
) values for the thin-layer
models.
0
0.025
0.05
0.075
0.1
0.125
0.15
0
1
2
3
4
5
6
Number of Parameters
RMSE
Page
Logarithmic
Chavez-Mendez et al.
Midilli et al.
Other Models
Fig. 3. Comparison of root mean square error (RMSE) values for the
thin-layer models.
0
0.1
0.2
0.3
0.4
0.5
0.6
0
1
2
3
4
5
6
Number of Parameters
RSS
Page
Logarithmic
Chavez-Mendez et al.
Midilli et al.
Other Models
Fig. 4. Comparison of residual sum of squares (RSS) values for the
thin-layer models.
W.A.M. McMinn / Journal of Food Engineering 72 (2006) 113–123
119

The results of the statistical analysis and estimated val-
ues of coefficients for the mathematical models which
adequately represent the experimental values, for all
operating conditions considered, are shown in
. The least suitable model is the Lewis equation, with
RSME values in the range 0.035–0.119, and an average
value of 0.056.
Examination of the drying constant (k) in the Midilli
et al. model (most suitable correlation) indicates that the
relative magnitude of the parameter accurately reflects
the drying behaviour. The higher k values for the micro-
wave-assisted techniques, as compared with those for
convective-only processing, verifies the elevated mois-
ture removal rates (
and
). The increase
in the drying constant with increasing air temperature
during both convective and microwave-convective pro-
cessing indicates an enhancement of drying potential
(
). In contrast, the relative insensitivity of the
drying behaviour to a variation in air velocity during
microwave-convective drying is revealed by the similar-
ity of the k and b values with 0.4 and 0.7 m s
1
air. For
vacuum processing, as expected, the k value is shown to
increase as the system pressure is reduced from 101 kPa
to 30kPa (
). The variation in drying characteris-
tics with bed geometry is also confirmed by a change in k
value with both sample surface area and depth (
Similar trends with respect to variation in the drying
constant (k) of the Page and Logarithmic models with
Table 5
Estimated values of coefficients and statistical analysis for selected thin-layer models: lactose dried under convective (C) and microwave-convective
(Mw-C) conditions
Model
Constants
C
Mw-C
20
C
40
C
20
C/0.4 ms
1
20
C/0.7 m s
1
40
C/0.7 m s
1
Page
k
4.89
· 10
4
1.31
· 10
3
6.79
· 10
3
6.19
· 10
3
7.52
· 10
3
n
1.51
1.51
1.22
1.29
1.31
v
2
7.61
· 10
4
1.22
· 10
3
1.04
· 10
4
1.39
· 10
4
2.12
· 10
4
RMSE
0.027
0.034
0.009
0.011
0.014
RSS
0.038
0.032
0.003
0.003
0.004
Logarithmic
a
6.38
1.77
· 10
1
1.16
1.25
1.29
k
6.64
· 10
4
4.35
· 10
4
1.43
· 10
2
1.52
· 10
2
1.71
· 10
2
c
5.37
1.67 · 10
1
1.16 · 10
1
1.96
· 10
1
2.51 · 10
1
v
2
4.48
· 10
5
8.72
· 10
5
2.80
· 10
4
3.35
· 10
4
4.06
· 10
4
RMSE
0.006
0.009
0.016
0.017
0.018
RSS
0.002
0.002
0.007
0.066
0.007
Chavez-Mendez et al.
L
1
3.96
· 10
3
7.52
· 10
3
1.38
· 10
2
1.55
· 10
2
1.83
· 10
2
L
2
3.48
· 10
2
1.00
· 10
2
6.69
· 10
1
5.59
· 10
1
5.18
· 10
1
v
2
7.19
· 10
5
3.97
· 10
5
3.31
· 10
4
3.99
· 10
4
4.63
· 10
4
RMSE
0.008
0.006
0.018
0.019
0.020
RSS
0.004
0.001
0.009
0.008
0.008
Midilli et al.
a
1.00
9.99
· 10
1
1.01
1.01
1.01
k
9.58
· 10
4
1.97
· 10
3
6.36
· 10
3
6.08
· 10
3
8.29
· 10
3
n
1.24
1.13
1.25
1.31
1.28
b
1.45 · 10
3
4.44 · 10
3
1.80
· 10
4
1.79
· 10
4
5.07 · 10
5
v
2
9.05
· 10
6
7.41
· 10
5
1.35
· 10
4
2.08
· 10
4
2.27
· 10
4
RMSE
0.003
0.008
0.011
0.013
0.013
RSS
0.0004
0.002
0.003
0.004
0.003
Table 6
Estimated values of coefficients and statistical analysis for selected
thin-layer models: effect of pressure during microwave-vacuum (Mw-
V) drying
Model
Constants
30kPa
50kPa
Page
k
2.79
· 10
3
5.12
· 10
3
n
1.701.52
v
2
8.58
· 10
5
7.88
· 10
5
RMSE
0.008
0.008
RSS
0.0004
0.0004
Logarithmic
a
4.34
· 10
1
1.23
k
4.59
· 10
4
1.70
· 10
3
c
4.23 · 10
1
1.12 · 10
1
v
2
2.09
· 10
3
6.88
· 10
4
RMSE
0.035
0.019
RSS
0.008
0.003
Chavez-Mendez et al.
L
1
1.49
· 10
2
1.66
· 10
2
L
2
8.15 · 10
1
4.83 · 10
1
v
2
9.20
· 10
4
5.92
· 10
4
RMSE
0.026
0.021
RSS
0.005
0.003
Midilli et al.
a
1.05
1.03
k
3.47
· 10
4
3.46 · 10
5
n
1.00
1.00
b
2.04 · 10
2
2.05 · 10
2
v
2
1.72
· 10
3
7.60
· 10
4
RMSE
0.027
0.018
RSS
0.005
0.002
120
W.A.M. McMinn / Journal of Food Engineering 72 (2006) 113–123

air temperature, air velocity and pressure can also be
identified.
Thin-layer models are clearly of significant practical
value to engineers for the preliminary evaluation of po-
tential microwave drying operations. The correlations
are mathematically simple with the characteristic
parameters, namely drying constant, providing a com-
bined, but sufficiently informative, measure of the trans-
port properties (moisture diffusivity, thermal diffusivity,
heat transfer coefficient and mass transfer coefficient). In
addition, their ease of application provides a standard-
ized process description, independent of the controlling
Table 7
Estimated values of coefficients and statistical analysis for selected thin-layer models: effect of bed dimensions (surface area; depth) during microwave
(Mw) and microwave-convective (Mw-C) drying
Model
Constants
6.36
· 10
3
m
2
;
3
· 10
3
m
6.36
· 10
3
m
2
;
6
· 10
3
m
6.36
· 10
3
m
2
;
9
· 10
3
m
6.36
· 10
3
m
2
;
30
· 10
3
m
15.4
· 10
3
m
2
;
3
· 10
3
m
57.3
· 10
3
m
2
;
3
· 10
3
m
Microwave
Page
k
7.25
· 10
3
8.56
· 10
3
1.31
· 10
3
2.05
· 10
4
1.04
· 10
2
5.49
· 10
4
n
1.09
1.13
1.47
1.59
1.07
1.62
v
2
8.06
· 10
4
5.62
· 10
4
3.19
· 10
4
3.11
· 10
4
2.36
· 10
4
1.99
· 10
4
RMSE
0.028
0.023
0.017
0.017
0.015
0.017
RSS
0.030
0.019
0.013
0.023
0.008
0.007
Logarithmic
a
1.25
1.06
1.35
3.94
1.05
3.17
k
6.96
· 10
3
1.65
· 10
2
8.09
· 10
3
8.73
· 10
4
1.36
· 10
2
2.21
· 10
3
c
2.74 · 10
1
9.73
· 10
3
2.67 · 10
1
2.89
2.87 · 10
2
2.12
v
2
1.18
· 10
4
5.07
· 10
4
1.52
· 10
3
6.35
· 10
4
1.84
· 10
4
5.88
· 10
4
RMSE
0.010
0.022
0.038
0.025
0.013
0.023
RSS
0.004
0.017
0.061
0.046
0.006
0.021
Chavez-Mendez et al.
L
1
9.23
· 10
3
1.38
· 10
2
7.99
· 10
3
2.91
· 10
3
1.30
· 10
2
5.94
· 10
3
L
2
7.12
· 10
1
8.62
· 10
1
4.20
· 10
1
1.56
· 10
2
8.78
· 10
1
7.16
· 10
2
v
2
3.69
· 10
4
7.88
· 10
4
1.70
· 10
3
5.13
· 10
4
2.36
· 10
4
6.49
· 10
4
RMSE
0.019
0.027
0.040
0.022
0.015
0.025
RSS
0.014
0.027
0.070
0.037
0.008
0.023
Midilli et al.
a
1.01
1.03
9.99
· 10
1
1.01
1.03
9.97
· 10
1
k
1.71
· 10
2
7.16
· 10
3
7.77
· 10
4
4.06
· 10
4
1.43
· 10
2
7.21
· 10
4
n
8.05
· 10
1
1.21
1.62
1.409.93
· 10
1
1.51
b
1.47 · 10
3
5.08
· 10
4
4.33
· 10
4
5.31 · 10
4
1.55 · 10
4
5.85 · 10
4
v
2
1.98
· 10
5
6.93
· 10
4
2.87
· 10
4
1.33
· 10
4
1.75
· 10
4
4.17
· 10
5
RMSE
0.004
0.025
0.016
0.011
0.012
0.006
RSS
0.0007
0.022
0.011
0.009
0.006
0.001
Microwave-convective
Page
k
1.69
· 10
2
1.01
· 10
2
–
–
1.51
· 10
2
1.09
· 10
3
n
1.19
1.30–
–
1.29
1.66
v
2
7.17
· 10
4
2.81
· 10
4
–
–
5.25
· 10
4
1.91
· 10
2
RMSE
0.025
0.016
–
–
0.022
0.130
RSS
0.008
0.004
0.008
0.286
Logarithmic
a
1.37
1.32
–
–
1.41
5.24
k
1.87
· 10
2
1.98
· 10
2
–
–
2.19
· 10
2
2.08
· 10
3
c
3.87 · 10
1
2.88 · 10
1
–
–
4.07 · 10
1
4.21
v
2
5.91
· 10
5
4.01
· 10
4
–
–
4.20
· 10
5
2.37
· 10
2
RMSE
0.007
0.018
–
–
0.006
0.140
RSS
0.001
0.005
0.0004
0.332
Chavez-Mendez et al.
L
1
2.54
· 10
2
2.24
· 10
2
–
–
2.85
· 10
2
1.03
· 10
2
L
2
5.49
· 10
2
5.15
· 10
1
–
–
4.63
· 10
1
9.99
· 10
2
v
2
1.82
· 10
2
4.18
· 10
4
–
–
1.03
· 10
4
2.01
· 10
2
RMSE
0.012
0.019
–
–
0.009
0.133
RSS
0.002
0.005
0.001
0.301
Midilli et al.
a
9.99
· 10
1
1.01
–
–
1.01
9.97
· 10
1
k
3.08
· 10
2
1.13
· 10
2
–
–
2.62
· 10
2
1.96
· 10
3
n
8.93
· 10
1
1.26
–
–
1.02
1.39
b
4.18 · 10
3
3.23 · 10
3
–
–
3.48 · 10
3
2.51 · 10
3
v
2
1.59
· 10
5
2.73
· 10
4
–
–
4.73
· 10
4
2.49
· 10
2
RMSE
0.003
0.014
–
–
0.006
0.138
RSS
0.0001
0.003
0.0004
0.324
W.A.M. McMinn / Journal of Food Engineering 72 (2006) 113–123
121
mechanism (this differs for microwave and convective
drying techniques).
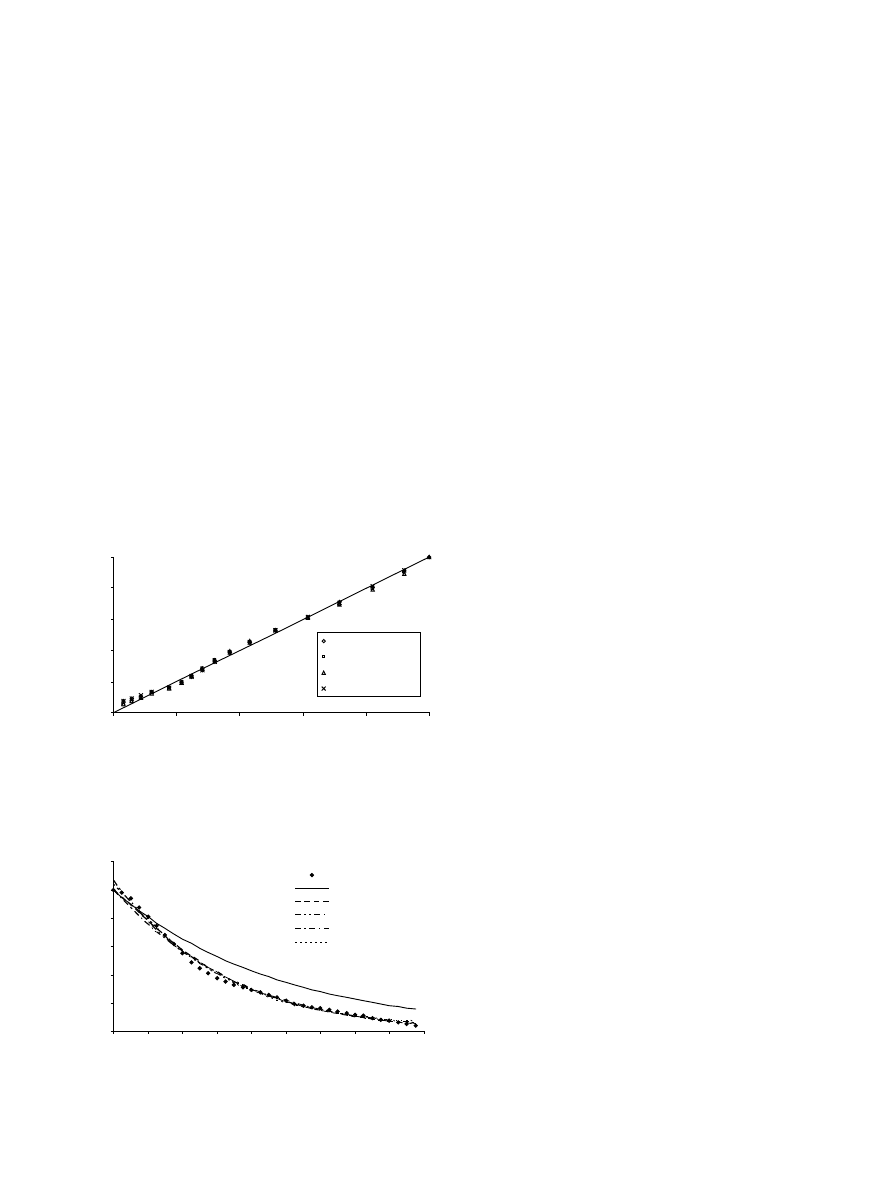
To validate the suitability of the models, the
experimental and predicted drying characteristics were
compared. The measured and calculated data for exem-
plary sets of processing conditions, namely microwave-
convective (Mw-C) (0.7 m s
1
/60
C) and microwave
(Mw), are presented in
, respectively. The
experimental data are closely correlated with the com-
puted data for the Page, Logarithmic, Chavez-Mendez
et al. and Midilli et al. models. This confirms the suit-
ability of the models to represent the experimental re-
sults. The observed deviation between the experimental
results and the moisture ratio values calculated using
the Lewis model (
) verifies its inability to represent
the drying behaviour.
and
found the Page equation to give a good approximation
of the drying kinetics in microwave-convective and
microwave systems, respectively, with
reporting the Midilli et al. equation as
the best model for describing the convective drying
curves of eggplants. Although the Lewis equation was
successfully adopted by
for the
microwave-vacuum drying of model fruits gels,
reported it to be inadequate to rep-
resent the microwave-assisted convective air drying
curves of carrots.
4. Conclusions
On the basis of this work the following conclusions
can be drawn.
• The generalized convective, microwave, microwave-
convective and microwave-vacuum drying profiles
consisted of an initial pre-heating phase, a constant
drying rate stage and two falling rate periods.
• Sample drying rate was dependent on system pressure
and presence/absence of external heating/cooling
sources.
• Of the 10thin-layer drying correlations considered,
the semi-theoretical Midilli et al. model provided
the best representation of the lactose powder drying
kinetics.
References
Abdelghani-Idrissi, M. A. (2001). Experimental investigations of
occupied volume effect on the microwave heating and drying
kinetics of cement powder in mono-mode cavity. Applied Thermal
Engineering, 21, 955–965.
Chavez-Mendez, C., Salgado-Cervantes, M. A., Garcia-Galindo, H.
S., De La Cruz-Medina, J., & Garcia-Alvarado, M. A. (1995).
Modelling of drying curves for some foodstuffs using kinetic
equation of high order. Drying Technology, 13, 2113–2122.
Dincer, I. (1998). Moisture loss from wood products during drying—
Part II: Surface moisture content distributions. Energy Source,
20(1), 77–83.
Drouzas, A. E., Tsami, E., & Saravacos, G. D. (1999). Microwave/
vacuum drying of model fruit gels. Journal of Food Engineering, 39,
117–122.
Ertekin, C., & Yaldiz, O. (2004). Drying of eggplant and selection of a
suitable thin layer drying model. Journal of Food Engineering,
63(3), 349–359.
Fortes, M., & Okos, M. R. (1980). In A. S. Mujumdar (Ed.), Drying
theories: their bases and limitations as applied to foods and grains.
Advances in Drying (vol. 1, pp. 119–153). New York: Hemisphere
Publishing.
Henderson, S. M., & Pabis, S. (1961). Grain drying theory I:
temperature effect on drying coefficient. Journal of Agriculture
Research Engineering, 6, 169–174.
Karathanos, V. T. (1999). Determination of water content of dried
fruits by drying kinetics. Journal of Food Engineering, 39, 337–344.
Kardum, J. P., Sander, A., & Skansi, D. (2001). Comparison of
convective, vacuum, and microwave drying chlorpropamide. Dry-
ing Technology, 19(1), 167–183.
Kiranoudis, C. T., Tsami, E., & Maroulis, Z. B. (1997). Microwave
vacuum drying kinetics of some fruits. Drying Technology, 15(10),
2421–2440.
0
0.2
0.4
0.6
0.8
1
0
0.2
0.4
0.6
0.8
1
Experimental Moisture Ratio
Predicted Moisture Ratio
Page
Logarithmic
Chavez-Mendez et al.
Midilli et al.
Fig. 5. Experimental and predicted drying curves for water wetted
lactose samples dried under microwave-convective (Mw-C) conditions
(0.7 m s
1
/60
C).
0
0.2
0.4
0.6
0.8
1
1.2
0
20
40
60
80
100
120
140
160
180
Time (min)
Moisture Ratio
Experimental
Lewis
Page
Logarithmic
Chavez-Mendez et al.
Midilli et al.
Fig. 6. Experimental and predicted drying curves for water wetted
lactose samples dried under microwave (Mw) conditions.
122
W.A.M. McMinn / Journal of Food Engineering 72 (2006) 113–123

Lewis, W. K. (1921). The rate of drying of solid materials. Journal of
Industrial Engineering., 13, 427–443.
Lu, L., Tang, J., & Ran, X. (1999). Temperature and moisture changes
during microwave drying of sliced food. Drying Technology, 17(3),
413–432.
McLoughlin, C. M., McMinn, W. A. M., & Magee, T. R. A. (2003a).
Microwave drying of multi-component powder systems. Drying
Technology, 21(2), 293–309.
McLoughlin, C. M., McMinn, W. A. M., & Magee, T. R. A. (2003b).
Microwave-vacuum drying of pharmaceutical powders. Drying
Technology, 134(1–2), 40–51.
McMinn, W. A. M., McLoughlin, C. M., & Magee, T. R. A., (in
press). Microwave-convective drying characteristics of pharmaceu-
tical powders. Powder Technology.
Midilli, A., Kucuk, H., & Yapar, Z. (2002). A new model for single-
layer drying. Drying Technology, 20, 1503–1513.
Ozdemir, M., & Devres, Y. O. (1999). The thin layer drying
characteristics of hazelnuts during roasting. Journal of Food
Engineering, 42, 225–233.
Page, G., (1949). Factors influencing the maximum rates of air drying
shelled corn in thin layers. MSc Thesis, Purdue University, Indiana,
USA.
Panchariya, P. C., Popovic, D., & Sharma, A. L. (2002). Thin-layer
modelling of black tea drying process. Journal of Food Engineering,
52, 349–357.
Parti, M. (1990). A theoretical model for thin-layer grain drying.
Drying Technology, 8, 101–122.
Parti, M. (1993). Selection of mathematical models for drying grain in
thin-layers. Journal of Agricultural Engineering Research, 54,
339–352.
Prabhanjan, D. G., Ramaswamy, H. S., & Raghavan, G. S. V. (1995).
Microwave-assisted convective air drying of thin layer carrots.
Journal of Food Engineering, 25, 283–293.
Sarsavadia, P. N., Sawhney, R. L., Pangavhane, D. R., & Singh, S. P.
(1999). Drying behaviour of brined onion slices. Journal of Food
Engineering, 40, 219–226.
Sharaf-Eldeen, Y. I., Blaisdell, J. L., & Hamdy, M. Y. (1980). A model
for air corn drying. Transactions of American Society of Agricul-
tural Engineers, 23, 1261–1265.
Sun, D. W., & Byrne, C. (1998). Selection of EMC/ERH isotherm
equations for rapeseed. Journal of Agricultural Engineering
Research, 69, 307–315.
Togrul, I. T., & Pehlivan, D. (2003). Modelling of drying kinetics of
single apricot. Journal of Food Engineering, 58, 23–32.
Verma, L. R., Bucklin, R. A., Endan, J. B., & Wratten, F. T. (1985).
Effects of drying air parameters on rice drying models. Transaction
of American Society of Agricultural Engineers, 28, 296–301.
Wang, C. Y., & Singh, R. P., (1978). A single layer drying equation for
rough rice. ASAE Paper No: 78-3001. St. Joseph, MI: ASAE.
White, G. M., Bridges, T. C., Loewer, O. J., & Ross, I. J., (1973). Seed
coat damage in thin layer drying of soybeans as effected by drying
conditions. ASAE Paper No: 78-3052. St. Joseph, MI: ASAE.
Yaldiz, O., & Ertekin, C. (2001). Thin layer solar drying of some
vegetables. Drying Technology, 19, 583–597.
W.A.M. McMinn / Journal of Food Engineering 72 (2006) 113–123
123
Document Outline
Wyszukiwarka
Podobne podstrony:
Microwave vacuum drying of model fruit gels (Drouzas, Tsami, Saravacos)
Characterization of microwave vacuum drying and hot air drying of mint leaves (Mentha cordifolia Opi
Mapping of temperature distribution in pharmaceutical microwave vacuum drying
Microwave vacuum drying of porous media experimental study and qualitative considerations of interna
Microwave vacuum drying of marine sediment determination of moisture content, metals and total carbo
Effective Moisture Diffusivity of Plain Yogurt Undergoing Microwave Vacuum Drying
Improving Grape Quality Using Microwave Vacuum Drying Associated with Temperature Control (Clary)
Improving Grape Quality Using Microwave Vacuum Drying Associated with Temperature Control (Clary)
Modelling of dehydration rehydration of orange slices in combined microwaveair drying
Drying kinetics and rehydration characteristics of microwave vacuum and convective hot air dried mus
Energy Consumption and Colour Characteristics of Nettle Leaves during Microwave, Vacuum and Convecti
The thin layer drying characteristics of hazelnuts during roasting
Drying kinetics and quality of beetroots dehydrated by combination of convective and vacuum microwav
Convective air drying characteristics of thin layer carrots
Microwave Convective and Microw Nieznany
więcej podobnych podstron