
Code-Red: a case study on the spread
and victims of an Internet worm
David Moore, Colleen Shannon, Jeffery Brown
Abstract— On July 19, 2001, more than 359,000 comput-
ers connected to the Internet were infected with the Code-
Red (CRv2) worm in less than 14 hours. The cost of this
epidemic, including subsequent strains of Code-Red, is es-
timated to be in excess of $2.6 billion. Despite the global
damage caused by this attack, there have been few seri-
ous attempts to characterize the spread of the worm, partly
due to the challenge of collecting global information about
worms. Using a technique that enables global detection of
worm spread, we collected and analyzed data over a period
of 45 days beginning July 2nd, 2001 to determine the charac-
teristics of the spread of Code-Red throughout the Internet.
In this paper, we describe the methodology we use to trace
the spread of Code-Red, and then describe the results of our
trace analyses. We first detail the spread of the Code-Red
and CodeRedII worms in terms of infection and deactiva-
tion rates. Even without being optimized for spread of infec-
tion, Code-Red infection rates peaked at over 2,000 hosts per
minute. We then examine the properties of the infected host
population, including geographic location, weekly and diur-
nal time effects, top-level domains, and ISPs. We demon-
strate that the worm was an international event, infection ac-
tivity exhibited time-of-day effects, and found that, although
most attention focused on large corporations, the Code-Red
worm primarily preyed upon home and small business users.
We also qualified the effects of DHCP on measurements of
infected hosts and determined that IP addresses are not an
accurate measure of the spread of a worm on timescales
longer than 24 hours. Finally, the experience of the Code-
Red worm demonstrates that wide-spread vulnerabilities in
Internet hosts can be exploited quickly and dramatically,
and that techniques other than host patching are required
to mitigate Internet worms.
Keywords—Code-Red, Code-RedI, CodeRedI, CodeRedII,
worm, security, backscatter, virus, epidemiology
CAIDA, San Diego Supercomputer Center, University of California,
San Diego. E-mail:
{
cshannon,dmoore,kc
}
@caida.org
.
Support for this work is provided by DARPA NMS Grant N66001-
01-1-8909, NSF grant NCR-9711092, Cisco Systems URB Grant, and
Caida members.
I. I
NTRODUCTION
At 18:00 on November 2, 1988, Robert T. Morris re-
leased a 99 line program onto the Internet. At 00:34 on
November 3, 1988, Andy Sudduth of Harvard University
posted the following message: “There may be a virus loose
on the Internet.” Indeed, Sun and VAX machines across
the country were screeching to a halt as invisible tasks uti-
lized all available resources [1] [2].
No virus brought large computers across the country to
a standstill – the culprit was actually the first malicious
worm. Unlike viruses and trojans which rely on human
intervention to spread, worms are self-replicating software
designed to spread throughout a network on their own. Al-
though the Morris worm was the first malicious worm to
wreak widespread havoc, earlier worms were actually de-
signed to maximize utilization of networked computation
resources. In 1982 at Xerox’s Palo Alto Research Cen-
ter, John Shoch and Jon Hupp wrote five worm programs
that performed such benign tasks as posting announce-
ments [3]. However, research into using worm programs
as tools was abandoned after it was determined that the
consequences of a worm malfunction could be dire.
In the years between the Morris worm in November
1988 and June 2001, Several other worms achieved lim-
ited spread through host populations. The WANK (Worms
Against Nuclear Killers) worm of October, 1989 attacked
SPAN VAX/VMS systems via DECnet protocols [4]. The
Ramen worm, first spread in January of 2001 targeted the
wu-ftp daemon on RedHat Linux 6.2 and 7.0 systems [5].
Finally, the Lion Worm targeted the TSIG vulnerability in
BIND in March of 2001 [6].
While all of these worms caused some damage, none
approached the $2.6 billion cost of recovering from the
Code-Red and CodeRedII worms [7]. We can no longer af-
ford to remain ignorant of the spread and effects of worms
as information technology plays a critical role in our global
economy.
II. B
ACKGROUND
On June 18, 2001, eEye released information about
a buffer-overflow vulnerability in Microsoft’s IIS web
servers [8]. Microsoft released a patch for the vulnera-
bility eight days later, on June 26, 2001 [9]. Then on July

12, 2001, the Code-RedI worm began to exploit the afore-
mentioned buffer-overflow vulnerability in Microsoft’s IIS
web servers.
Upon infecting a machine, the worm checks to see if the
date (as kept by the system clock) is between the first and
the nineteenth of the month. If so, the worm generates a
random list of IP addresses and probes each machine on
the list in an attempt to infect as many computers as pos-
sible. However, this first version of the worm uses a static
seed in its random number generator and thus generates
identical lists of IP addresses on each infected machine.
The first version of the worm spread slowly, because each
infected machine began to spread the worm by probing
machines that were either already infected or impregnable.
On the 20th of every month, the worm is programmed to
stop infecting other machines and proceed to its next at-
tack phase in which it launches a Denial-of-Service attack
against
www1.whitehouse.gov
from the 20th to the
28th of each month. The worm is dormant on days of the
month following the 28th.
On July 13th, Ryan Permeh and Marc Maiffret at eEye
Digital Security received logs of attacks by the worm and
worked through the night to disassemble and analyze the
worm. They christened the worm “Code-Red” both be-
cause the highly caffeinated “Code Red” Mountain Dew
beverage fueled their efforts to understand the workings
of the worm and because the worm defaces some web
pages with the phrase “Hacked by Chinese”. There is no
evidence either supporting or refuting the involvement of
Chinese hackers with the Code-RedI worm. The first ver-
sion of the Code-Red worm (Code-RedI v1
1
) caused little
damage. Although the worm’s attempts to spread itself
consumed resources on infected machines and local area
networks, it had little impact on global resources.
The Code-RedI v1 worm is memory resident, so an in-
fected machine can be disinfected by simply rebooting it.
However, the machine is still vulnerable to repeat infec-
tion. Any machines infected by Code-RedI v1 and sub-
sequently rebooted were likely to be reinfected, because
each newly infected machine probes the same list of IP
addresses in the same order.
At approximately 10:00 UTC in the morning of July
19th, 2001, we observed a change in the behavior of the
worm as infected computers began to probe new hosts.
At this point, a random-seed variant of the Code-RedI v1
worm began to infect hosts running unpatched versions of
Microsoft’s IIS web server. The worm still spreads by
1
Although the initial Code-Red worm did not carry a suffix denoting
its temporal position, we have added the suffix “I” in the interest of
clarity, in the same manner as The Great War later came to be known
as World War I.
probing random IP addresses and infecting all hosts vul-
nerable to the IIS exploit. Unlike Code-RedI v1, Code-
RedI v2 uses a random seed in its pseudo-random number
generator, so each infected computer tries to infect a differ-
ent list of randomly generated IP addresses at an observed
rate of roughly 11 probes per second (pps). This seemingly
minor change had a major impact: more than 359,000 ma-
chines were infected with Code-RedI v2 in just fourteen
hours [10][11].
Because Code-RedI v2 is identical to Code-Red v1 in
all respects except the seed for its pseudo-random num-
ber generator, the only direct damage to the infected host
is the “Hacked by Chinese” message added to top level
web pages on some hosts. However, Code-RedI v2 had a
greater impact on global infrastructure due to the sheer vol-
ume of hosts infected and probes sent to infect new hosts.
Code-RedI v2 also wreaked havoc on some additional
devices with web interfaces, such as routers, switches,
DSL modems, and printers [12]. Although these devices
were not susceptible to infection by the worm, they either
crashed or rebooted when an infected machine attempted
to send them the unusual http request containing a copy of
the worm.
Like Code-RedI v1, Code-RedI v2 can be removed from
a computer simply by rebooting it. However, rebooting the
machine does not prevent reinfection once the machine is
online again. On July 19th, the number of machines at-
tempting to infect new hosts was so high that many ma-
chines were infected while the patch for the vulnerability
was being applied.
On August 4, 2001, an entirely new worm, CodeRedII
began to exploit the buffer-overflow vulnerability in Mi-
crosoft’s IIS web servers [13] [14]. Although the new
worm is completely unrelated to the original Code-RedI
worm, the source code of the worm contained the string
“CodeRedII” which became the name of the new worm.
Ryan Permeh and Marc Maiffret analyzed CodeRedII
to determine its attack mechanism. When a worm infects
a new host, it first determines if the system has already
been infected. If not, the worm initiates its propagation
mechanism, sets up a “backdoor” into the infected ma-
chine, becomes dormant for a day, and then reboots the
machine. Unlike Code-RedI, CodeRedII is not memory
resident, so rebooting an infected machine does not elimi-
nate CodeRedII.
Initial intuition might lead one to believe that this
twenty-four hour delay will retard the spread of the worm
so severely that it will never compromise a large number
of machines, this is not the case. The delay adds a layer
of subterfuge to the worm, since perusal of logs showing
connections to the machine around the time that the ma-
chine begins to demonstrate symptoms of the infection (i.e.
when it starts to actively spread the worm) will not yield
any unusual activity.
After rebooting the machine, the CodeRedII worm be-
gins to spread. If the host infected with CodeRedII has
Chinese (Taiwanese) or Chinese (PRC) as the system lan-
guage, it uses 600 threads to probe other machines. On
all other machines it uses 300 threads. CodeRedII uses
a more complex method of selecting hosts to probe than
Code-RedI. CodeRedII generates a random IP address and
then applies a mask to produce the IP address to probe.
The length of the mask determines the similarity between
the IP address of the infected machine and the probed ma-
chine. CodeRedII probes a completely random IP address
1/8th of the time. Half of the time, CodeRedII probes a
machine in the same /8 (so if the infected machine had
the IP address 10.9.8.7, the IP address probed would start
with 10.), while 3/8ths of the time, it probes a machine
on the same /16 (so the IP address probed would begin
with 10.9.). Like Code-RedI, CodeRedII avoids probing
IP addresses in the 224.0.0.0/8 (multicast) and 127.0.0.0/8
(loopback) address spaces. The bias toward the local /16
and /8 networks means that an infected machine may be
more likely to probe a susceptible machine, based on the
supposition that machines on a single network are more
likely to be running the same software as machines on un-
related IP subnets.
The CodeRedII worm is much more dangerous than
Code-RedI because CodeRedII installs a mechanism for
remote, administrator-level access to the infected machine.
Unlike Code-RedI, CodeRedII neither defaces web pages
on infected machines nor launches a Denial-of-Service at-
tack. However, the backdoor installed on the machine al-
lows any code to be executed, so the machines could be
used as “zombies” for future attacks (Denial-of-Service or
otherwise).
III. M
ETHODOLOGY
In this section, we detail our trace collection methodol-
ogy, how we validated that the traffic we trace is from the
spread of the worms, and describe our approaches for char-
acterizing the type of hosts infected and their geographics
locations.
Our analysis of the Code-RedI worm covers the spread
of the worm between July 4, 2001 and August 25, 2001.
Before Code-RedI began to spread, we were collecting
data in the form of a packet header trace of hosts sending
unsolicited TCP SYN packets into our /8 network. When
the worm began to spread extensively on the morning of
July 19, we noticed the sudden influx of probes into our
network and began our monitoring efforts in earnest.
The data used for this study were collected from two lo-
cations: a /8 network and two /16 networks. Two types
of data from the /8 network are used to maximize cov-
erage of the expansion of the worm. Between midnight
and 16:30 UTC on July 19, a passive network monitor
recorded headers of all packets destined for the /8 research
network. After 16:30 UTC, a filter installed on a campus
router to reduce congestion caused by the worm blocked
all external traffic to this network. Because this filter was
put into place upstream of the monitor, we were unable
to capture IP packet headers after 16:30 UTC. However, a
backup data set consisting of sampled netflow [15] output
from the filtering router was available for the /8 through-
out the 24 hour period. The data from the /16 networks
were collected with Bro between 10:00 UTC on July 19
and 7:00 on July 20 [16]. We merged these three sources
into a single dataset. Hosts were considered to be infected
if they sent at least two TCP SYN packets on port 80 to
nonexistent hosts on these networks during this time pe-
riod. The requirement of two packets helps to eliminate
random source denial-of-service attacks from the Code-
Red data.
Early on July 20, the filter was removed and we resumed
packet header data collection. Although we collected data
through October, we include data through August 25, 2001
in this study. No significant changes were observed in
Code-RedI or CodeRedII activity between August 2001
and the pre-programmed shutdown of CodeRedII on Oc-
tober 1, 2001.
0
200
400
600
800
1000
1200
1400
1600
1800
00:00
07/05
00:00
07/12
00:00
07/19
Unique hosts per 2 hour bucket
Time (UTC)
All port 80 probes
CRv1 candidates
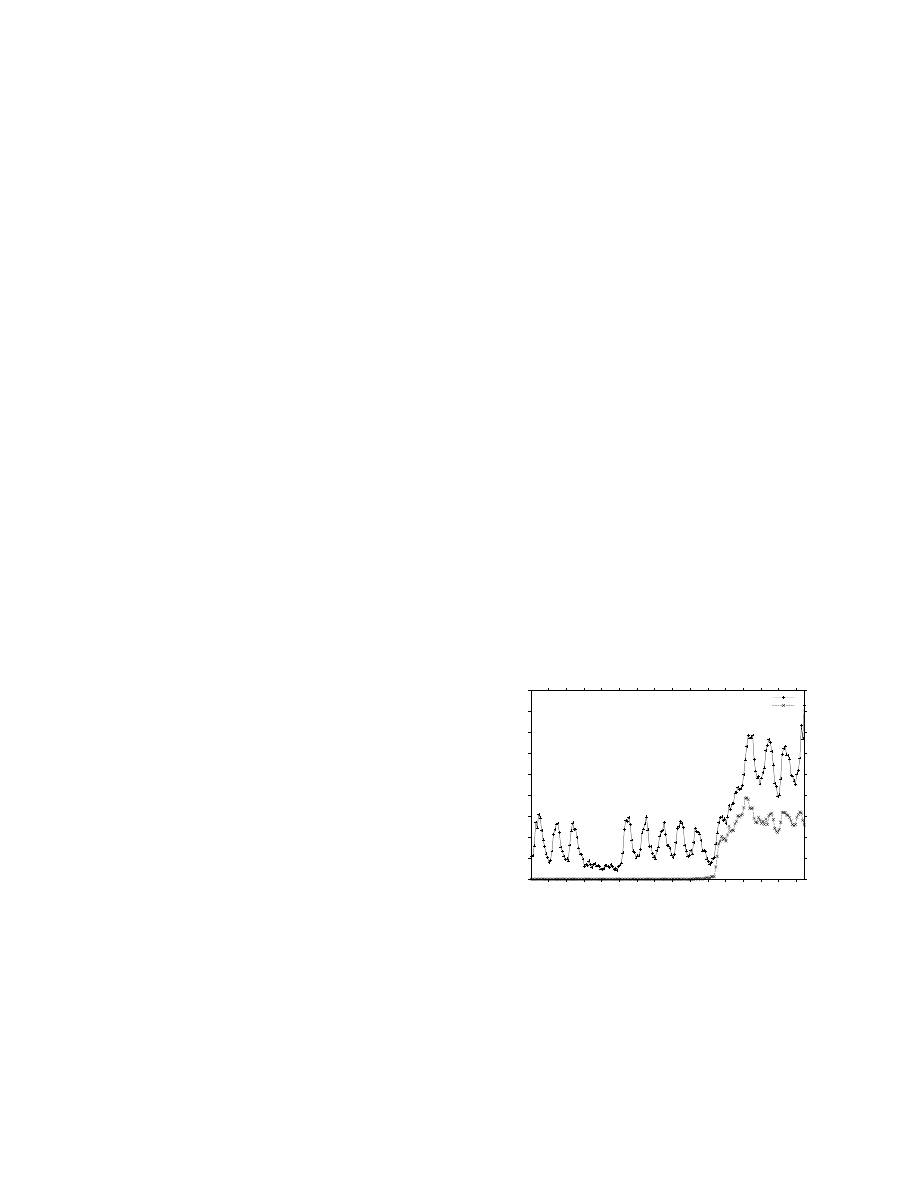
Fig. 1.
Background level of unsolicited SYN probes and the
beginning of the spread of the Code-RedI worm.
A constant background level of unsolicited TCP SYN
packets, most likely port scans seeking to identify vulnera-
ble machines, target the IPv4 address space. In our /8, this
rate fluctuates between 100 and 600 hosts per two hour
period, with diurnal and weekly variations. On July 12,
the static-seed version of the Code-RedI worm began to
spread. We noticed that the hosts that appeared clearly in-
fected with Code-RedI v1 probed the same set of 23 IP
addresses within our /8 research network. In Figure 1, we
used the criterion of probing these 23 addresses to separate
the Code-RedI v1 probes from the background port scans.
To confirm that the 23 addresses were actually among
those probed by the worm, we reverse engineered the ex-
ploit to extract the IP addresses probed by its static-seed
pseudo-random number generator. We obtained a disas-
sembled version of the worm from eEye [17] and identified
the code responsible for spreading the worm. The worm
creates one hundred threads, each with its own static-seed
and thus its own distinct, although not disjoint, set of IP
addresses probed sequentially.
We examined the PRNG (Pseudo-Random Number
Generator) code used to generate the target sequences and
wrote a C implementation to generate the first one thou-
sand IP addresses probed by each thread (approximately
the first one million IP addresses). We extracted the IP ad-
dresses that fell in our /8 and found the same 23 address
sequence we predicted from our packet trace data. The
23 addresses that fall in our research network actually oc-
cur very early in the generated sequences
2
.
A machine
newly infected with Code-RedI v1 probes our /8 network
23 times in the first fifteen minutes of propagation.
Once we had identified the IP addresses initially probed
by the worm, we compared this sequence to the hosts
we observed probing the 23 target addresses in our re-
search network. We discovered that the first three hosts
that probed our /8 research network were not contained in
the IP address sequence probed by any thread. We be-
lieve that the individual (or individuals) responsible for
the Code-RedI worm compromised these machines and
seeded them with the worm to initiate the epidemic. The
first two machines both appear to be located in the United
States, one in Cambridge, Massachusetts and the other in
Atlanta, Georgia. The third address appears to be in the
city of Foshan in China’s GuangDong province. However
there remains no evidence linking Chinese hackers to the
development or deployment of the Code-RedI worm.
We classify infected hosts using the DNS name of each
host and a hand-tuned set of regular expression matches
3
(e.g. DNS names with “dialup” represent modems, “dsl”
or “home.com” identifies broadband, etc.) into the follow-
2
IP addresses in the monitored class A network occurred early in each
of the 100 threads started on Code-RedI v1 infected machines. Probe
sequence numbers within their threads included: 8, 12, 14, 20, 22, 25,
26, 29, 32, 34, 36, 40, 41, 41, 43, 43, 44, 45, 45, 51, 56, 57, 59. Thus
we are able to detect the compromise of a new host almost instantly
as we receive many probes from the host in the first minute following
infection.
3
The regular expressions are available at
http://www.caida.
org/tools/measurement/misc/HostClassify
ing categories: mail servers, name servers, web servers,
IRC servers, firewalls, dial-up, broadband, other (unclassi-
fiable) hosts, and hosts with no hostname. The prevalence
of each type of host is discussed in Section IV-B.4.
We also used Ixia’s IxMapping [18] service to determine
the latitude, longitude, and country of each IP address in-
fected with the worm. IxMapping uses public data sources
such as
WHOIS
and DNS, as well as specialized measure-
ment to geographically place IP addresses. We identified a
rough approximation of the timezone of each infected host
based on this longitude.
IV. R
ESULTS
In this section of the paper, we present the results of
our trace analyses. We first characterize the spread of the
Code-RedI and CodeRedII worms, then examine the prop-
erties of the infected host population, and finally determine
the rate at which infected hosts are repaired.
A. Worm Spread
In this section, we examine the dynamics of the spread
of the Code-RedI and CodeRedII worms.
A.1 Host Infection Rate
We detected more than 359,000 unique IP addresses
4
in-
fected with the Code-RedI worm between midnight UTC
on July 19 and midnight UTC on July 20. To determine
the rate of host infection, we recorded the time of the first
attempt of each infected host to spread the worm. Because
our data represent only a sample of all probes sent by in-
fected machines, the number of hosts detected provides a
lower bound on the number of hosts that have been com-
promised at any given time.
0
50000
100000
150000
200000
250000
300000
350000
400000
00:00
07/19
04:00
08:00
12:00
16:00
20:00
00:00
07/20
04:00
infected hosts
time (UTC)
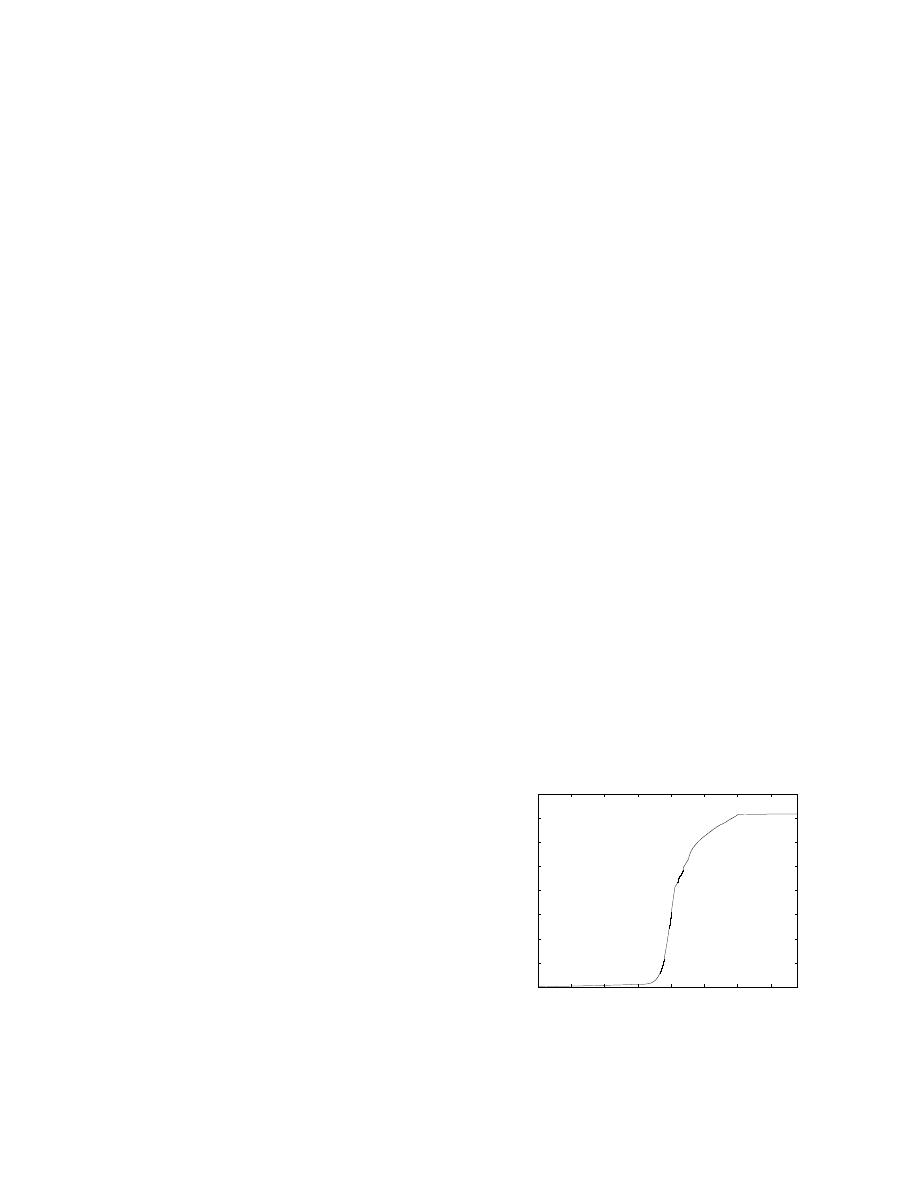
Fig. 2. Cumulative total of unique IP addresses infected by the
first outbreak of Code-RedI v2.
4
We required at least 2 probes from each host to two different ad-
dresses before we conclusively identified it as infected.
100
1000
10000
100000
1e+06
00:00
07/19
04:00
08:00
12:00
16:00
20:00
00:00
07/20
04:00
infected hosts
time (UTC)
measured
C=360000; K=1.6; T=16
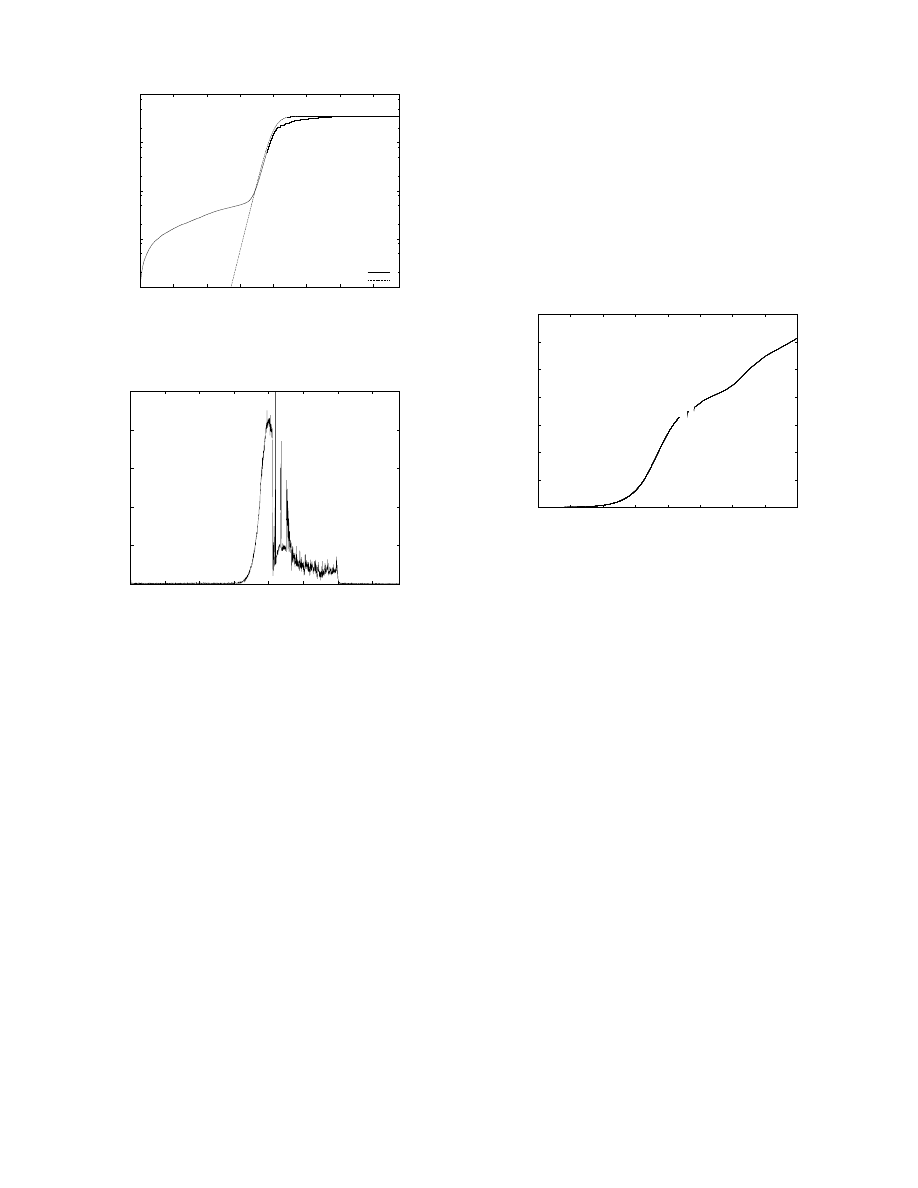
Fig. 3. Comparison of the growth rate of the first outbreak of
Code-RedI v2 with infection model.
0
500
1000
1500
2000
2500
00:00
07/19
04:00
08:00
12:00
16:00
20:00
00:00
07/20
04:00
new hosts per minute
time (UTC)
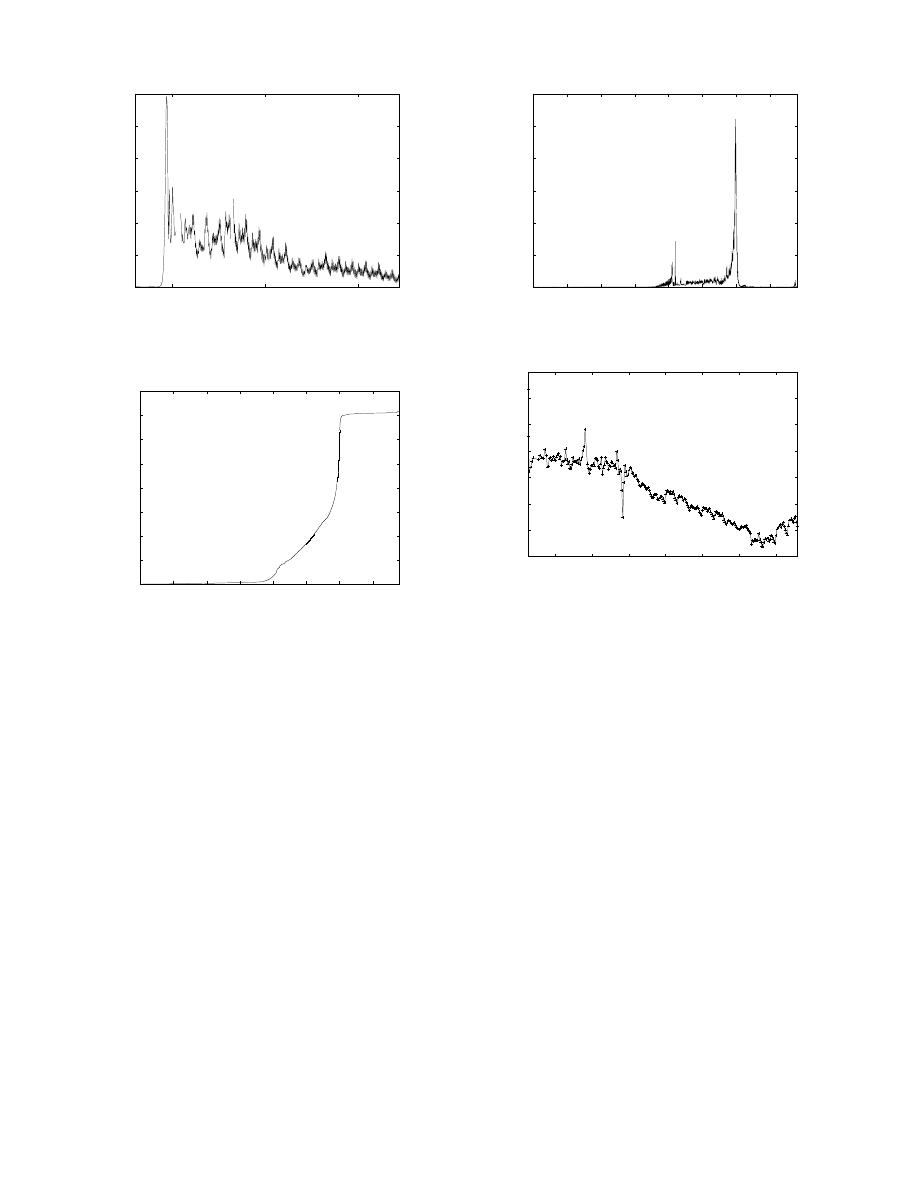
Fig. 4. One minute infection rates for Code-RedI v2.
Figure 2 shows the number of infected hosts over time.
The growth of the curve between 11:00 and 16:30 UTC is
exponential, as can be seen in the logarithmic scale plot
(Figure 3). On the surface, the data seems to fit reasonably
with the growth model for the worm infection proposed
by Stuart Staniford [11]. Discrepancies between the upper
ranges of the growth model and our data are caused both
by the fixed cutoff time of the worm itself and by hosts
repaired or isolated throughout the day.
Figure 4 provides a more detailed view of the spread of
the worm in terms of the number of newly infected hosts
seen in 1 minute periods throughout the day. In the figure,
we see that the infection rate peaked at 2,000 host/minute.
Unfortunately, the peak of the initial curve occurs at about
the same time that the passive monitor data became un-
available, so the duration of the 2,000 host/minute infec-
tion rate is unknown. In particular, the large spike corre-
sponds to 7,700 hosts; it is an anomaly caused by a small
gap in the collected netflow data that resulted in detection
of all hosts infected during the down time when collection
resumed. Thus the spike in the number of hosts infected
is actually representative of all the hosts infected between
16:51 and 17:21 UTC. We believe that in actuality the in-
fection rate from 16:30 to 18:00 UTC tapered smoothly.
Although the growth was slowing, had the worm not
been programmed to stop spreading at midnight, addi-
tional hosts would have been compromised. The infection
rate would have continued to decrease once the vast ma-
jority of vulnerable machines were infected. We speculate
that the memory resident status of this worm would have
allowed reinfection of many hosts after a reboot cleared
the initial infection..
0
50000
100000
150000
200000
250000
300000
350000
00:00
08/01
04:00
08/01
08:00
12:00
16:00
20:00
00:00
08/02
04:00
08:00
infected hosts
time (UTC)
Fig. 5. Cumulative total of unique IP addresses infected during
the first day of the second outbreak of Code-RedI v2.
On August 1, the Code-RedI v2 worm began to spread
again in earnest. By midnight, we had observed approxi-
mately 275,000 unique IP addresses spreading the Code-
RedI v2 worm, as seen in Figure 5. The difference between
the infected host count at 24 hours for the first and second
outbreaks of Code-RedI v2 is likely caused by the patching
of hosts, which removed them from the susceptible popu-
lation.
Figure 6 shows the rate at which new hosts were in-
fected with the Code-RedI v2 worm. The spread of the
outbreak peaked in the early afternoon of August 1, with
29710 hosts infected in the hour following 14:00 UTC and
28583 following 15:00 UTC. A rate of more than twenty
thousand new hosts per hour was sustained from 13:00
through 17:00 UTC. After this point, the host population
approached saturation with the worm – when almost all
susceptible hosts are already infected by the worm, it be-
comes increasingly difficult to locate new hosts.
A.2 Deactivation rate
During the course of the day on July 19, a few ini-
tially infected machines were patched, rebooted, or filtered
and consequently ceased to probe networks for vulnerable
hosts. We consider a host that was previously infected to
be inactive after we have observed no further unsolicited
0
5000
10000
15000
20000
25000
30000
00:00
08/02
00:00
08/09
00:00
08/16
new hosts per hour
time (UTC)
Fig. 6. Hourly infection rates for the second outbreak of Code-
RedI v2 between August 1 and August 19, 2001.
0
50000
100000
150000
200000
250000
300000
350000
400000
00:00
07/19
04:00
08:00
12:00
16:00
20:00
00:00
07/20
04:00
infected hosts stopping time
time (UTC)
Fig. 7. Cumulative total of deactivated Code-RedI v2. infected
hosts.
traffic from it. Figure 7 shows the total number of inac-
tive hosts over time. The majority of hosts stopped prob-
ing in the last hour before midnight UTC on July 20. At
midnight, the worm was programmed to switch from an
“infection phase” to an “attack phase”, so the large rise in
host inactivity is due to this design. The end of day phase
change can be seen clearly in Figure 8, which shows the
number of newly inactive hosts per minute. As in previ-
ous graphs, the spike near 16:30 is caused by a gap in data
collection.
A.3 CodeRedII
Because the CodeRedII worm infects the same host pop-
ulation as Code-RedI v2, we neither expected nor mea-
sured an increase in the number of hosts probing our net-
work once the CodeRedII worm began to spread. We also
monitored no significant difference in the overall number
of unsolicited TCP SYNs. Figure 9 shows the raw probe
rate (including both worm spread and port scans) into our
/8 network for every 2 hours between August 1 and Au-
gust 22. The spike in probes on August 6 shows backscat-
0
2000
4000
6000
8000
10000
12000
00:00
07/19
04:00
08:00
12:00
16:00
20:00
00:00
07/20
04:00
unique hosts per minute
time (UTC)
Fig. 8. Rate of infected host deactivation in one minute periods.
1000
2000
3000
4000
5000
6000
7000
8000
00:00
08/04
00:00
08/07
00:00
08/10
00:00
08/13
00:00
08/16
00:00
08/19
00:00
08/22
packets per second
time (UTC)
Fig. 9. The raw probe rate observed in our /8 network.
ter from a Denial-of-Service attack [19], while the dip on
August 9 was caused by a gap in data collection. No
change in probe rate is apparent following the spread of
CodeRedII. Although CodeRedII uses six times as many
threads to spread as Code-RedI v2, only one probe in eight
is sent to a random IP address, with the rest sent to lo-
cal networks as described in Section III. Because our /8
network contained no susceptible hosts, the net probe rate
we observe from CodeRedII is the same as that of Code-
RedI v2. Thus, we cannot distinguish hosts infected with
CodeRedII from those infected with Code-RedI v2 without
collecting packet payloads. In their October 2001 study,
Arbor Networks measured the ratio between Code-RedI
and CodeRedII probes to be 1:3 [20]. This 1:3 ratio may
indicate the ratio between hosts infected with CodeRedII
versus CodeRedI. However, we expect that the bias to-
wards hosts on the same subnet causes wide variations
in the actual probe rates measured at different locations
across the Internet.
B. Host Characterization
In this section, we look at the properties of the host pop-
ulation infected by the Code-RedI and CodeRedII worms.
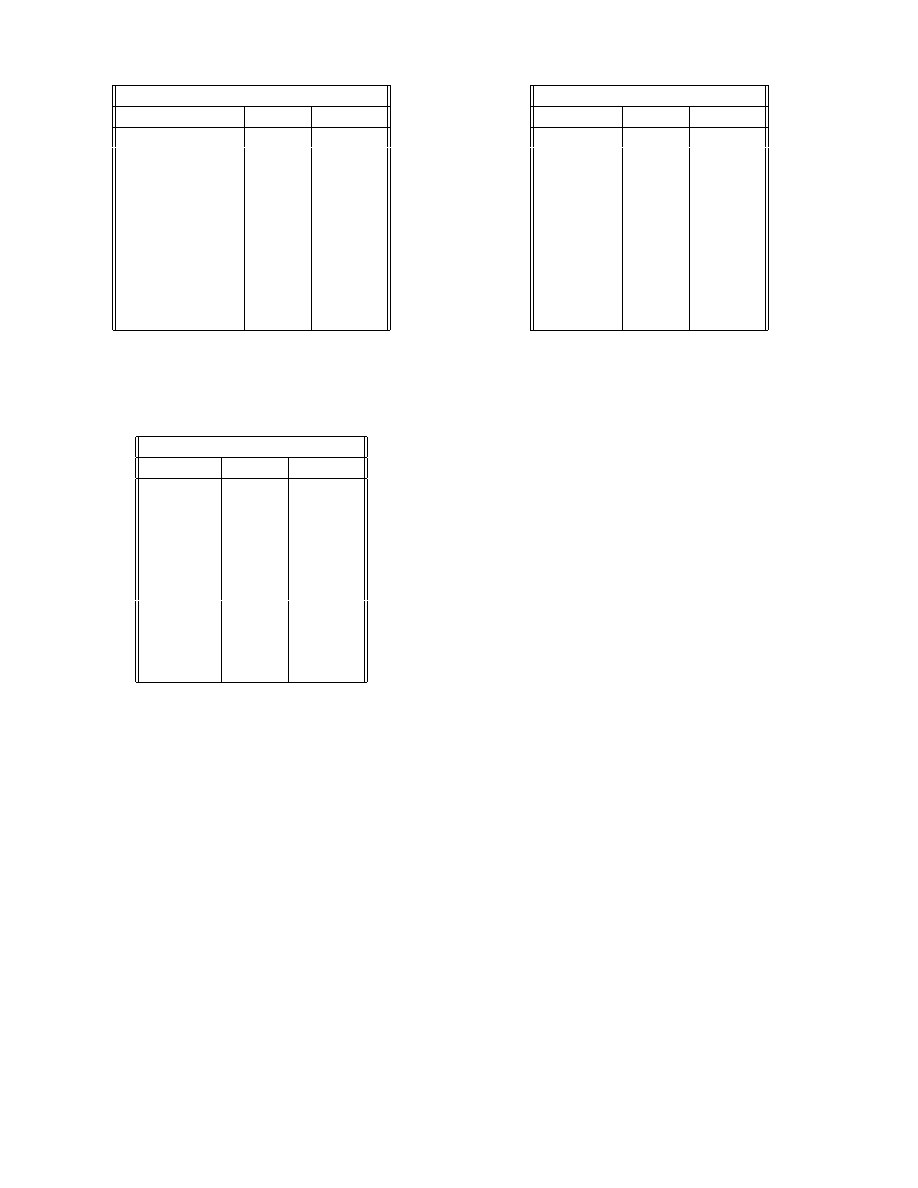
Top 10 Countries
Country
hosts
hosts(%)
United States
157694
43.91
Korea
37948
10.57
China
18141
5.05
Taiwan
15124
4.21
Canada
12469
3.47
United Kingdom
11918
3.32
Germany
11762
3.28
Australia
8587
2.39
Japan
8282
2.31
Netherlands
7771
2.16
TABLE I
T
OP TEN COUNTRIES WITH
C
ODE
-R
ED INFECTED HOSTS ON
J
ULY
19.
Top 10 Top-Level Domains
TLD
hosts
hosts(%)
Unknown
169584
47.22
net
67486
18.79
com
51740
14.41
edu
8495
2.37
tw
7150
1.99
jp
4770
1.33
ca
4003
1.11
it
3076
0.86
fr
2677
0.75
nl
2633
0.73
TABLE II
T
OP TEN TOP
-
LEVEL DOMAINS WITH
C
ODE
-R
ED INFECTED
HOSTS ON
J
ULY
19.
B.1 Countries
To understand the demography of the Code-RedI v2 epi-
demic on July 19, we examined the domains, geographic
locations, and top level domains (TLDs) of the infected
hosts. Table I shows the breakdown of hosts by coun-
try, as placed by IxMapping [18]. Surprisingly, Korea is
the second most prevalent source country of compromised
machines, with 10.57% of all infected hosts.
B.2 Top-Level Domains
Table II provides a breakdown of machines infected on
July 19th by top-level domain (TLD). NET, COM, and
EDU are all represented in proportions roughly equivalent
to their estimated share of all existing hosts, as estimated
by NetSizer [21]. We also observed 136 MIL and 213
Top 10 Domains
Domains
hosts
hosts(%)
Unknown
169584
47.22
home.com
10610
2.95
rr.com
5862
1.63
t-dialin.net
5514
1.54
pacbell.net
3937
1.10
uu.net
3653
1.02
aol.com
3595
1.00
hinet.net
3491
0.97
net.tw
3401
0.95
edu.tw
2942
0.82
TABLE III
T
OP TEN DOMAINS WITH
C
ODE
-R
ED INFECTED HOSTS ON
J
ULY
19.
GOV hosts infected by the worm. Approximately 50% of
all July 19th infected hosts had no reverse DNS records,
so they could not be classified by their domain names.
These included, for example, 390 addresses in the reserved
network space 10.0.0.0/8. These machines were probably
on private networks and were infected via either an exter-
nal interface or another machine accessible via both inter-
nal and external networks. This suggests that many more
hosts on internal networks may have been compromised in
a manner transparent to our monitor.
B.3 Domain Names
Table III shows the top ten domains in terms of the
number of infected hosts. We note that the top domain
names are providers of home and small business connec-
tivity, suggesting that hosts maintained by individuals at
home are an important aspect of global Internet health.
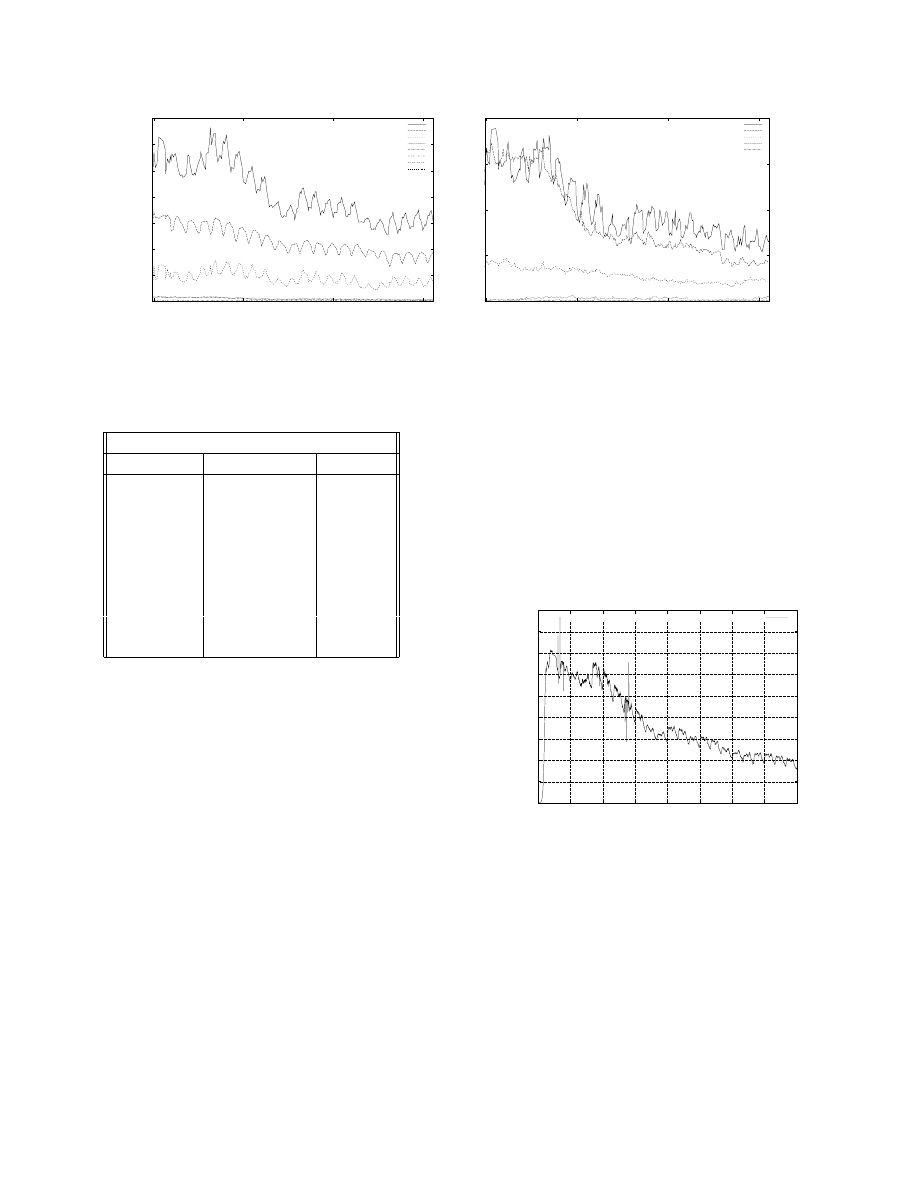
B.4 Host Classification
We utilized the reverse DNS records for the August
Code-Red infected hosts to identify the function of the
compromised machines. While reverse DNS records did
not exist for 55% of the hosts infected in August 2001,
we did manage to identify about 22% of the host types.
Computers without reverse DNS records are less likely to
be running major services (such as those demonstrated in
the other host types). Broadband and dial-up services rep-
resented the vast majority of identifiable hosts, as shown
in Figure 10(a). Furthermore, the large diurnal variations
in the number of infected hosts suggest that these ma-
chines are unlikely to be running production web servers
of any kind, a surprising result given that the worm at-
tacks a vulnerability in web servers. This periodicity con-
0
1000
2000
3000
4000
5000
6000
7000
00:00
08/02
00:00
08/09
00:00
08/16
00:00
08/23
unique active hosts per two hours
time (UTC)
Code-Red Infected Hosts By Host Type
Other
Broadband
Dial-Up
Mail Server
Web Server
Nameserver
Firewall
IRC Server
(a) All hosts with reverse DNS records.
0
50
100
150
200
00:00
08/02
00:00
08/09
00:00
08/16
00:00
08/23
unique active hosts per two hours
time (UTC)
Code-Red Infected Hosts By Host Type
Mail Server
Web Server
Nameserver
Firewall
IRC Server
(b) A closer look at the lower ranges.
Fig. 10. Reverse DNS Record-based classification of Code-Red hosts.
DNS-based host types
Type
Average Hosts
Hosts(%)
Unknown
88116
54.8
Other
37247
23.1
Broadband
19293
12.0
Dial-Up
14532
9.0
Web
846
0.5
731
0.5
Nameserver
184
0.1
Firewall
9
0.0
IRC
2
0.0
TABLE IV
T
HE CLASSIFICATIONS OF HOSTNAMES BASED ON
REVERSE
-DNS
LOOKUPS OF THE
IP
ADDRESSES OF
C
ODE
-R
ED INFECTED HOSTS BETWEEN
A
UGUST
1
AND
A
UGUST
8, 2001. S
HOWN HERE ARE THE AVERAGE
NUMBER OF ACTIVE HOSTS IN EACH TWO HOUR INTERVAL
AND THE OVERALL PERCENTAGE OF EACH TYPE OF HOST
ACROSS THE WHOLE SEVEN DAY INTERVAL
. U
NKNOWN
HOSTS HAD NO REVERSE
DNS
RECORDS
.
trasts with the limited diurnal variation seen in the number
of infected web and DNS servers in Figure 10(b), which
show limited fluctuations from day to day. We do ob-
serve significant diurnal changes in the number of infected
mail servers, indicating that we may be mis-identifying
the function of a number of these computers. Overall, the
number of broadband and dial-up users affected by this
random-source worm seems to significantly exceed those
affected by random-source denial-of-service attacks [19].
While 21% of all hosts compromised by Code-Red were
home and small business machines, only 13% of random-
source denial-of-service attack targets shared this charac-
teristic. And while web servers, mail servers, and name-
servers were the target of 5% of all denial-of-service at-
tacks, they represent only 1.1% of the computers infected
by the Code-Red worm.
B.5 Timezones
0
20000
40000
60000
80000
100000
120000
140000
160000
180000
00:00
08/01
00:00
08/04
00:00
08/07
00:00
08/10
00:00
08/13
00:00
08/16
00:00
08/19
00:00
08/22
00:00
08/25
infected hosts
time (UTC)
unique hosts seen per 10 minute interval
Fig. 11. Unique IP addresses infected with Code-RedI v2 in ten
minute intervals.
Figure 11 shows the number of unique IP addresses in-
fected with Code-RedI v2 in ten minute intervals. From
the figure, we see that the number of infected hosts fol-
lows both diurnal and weekly variations. While the slight
decrease in infected hosts on the weekends (Aug 4-5, 11-
12, and 18-19) is immediately apparent, the origins of the
rather strangely shaped daily variations proved perplexing.
Suspecting that the varying local times of day obscured
the infection pattern, we identified the longitude of each
infected host via IxMapping and mapped each host to an
approximate timezone. We ignored minor variations in
0
10000
20000
30000
40000
50000
60000
00:00
08/02
00:00
08/04
00:00
08/06
00:00
08/08
00:00
08/10
unique active hosts per two hours
localtime
+0900 (JST)
-0400 (EDT)
+0200 (CEST)
-0500 (CDT)
-0700 (PDT)
-0600 (MDT)
+0700 (WAST)
-0300 (ADT)
+0000 (GMT)
+0300 (EEST)
Fig. 12.
Unique IP addresses infected with Code-RedI v2 in
two hour intervals, localtime.
the longitudinal boundaries of timezones, as well as differ-
ences in observation of daylight saving within a timezone.
We then recreated the interval of Figure 11 between Au-
gust 2 and August 10, differentiating infected hosts ac-
cording to local time, rather than UTC.
Figure 12 shows the results of this differentiation for
the top ten timezones in terms of number of infected hosts.
The diurnal pattern clearly follows the pattern of the busi-
ness day, with the number of infected hosts rising sharply
around 8 am and falling off in the afternoon and evening
hours as people shut down their computers to go home for
the night. The Code-RedI worm attacks a vulnerability in
Microsoft web server software, yet production web servers
are not usually shut down at the end of the day. We suspect
that these machines are office desktop computers whose
users are not aware that they are running an active web
server. This calls into question both the wisdom and the
security of automatically enabling software unbeknownst
to the end user.
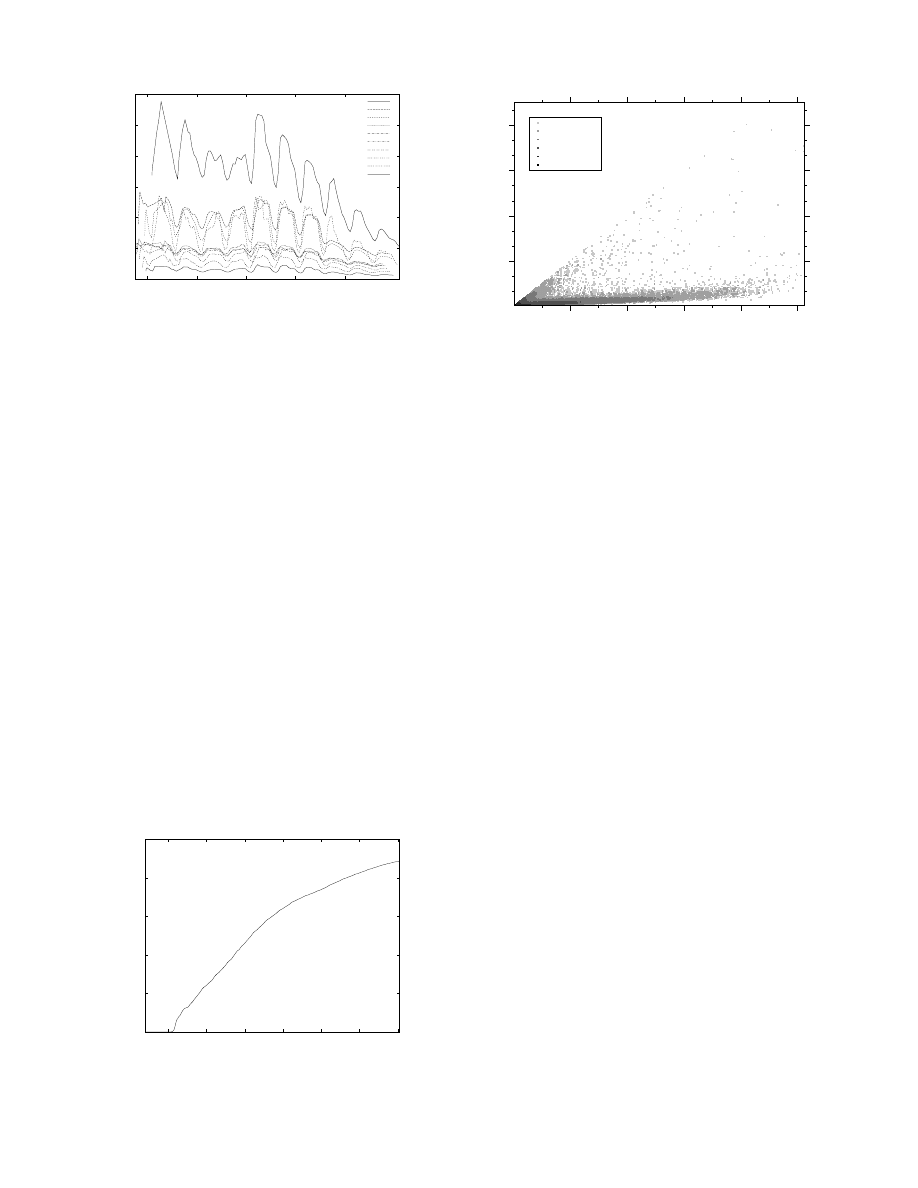
B.6 Subnets
0
500000
1e+06
1.5e+06
2e+06
2.5e+06
00:00
08/01
00:00
08/04
00:00
08/07
00:00
08/10
00:00
08/13
00:00
08/16
00:00
08/19
infected hosts
time (UTC)
Fig. 13. Cumulative total of unique IP addresses infected with
the second outbreak of Code-RedI v2.
50
100
150
200
250
Total Unique IP Addresses per Subnet
50
100
150
200
Maximum Number of IP Addresses Active per 2 Hours per Subnet
1
2 - 10
11 - 100
101 - 1000
1001 - 10000
10001 - 100000
Fig. 14. The DHCP effect: the relationship between total active
IP addresses in a subnet and the maximum number of IP
addresses active simultaneously, August 2-16.
Between August 2 and August 16, we observed two
million IP addresses actively transmitting the worm (Fig-
ure 13), yet only 143000 active hosts in the most active
ten minute period (Figure 11). This order of magnitude
discrepancy leads us to question whether there were actu-
ally around two million infected hosts, or whether the use
of DHCP is sufficiently extensive that it artificially inflates
IP address-based estimates of the extent of the Code-RedI
epidemic.
To answer this question, we compared two measures of
the infection within a subnet: the number of total unique
IP addresses in each subnet active at any time between Au-
gust 2 and August 16; and the 2 hour period in between
August 2 and August 16 in which the greatest number of
infected hosts were actively spreading the worm simulta-
neously. We plotted total unique IP addresses on the X
axis, maximum IP addresses per two hour window on the
Y axis, and then colored the data points based on the num-
ber of subnets with the same X and Y values (Figure 14).
The resulting graph is surprisingly bimodal: one line of
hosts stretches along the y = x intercept, representing
subnets in which the total number infected and the max-
imum number infected were the same – no shift in the IP
addresses of infected machines was detected. A far more
populous arm stretches just above the X axis, showing
many subnets with as many as fifteen times as many to-
tal IP addresses infected as were infected simultaneously.
This suggests that without accounting for this “DHCP ef-
fect,” counting the number of IP addresses infected by a
pathogen grossly overestimates the actual number of in-
fected machines.
While the vast majority of the subnets had fewer than
fifteen machines infected, a few subnets had as many as
two hundred simultaneously infected machines. We inves-
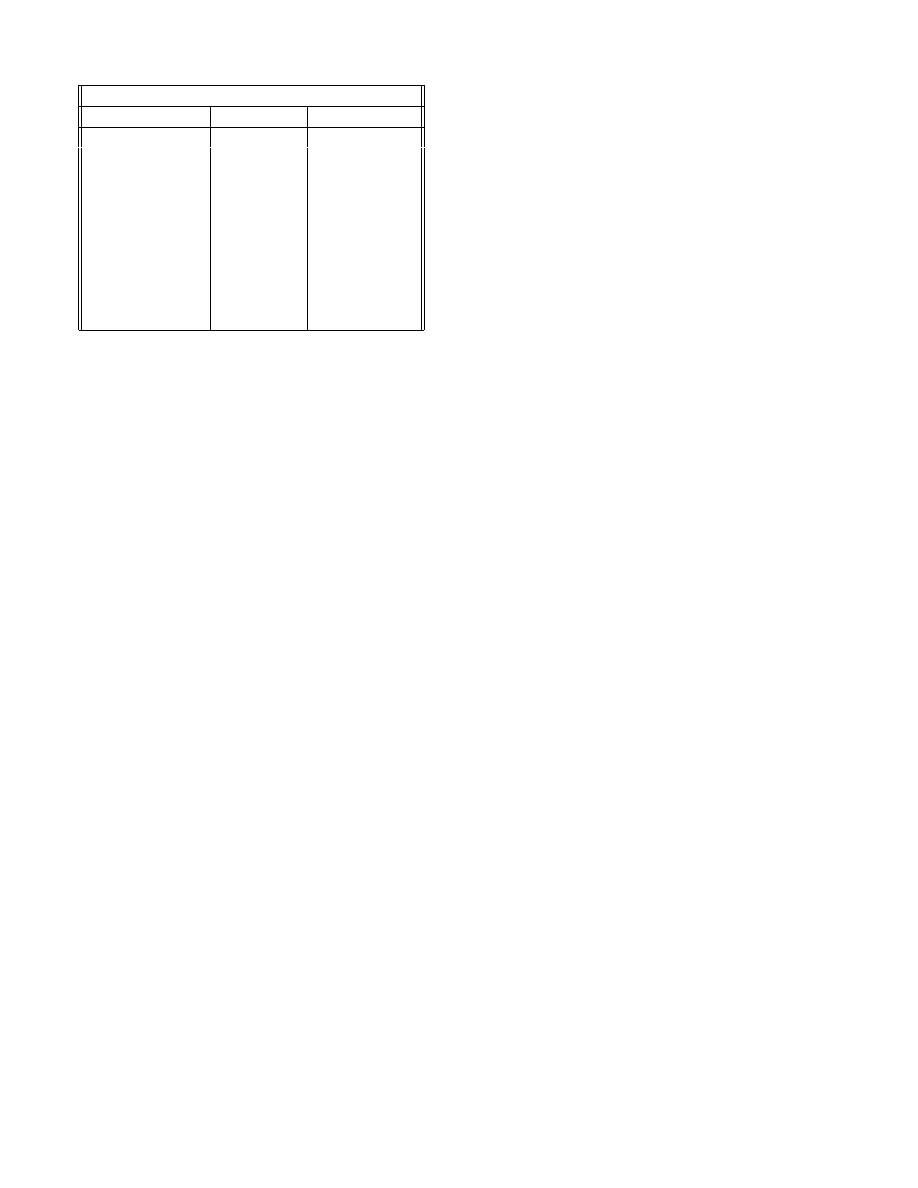
Patch Rate in Top 10 Countries
Country
patched (%)
unpatched (%)
United Kingdom
65.65
34.34
United States
59.59
40.41
Canada
57.57
42.42
Germany
55.55
44.44
Netherlands
46.46
53.53
Japan
39.39
60.61
Australia
37.37
62.62
Korea
20.20
79.79
Taiwan
15.15
84.84
China
13.13
86.86
TABLE V
P
ATCHING RATE SEEN ON
A
UGUST
14
TH FOR THE TEN
COUNTRIES WITH
C
ODE
-R
ED INFECTED HOSTS ON
J
ULY
19. P
ERCENTAGES ARE OF INFECTED HOSTS IN EACH
COUNTRY THUS EACH ROW ADDS UP TO
100%
tigated the ownership of the subnets with the most infected
machines and discovered that they belonged to Microsoft.
While DHCP use may artificially inflate the number of
infected hosts as measured by IP addresses, the use of Net-
work Address Translation may artificially deflate the num-
ber of compromised IP addresses that we measured. While
many infected machines can sit behind a NAT router, it ap-
pears to the rest of the Internet as only a single machine.
We attempted to use the observed probe rate of a host as a
way of identifying NAT IP addresses. However, the wide
variation in machine load and network connection speed of
individually infected IP addresses masks all but the most
blatant evidence of NAT use. Further work on quantify-
ing the effects of NAT on epidemiological study of worm
spread is in progress.
C. Repair rate
We performed a follow-up survey to determine the ex-
tent to which infected machines were patched in response
to the Code-RedI worm. Every day between July 24 and
August 28, we chose ten thousand hosts at random from
the 359,000 hosts infected with Code-RedI on July 19 and
probed them to determine the version number and whether
a patch had been applied to the system. Using that infor-
mation, we assessed whether they were still vulnerable to
the IIS buffer overflow exploited by Code-RedI.
Although this data does not show the immediate re-
sponse to Code-RedI, it does characterize the efficacy over
time of user response to a known threat. Between July 24
and July 31, the number of patched machines increased
an average of 1.5% every day. Despite unprecedented lev-
els of local and national news coverage of the Code-RedI
worm and its predicted resurgence on August 1, the re-
sponse to the known threat was sluggish. Only after Code-
RedI began to spread again on August 1 did the percent-
age of patched machines increase significantly, rising from
32% to 64%.
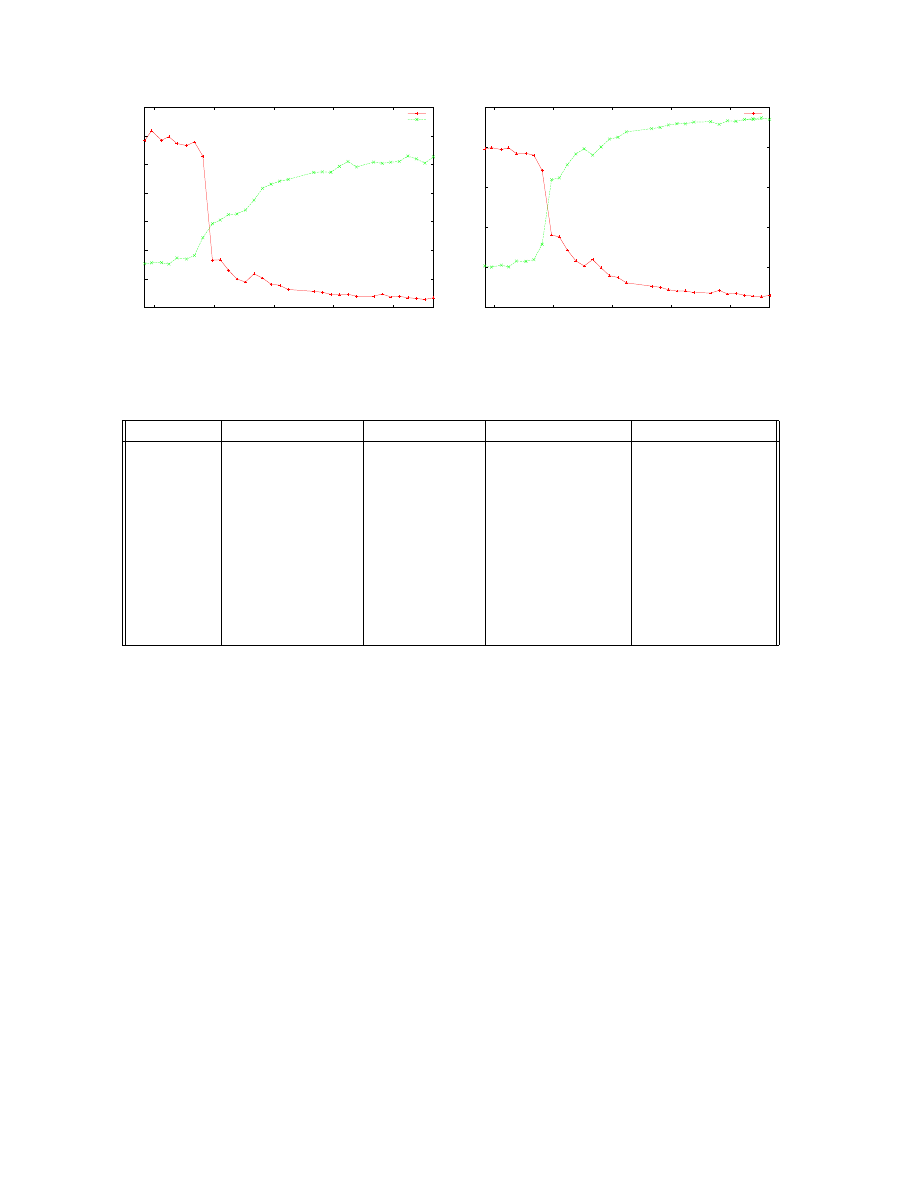
Improvement is needed in the communication of in-
formation about present threats to non-English speaking
countries. As shown in Table V, there is a significant gap
between the patch rate in English speaking countries and
non-English speaking countries.
We observed a wide range in the response to Code-
RedI exhibited by the top ten most frequently infected do-
mains, as shown in Table VI. While many of these do-
mains contain IP addresses that are assigned dynamically
via DHCP, the percentages of unpatched machines remain
valid whether or not the machines we reached in our sur-
vey were known previously to be infected. Some ISPs took
aggressive action to prevent the spread of the worm, in-
cluding temporarily blocking both inbound and outbound
traffic on port 80 and rapid notification of customers who
were observed to be spreading the worm.
The EDU top-level domain exhibited a much better
patching response to Code-RedI than did COM or NET
– 81% of infected hosts were patched by August 14. COM
(56%) and NET (51%) did respond well, ranked third and
sixth, respectively.
V. C
ONCLUSION
The primary observation to make about the Code-RedI
worm is the speed at which a malicious exploit of a ubiqui-
tous software bug can incapacitate host machines. In par-
ticular, physical and geographical boundaries are meaning-
less in the face of a virulent attack. In less than 14 hours,
359,104 hosts were compromised.
This assault also demonstrates that machines operated
by home users or small businesses (hosts less likely to be
maintained by a professional systems administrators) are
integral to the robustness of the global Internet. As is the
case with biologically active pathogens, vulnerable hosts
can and do put everyone at risk, regardless of the signifi-
cance of their role in the population.
Care must be taken in estimating the extent of the spread
of Internet pathogens. The effects of DHCP on IP address
counts lead to gross overrepresentation of the cumulative
number of hosts infected over time. The majority of sub-
nets show a discrepancy between the total number of IP
addresses observed to be transmitting the worm and the
maximum number active in a two hour period.
Finally, we should all be concerned that it seems to take
a global, catastrophic incident to motivate us to respond
0
5
10
15
20
25
30
35
00:00
07/26
00:00
08/02
00:00
08/09
00:00
08/16
00:00
08/23
Percentage of TOTAL probes
Unpatched IIS
Patched IIS
(a) All survey attempts.
0
20
40
60
80
100
00:00
07/26
00:00
08/02
00:00
08/09
00:00
08/16
00:00
08/23
Percentage of SUCCESSFUL probes
Unpatched IIS
Patched IIS
(b) Hosts which responded.
Fig. 15. Patching rate of IIS servers following initial Code-RedI v2 outbreak on July 19th.
Domain
Unpatched IIS (%)
Patched IIS (%)
Conn. Timeout (%)
Conn. Refused (%)
in-addr.arpa
40
7
30
11
home.com
44
5
30
8
rr.com
44
5
27
10
t-dialin.net
0.4
0
81
16
aol.com
0.3
0
39
61
pacbell.net
29
8
24
23
uu.net
0.6
0.2
51
47
hinet.net
20
0
46
25
net.tw
32
1
46
13
edu.tw
60
2
20
5
TABLE VI
P
ERCENTAGE BREAKDOWN OF PATCHING SURVEY RESPONSES BY CATEGORY FOR THE TOP DOMAINS ORIGINALLY
INFECTED WITH
C
ODE
R
ED V
2. R
OWS ADDING TO LESS THAN
100%
ARE DUE TO RESPONSES NOT BEING CLEARLY
CATEGORIZABLE AS
P
ATCHED
IIS
OR
U
NPATCHED
IIS. M
OST DOMAINS SHOW A LARGE PERCENTAGE OF CONNECTION
REFUSED OR CONNECTION TIMEOUT SUGGESTION FILTERING OF TRAFFIC
,
DISABLING OF PREVIOUSLY RUNNING
IIS
SERVERS OR
DHCP.
to a known threat. The exploit was discovered on June 18,
2001 and the first version of the Code-RedI worm emerged
on July 12, 2001. The especially virulent strain of the
worm (Code-RedI v2) began to spread on July 19, a full
29 days after the initial discovery of the exploit and four
days after the detection of the first (static seed) attack. As
the economies of many nations become increasingly de-
pendent on wide area network technologies, we must criti-
cally assess and remedy the economic consequences of the
current lack of adequate network and host security mea-
sures.
VI. A
CKNOWLEDGMENTS
We would like to thank Pat Wilson and Brian Kantor
of UCSD for data and discussion; Vern Paxson (LBL and
ACIRI) for providing an additional view point of data; Jef-
frey Mogul and Compaq Research for additional data; Jeff
Brown (UCSD/CSE) for producing animations of worm
spread; Ken Keys (CAIDA) for development of graphs and
discussion; Bill Fenner (AT&T Research) for useful com-
ments and fli2gif; and Stefan Savage (UCSD) and Geoff
Voelker (UCSD) for suggestions. Support for this work
was provided by DARPA ITO NGI and NMS programs,
NSF ANIR, and CAIDA members. This work would not
have been possible without the generous support of Cisco
Systems.
R
EFERENCES
[1]
E. Spafford, “The internet worm: Crisis and aftermath,” 1989.
[2]
Charles
Schmidt
and
Tom
Darby,
“The

Morris
Internet
Worm,”
Tech.
Rep.,
http://www.software.com.pl/newarchive/misc/Worm/darbyt/
pages/history.html.
[3]
John Shoch and Jon Hupp, “The ‘Worm’ Programs – Early Expe-
rience with a Distributed Computation,” Communications of the
ACM, vol. 25, no. 3, pp. 172–180, Mar. 1982.
[4]
CERT Coordination Center,
“CERT Advisory CA-1989-04
WANK Worm On SPAN Network,”
http://www.cert.
org/advisories/CA-1989-04.html
.
[5]
Max Vision, “Ramen Internet Worm Analysis,”
http://www.
whitehats.com/library/worms/ramen/
.
[6]
SANS Global Incident Analysis Center, “Lion Worm,”
http:
//www.sans.org/y2k/lion.htm
.
[7]
Computer Economics, “2001 economic impact of malicious code
attacks,”
http://www.computereconomics.com/cei/
press/pr92101.html
.
[8]
eEye Digital Security, “Advisories and Alerts: AD20010618,”
http://www.eeye.com/html/Research/
Advisories/AD20010618.html
.
[9]
Microsoft,
“A Very Real and Present Threat to the Internet,”
http://www.microsoft.com/technet/treeview/default.asp?url=/
technet/security/topics/codealrt.asp.
[10] eEye Digital Security,
“Advisories and Alerts: .ida “Code
Red” Worm,” July 2001,
http://www.eeye.com/html/
Research/Advisories/AL20010717.html
.
[11] Silicon Defense, “Code Red Analysis page,”
http://www.
silicondefense.com/cr/
.
[12] Cisco Systems, Inc,
“Cisco Security Advisory: “Code Red”
Worm - Customer Impact,”
http://www.cisco.com/
warp/public/707/cisco-code-red-worm-pub.
shtml
.
[13] eEye Digital Security,
“CodeRedII Worm Analysis,” Au-
gust 2001,
http://www.eeye.com/html/Research/
Advisories/AL20010804.html
.
[14] SecurityFocus,
“SecurityFocus Code Red II Informa-
tion Headquarters,”
http://aris.securityfocus.com/
alerts/codered2/
.
[15] “Cisco
NetFlow,”
http://www.cisco.com/warp/
public/732/netflow/
.
[16] Vern Paxson, “Bro: A System for Detecting Network Intruders in
Real-Time,” Computer Networks, vol. 31, no. 23-24, pp. 2435–
2463, 1999.
[17] eEye Digital Security, “eEye Code Red analysis, commented dis-
assembly, full IDA database, and binary of the worm,”
http:
//www.eeye.com/html/advisories/codered.zip
.
[18] Ixiacom IxMapping, “Ixmapping,”
http://www.ipmapper.
com
.
[19] David Moore, Geoffrey M. Voelker, and Stefan Savage, “Inferring
Internet Denial-of-Service Activity,” Usenix Security Symposium,
2001.
[20] Dug
Song
and
Rob
Malan
and
Robert
Stone,
“A
Snapshot
of
Global
Internet
Worm
Activ-
ity,”
http://research.arbor.net/up media/up files/
snap-
shot worm activity f.ps.
[21] Netsizer, “Evaluating the size of the internet,”
http://www.
netsizer.com
.
Wyszukiwarka
Podobne podstrony:
Speculations on the Origins and Symbolism of Go in Ancient China
effects of kinesio taping on the timing and ratio of vastus medialis obliquus and lateralis muscle f
On the definition and classification of cybercrime
1948 On the stability and instability of shock waces Thomas
Roger Bacon Tract on the Tincture and Oil of Antimony
spinoza, benedict de the ethics 3 on the origin and nature of the emotions
Emotion Work as a Source of Stress The Concept and Development of an Instrument
Computer Viruses The Technology and Evolution of an Artificial Life Form
Interruption of the blood supply of femoral head an experimental study on the pathogenesis of Legg C
Pancharatnam A Study on the Computer Aided Acoustic Analysis of an Auditorium (CATT)
NEXT on THE BOLD AND THE?AUTIFULX92
Brain Facts A Primer on the Brain and Nervous System The Society for Neuroscience
An experimental study on the development of a b type Stirling engine
Gazzo On The Cups And Balls
71 1021 1029 Effect of Electron Beam Treatment on the Structure and the Properties of Hard
Interruption of the blood supply of femoral head an experimental study on the pathogenesis of Legg C
Pancharatnam A Study on the Computer Aided Acoustic Analysis of an Auditorium (CATT)
Koons, Robert C Lecture #18 Aquinas On The Virtues And The Law
Remarks on the Visuddhimagga, and on its treatment
więcej podobnych podstron