A Study on the Computer Aided Acoustic Analysis of an Auditorium
(Ms) S Pancharatnam, Non-member
A Ramachandraiah, Non-member
This paper discusses the architecture and acoustics of the IMAGE auditorium at Chennai, India. The hall has been
modelled using CATT-acoustic software and the objective room-acoustic parameters such as reverberation time (RT),
early decay time (EDT), clarity factor (C
80
), strength (G) and lateral energy fraction (LEF) are determined. The quality
of the hall in relation to these parameters and the spatial variation in the hall are analysed.
Keywords: Acoustics; Architecture; Concert halls; Computer aided theatre technique (CATT)
NOTATIONS
CATT
: Computer Aided Theatre Technique
C
80
: Clarity Factor, dB
EDT
: Early Decay Time, s
G
: Strength, dB
LEF
: Lateral Energy Fraction, %
RT
: Reverberation Time, s
INTRODUCTION
The auditorium, which forms a part of the Indian Bank
Management Academy for growth and excellence at Chennai,
is known as IMAGE Auditorium. It was constructed in 1996
and serves as a venue for many conferences and music
concerts.
In a subjective study, the hall obtained a high ranking for its
acoustics. This was determined by conducting a questionnaire
survey among regular concertgoers in December 2001, where
the hall was rated as one of the best for South Indian classical
music performances. The authors subsequently conducted an
acoustical diagnosis of the hall, ie, determination of the
objective room-acoustic parameters through computer
modelling using computer aided theatre technique (CATT)
Acoustic Software. In this paper a detailed study of the
architectural features and acoustical parameters of the hall are
presented.
ARCHITECTURAL DETAILS
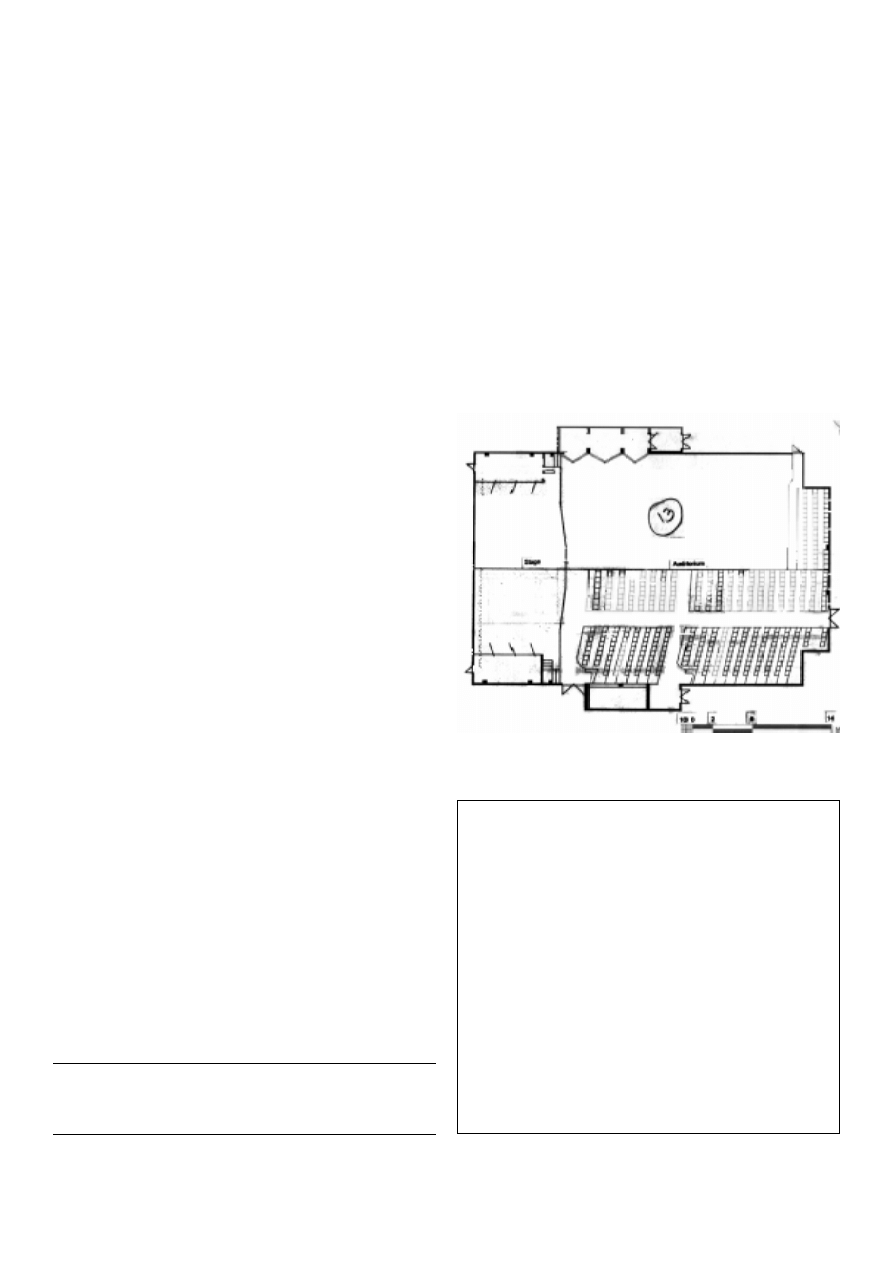
The IMAGE auditorium is rectangular in shape, measuring 27.0
m × 24.3 m with a seating capacity of 885, as shown in Figure
1. The hall has a non-enveloping proscenium stage, which is
also rectangular and measures 18.25 m × 9.15 m with a
2.3 m apron. The size of the proscenium opening is 18.25 m ×
5.5 m. Other geometrical details of the concert hall are shown
(Ms) S Pancharatnam and Shri A Ramachandraiah are with the Department
of Civil Engineering, Indian Institute of Technology, Madras, 600 036.
This paper was received on December 3, 2002. Written discussion on the paper
will be entertained till June 30, 2003.
Figure 1
Plan of the IMAGE auditorium showing seating arrangement
10
IE (I) JournalAR
Table 1
Basic geometrical details of the concert halls
Geometrical Parameter
IMAGE Auditorium
Average length L, m
27.20
Average width W, m
20.70
Average height H, m
7.40
Depth of the hall D, m
28.55
Volume V, m
3
4612.50
Seating capacity N, number
885.00
Seating area Sa, m
2
432.00
Acoustical seating area SA, m
2
553.78
Total area ST, m
2
680.78
Mean rake angle MRA, ()
6.70
Note : Terminology from [1]
MODEL STUDIES USING CATT-ACOUSTIC SOFTWARE
Modelling of the auditorium has been done using CATT
acoustic software for the computation of objective room-
acoustic parameters
2
. Computer modelling using this software
envisages the following three steps:
(1) Preparation: This serves as a preface to the modelling
stage. It involves complete and detailed architectural
documentation of the concert hall in the form of
AutoCAD drawings.
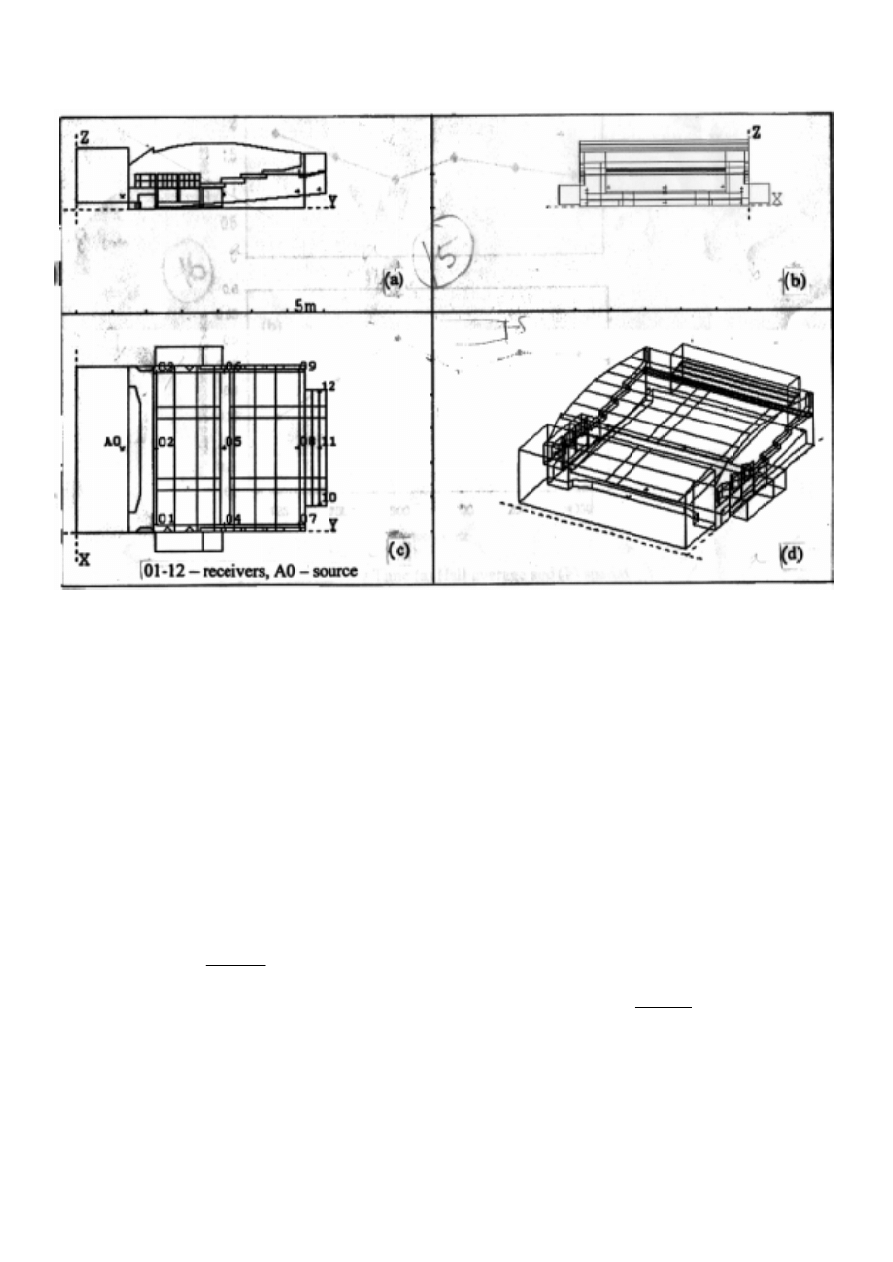
(2) Modelling: The geometry input of the hall is made by
a program written using the CATT text editor and a
wire-framed model of the concert hall is developed as
shown in Figure 3(a) to Figure 3(d). In the model, the
source and receiver positions are identical to those
placed in the experiment. The measured background
noise level is also incorporated in the model.
(3) Prediction: Based on the shape of the space, positions
of the source and receiver, the software predicts the
objective room acoustic parameters over a time
domain of 1 ms to 200 ms. In order to validate the
CATT model, values of reverberation time, RT for
unoccupied conditions are compared with the
measured values. From Table 2, it is seen that the
predictions through the software are in good
agreement with experimental values.
RESULTS AND DISCUSSIONS
Room-acoustic Parameters
In the CATT model, the sound source is placed on the stage, 1 m
from the edge of the proscenium and twelve receiver
locations are identified in the model as shown in Figure 3(c).
The room acoustic parameters obtained for unoccupied
conditions are shown in Table 2. They are the mean values of
early decay time (EDT ), clarity factor (C
80
), strength (G) and
lateral energy fraction (LEF ) and mid-audience reverberation
time (RT ).
(a) Reverberation time (RT) is the time required for
sound to decay 60 dB, whereas early decay time
(EDT) refers to the early part or the first 10 dB of the
sound decay. RT and EDT values generally range
Vol 84, April 2003
11
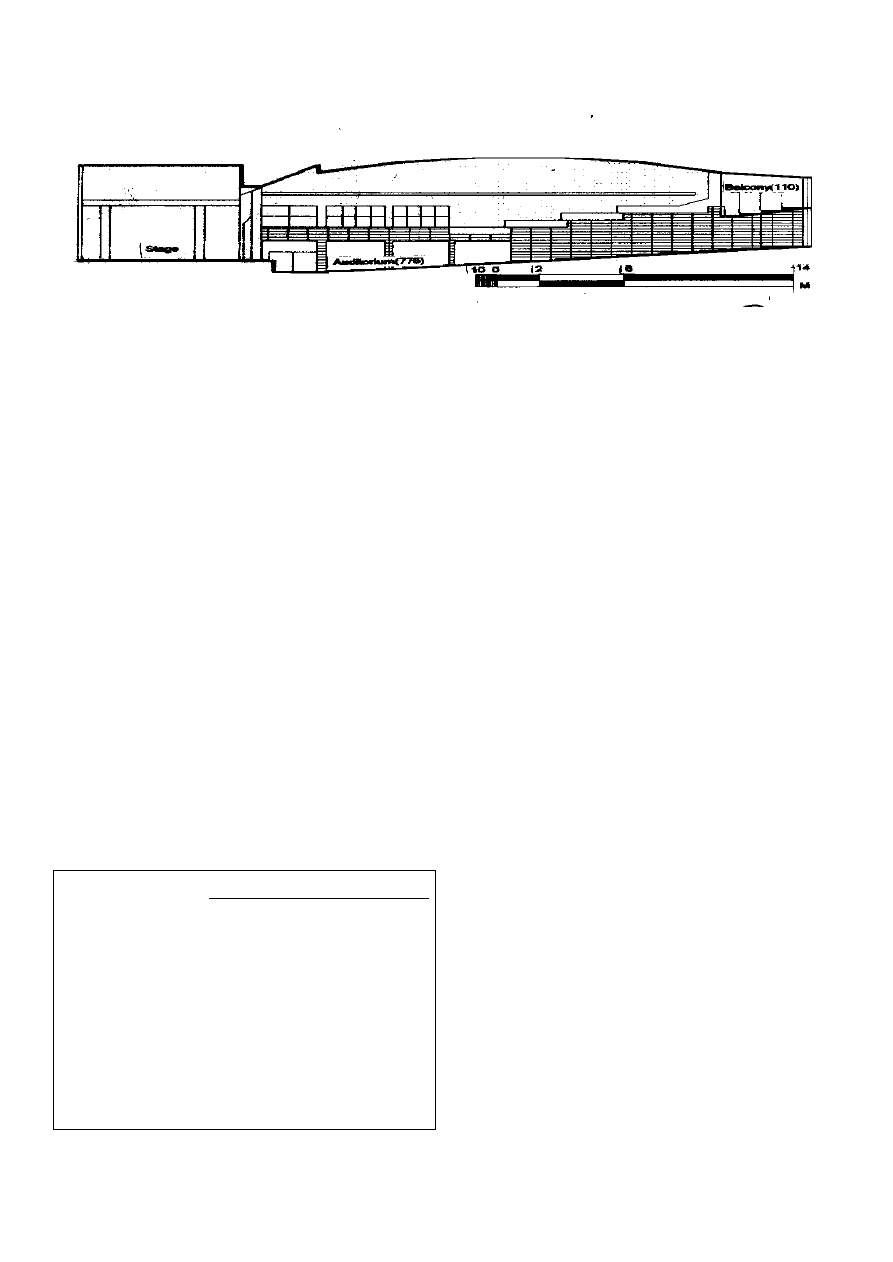
Figure 2
Longitudinal section through IMAGE auditorium
Table 2
Objective room-acoustic parameters evaluated through CATT
acoustic software
No Parameter Frequency, Hz
125
250
500
1000 2000 4000
1 Reverberation time
Measured, s
1.60
1.50
1.30
1.40
1.30
1.20
Reverberation time
CATT, s
1.93
1.57
1.19
1.42
1.29
1.16
2 Early Decay time, s
1.84
1.47
1.14
1.45
1.29
1.16
3 Strength, dB
8.00
7.00
5.80
6.90
6.50
6.00
4 Clarity Factor, dB
0.60
2.00
4.50
2.60
3.30
4.10
5 Lateral Energy
Fraction, %
37.60
37.00 35.70
36.80 36.40 36.70
in Table 1. The lower reaches of the sidewalls and rear wall are
treated with un-perforated veneer mounted on hardboard
panels while the upper reaches are treated with perforated
panels backed by absorptive foam. The front portions of the
sidewalls are made irregular with lower recessed press boxes
and upper triangular protrusions in plan as control boxes as
shown in Figure 2. The ceiling has a curvilinear profile and is
untreated. The flooring has a linoleum finish with carpeted
aisles and the seating in the hall is rexin-backed.
ACOUSTICAL MEASUREMENTS
Reverberation time decay measurements were made in the
hall (unoccupied), using the following instruments:
(1) Standard sound sources (B and K Type 4224) capable
of generating pink noise signals placed on the stage
along its centreline 1 m from the edge of the
proscenium;
(2) Precision integrating sound level meter (B and K
Type 2230) along with filter (B and K Type 1625)
placed at mid-audience position; and
(3) Level recorder (B and K Type 2317).
The measurement procedure satisfies the ISO 3382
1
. The
measured RT for unoccupied conditions varies from 1.3 s-1.4 s
in the mid-frequency range (500 Hz-1000 Hz) as shown in
Table 2.
from 1 s to 3 s in good concert and recital halls
3,4
. In
the IMAGE auditorium, mid frequency RT
mid
ranges
from 1.16 s to 1.45 s. It is seen that the hall is more
reverberant at low frequency (125 Hz-250 Hz) and
moderately reverberant at higher and mid
frequencies. The hall average EDT is similar to RT at
all frequencies and mid frequency EDT
mid
values
range from 1.14 s to 1.45 s. The two quantities are
identical indicating that the decay is completely linear
and that the hall has a diffuse sound field.
(b) Strength or the total sound level as it is called is a
measure of the loudness in a hall
5,6
and is expressed
as
where, p(t), is the impulse response at the receiver
position in the auditorium and
p t
A
( )
, is the response
at 10 m from an identical source in an anechoic
environment.
G values in a concert hall generally range from 1 dB to
+10 dB and the recommended value for optimum
loudness in a concert hall for symphony music at mid
frequency lies in the range of 4 dB to 5.5 dB. In the
IMAGE auditorium, hall average low frequency
G
low
values are high and average mid frequency
G
mid
values range from 5.8 dB to 6.9 dB indicating that
music in the hall can be quite large and
overpowering. The difference
G
G
low
mid
−
value is
about 1.15 dB indicating that the hall has considerably
high bass gain. G is proportional to RT, which is
evident from Table 2.
(c) Clarity factor indicates the early and late arrivals of
sound energy and can be expressed as
For symphony music, concert halls with low clarity
are judged the best. In the IMAGE auditorium, mid
(a) longitudinal section; (b) transverse section; (c) plan; and (d) view
Figure 3
CATT model of IMAGE auditorium
12
IE (I) JournalAR
G
p t dt
p t dt
dB
A
=
L
N
MM
MM
MM
O
Q
PP
PP
PP
∞
∞
z
z
10
2
0
2
0
log
( )
( )
,
C
p t dt
p t dt
dB
80
2
0
0 08
2
0
10
=
L
N
MM
MM
MM
O
Q
PP
PP
PP
z
z
∞
log
( )
( )
,
.
frequency
C
80
is high with positive values of 2.6 dB
to 4.5 dB indicating that the music heard in the hall
will be very clear.
C
80
3
that is the average of values in
the 500 Hz, 1000 Hz and 2000 Hz bands is 3.5 dB
whereas for symphony music the preferred range
is 1 dB to 4 dB.
C
80
is inversely related to RT
values of a concert hall, which is seen in the present
study. At higher and mid-frequencies, the relatively
less reverberant hall has greater
C
80
values.
(d) Lateral energy fraction is the ratio of the lateral energy
received by a figure-of-eight cardiod microphone to
the lateral energy measured by an omni directional
microphone over the first 10 ms of the pulse
response. It is expressed as
where,
P t
L
( )
is the response from the figure-of-eight
microphone.
LEF is related to the subjective sense of spatial
impression or envelopment and is inversely related to
the width of the hall. In some of the best concert halls
for symphony music, where the width varies from 25 m
to 40 m, LEF ranges from 10% to 23%. LEF values are
higher and constant over a wide frequency range of
35.7% to 37.6% in the IMAGE auditorium where the
average width is 20.7 m. Narrower halls exhibiting
greater LEF are considered in this study, as the IMAGE
auditorium is rectangular and narrower.
Spatial Variations
The spatial variation of acoustical parameters is studied by
estimating the standard deviation. The three listening
positions considered are grouped column-wise-left, centre
and right.
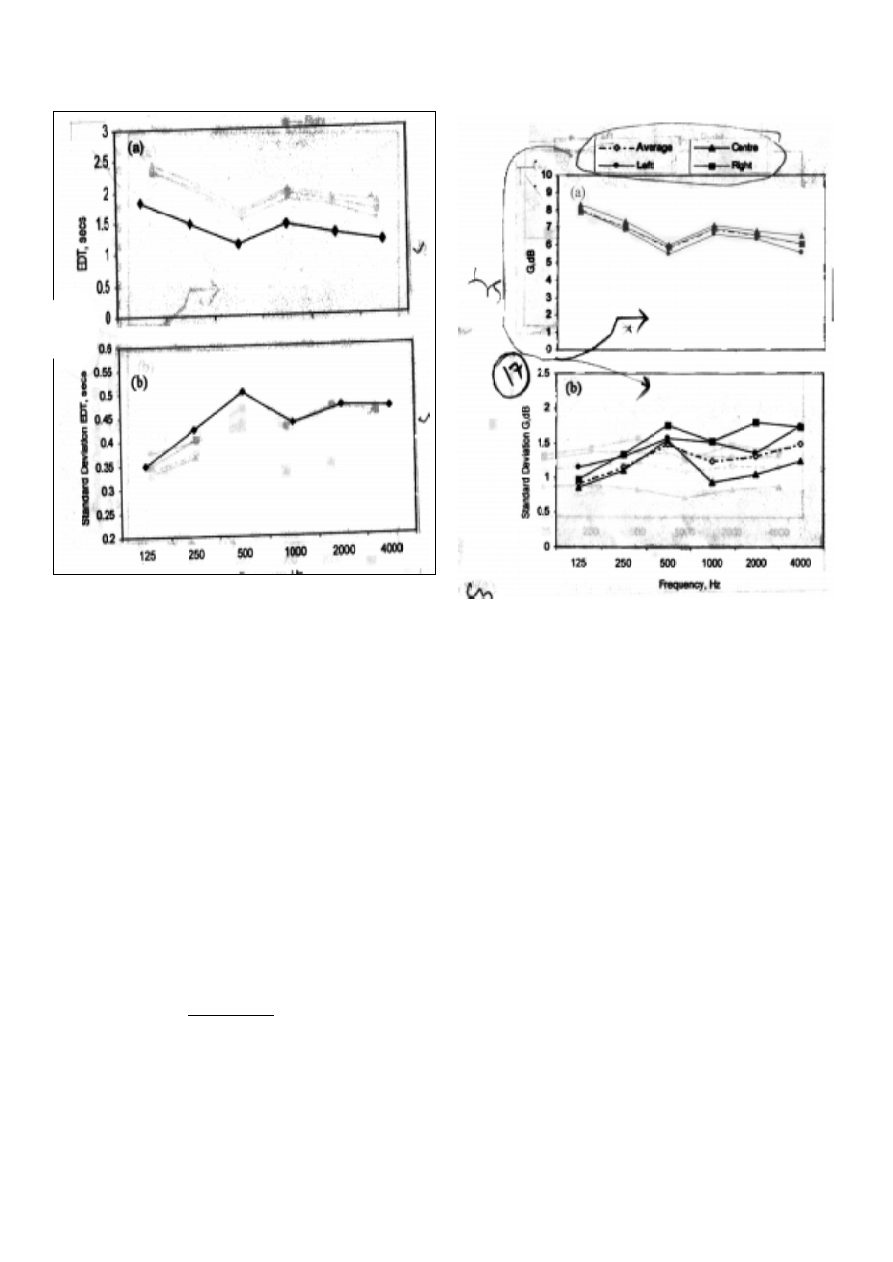
The average EDT values are shown in Figure 4(a). The values
range between 1 s to 2 s and Figure 4(b) shows the standard
deviation. These results show that the reverberance quality is
uniform. A medium sized hall like the IMAGE auditorium has
these attributes whereas EDT would vary spectacularly in a
large hall
7
.
Figure 5(a) shows the G values determined for listening
positions grouped column-wise. It is seen that the variation of
(a) hall average; and (b) spatial standard deviation of CATT-EDT values
against octave band frequency
Figure 4
Early decay time
Vol 84, April 2003
13
(a) hall average; and (b) spatial standard deviation of CATT-G values
against determined column-wise against octave band frequency
Figure 5
Strength
L F
p
t d t
p
t d t
L
=
L
N
MM
MM
MM
O
Q
PP
PP
PP
z
z
2
0
0 0 8
2
0
0 0 8
( )
( )
.
.
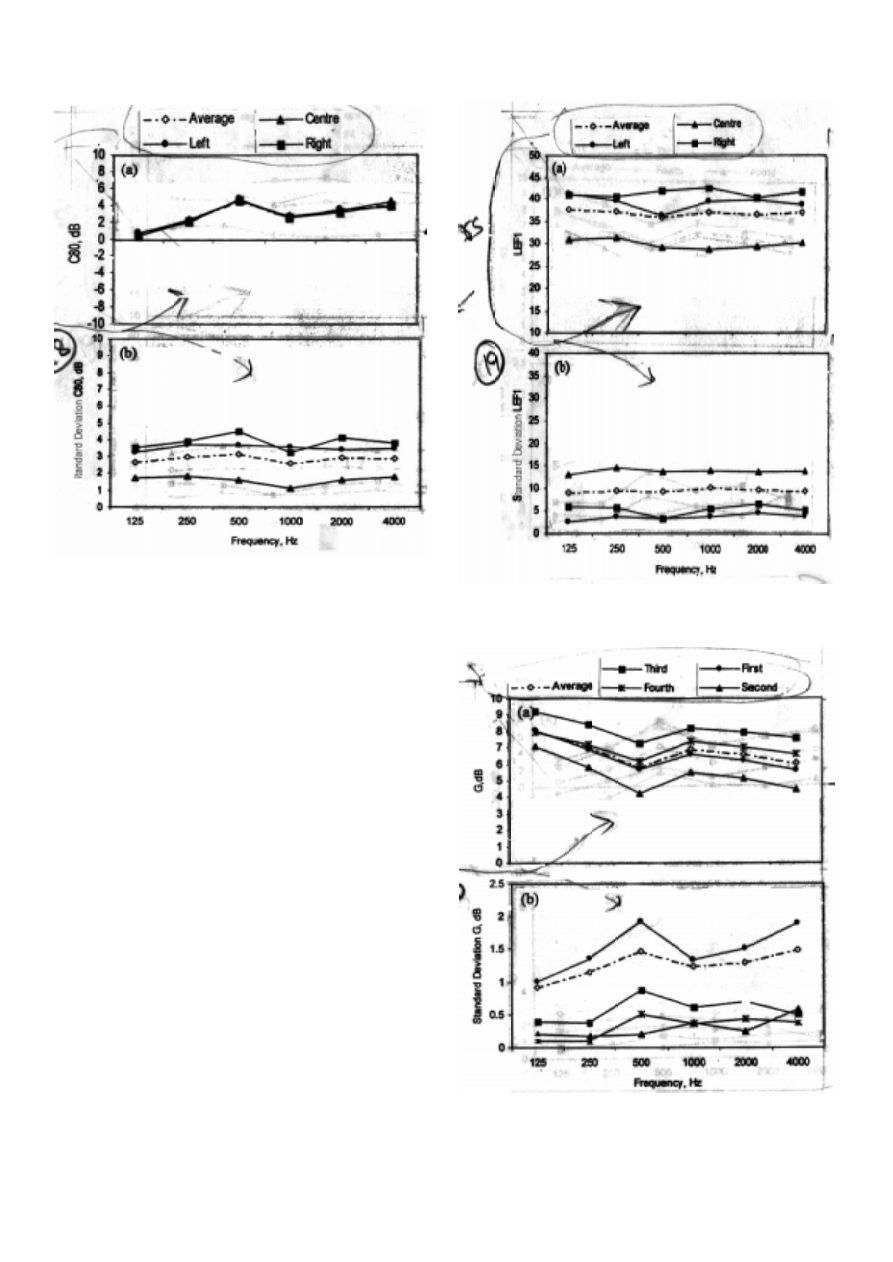
G is minimal but centre locations possess slightly greater
values since they experience greater amount of direct sound.
The standard deviation is minimal along the centre column as
shown in Figure 5(b).
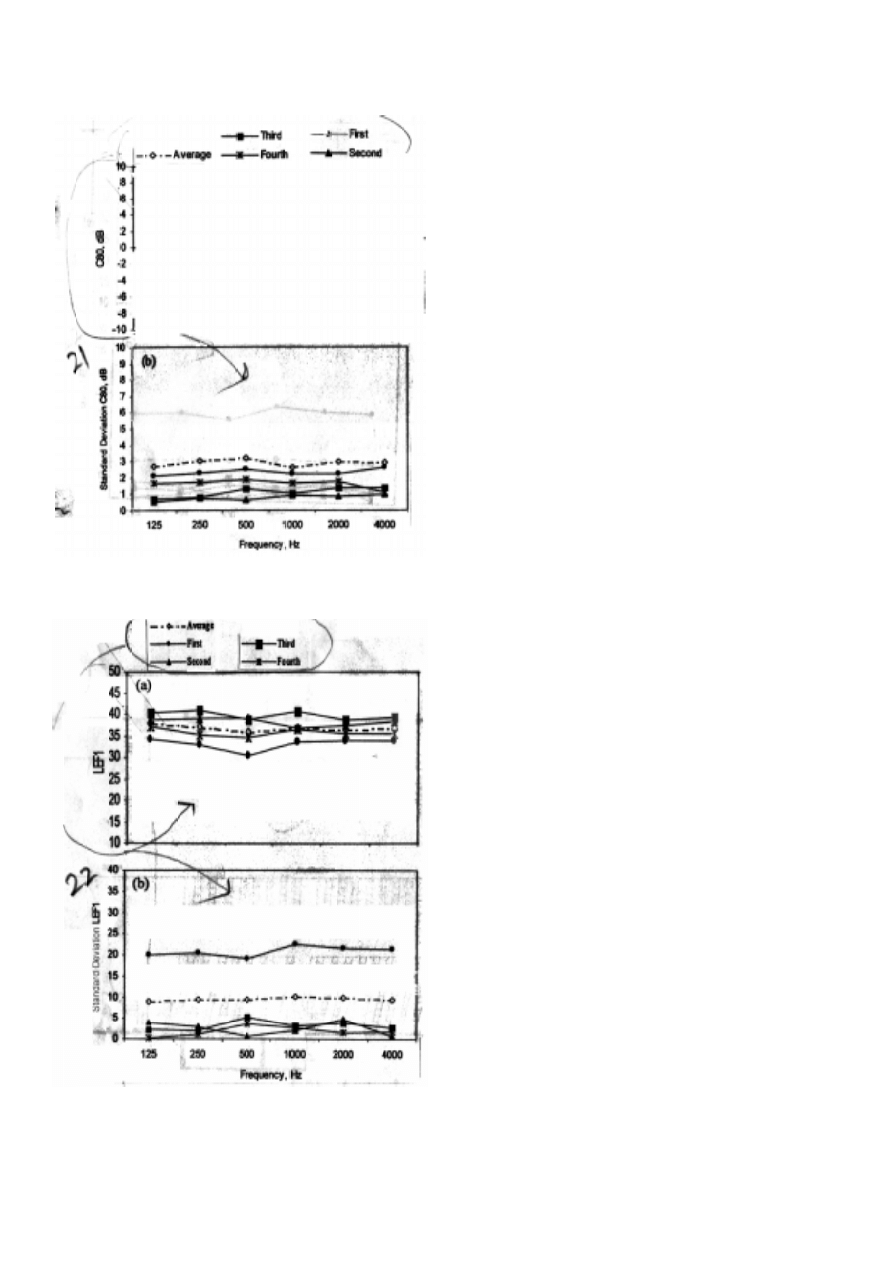
Figure 6(a) compares
C
80
values at all frequencies and it is
seen that all the three groups of listening positions have uni-
form clarity factor but, the standard deviation is higher for left
and right side receivers than those placed in the centre as
shown in Figure 6(b) and Figure 7(a) shows the comparison of
LEF values. The receivers in the centre are found to have
lower LEF values than those near the auditorium sidewalls but
as seen in Figure 7(b), the standard deviation is found to be
higher.
Variations between the Front, Centre and Rear Seats
The variation in parameters is also studied by grouping the
listening positions row-wise as front, centre and rear locations.
From Figure 8(a), it can be seen that the first and second rows
of receivers experience lesser G compared to the third and
fourth rows. This could be due to the decreased height of the
ceiling and that of the lesser room width at the rear end of the
hall. The standard deviation of G is high in the first rows as
seen from Figure 8(b). However, overall standard deviations
are within 1.5 dB at all receiver positions and the sound field in
the auditorium can be considered as uniformly loud.
14
IE (I) JournalAR
(a) hall average; and (b) spatial standard deviation of CATT-C
80
values
determined column-wise against octave band frequency
Figure 6
Clarity factor
(a) hall average; and (b) spatial standard deviation of CATT-LEF1 values
determined column-wise against octave band frequency
Figure 7
Lateral energy fraction
(a) hall average; and (b) spatial standard deviation of CATT-G values
against determined row-wise against octave band frequency
Figure 8
Strength
Vol 84, April 2003
15
(a) hall average; and (b) spatial standard deviation of CATT-C
80
values
determined row-wise against octave band frequency
Figure 9
Clarity factor
(a) hall average; and (b) spatial standard deviation of CATT-LEF1 values
determined row-wise against octave band frequency
Figure 10 Lateral energy fraction
The hall average
C
80
values are presented in Figure 9(a). The
first and second rows have lower
C
80
values than the rear
rows. This is due to reflections from the sidewall projections
and the concave ceiling profile at that point reducing clarity.
The spatial standard deviation is seen to be higher in the first
and last rows compared to the second and third rows as shown
in Figure 9(b) but the overall hall indicates little deviation of
about 2 dB to 3 dB from the mean.
Figure 10(a) presents the hall average LEF values. The
receivers in the first row have lower LEF than the second and
third rows and as seen in Figure 10(b), the standard deviation
is high in the first row.
CONCLUSIONS
1. The usefulness of computer modelling for prediction
of parameters has been demonstrated in the paper.
The CATT acoustic software has proved to be a
useful tool for studying the acoustical characteristics
of the IMAGE auditorium in detail.
2. The source and receiver distance in the IMAGE
auditorium is minimal which might have influenced
the rating of the IMAGE auditorium as a good concert
hall. A medium size of the hall results in minimum
variation of RT, EDT, G, LEF and
C
80
values within the
hall ensuring uniform acoustic conditions in the hall.
3. In comparison with acoustical conditions in concert
halls for other types of music
8
, reverberation time for
the six octave frequencies shows an acceptable curve
for Italian opera, but very low values for symphony
music. The strength (G), clarity factor (
C
80
) and
lateral energy fraction (LEF ) values are high
compared to concert halls intended for symphony
musical performances.
A more detailed investigation on concert halls for South Indian
classical music and a study of the acoustical conditions for
good concert halls is in progress.
ACKNOWLEDGEMENTS
The authors wish to acknowledge their thanks to Dr B I
Dalenback (Sweden) of CATT for supplying the software for
research purposes and are grateful to Mr and Ms Pancharatnam
for providing necessary financial aid and support.
REFERENCES
1. ISO 3382: 1997(E). Acoustics-Measurement of the Reverberation
Time of Rooms with Reference to other Acoustical Parameters. 1997.
2. S Pancharatnam and A Ramachandraiah. Computational Architectural
Acoustics: Evaluation of Acoustical Parameters in Concert Halls.
Proceedings of the Eighth National Annual Convention MIRC of ASA,
Kavaraipettai, India, 2002, pp 51-54.

16
IE (I) JournalAR
3. L L Beranek. Concert and Opera Halls: How They Sound. American
Institute of Physics, Woodbury, USA, 1996.
4. M Barron. Auditorium Acoustics and Auditorium Design. E and FN
Spon, London, 1993.
5. J S Bradley. Comparison of Three Classical Concert Halls. Journal of
the Acoustical Society of America, vol 89, no 3, 1999, pp 1176-1192.
6. M Barron and L J Lee. Energy Relations in Concert Auditoriums I.
Journal of the Acoustical Society of America, vol 84, 1988, pp 289-618.
7. D Templeton. Acoustics in the Built Environment. Butterworth-
Heinemann, Oxford, UK, 1993.
8. F W Winckel. Optimum Acoustic Criteria of Concert Halls for the
Performance of Classical Music. Journal of the Acoustical Society of
America, vol 34, 1962, pp 81-86.
Wyszukiwarka
Podobne podstrony:
Interruption of the blood supply of femoral head an experimental study on the pathogenesis of Legg C
An experimental study on the development of a b type Stirling engine
Interruption of the blood supply of femoral head an experimental study on the pathogenesis of Legg C
An experimental study on the drying kinetics of quince
Code Red a case study on the spread and victims of an Internet worm
The Red Scare Extensive Analysis of its?uses and?fects
the effect of water deficit stress on the growth yield and composition of essential oils of parsley
Influence of the starter culture on the microbiological and sensory characteristics of ewe s cheese
Baerg, W J & W B Peck 1969 A note on the longevity and molt cycle of two tropical theraphosids Bull
2D Analysis of an Aluminum Bracket
Analysis of Religion and the?fects on State Sovereignty
on the road analyse RJVDSG2WQHCLFAPZX7ACRFFGKS7U6IR26AW2BLA
A systematic review and meta analysis of the effect of an ankle foot orthosis on gait biomechanics a
55 781 792 Computer Aided Evaluation of Thermal Fatique Cracks on Hot Works
Comparative study based on exergy analysis of solar air heater collector using thermal energy storag
All Quiet on the Western Front Very Extensive Book Analysi
więcej podobnych podstron