
*Corresponding author.
An experimental study on the drying kinetics of quince
Ahmet Kaya, Orhan Aydin*, Cevdet Demirtas, Mithat Akgün
Karadeniz Technical University, Department of Mechanical Engineering, 61080 Trabzon, Turkey
Tel. +90 (462) 377 2974; Fax +90 (462) 325 5526; email: oaydin@ktu.edu.tr
Received 18 September 2006; accepted 19 October 2006
Abstract
In this experimental study, drying kinetics of quince slices was investigated as a function of drying conditions.
Experiments were conducted using air temperatures of 35, 45 and 55ºC, mean velocities of 0.2, 0.4 and 0.6 m/s and,
relative humidity values of 40, 55 and 70%. The experimental moisture data were fitted to some models (namely
Henderson and Pabis, Lewis and two-term exponential models) available in the literature, and a good agreement
was observed. In the ranges covered, the values of the effective moisture diffusivity, D
eff
were obtained between
0.65×10
–10
and 6.92×10
–10
m
2
/s from the Fick’s diffusion model. Using D
eff
, the value of activation energy (E
a
) was
determined assuming the Arrhenius-type temperature relationship, which varied from 33.83 to 41.52 kJ/mol. Finally,
the sorption isotherms of the dried quince slices were determined.
Keywords: Convective drying; Quince; Experimental; Drying kinetics; Drying rate; Effective diffusivity; Moisture
content; Moisture ratio
1. Introduction
Drying is used in order to preserve and store
agricultural products for longer periods by remov-
ing some of their moisture content. It is a compli-
cated process involving simultaneous heat and
mass transfer under transient conditions. Under-
standing the heat and mass transfer in the product
will help to improve drying process parameters
and hence the quality. A number of internal and
external parameters influence drying behavior.
External parameters include temperature, veloc-
ity and relative humidity of the drying medium
(air), while internal parameters include density,
permeability, porosity, sorption–desorption char-
acteristics and thermophysical properties of the
material being dried.
Many studies have existed in the literature to
investigate the effects of the above mentioned pa-
rameters on the drying process of different fruits
and vegetables. For the brevity, we cover only a
few of them: apple by Sacilik and Elicin [1] and
Velic et al. [2]; tropical fruits by Karim and Haw-
lader [3]; kiwi by Simal et al. [4]; potato and car-
rot by Srikiatden and Roberts [5], some vegetables
Desalination 212 (2007)
328–343
doi:10.1016/j.desal.2006.10.017
0011-9164/07/$– See front matter © 2007 Elsevier B.V. All rights reserved.
A. Kaya et al. / Desalination 212 (2007) 328–343
329
by Krokida et al. [6]; prickly pear by Lahsasni et
al. [7]; fig by Babalis and Belessiotis [8]; chesnut
by Guine and Fernandes [9]; pistachio nuts by
Kashaninejad et al. [10].
Quince is a very ancient and delicious fruit.
Turkey is the leading grower of quince in the
world. The purpose of this study is to experimen-
tally investigate the drying kinetics of quince as a
function of drying conditions and to evaluate the
diffusion coefficient. The effects of the tempera-
ture, velocity and relative humidity of the drying
air on the drying kinetics will be determined.
2. Materials and methods
2.1. Experimental setup and procedure
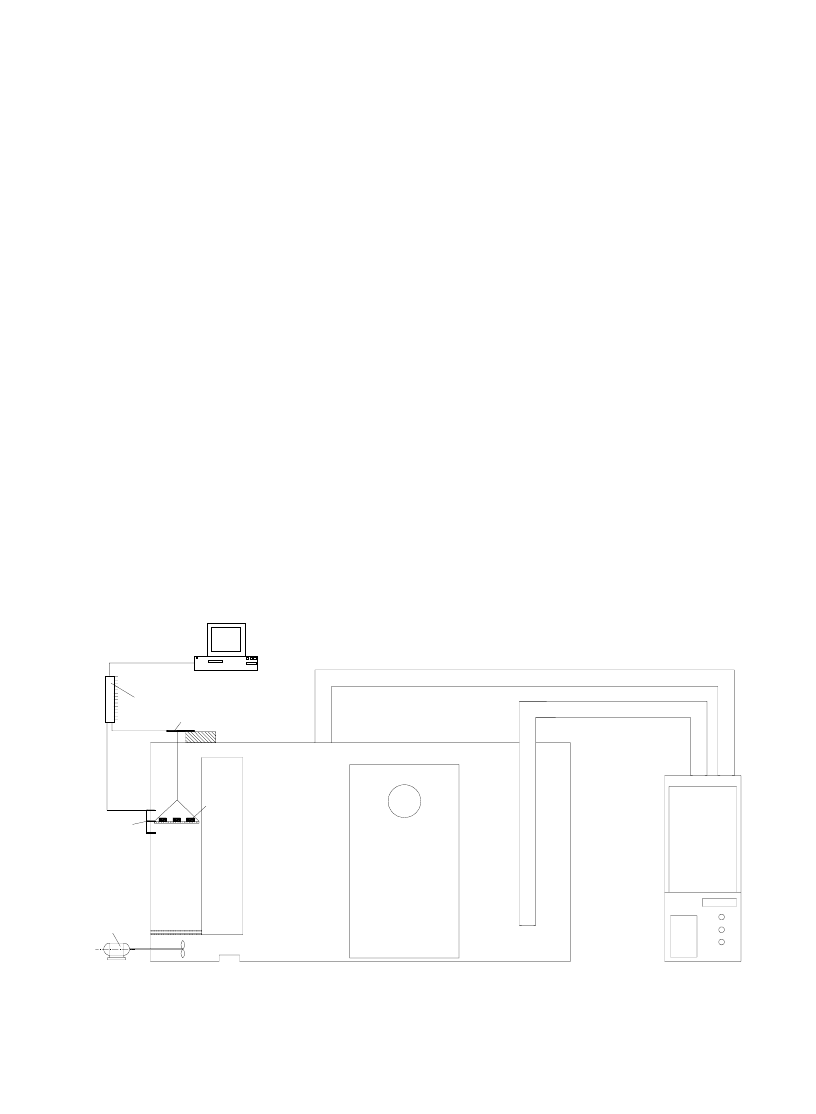
The experimental apparatus, designed and
manufactured to study drying behaviors and char-
acteristics of different fruits and vegetables, is
shown in Fig. 1. As it is seen from the figure, it
mainly consists of three units: air conditioning
Air
Conditio
ned
Roo
m
Ai
r Condit
ion
er
Air Blowing Channel
Air Suction Channel
Loadcell
Data
Acquisition
Th
ermoc
oupl
e
Dryi
ng Ch
annel
Variable
Speed Motor
Product
Fig. 1. The schematic of the experimental setup.
unit, air-conditioned room and test section. The
air conditioning unit acclimatizes and, therefore,
supplies the external air to the room from where
the conditioned air is driven into the test section
keeping the products to be dried. In the air-condi-
tioned room with a volume of 3 m × 3 m × 3 m,
the conditioned drying air is brought up to the
thermal equilibrium. Three different channels (i.e.,
the test section) are connected to the room sup-
plying the conditioned air with desired tempera-
ture, velocity and relative humidity. Three differ-
ent cases can be simultaneously tested in these
channels. The mass flow rate of the drying air is
regulated by a fan driven by a variable speed
motor. This regulation ensured mean velocities
in the range from 0.2 to 0.6 m/s at the entrance of
the channels, which is proven to be high enough
to eliminate possible velocity effects on the wet-
ting rates on the surfaces of the product to be dried.
The channels, i.e. the drying units, have square
cross sections (35 cm × 35 cm). Wire-mesh-bot-
tomed trays with a holding area of 25 cm × 15 cm

330
A. Kaya et al. / Desalination 212 (2007) 328–343
are included in the channels. In order to prevent
the heat loss to the environment, the channels are
well insulated.
The samples of the quince slices weighing
about 100 g with a thickness of 4 mm are placed
in trays of each drying unit. The initial moisture
content of quince slices is determined using the
OHAUS MB45 infrared moisture analyzer. Dur-
ing the experiments, the temperature changes and
the sample weight were recorded every 5 min us-
ing copper-constantan thermocouples (0–200
± 0.5ºC) and Lama type load cells (10000 ± 0.01 g),
respectively. Furthermore, the velocity in the dry-
ing channel was measured with an anemometer
(Lutron HT-3006HA model with the accuracy of
0.2–20.0 ± 0.05 m/s), while the relative humidity
in the conditioning room was measured using a
humidity/temperature meter (Lutron AM-4204
HA model with the accuracy of 10–95 ± 1%). Five
experiments were performed with different val-
ues of the drying parameters shown in Table 1.
2.2. Sorption isotherm
The sorption isotherm represents water activ-
ity of a product, suggesting the equilibrium rela-
Table 1
Air drying conditions and parameters of the product used
in the experimental tests
T (ºC)
φ (%)
M
e
(db)
U (m/s)
Time (s)
0.2 28,479
0.4 25,405
35 0.092
0.6 23,106
0.2 18,135
0.4 15,472
45 0.084
0.6 12,817
0.2 12,822
0.4 10,550
55
40
0.062
0.6 8,284
0.2 43,126
0.4 37,189
55 0.10
0.6 31,683
0.2 79,897
0.4 72,716
35
70 0.17
0.6
65,211
tion between the water activity in the product and
its moisture content. It is of particular importance
in the design of a food dehydration process, espe-
cially in the determination of a drying end point
which ensures economic viability and microbio-
logical safety [11,12].
The water activity of a food product can be
defined as:
eq
f
w
0
100
p
a
p
φ
=
=
(1)
where a
w
is the water activity, p
f
is the vapor pres-
sure of the water in the product, p
0
is the vapor
pressure of pure water and
φ
eq
is the equilibrium
relative humidity of the salt solutions [11].
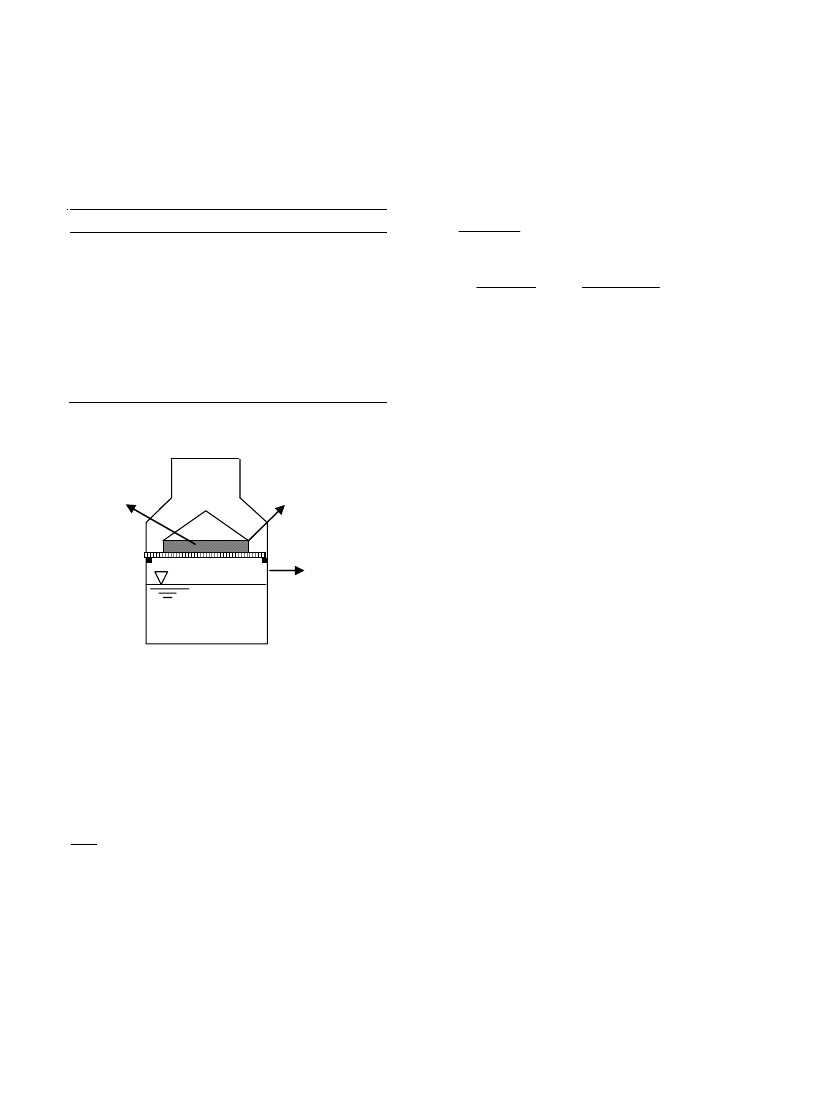
A static gravimetric method [13] is used to
determine sorption isotherms of quince at 25, 35,
45 and 55ºC. Nine different saturated salt solu-
tions and distilled water, whose relative humidity
values varied between 12% and 100%, were used
(Table 2). Each solution was placed into a sepa-
rate glass jar, i.e. desiccators, and the samples were
placed as seen in Fig. 2. Each salt solution pro-
duced and maintained a specific relative humid-
ity as seen in Table 2. The glass jars which were
tightly closed were then kept in an oven having a
nearly isothermal condition at 25, 35, 45 and 55ºC.
The dried samples equilibrate with the environ-
ment inside the jar until no discernible weight
change was observed, when it was assumed that
the equilibrium moisture was reached. It was ob-
served from the measurements using the CHYO-
MP300 digital balance (with a measurement range
of 0–300 g and an accuracy of ±0.001 g) that the
equilibrium condition was usually reached in 32 d.
Finally, in the equilibrium condition, the equilib-
rium moisture content was measured using the
infrared moisture analyzer (OHAUS MB45).
2.3. Data analysis
Drying process is proven to mostly occur in
the falling rate period, and moisture transfer dur-
ing drying is controlled by internal diffusion. The
A. Kaya et al. / Desalination 212 (2007) 328–343
331
Fick’s second law of unsteady state diffusion has
been widely used to describe the drying process
in the falling rate period for most biological ma-
terials [14].
(
)
eff
M
D
M
t
∂ =∇⎡
∇
⎤
⎣
⎦
∂
(2)
where D
eff
is the effective moisture diffusivity,
which is a mass diffusion property of the prod-
uct. Analytical solutions to the above equation
under various initial and boundary conditions for
different geometries can be found in textbook by
Crank [14]. Assuming uniform internal moisture
Table 2
Water activities of the saturated salt solutions used in the
experimental study
Salt
a
w
LiCl 0.12
CH
3
COOK 0.28
K
2
CO
3
0.38
MgCl
2
0.42
Mg(NO
3
)
2
0.57
NaNO
3
0.63
SrCl
2
0.70
NaCl 0.75
(NH
4
)
2
SO
4
0.80
Distilled H
2
O
1.0
Salt solution
Aluminum cover
Glass
Jar
Sample
Fig. 2. The unit used to determine the sorption isotherm.
distributions, long drying times and negligible
external resistance, the solution is as follows:
(
)
(
)
e
0
e
2
2
eff
2
2
1
0
2
1
1
exp
4
2
1
n
M
M
M
M
n
f
D t
L
n
∞
=
−
Γ =
−
⎡
⎤
π
+
=
−
⎢
⎥
+
⎢
⎥
⎣
⎦
∑
(3)
where
Γ is the moisture ratio and f is the shape
factor depending on the geometry of the material.
The value of f is 8/
π
2
for a semi-infinite slab, 4/
π
2
for a cylinder and 6/
π
2
for a sphere. In addition,
M is the moisture content at t, M
e
is the equilib-
rium moisture content determined from Fig. 3, M
0
is the initial moisture content and L
0
is the char-
acteristics dimension (which equals L/2 for a semi-
infinite slab), D
eff
is the effective moisture diffusi-
vity and t is the drying time. When the drying
curve and equilibrium moisture content is experi-
mentally obtained, D
eff
can be easily predicted
using the non-linear regression analyses tech-
nique.
As can be seen, the above general solution has
an exponential form. There are many statistically-
based expressions correlating experimentally ob-
tained
Γ values in terms of t in the existing litera-
ture. Generally, these correlations remain case-
dependent, each suggesting coefficients varying
from product to product. Therefore, they cannot
be generalized. Moreover, many of these expres-
sions just fitting curves for
Γ vs. t have a form not
consistent with the analytical solution of the prob-
lem. Therefore, we only consider the expressions
consistent with the nature of the problem. If only
the first term of the series is considered, Eq. (2)
takes the following form:
kt
Ae
−
Γ =
(4)
which is called a single-exponential model or the
Henderson and Pabis model [15] in the existing
literature. The Lewis model [16] assumes 1 for A.
332
A. Kaya et al. / Desalination 212 (2007) 328–343
0.0
0.2
0.4
0.6
0.8
1.0
a
w
0.0
0.2
0.4
0.6
0.8
1.0
1.2
1.4
1.6
1.8
2.0
2.2
Equ
ilib
rium
M
o
is
tu
re
C
o
n
ten
t (
g
H
2
O/
g
d
ry
m
a
tt
e
r)
T=25
O
C
T=35
O
C
T=45
O
C
T=55
O
C
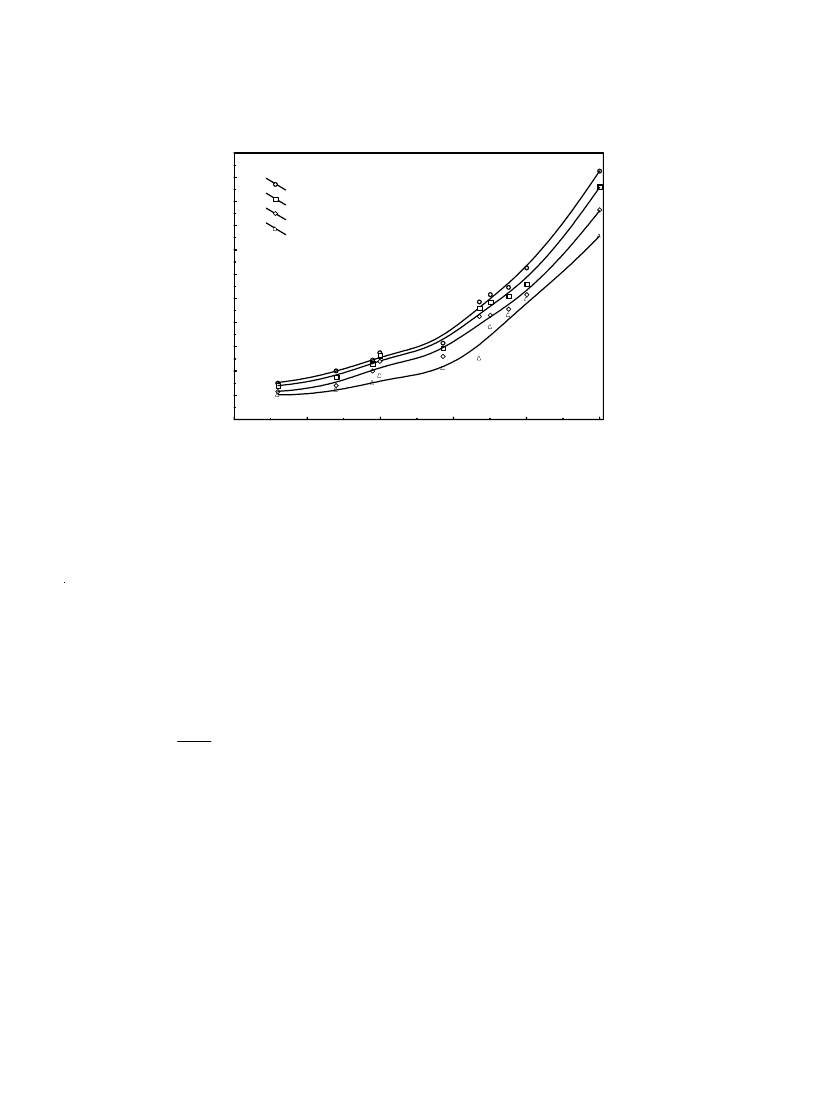
Fig. 3. Sorption isotherms of quince at 25, 35, 45 and 55ºC.
When the first two terms of the series considered,
Eq. (2) takes the form
(5)
which is called a two-term exponential model in
the existing literature [17].
The dependence of D
eff
on temperature can be
determined by a simple Arrhenius expression:
a
eff
0
abs
exp
E
D
D
T R
⎛
⎞
=
−
⎜
⎟
⎝
⎠
(6)
where E
a
is the activation energy of the moisture
diffusion (kJ/mol), D
0
is the diffusivity value for
an infinite moisture content, R represents the uni-
versal gas constant and T
abs
is the absolute tem-
perature. By plotting ln (D
eff
) vs. 1/T
abs
diagram,
E
a
and D
0
coefficients can be subsequently related
to drying air conditions via non-linear regression
analysis techniques. The temperature used in the
Arrhenius analysis is the ambient temperature of
the material being dried is also that of the sur-
rounding drying environment. Therefore, the iso-
thermal assumption has been applied in determin-
ing the activation energy [5].
2.4. Uncertainty analysis
Experimental studies are not free of errors and
uncertainties originating from measuring instru-
ments, environment, observer, friction and oscil-
lations during the running of the system. There-
fore, in order to indicate the quality of the mea-
surements carried out, an uncertainty analysis has
been performed by following the method de-
scribed by Holman [18]. The uncertainties in cal-
culating the moisture content and temperature
were obtained to be ±0.1% and 0.2%, respectively
(Table 3).
3. Results and discussion
The initial moisture content of quince slices
was measured to be around 82.5% w.b. (4.71 d.b.).
Prior to the drying experiments, the equipment
was run for about an hour to achieve steady state
conditions for the desired temperature and rela-
kt
lt
Ae
Be
−
−
Γ =
+

A. Kaya et al. / Desalination 212 (2007) 328–343
333
tive humidity levels of the drying air. Experiments
were conducted for the following ranges of the
governing parameters of the drying air: tempera-
tures at 35, 45 and 55ºC; mean velocities at 0.2,
0.4 and 0.6 m/s; relative humidity values at 40,
55 and 70%. Drying was continued until the equi-
librium moisture content was reached. Experi-
ments were repeated at least three times for any
studying range in order to validate the results ob-
tained.
At first, the sorption isotherm representing the
variation of the moisture content with the water
activity, a
w
, is plotted in Fig. 3. As can be seen
from Fig. 3, at a constant water activity, equilib-
rium moisture contents increases with decreasing
temperature. Similar characteristics were reported
by Palipane and Driscoll [19], Litchfield and Okos
[20], Timoumi and Zagrouba [21] and McLaugh-
lin and Magee [11]. This trend may be explained
by considering excitation states of molecules. At
increased temperatures molecules are in an in-
creased state of excitation, thus increasing their
distance apart and decreasing the attractive forces
between them. This leads to a decrease in the de-
gree of water sorption at a given relative humid-
ity with increasing temperature. It is also shown
that equilibrium moisture content increases with
increasing water activity at constant temperature.
These changes in equilibrium moisture content are
due to an inability of the foodstuff to maintain
vapor pressure at unity with decreasing moisture
content. As moisture content decreases, moisture
in the food tends to show a lower vapor pressure,
acting as if in solution, changing with atmospheric
humidity [11].
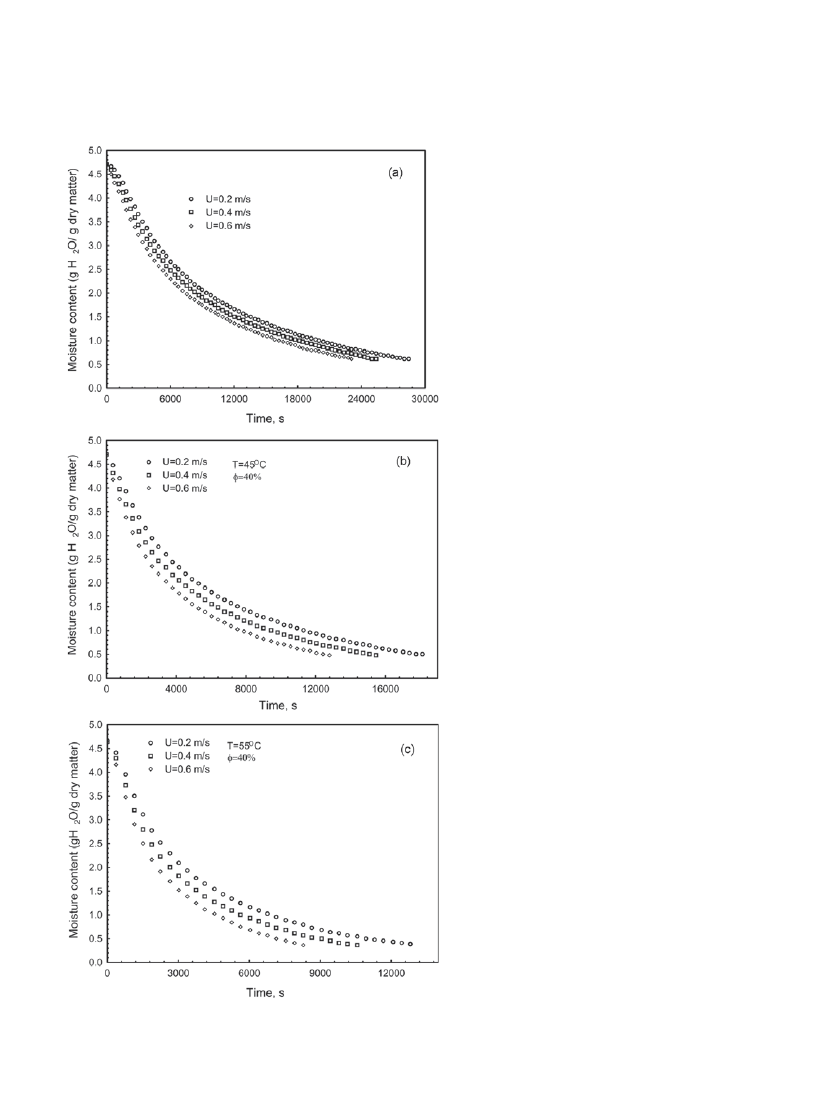
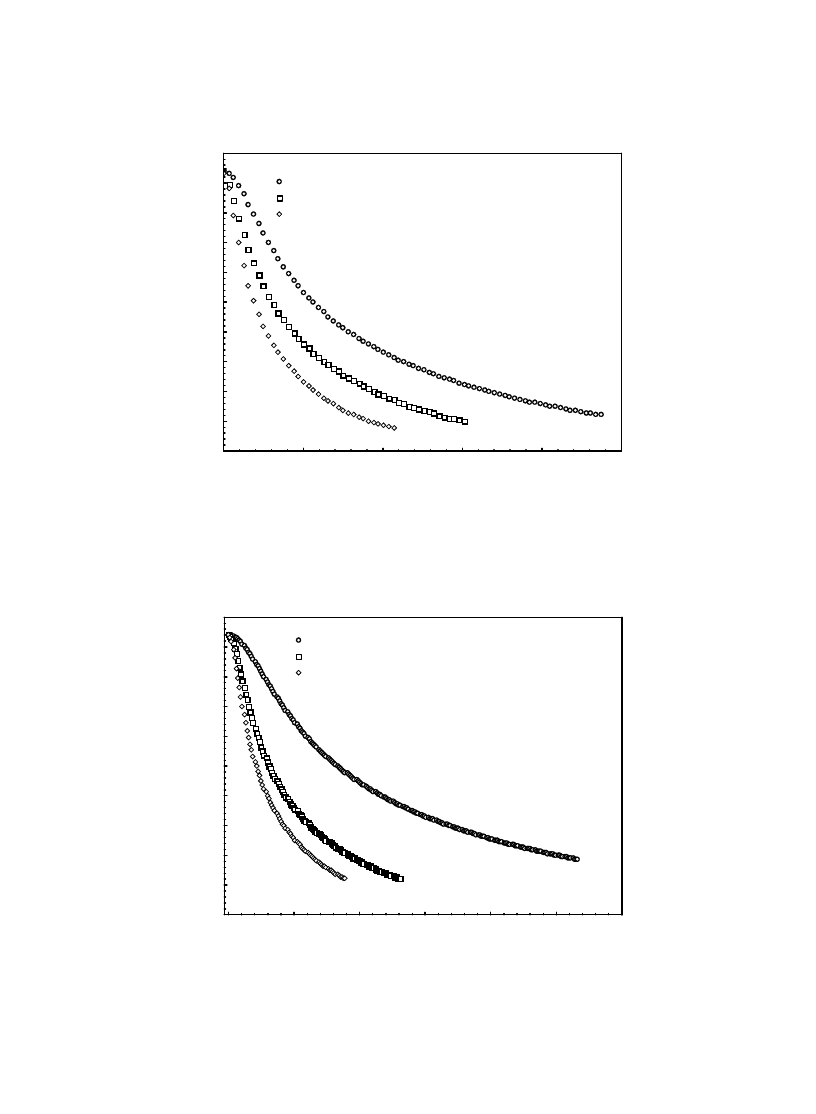
Variations of the moisture content with the
drying time, t, for varying values of the govern-
ing parameters (mainly, the temperature, T, the
velocity, U, and the relative humidity,
φ, of the
drying air) were determined. Fig. 4 shows the in-
fluence of U on the moisture content ˜ t variation
at
φ = 40% for T = 35ºC (a), 45ºC (b) and 55ºC
(c). As can be seen, an increase in the velocity of
the drying air results in decreasing drying times
as a result of increasing convective heat and mass
transfer coefficients between the drying air and
the product. The convective heat and mass coef-
ficients are used to determine the heat transfer
from the drying air to the product and the mass
transfer from the product to the drying air, respec-
tively. As is seen from Fig. 4a, increasing U from
0.2 m/s to 0.4 m/s decreased the total drying time
from about 28,479 s to about 25,405 s (a decrease
of 10.8%). Similarly, a further increase in U to
0.6 m/s decreased the total drying time to about
23,106 s, which indicates a decrease of 9.05% and
18.9% according to those at U = 0.2 m/s and
0.4 m/s, respectively. As expected, increasing the
temperature of the drying air decreased the total
drying time since heat transfer was increased due
to the increasing temperature difference which is
the driving potential of the heat transfer (Fig. 4b,c).
The influence of T on the drying behavior can be
better seen from Fig. 5. For constant values of the
velocity and the relative humidity of the drying
air, at
φ = 40% and U = 0.2 m/s, increasing the
temperature of the drying air from T = 35ºC to
45ºC decreased the total drying time about 36%.
A further increase in T to 55ºC decreased the total
drying time to about 29.3% and about 55% ac-
cording to those at T = 45ºC and T = 35ºC, re-
spectively.
Fig. 6 shows effect of
φ on the moisture con-
tent ˜ t variation. A decrease in
φ decreases the
total drying time due to the increasing mass trans-
fer. Decreasing
φ increases the difference between
the concentrations of water in the drying air and
the product. The experimental results and effects
of the above drying air parameters considered on
the drying kinetics are found to be in consistent
with those given for some other products in the
existing literature. For constant values of the tem-
perature and the velocity of the drying air, at T =
35ºC and U = 0.2 m/s, decreasing the relative
humidity of the drying air from 70% to 55% de-
creased the total drying time about 46%. A fur-
ther decrease in
φ to 40% decreased the total dry-
ing time to about 34% and about 64.4% accord-
334
A. Kaya et al. / Desalination 212 (2007) 328–343
Fig. 4. The variation of moisture content with t
for various U at
φ = 40% for T = 35ºC (a), 45ºC
(b) and 55ºC (c).
A. Kaya et al. / Desalination 212 (2007) 328–343
335
0
6000
12000
18000
24000
30000
Time, sec
0.0
0.5
1.0
1.5
2.0
2.5
3.0
3.5
4.0
4.5
5.0
M
o
is
tu
re Con
ten
t (
g
H
2
O
/g dr
y
ma
tt
er
)
T=35
O
C
T=45
O
C
T=55
O
C
U=0.2 m/s
φ=40%
Fig. 5. The variation of moisture content with t for various T at
φ = 40% and U = 0.2 m/s.
Fig. 6. The variation of moisture content with t for various
φ at T = 35ºC and U = 0.2 m/s.
0
15000
30000
45000
60000
75000
90000
Time, sec
0.0
0.5
1.0
1.5
2.0
2.5
3.0
3.5
4.0
4.5
5.0
M
o
is
tu
re Con
ten
t (g H
2
O
/g dr
y
m
at
ter
)
φ=70%
φ=55%
φ=40%
U=0.2 m/s
T=45
O
C

336
A. Kaya et al. / Desalination 212 (2007) 328–343
Table 3
Uncertainties in measurement of parameters during drying of quince
Instrument Range
Estimated
uncertainty
Load cell, g
0–10,000
± 0.01 (based on manufacturer’s specification and calibration data)
Thermocouples
(copper + constantan), ºC
0–200
± 0.2 (based on manufacturer’s specification and calibration data )
Hygrometer, %
5–90
± 1 (based on manufacturer’s specification)
Anemometer, m/s
0.2–20
± 0.05 (based on manufacturer’s specification)
ing to those at
φ = 55% and φ = 70%, respec-
tively.
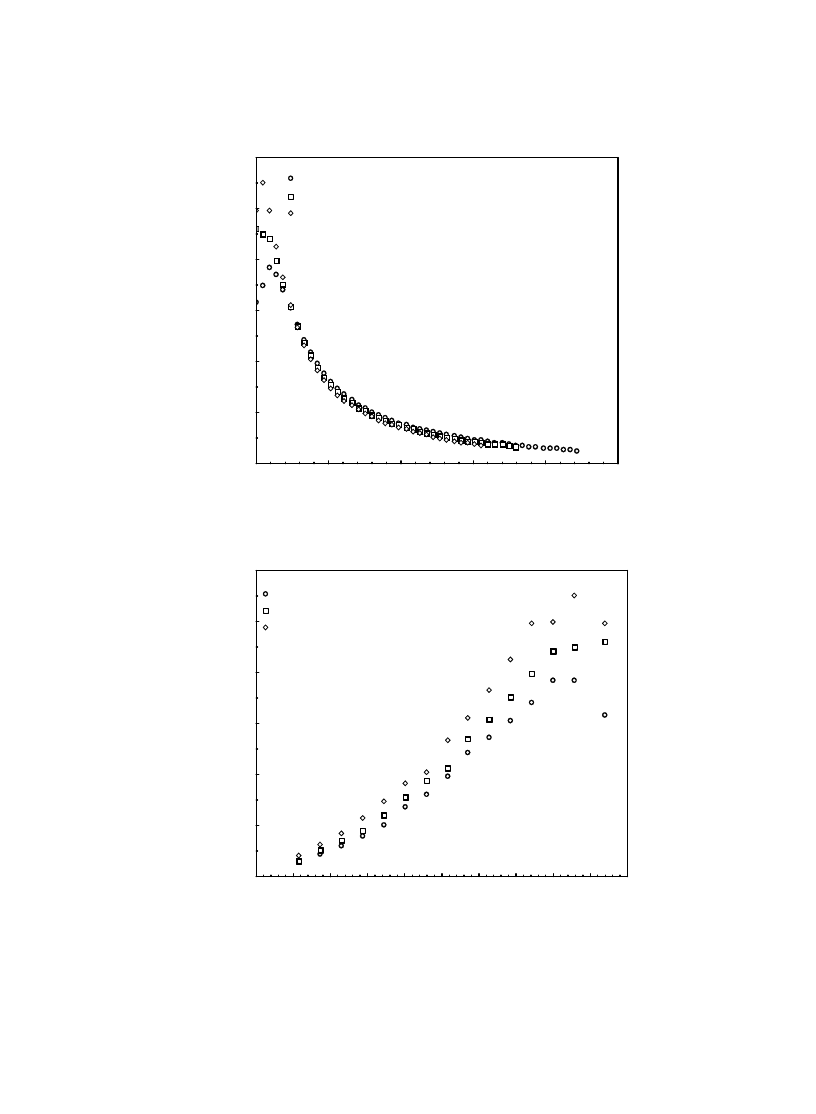
In order to gain a deeper insight into the dry-
ing behavior, the variations of the drying rate with
the drying time, t (a) and the moisture content (b)
are shown in Figs. 7–9 for varying velocity, tem-
perature and relative humidity of the drying air,
respectively. Due to the moisture diffusion pro-
cess, the drying rate decreases with time.
The period of constant drying rate, as is typi-
cally the case for fruits, is either very small or
does not exist at all, for all values of the process
variables tested. The value of the moisture ratio
decreases rapidly, with a consequent increase of
the drying rate, when air temperature increases.
The initial value of drying rate almost doubled
when the air temperature was increased from 35
to 55ºC.
The drying rate is another common parameter
used in the drying analysis, which equals (M
t
–
M
t +
∆t
)/
∆t. At the first stages of the drying pro-
cess, the variation of the drying rate with time is
very strong, which then becomes nearly constant
(Figs. 7a, 8a and 9a). From Fig. 7a, initially, it is
very clear that the higher the air velocity, the
higher the drying rate. At lower moisture ratios,
the effect of the drying air velocity on the drying
rate is nearly negligible (Fig. 7b). However, es-
pecially for higher values of moisture content, an
increase in U increases the drying rate. This can
be explained as follows: lower values of mois-
ture content represent lower values of the water
content inside the product. Therefore, for the lower
values of moisture content, no significant changes
occur with an increase in the temperature of the
drying air, since there is a negligible amount of
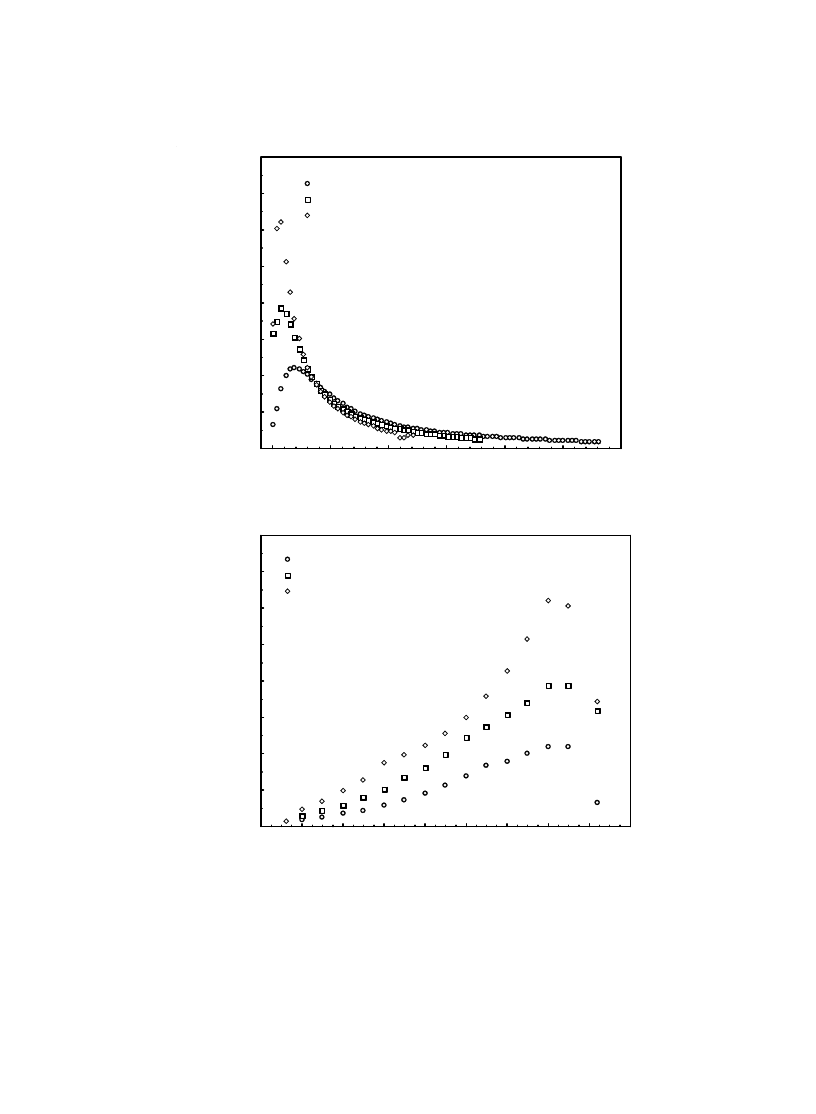
water to evaporate. In Fig. 8, we observe similar
behaviors for the effect of the temperature of the
drying fluid. For higher values of the moisture
content, increasing drying temperature results in
increasing the drying rate and therefore decreas-
ing the drying time. This can be explained by the
increasing the temperature difference between the
drying air and the product and resulting in accel-
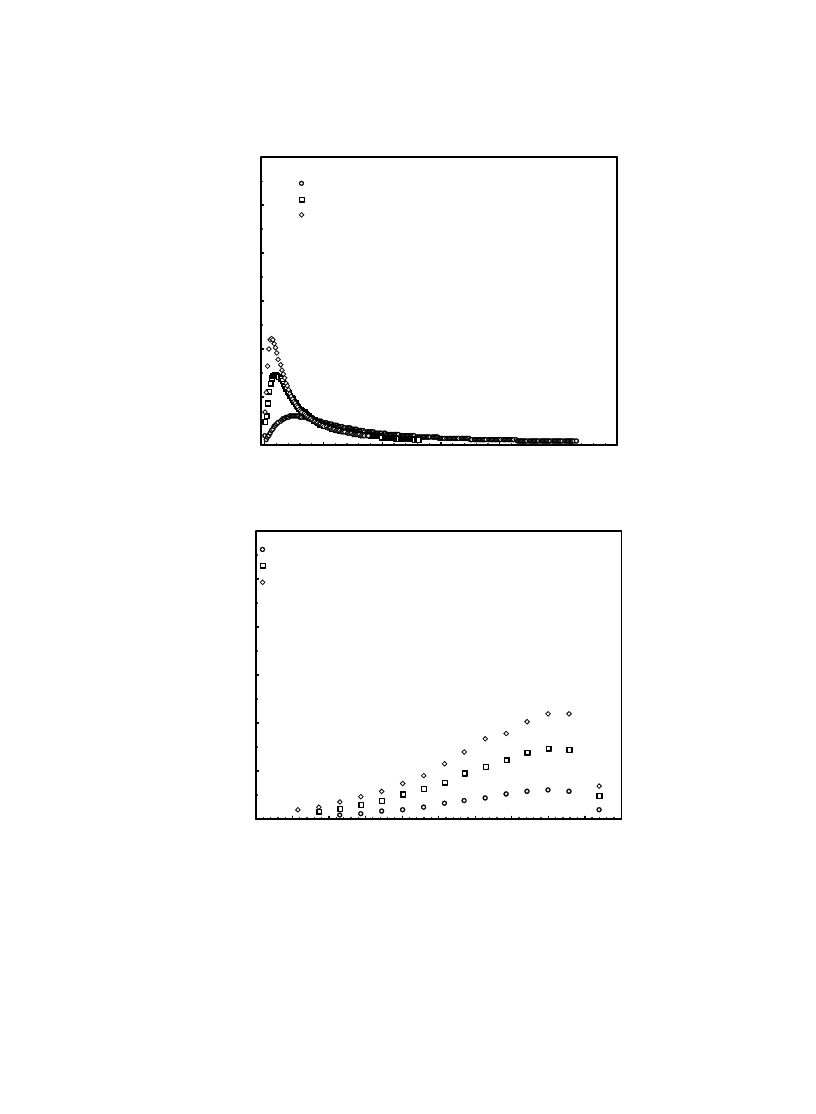
erating water migration. Fig. 9 shows that rela-
tive humidity has a considerable influence on the
variation of the drying rate with moisture content
or the drying time. As expected, decreasing the
relative humidity intensifies the drying rate change
by moisture content or the drying time. The varia-
tion of ln(D
eff
) with 1/T
abs
is plotted in Fig. 10,
from which E
a
and D
0
coefficients are predicted.
In the following, the experimental results are
fit to the expression given in Eqs. (4) and (5) us-
ing STATISTICA and the results are listed in
Table 4. Readers are referred to McMinn [22] in
order to have detailed information on the statisti-
cal parameters defined. Coefficients used in the
models considered are determined and shown in
Table 4. As shown, for all the cases studied, the
models considered predict the experimental re-
sults with a satisfactory and reasonable agreement
(R > 0.99).
Using the experimental results obtained, the
effective moisture diffusivity D
eff
is predicted from
Eq. (3) and given in Table 5. As can be seen, an
increase in either U or T, or a decrease in
φ in-
creases D
eff
. As can be seen from Table 4, the ef-
A. Kaya et al. / Desalination 212 (2007) 328–343
337
0
4000
8000
12000
16000
20000
Time, sec
0.0E-01
4.0E-04
8.0E-04
1.2E-03
D
ryin
g
R
a
te
(
g
H
2
O
/g dr
y m
a
tt
e
r
s
e
c)
U=0.2 m/s
U=0.4 m/s
U=0.6 m/s
T=45
O
C
φ=40%
0.0
0.5
1.0
1.5
2.0
2.5
3.0
3.5
4.0
4.5
5.0
Moisture Content (g H
2
O/g dry matter)
0.0E-01
4.0E-04
8.0E-04
1.2E-03
D
ryin
g
R
a
te
(
g
H
2
O
/g dr
y m
a
tt
e
r
s
e
c)
U=0.2 m/s
U=0.4 m/s
U=0.6 m/s
T=45
O
C
φ=40%
Fig. 7. The influence of U on the variation of the drying rate with t (a) and moisture content (b) at
φ = 40% and T = 45ºC.
(a)
(b)
338
A. Kaya et al. / Desalination 212 (2007) 328–343
0
5000
10000
15000
20000
25000
30000
Time, sec
0.0E-01
4.0E-04
8.0E-04
1.2E-03
1.6E-03
M
o
is
tu
re
C
o
n
te
n
t (g
H
2
O
/g
dry mat
te
r se
c)
T=35
O
C
T=45
O
C
T=55
O
C
U=0.2 m/s
φ=40%
0.0
0.1
0.2
0.3
0.4
0.5
0.6
0.7
0.8
0.9
Moisture Content (g H
2
O/g dry matter)
0.0E-01
4.0E-04
8.0E-04
1.2E-03
1.6E-03
Dr
ying
Ra
te
(g
H
2
O
/g
dr
y m
a
tt
e
r s
e
c
)
T=35
O
C
T=45
O
C
T=55
O
C
U=0.2 m/s
φ=40%
Fig. 8. The influence of T on the variation of the drying rate with t (a) and moisture content (b) at
φ = 40% and U = 0.2 m/s.
(a)
(b)
A. Kaya et al. / Desalination 212 (2007) 328–343
339
0
15000
30000
45000
60000
75000
90000
Time, sec
0.0E-01
4.0E-04
8.0E-04
1.2E-03
Dr
y
in
g
Ra
te
(
g
H
2
O
/g dr
y m
a
tt
er
s
e
c
)
φ=70%
φ=55%
φ=40%
U=0.2 m/s
T=35
O
C
0.0
0.5
1.0
1.5
2.0
2.5
3.0
3.5
4.0
4.5
5.0
Moisture Content (g H
2
O/g dry matter)
0.0E-01
4.0E-04
8.0E-04
1.2E-03
Dr
y
in
g
Ra
te
(
g
H
2
O
/g dr
y m
a
tt
e
r s
e
c
)
φ=70%
φ=55%
φ=40%
U=0.2 m/s
T=35
O
C
Fig. 9. The influence of
φ on the variation of the drying rate with t (a) and moisture content (b) at T = 35ºC and U = 0.2 m/s.
(a)
(b)

340
A. Kaya et al. / Desalination 212 (2007) 328–343
Table 4
Prediction of the model coefficients
Two-term exponential model
φ = 40%
U = 0.2 m/s
R U
= 0.4 m/s
R U = 0.6 m/s
R
A
0.5442 0.5121 0.5172
B
0.5090 0.5122 0.4848
k ×10
4
(s
–1
) 1.1988
1.3093
1.4667
T = 35ºC
l ×10
4
(s
–1
) 1.1988
0.998
1.3093
0.999
1.4833
0.999
A
0.5019 0.0855 0.0944
B
0.5029 0.9245 0.9133
k ×10
4
(s
–1
) 1.8511
10.4131
15.8833
T = 45ºC
l ×10
4
(s
–1
) 2.0667
0.999
2.1667
0.999
2.6501
0.998
A
0.9687 0.9245 0.9514
B
0.0617 0.1092 0.0711
k ×10
4
(s
–1
) 2.9103
3.3021
4.2667
T = 55ºC
l ×10
4
(s
–1
) 7.8666
0.999
8.9833
0.999
1.1466
0.999
Henderson and Papis model
A
1.0533 1.0244 1.0021
T = 35ºC
k ×10
4
(s
–1
) 1.2031
0.998
1.3167
0.999
1.4667
0.998
A
1.0042 0.9804 0.9697
T = 45ºC
k ×10
4
(s
–1
) 1.9503
0.998
2.2833
0.999
2.7833
0.998
A
1.0203 1.0171 1.0127
T = 55ºC
k ×10
4
(s
–1
) 3.0342
0.998
3.5167
0.999
4.4534
0.999
Lewis model
T = 35ºC
k ×10
4
(s
–1
) 1.1333
0.997 1.2833
0.998 1.4667
0.999
T = 45ºC
k ×10
4
(s
–1
) 1.9483
0.999 2.3333
0.999 2.8883
0.998
T = 55ºC
k ×10
4
(s
–1
) 2.9534
0.998 3.4523
0.998 4.3833
0.998
Two-term exponential model
T
= 35°C
U = 0.2 m/s
R U
= 0.4 m/s
R U = 0.6 m/s
R
φ = 40%
A
0.5442
0.998 0.5121
0.999 0.5172
0.999
B 0.5090 0.5122 0.4848
k
×10
4
(s
–1
)
1.1988 1.3093 1.4667
l×10
4
(s
–1
)
1.1988 1.3093 1.4833
φ = 55%
A
0.5218
0.999 0.5077
0.999 0.5113
0.999
B
0.5269 0.5252 0.5132
k ×10
4
(s
–1
)
0.8231 0.9333 1.1023
l ×10
4
(s
–1
)
0.8231 0.9333 1.1023
φ = 70%
A
0.5336
0.998 0.5406
0.998 0.4457
0.998
B
0.5541 0.5407 0.6390
k ×10
4
(s
–1
)
0.3833 0.4167 0.4667
l ×10
4
(s
–1
)
0.3833 0.4167 0.4667
Henderson and Papis model
φ = 40%
A
1.0533
0.998 1.0244
0.999 1.0021
0.994
k ×10
4
(s
–1
)
1.2031 1.3167 1.4667
φ = 55%
A
1.0488
0.999 1.0329
0.999 1.0246
0.999
k ×10
4
(s
–1
)
0.8032 0.9333 1.1023
φ = 70%
A
1.0879
0.998 1.0835
0.998 1.0846
0.999
k ×10
4
(s
–1
)
0.3833 0.4333 0.4833
Lewis model
φ = 40%
k ×10
4
(s
–1
) 1.1333
0.997 1.2833
0.998 1.4667
0.999
φ = 55%
k ×10
4
(s
–1
) 0.7667
0.997 0.9012
0.998 1.0833
0.999
φ = 70%
k ×10
4
(s
-1
) 0.3667
0.994 0.4002
0.994 0.4502
0.994
A. Kaya et al. / Desalination 212 (2007) 328–343
341
fective diffusivity values varied from 0.65×10
–10
and 6.92×10
–10
m
2
/s. These values are in fact con-
sistent with those existing in the literature, e.g.
1–3×10
–11
m
2
/s for air drying of apricots [23],
10.4–9.9×10
–11
m
2
/s for sun drying of differently
treated grapes [24], 4.28×10
–10
–6.8×10
–9
m
2
/s for
hot air drying of okra [25], 2.32×10
–10
–2.76
×10
–9
m
2
/s for hot air drying of mulberry [26] and
8.33×10
–10
m
2
/s hot air drying of banana slices
[27].
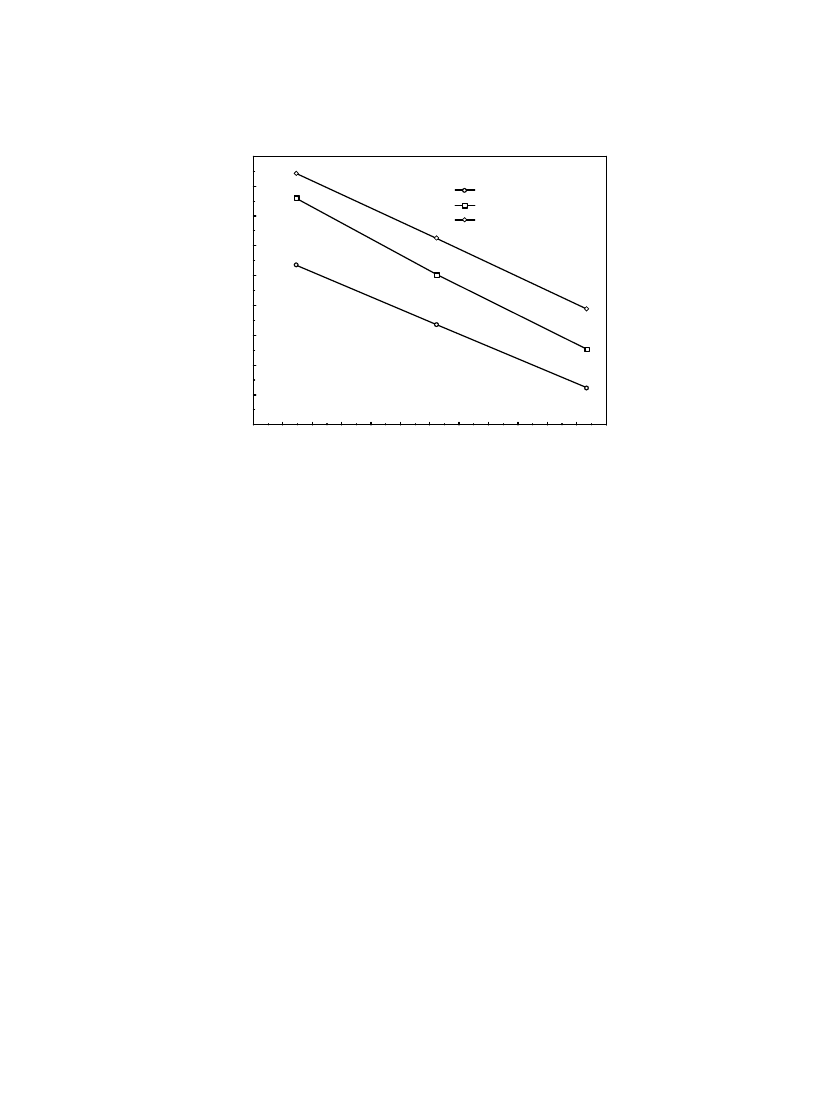
In the following, the value of D
eff
is used to
predict the activation energy of the moisture dif-
fusion, E
a
using the Arrhenius equation given in
Eq. (6), which is tabulated in Table 6. An increase
in U increases E
a
and D
0
. As seen, the activation
energy for diffusion, calculated from Eq. (6),
ranged between 33.832 kJ/mol and 41.515, as
similar to those given in the literature for drying
of different foods: 26.2 kJ/mol for broccoli dry-
ing [28]; between 49–54 kJ/mol in drying of
grapes [29]; 12.3–39.5 kJ/mol for potato and bean
drying, respectively [30].
3.02
3.06
3.10
3.14
3.18
3.22
3.26
1/T (x1000)
-22.6
-22.4
-22.2
-22
-21.8
-21.6
-21.4
-21.2
-21
-20.8
ln
(
D
ef
f
)
U=0.2 m/s
U=0.4 m/s
U=0.6 m/s
Fig. 10. Arrhenius-type relationship between effective moisture diffusivity and temperature.
On the quality of the dried products, observa-
tions of the color have been made before and af-
ter drying. Especially for higher values of the rela-
tive humidity (
≥70%) color changes have been
observed, which, in turn, affected the taste of the
product.
4. Conclusions
In this experimental study, drying kinetics of
quince slices was investigated as a function of
drying conditions. Experiments were carried out
for several values of the air temperature, the mean
velocity and the relative humidity. The following
conclusions can be drawn from the study:
i)
At a constant water activity, equilibrium
moisture content decreases with increasing
temperature.
ii)
At a constant temperature, equilibrium mois-
ture content increases with increasing water
activity.
iii) Increasing the temperature or the velocity of

342
A. Kaya et al. / Desalination 212 (2007) 328–343
φ = 40%
U = 0.2 m/s
R U
= 0.4 m/s
R U
= 0.6 m/s
R
T = 35ºC
1.96
0.996
2.09
0.995
2.43
0.999
T = 45ºC
3.71
0.994
4.15
0.997
4.54
0.995
T = 55ºC
4.84
0.998
5.69
0.998
6.92
0.997
T = 35ºC
φ = 40%
1.96 0.996
2.09 0.995
2.43 0.999
φ = 55%
1.38 0.997
1.42 0.998
1.72 0.996
D
eff
×10
10
m
2
/s
φ = 70%
0.65
0.996 0.73
0.999 0.82
0.997
Table 5
Diffusion coefficient, D
eff
Table 6
Energy of activation and coefficient D
0
U = 0.2 m/s
R U = 0.4 m/s
R U = 0.6 m/s
R
E
a
(kj/mol)
33.832
37.532
41.515
D
0
(m
2
/s)
1.21×10
–04
0.997
5.52×10
–04
0.998
2.86×10
–03
0.997
the drying air decreases the total drying time,
while decreasing the relative humidity de-
creases it. At T = 35ºC and
φ = 40%, increas-
ing U from 0.2 m/s to 0.6 m/s has lead to a
decrease of 18.9% in the total drying time.
At U = 0.2 m/s and
φ = 40%, an increase in T
from 35ºC to 55ºC decreased the total drying
time 55%. At T = 35ºC and U = 0.2 m/s, a
decrease in
φ from 70% to 40% decreased
the total drying time 64.4%.
iv) The forms of the single-exponential model
or the Henderson and Pabis model, the Lewis
model and the two-term exponential model
are consistent with the analytical solution of
the mass diffusion equation. All these three
models have been shown to correspond very
well with the experimental data.
v)
An increase either in U or T, or a decrease in
φ increases D
eff
.
vi) An increase in U increases E
a
.
vii) An uncertainty analysis was made, which
yielded uncertainty values lower than 0.2%
for temperature and moisture measurements.
Acknowledgements
The authors acknowledge the financial sup-
port provided by Karadeniz Technical University
Research Fund under Grant No 2004.112.003.01.
Symbols
a
w
— Water activity
D
eff
— Effective diffusivity coefficient, m
2
/s
D
0
— Arrhenius factor, m
2
/s
E
a
— Energy of activation, kJ/mol
f
— Shape factor
L
0
— Characteristics dimension, m
M
— Moisture content at t, g H
2
O/g dry
matter
M
e
— Equilibrium moisture content, g H
2
O/g
dry matter
M
0
— Initial moisture content, g H
2
O/g dry
matter
p
f
— Vapor pressure of the water in the
product, Pa
p
0
— Vapor pressure of pure water, Pa
R
— Universal gas content, kJ/mol.
o
K

A. Kaya et al. / Desalination 212 (2007) 328–343
343
T
— Temperature,
o
C
T
abs
— Absolute temperature,
o
K
t
— Time, s
U
— Velocity, m/s
Γ
— Dimensionless moisture content
φ
— Relative humidity
φ
eq
— Equilibrium relative humidity of the salt
solution
References
[1]
K. Sacilik and A.K. Elicin, The thin layer drying char-
acteristics of organic apple slices, J. Food Eng., 73
(2005) 281–289.
[2]
D. Velic, M. Planinic, S. Tomas and M. Bilic, Influ-
ence of airflow velocity on kinetics of convection apple
drying, J. Food Eng., 64 (2004) 97–102.
[3]
M.A. Karim and M.N.A. Hawlader, Mathematical
modeling and experimental investigation of tropical
fruits drying, Intern. J. Heat Mass Transfer, 48 (2005)
4914–4925.
[4]
S. Simal, A. Femenia, M.C. Garau and C. Rossello,
Use of exponential, Page’s and diffusional models to
simulate the drying kinetics of kiwi fruit, J. Food Eng.,
66 (2004) 323–328.
[5]
J. Srikiatden and J.S. Roberts, Measuring moisture
diffusivity of potato and carrot (core and cortex) dur-
ing convective hot air and isothermal drying, J. Food
Eng., 74 (2004) 143–152.
[6]
M.K. Krokida, V.T. Karathanos, Z.B. Maroulis and
D.M. Kouris, Drying kinetics of some vegetables, J.
Food Eng., 59 (2003) 391–403.
[7]
S. Lahsasni, M. Kouhila, M. Mahrouz and J.T. Jaouhari,
Drying kinetics of prickly pear fruit (Opuntia ficus in-
dica), J. Food Eng., 61 (2004) 173–179.
[8]
S.J. Babalis and V.G. Belessiotis, Influence of the dry-
ing conditions on the drying constants and moisture
diffusivity during the thin-layer drying of figs, J. Food
Eng., 65 (2004) 449–458.
[9]
R.P.F. Guine and R.M.C. Fernandes, Analysis of the
drying kinetics of chestnuts, J. Food Eng., in press.
[10] M. Kashaninejad, A. Mortazavi, A. Safekordi and L.G.
Tabil, Thin-layer drying characteristics and modeling
of pistachio nuts, J. Food Eng., in press.
[11] C.P. McLaughlin and T.R.A. Magee, The determina-
tion of sorption isotherm and the isosteric heat of sorp-
tion for potatoes, J. Food Eng., 35 (1998) 267–280.
[12] H. Desmorieux and N. Decaen, Convective drying of
spirulina in thin layer, J. Food Eng., 66 (2004) 497–
503.
[13] R.B. Keey, Drying Principles and Practice. Pergamon
Press, Oxford, 1972.
[14] J. Crank, The Mathematics of Diffusion. Oxford Uni-
versity Press, London, 1975.
[15] S.M. Henderson and S. Pabis, Grain drying theory. II.
Temperature effects on drying coefficients, J. Agric.
Eng. Res., 6 (1961) 169–174.
[16] W.K. Lewis, The rate of drying of solid materials, J.
Ind. Eng. Chem., 13(5) (1921) 427–432.
[17] Y.I. Sharaf-Eldeen, J.L. Blaisdell and M.Y. Hamdy, A
model for ear corn drying, Trans. ASEA, 23 (1980)
1261–1271.
[18] J.P. Holman, Experimental Methods for Engineers.
McGraw-Hill, New York, 2001.
[19] K.B. Palipane and R.H. Driscoll, Moisture sorption
characteristics of in-shell macadamia nuts, J. Food
Eng., 18 (1992) 63–76.
[20] B.J. Litchfield and M. Okos, Moisture diffusion in pasta
during drying, J. Food Eng., 17 (1992) 117–142.
[21] S. Timoumi and F. Zagrouba, Water sorption and de-
hydration kinetics of Tunisian rosemary leaves, De-
salination, 185 (2005) 517–521.
[22] W.A.M. McMinn, Thin-layer modeling of the convec-
tive, microwave, microwave-convective and micro-
wave-vacuum drying of lactose powder, J. Food Eng.,
72 (2006) 113–123.
[23] E.H. Abdelhaq and T.P. Labuza, Air drying character-
istics of apricots, J. Food Sci., 52(2) (1987) 342–345.
[24] T. Mahmutoglu, F. Emir and Y.B. Saygi, Sun/solar
drying of differently treated grapes and storage stabil-
ity of dried grapes, J. Food Eng., 29 (1996) 289–300.
[25] F. Gögüs and M. Maskan, Water adsorption and dry-
ing characteristics of okra (Hibiscus Esculentus L.),
Drying Technol., 17(4–5) (1999) 883–894.
[26] M. Maskan and F. Gögüs, Sorption isotherms and dry-
ing characteristics of mulberry (Morus alba), J. Food
Eng., 37 (1998) 437–449.
[27] G. Mowlah, K. Takano, I. Kamoi and T. Obara, Water
transport mechanism and some aspects of quality
changes during air dehydration of bananas, Lebens-
mittel Wissenshaft und Technologie, 16 (1983) 103–
107.
[28] S. Simal, C. Rossello, A. Berna and A. Mulet, Drying
of shrinking cylinder-shaped bodies, J. Food Eng., 37
(1998) 423–435.
[29] S. Azzouz, A. Guizani, W. Jomaa and A. Belghith,
Moisture diffusivity and drying kinetic equation of
convective drying of grapes, J. Food Eng., 55 (2002)
323–330.
[30] W. Senadeera, B.R. Bhandari, G. Young and B.
Wijesinghe, Influence of shapes of selected vegetable
materials on drying kinetics during fluidized bed dry-
ing, J. Food Eng., 58(3) (2003) 277–283.
Wyszukiwarka
Podobne podstrony:
Interruption of the blood supply of femoral head an experimental study on the pathogenesis of Legg C
An experimental study on the development of a b type Stirling engine
Interruption of the blood supply of femoral head an experimental study on the pathogenesis of Legg C
Effect of a novel physical pretreatment process on the drying kinetics of seedless grapes
The drying kinetics of kale (Brassica oleracea) in a convective hot air dryer
Use of exponential, Page’s and diffusional models to simulate the drying kinetics of kiwi fruit
Pancharatnam A Study on the Computer Aided Acoustic Analysis of an Auditorium (CATT)
Pancharatnam A Study on the Computer Aided Acoustic Analysis of an Auditorium (CATT)
Code Red a case study on the spread and victims of an Internet worm
Experimental study on drying of chilli in a combined Microwave vacuum rotary drum dryer (Weerachai K
ebook occult The Psychedelic Experience A manual based on the Tibetan Book of the Dead
Ebsco Bialosky Manipulation of pain catastrophizing An experimental study of healthy participants
Ebsco Bialosky Manipulation of pain catastrophizing An experimental study of healthy participants
Microwave drying characteristics of potato and the effect of different microwave powers on the dried
AN EXPERIMENTAL STUDY OF A 3 KW STIRLING ENGINEt
No mercy on the violent river of life An exchang
Henri Bergson Time and Free Will An essay on the Immediate Data of Consciousness
więcej podobnych podstron