
..
..
..
..
..
.
.
.
.
.
.
.
.
.
.
Zoran Constantinescu
Toussaint Gerthory
The dynamics of
computer virus infection
A System dynamics perspective
NTNU, IDI
DIS 1007 “System dynamics”
May 2002
Any system or program, however complicated, if looked at in
exactly the right way, will become even more complicated.
Anderson's Law

2
The dynamics of
computer virus infection
A System dynamics perpective
Introduction
The goal of this survey is to study some key parameters that may influence the
propagation of a computer virus. Computer viruses are becoming more and more popular in
our interconnected society. In 2001, TrueSecure® Corporation has made a survey on 300
organizations with more than 500 PCs each. The result of this survey shows that this group of
300 organizations had 1,182,634 encounters on 666,327 machines during a period of 20
months, which was from January 2000 to August 2001. This translates to 113 encounters per
1,000 machines per month over the entire period. According to another study made by the
same organization, the global infection rates calculated their surveys of 1996 through 2001
continued a significant annual growth rate of approximately 20 encounters per month per
1,000 PCs for each year in that period.
The consequences of computer viruses may be very costly for companies. It is estimated
that the average company might find cost between $50,000 and $500,000 in total ramification
(both soft and hard cost) for virus disasters.
In their survey, 90 percent of the respondents reported protection for more than 90
percent of their PCs with anti-virus products. About 90 percent stated that 100 percent of their
PCs were protected. Most PCs (about 71 percent) were reported to be protected by full-time
automatic anti-virus protection.
Based on the SIR Model (a model of infectious disease), we will try to find out which are
the key parameters that may influence virus propagation. We will show, based on our model
that diversification may be the best way to prevent wide spread of computer virus.
Presentation of the model
Our model is based of the SIR model which is a simple model of infectious disease. We
choose the SIR model because computer viruses are somehow related to biological viruses in
the sense that they need a host in order to survive. If an infected host, come into contact with a
“clean” host, the clean host may become infected also. But contrary to biological virus, it is
not possible for an infected host to develop a resistance by itself. A machine with anti-virus
program may become immune to old known viruses but not to new ones.
In our study, we consider the population of computer to be fixed during the simulation.
This means that there is no new computer coming in when we have started the simulation.
3
1. Case study for one computer Virus
In this section, we will study the special case where the system deals with only one computer
virus. We will try to find out the different parameters that may prevent propagation.
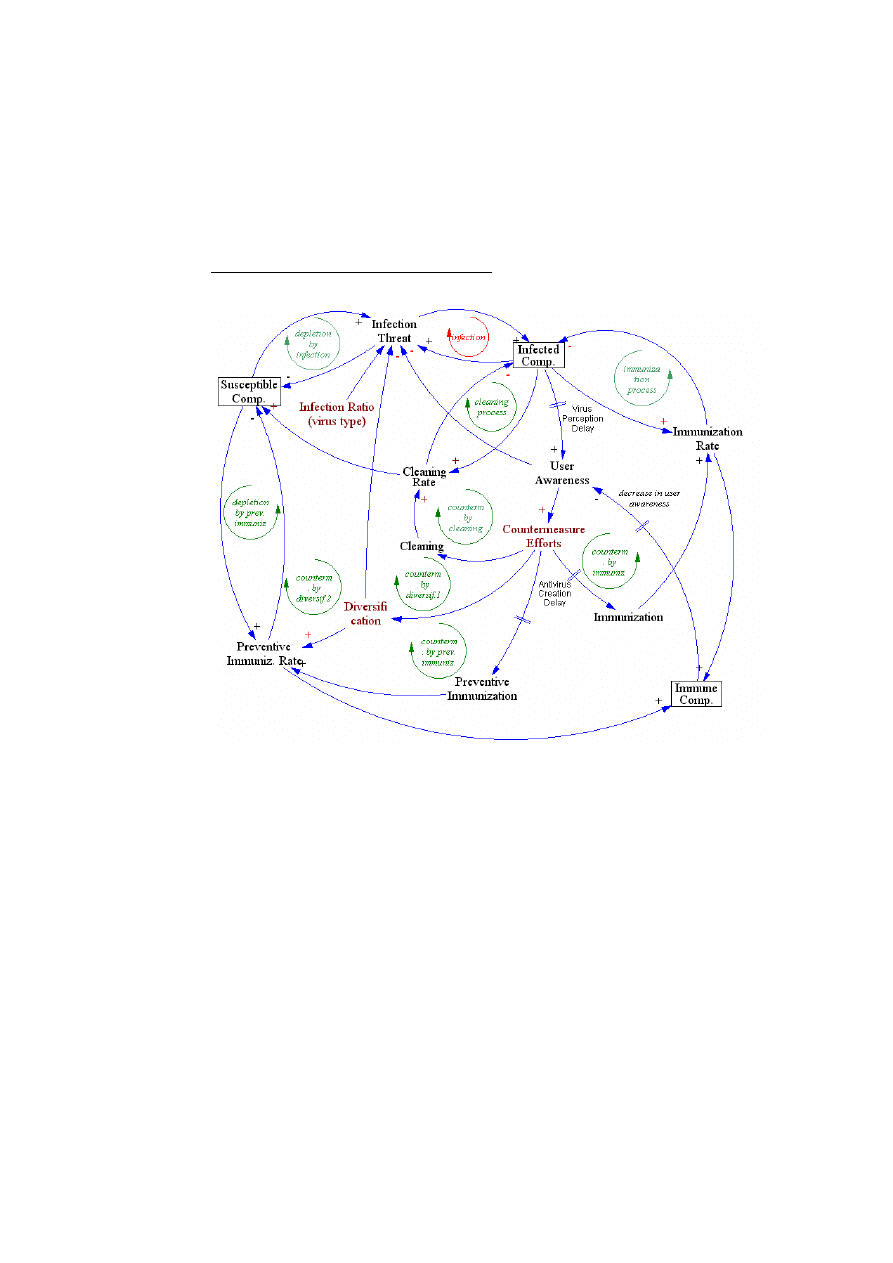
Casual Loop Diagram for the main model
•
Susceptible Comp.:
Susceptible computers that can be infected by the virus.
•
Infected Comp. :
Computers that are infected by the virus
•
Immune Comp.:
Computers that are immune to the virus. In the case of one virus, a
computer can be immune by installing an anti-virus, since there will be no new virus
that can affect this machine again. But as we will see it, this hypothesis does not
work in the general case where new viruses are coming in the system.
•
User Awareness:
Describes how much the users are aware of the threat
•
Countermeasure Efforts:
Describe the measures that are taken in order to fight
the threat. The different measures considered in this study are: cleaning the computer
without installing an anti-virus program, installing an anti-virus program that will
result in an immunization of the computer and will clean it at the same time, and the
finally diversification. The immunization can be preventive or curative. In the first
case, users will install an anti-virus program before getting infected.
We can see that we will have three stocks for the computer. One stock will consist of
those that are susceptible to be infected, one of infected and the last one will consist of
4
those that are immune. The infection rate, the immunization rate and the preventive
immunization rate are the main flows controlling those stocks. But as we can see in the
diagram, the user awareness will play in important role in fighting back the threat.
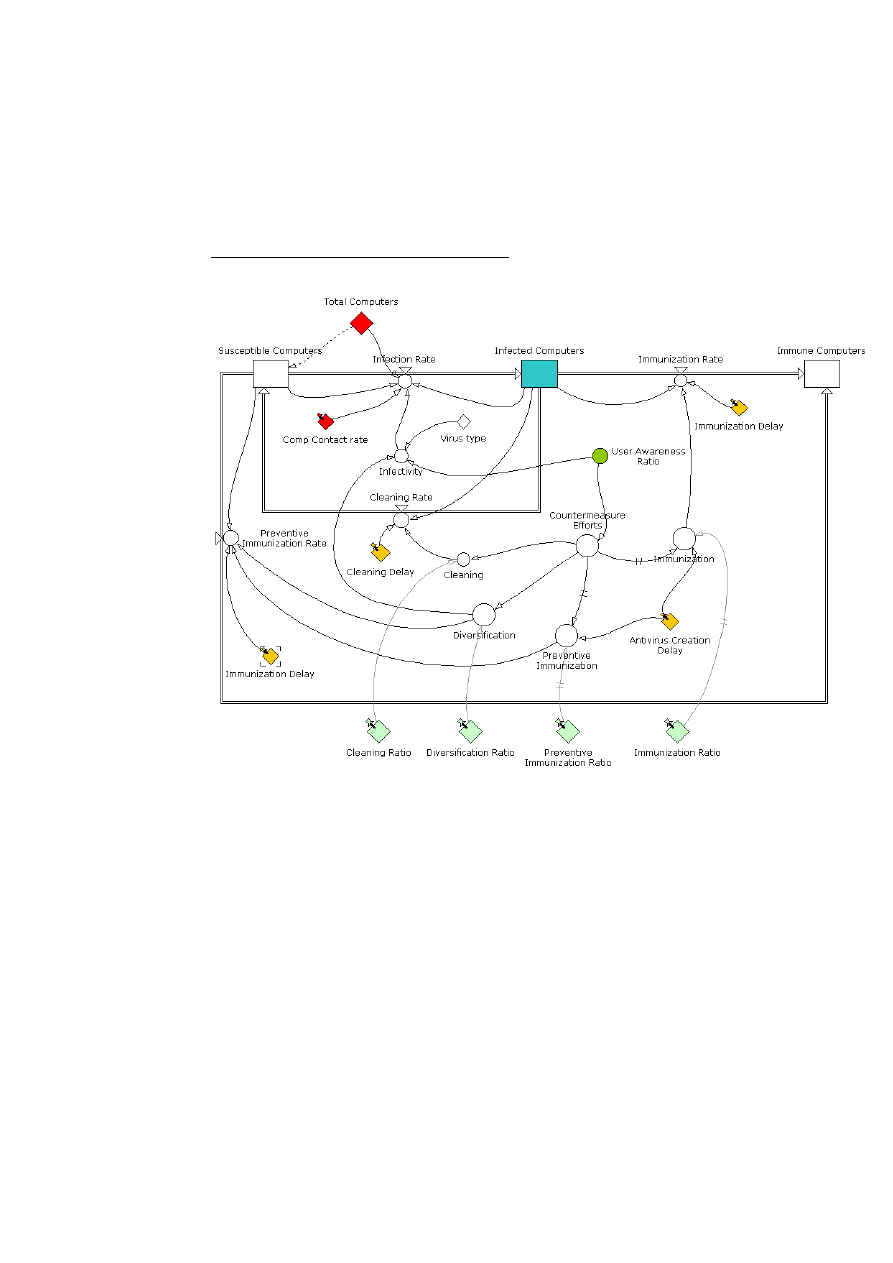
Stock and Flow diagram for the main model
In this diagram we have 3 stocks which are represented by: susceptible computers, infected
computers, immune computers. We have 4 flows represented by: infection rate, immunization
rate, cleaning rate, preventive immunization rate.
The user awareness ratio is represented in the Stock and Flow diagram below. This diagram
describes how we implement the user awareness.
•
Susceptible Computers: Computers that can be infected by a virus.
•
Infected Computers:
Computers that are infected by a virus.
•
Immune Computers:
Computers which are immune.
During the simulation, there are no new computers coming into the system. The
total number of computers is constant.
Total Computers = Susceptible Computers + Infected Computers + Immune
Computers
•
Immunization Rate: The rate at which computers become immune.

5
'Infected Computers'*Immunization/'Immunization Delay'
•
Immunization Delay: The average time to immunize one computer.
•
Infection Rate: Infection rate of the virus. It is based on the SIR model. We
have:
IF ('Susceptible Computers'>0) 'Susceptible Computers' *Infectivity*'Comp Contact
rate'*'Infected Computers' / 'Total Computers' ELSE 0
•
Infectivity: This parameter describes the efficiency of the virus. When an
infected computer come into contact with another one, there is a probability
of infecting the new machine.
'Virus type'*(1-'User Awareness Ratio') +(1-'Virus type')*(1-Diversification)
•
Virus Type:
Take into account that the Infectivity of a virus may depend on the
User Awareness (mail virus for example) while for others Diversification may
play be an important factor (virus that exploit security holes for example).
•
Comp Contact Rate:
Describe how many computers contacted per computer
per time period.
•
Countermeasure Efforts:
the different option that a user can take to fight a
threat. In this example, countermeasure is added for clarity because we have:
‘Countermeasure Efforts’ = ‘User Awareness Ratio’
•
Cleaning Rate: The rate at which the computers are cleaned (the virus is
remove but the computer can still be infected by the same virus again).
'Infected Computers'*Cleaning/'Cleaning Delay'
•
Cleaning Delay: Average time to clean a machine.
•
Cleaning: the percentage of the users that will use cleaning as a
countermeasure.
•
Diversification:
The percentage of users that choose to use another program, or
a different system.
•
Preventive Immunization Rate: The rate at which users immune their
machine. Only aware users will decide to immune their machine.
'Susceptible Computers'*('Preventive Immunization' +
Diversification ) / 'Immunization Delay'
•
Preventive Immunization:
The percentage of users that use anti-virus without
being infected. Those people will never get infected by this virus.
•
Immunization:
The percentage of users that use an anti-virus. The anti-virus is
applied with a certain delay. This delay takes into account the time it needs to
create the anti-virus.
DELAYINF ('Countermeasure Efforts'*'Immunization Ratio' ,'Antivirus Creation Delay',3,0)
6
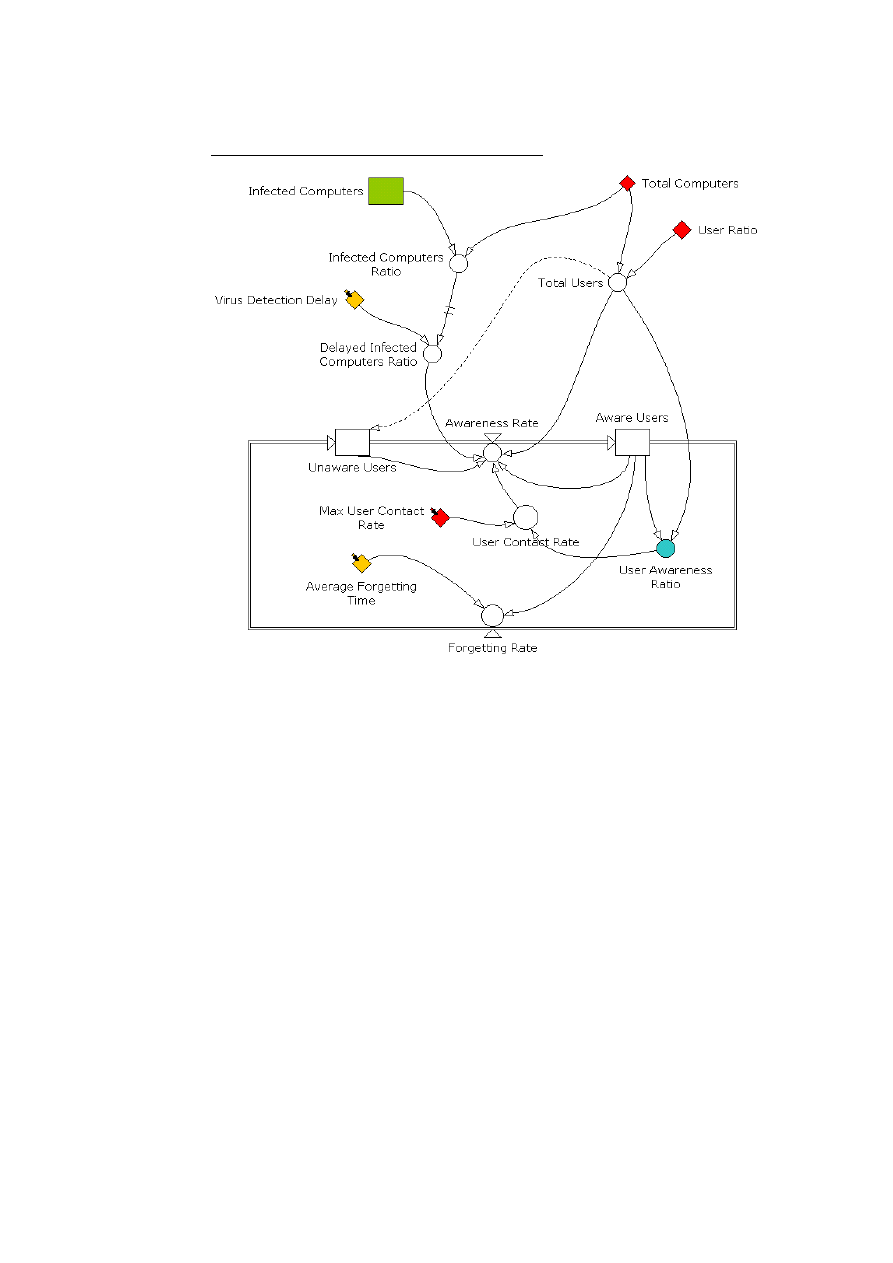
Stock and Flow diagram for the User Awareness
The user awareness consists of 2 stocks which are: Unaware users (UU), aware users (AU).
We have 2 flows which are: awareness rate (Ar), forgetting rate (Fr).
•
Forgetting rate (Fr): After some time of being aware users will tend to forget or
they do not pay any more attention to the threat. This is why we have included
this forgetting rate.
'Aware Users'/'Average Forgetting Time'
•
Awareness rate (Ar):
Unaware users will become more and more aware of the
threat as the number of infected computers is growing. We make the hypothesis that
we do not see the real infected computer ratio but there is a delay between the time
we perceive the threat and its actual state, in our model this is the delayed infected
computer ratio (dICR). The more infected computer the higher will be the awareness
rate.
IF ('Unaware Users'>0) 'Unaware Users'*'Delayed Infected Computers Ratio'*'User Contact
Rate'*'Aware Users'/'Total Users' ELSE 0
•
User contact rate: The user contact rate measures how many people are
contacted per person per time period. The higher this value the faster people will
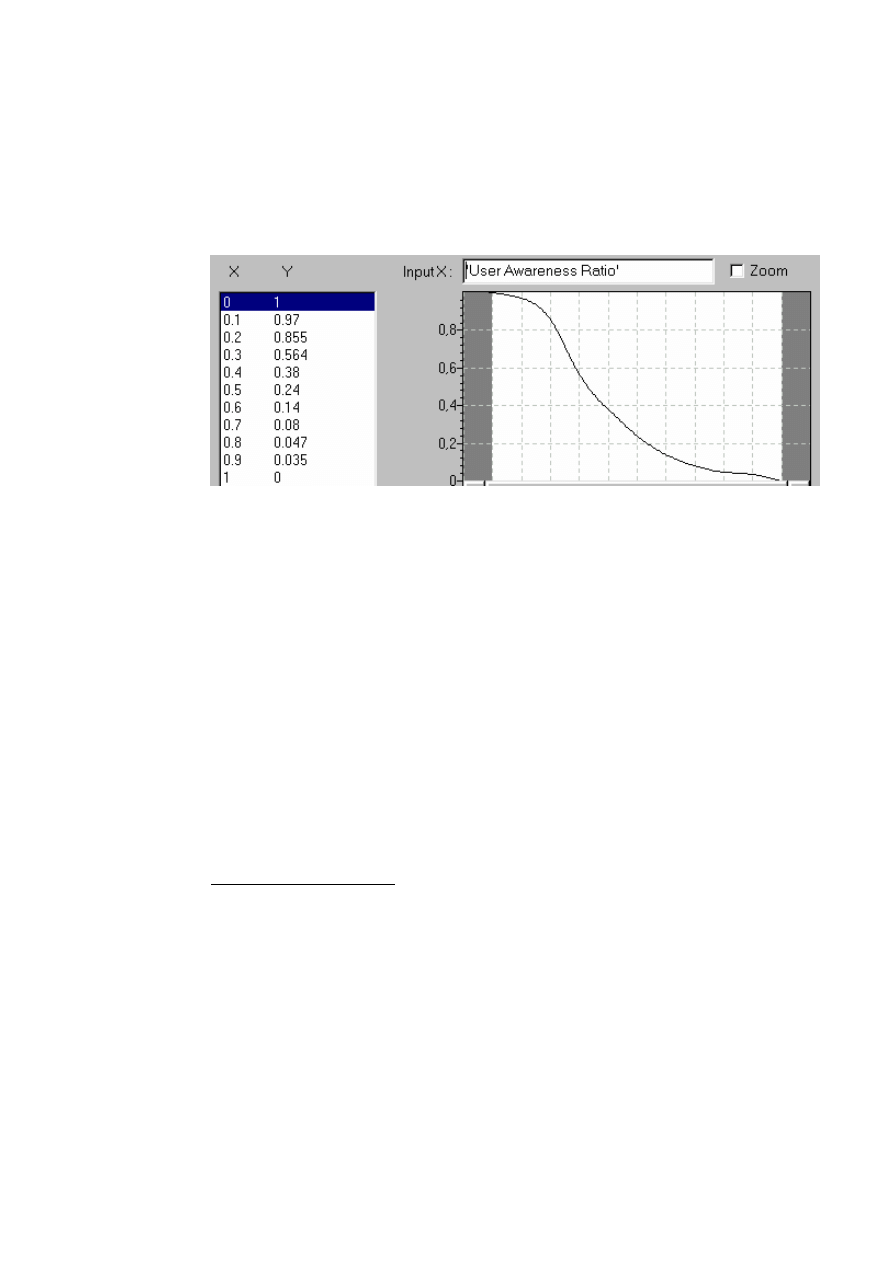
7
be aware of the threat. We do not consider this contact rate as a constant
because in the beginning of the threat people will tend to communicate a lot
about it but as time passes, the contact rate will decrease. For example, there is
almost no mail informing people about viruses that are more than 6 months. So
we have chosen to give the user contact rate this shape below. We have used
the ration of aware user because we consider that when people will stop alerting
other if they have done it a couple of time unless there is a new virus.
•
User Awareness Ratio: The ratio of users, aware of the threat over total
number of users.
'Aware Users'/'Total Users'
•
User Ratio: Number of users per computer. It is possible to have more users
than computers if we consider the user ratio as the average number of users
using one computer.
•
Virus detection delay: Time it takes to discover that there is a virus. The bigger
this delay, the longer time it will take a user (on average) to perceive the threat.
•
Delay Infected Computer Ratio: The delayed ratio of infected computers. After
some time the users will perceive that there is an infection.
DELAYINF('Infected Computers Ratio', 'Virus Detection Delay',2,0)
We use a second order time delay function.
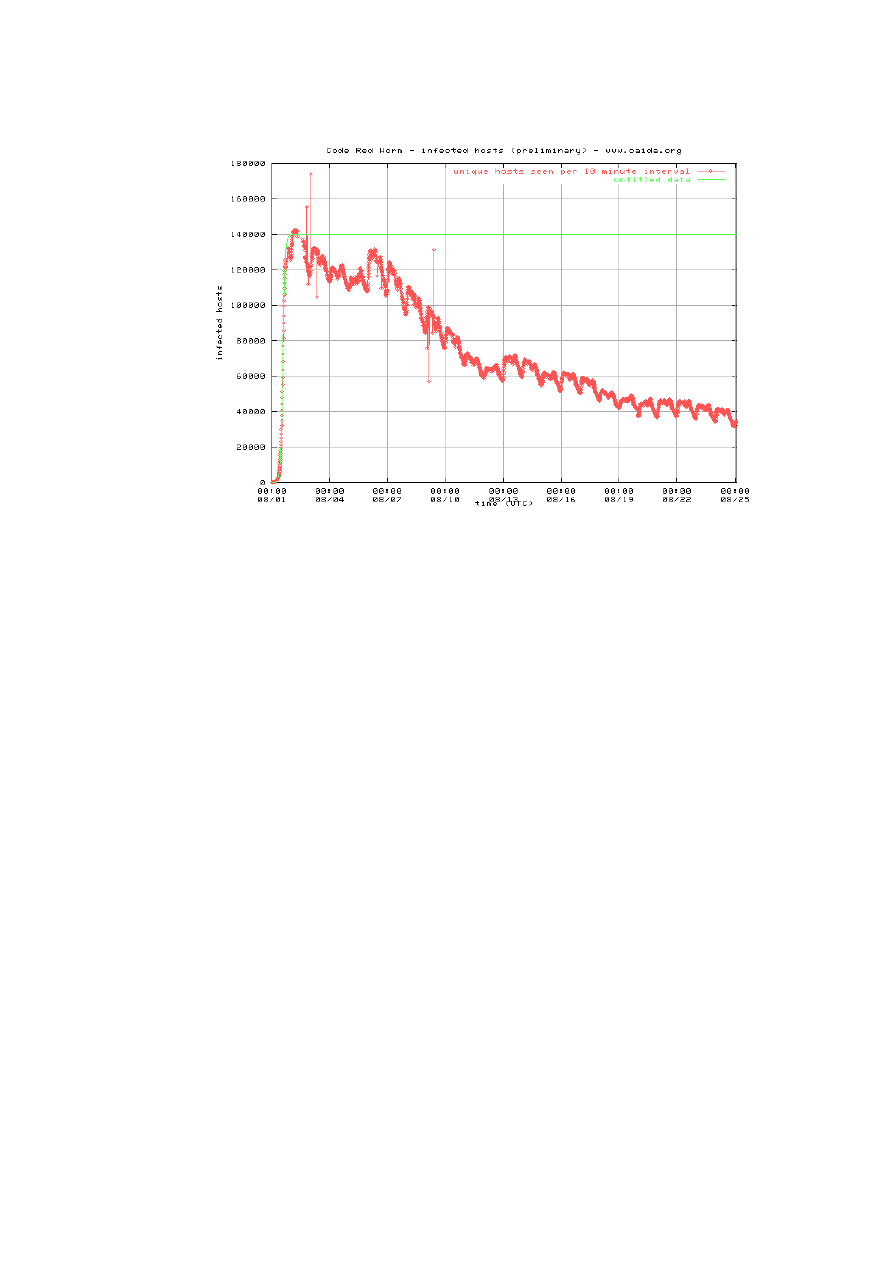
Code Red Worm Infection
8
This graph shows the propagation of the Code Red worms over a period of 25 days. We
notice that there is a strong increase in the number of infected computers, as people starts to
be aware of the virus, the infection rate decreases. This graph is taken from CAIDA
(www.caida.org).
This is the kind of behavior that we expect from our model also.
9
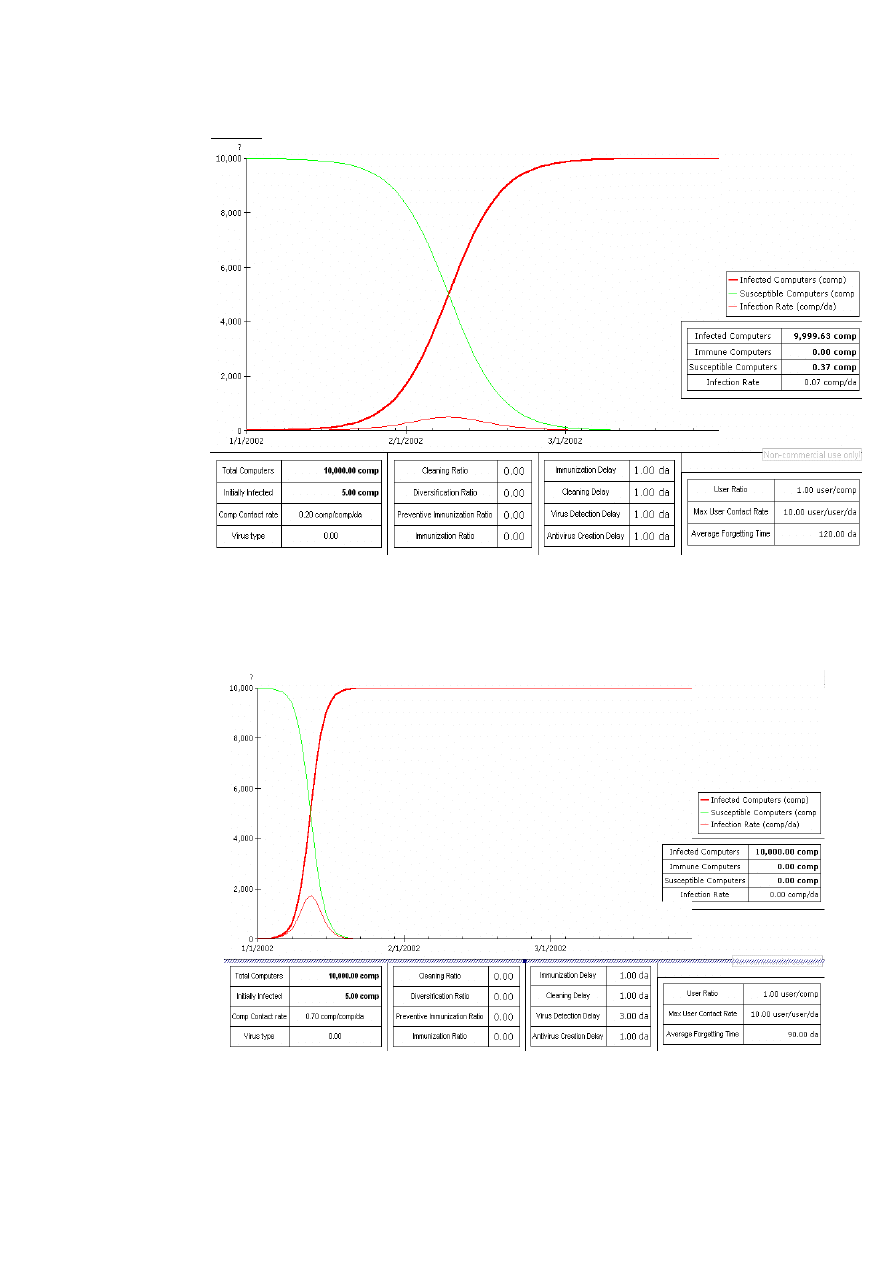
Results
In this graph we see the effect of having an immunization rate and a preventive immunization
rate that is always zero. After some time all the computers get infected. The infection rate will
rise until the number of susceptible computer goes below the number of infected computer.
We have the time period on the x-axis and the number of computer on the y-axis.
By increasing the contact rate, the infection propagates faster. High contact rate will be the
characteristic of viruses that used mass mail to propagate.
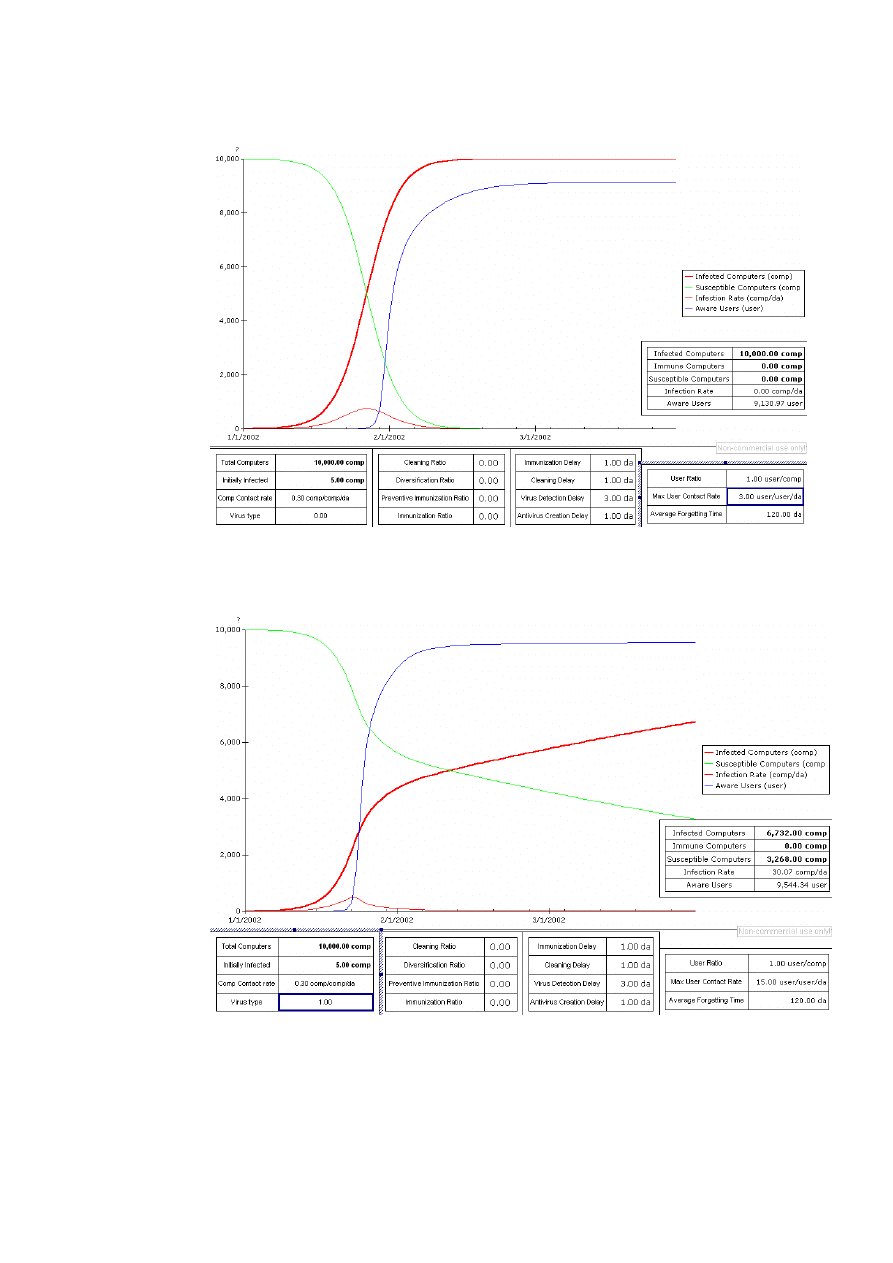
10
The blue curve represents the user awareness. It is influenced by the Max User Contact Rate,
the Average Forgetting Time & the Virus detection Delay.
User Awareness can prevent the infection rate to get too high. This example was run without
immunization. So if people are aware and stay aware they can prevent some type of viruses to
propagate too fast. This can give time to create a “vaccine”.
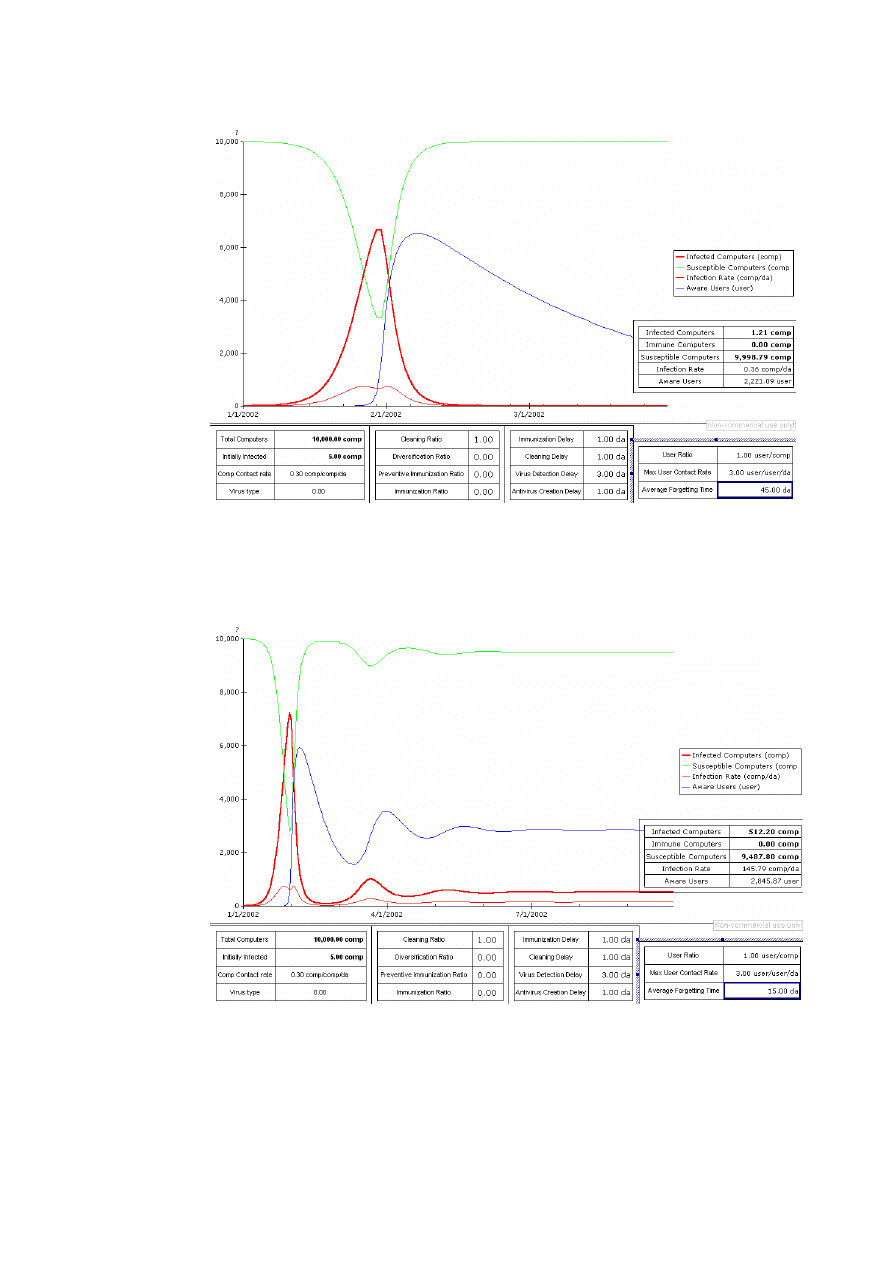
11
In some cases, where the average forgetting time is not too low and where people only clean
their computers, it is possible to eradicate the infection. But the cleaning delay must be quite
small, here it is 1 day. That means users should clean their computer every day. However if
the contact rate is higher, it might not be possible to get the number infection computers to
zero.
Using only cleaning may induce oscillations in the number of infected computers. This is due
to the fact that by cleaning the number of infected computer is not reduced completely to zero,
but to a very small number, which over time will create a new infection. The amplitude of the
oscillation will decrease over time, because people are already aware of the virus, so that they
can act in time to clean.
12
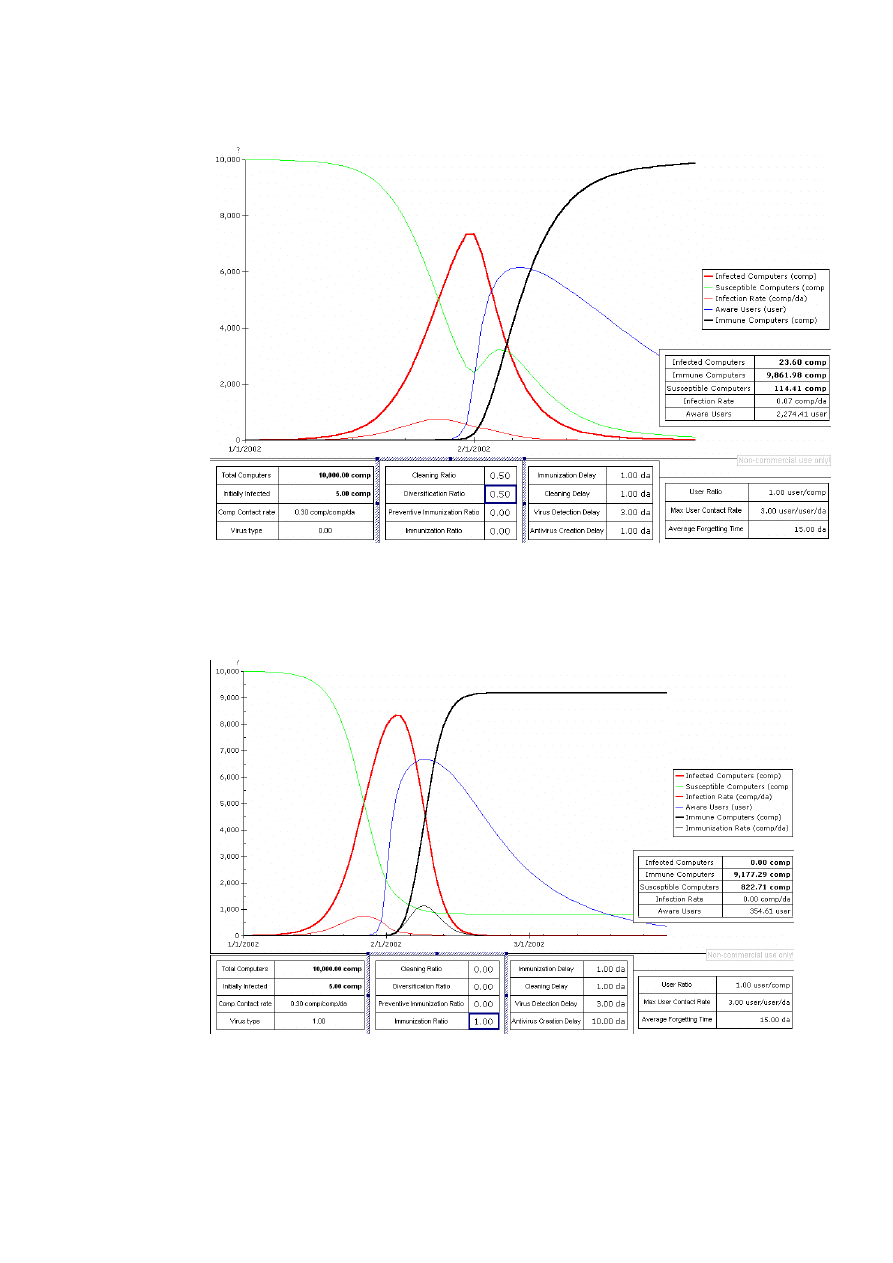
Diversification combine with Cleaning can eradicate the threat also. We remind that an
immune computer cannot be infected again by the same virus.
If we use immunization, which means an anti-virus, we can eradicate the infection but we
need to implement the immunization in good time otherwise the virus may have time to
propagate and infect many computers.
13
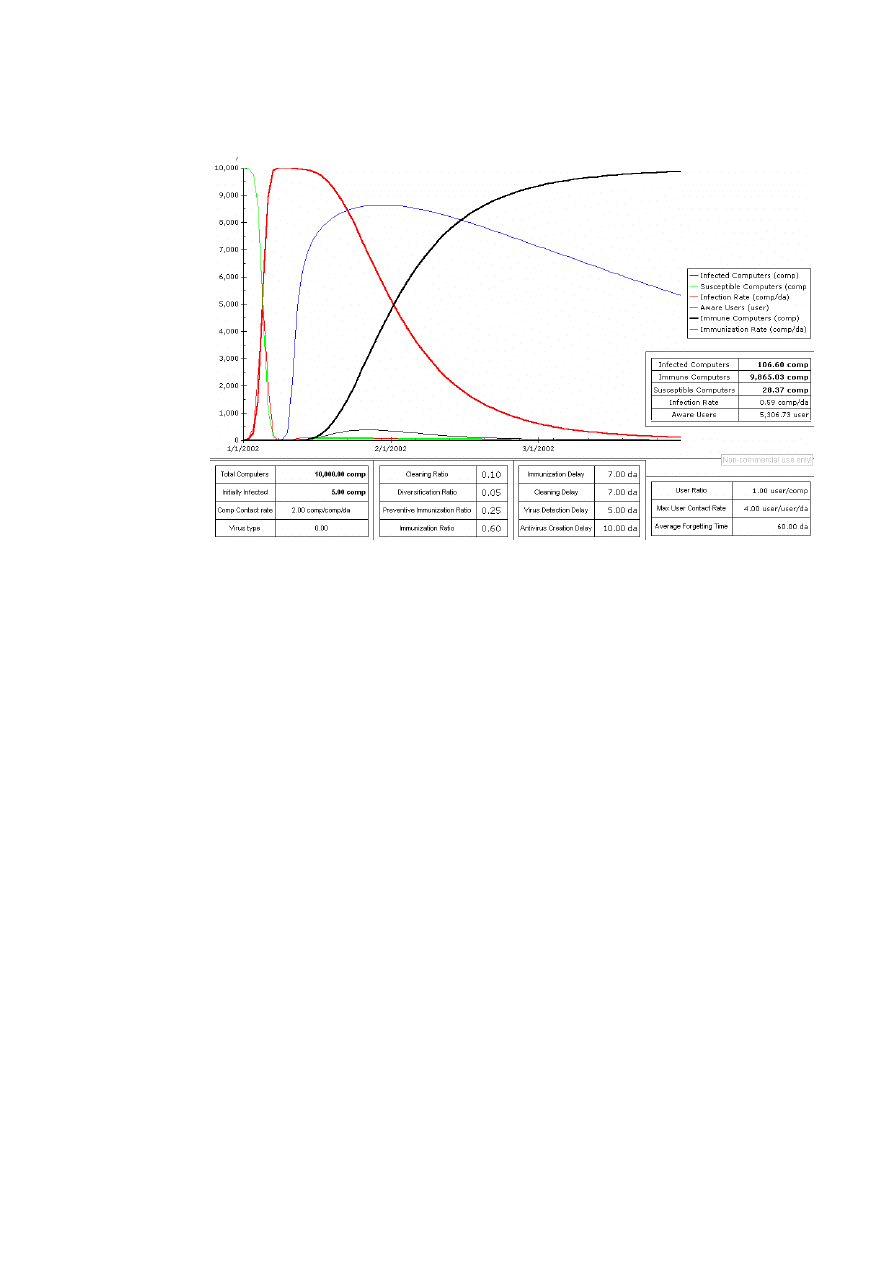
With this simulation result we have tried to fit the “Code Red worm” shows previously. For
this behavior to occur we need a high contact rate and at the same time we need users to
immune their machine with an anti-virus program in order to decrease the number of infected
computers. If we decrease the contact rate by using diversification, we may prevent this kind
of abrupt increase in the number of infected computers.
14
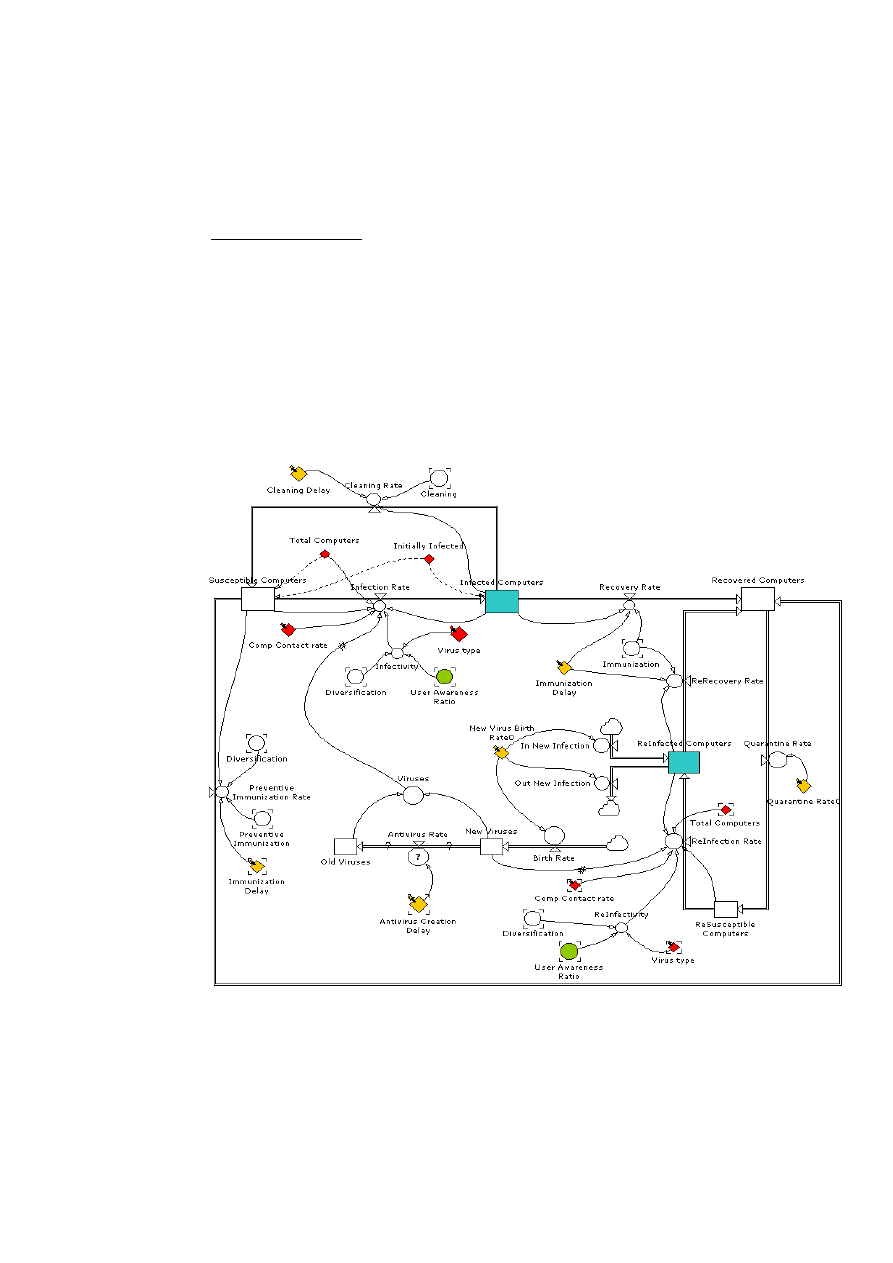
2. Case study for N virus (with N greater than 1)
In the case of N viruses, things become more complicated to model.
Working hypothesizes
•
When a computer is infected, it stays immune for a period of time which depends on
the average arrival of time of new viruses. After this time computers that were
immune will become susceptible to be infected. The main problem results in the fact
that an infected computer cannot be infected again by the same virus but at the same
time it is possible to find computer that are infected by an old virus and other that are
infected by a new virus. So we see the need to have at least two separate flows if we
want to allow two kind of virus to be present during a period of time.
•
We suppose that old viruses disappear after a certain period of time. Which means
that they won’t be able to create an epidemic again.
In this diagram we have tried to extend the system for N viruses but problems arise when we
want to use PowerSim. First to introduce a new virus in the system we need to take into
consideration the fact that old infected computer exist. Those old infected computers cannot
propagate on new computers because those new computers have an anti-virus program. But at
the same time we cannot remove those old computers because the old viruses can still
propagate at the same time as the new one.

15
Discussion
Those graphs reveal two main points. User awareness is a key factor for virus propagation.
The more people are aware the lower will be the infection rate. For example, if people pay
attention before opening attachment, some viruses may not propagate so fast.
We have also seen that diversification can be an important factor to prevent infection because
viruses will be confined in a smaller group of machine which means that the infection rate
will be lower.,
Wyszukiwarka
Podobne podstrony:
Some human dimensions of computer virus creation and infection
Clinical Manifestations of Hepatitis C Virus Infection
Engle And Lange Predicting Vnet A Model Of The Dynamics Of Market Depth
Formal Affordance based Models of Computer Virus Reproduction
A software authentication system for the prevention of computer viruses
The impact of Microsoft Windows infection vectors on IP network traffic patterns
The Virtual Artaud Computer Virus as Performance Art
RODZAJE KOMPUTERÓW (THE KINDS OF COMPUTERS) 2
Quantitative risk assessment of computer virus attacks on computer networks
The Dynamics of Organizational Identity 2002
Email networks and the spread of computer viruses
The pathogenesis of Sh flexneri infection lessons from in vitro and in vivo studies
The Impact of Countermeasure Spreading on the Prevalence of Computer Viruses
A Computational Model of Computer Virus Propagation
The Legislative Response to the Evolution of Computer Viruses
The Impact of Countermeasure Propagation on the Prevalence of Computer Viruses
The ABC of computer security
A unified prediction of computer virus spread in connected networks
Metaphor and the Dynamics of Knowledge
więcej podobnych podstron