
Shock Waves (2002) 11: 385–392
An investigation of shock induced temperature rise
and melting of bismuth using high-speed optical pyrometry
D. Partouche-Sebban
1
, D. B. Holtkamp
2
, J.L. P´elissier
1
, J. Taboury
3
, A. Rouyer
1
1
Commissariat `a l’Energie Atomique, BP12, 91680 Bruy`eres Le Chˆatel, France
2
Los Alamos National Laboratory, Los Alamos, NM 87545, USA
3
Institut d’Optique Th´eorique et Appliqu´ee, BP 147, 91403 Orsay, France
Received 10 June 2001 / Accepted 31 October 2001
Abstract. Temperature is a basic parameter in physics, but in the case of shock-compressed metals its
measurement remains difficult and controversial. Improvements in accuracy of a high-speed optical pyrom-
eter enabled us to study interestingfeatures of bismuth: temperatures of shock-loaded samples measured
through a lithium-fluoride anvil and (indirectly) part of the fusion curve. An improved method of analyzing
optical pyrometry data is also discussed.
Key words: Temperature, Bismuth, Emissivity, Pyrometry, Shock, Melting
1 Introduction
Temperature is almost absent in most hydrodynamics
problems: for instance, it does not explicitly appear in the
well-known Rankine-Hugoniot equations (see Zeldovich
andRaizer 1967) which govern shock-wave propagation
inside matter. In particular, temperature measurements of
shock-loaded metals remain rather rare up to now, as ob-
taining temperature in such experiments raises several is-
sues (cf. for example Nellis andYoo 1990; Tan andAhrens
1990; McQueen andIsaak 1990 andtheir references).
The short duration (1 µs or less) of phenomena under
study generally limits the diagnostic approach to optical
methods exclusively. For example in the present work, ex-
periments were performedwith an eight-channel optical
pyrometer (spanning the 0.4 to 4 µm wavelength range).
The light is guided by optical fibers from the shock-heated
surface to the detectors. For opaque media like metals, the
surface observedby a pyrometer remains at the Hugoniot
temperature for at most a few ps (Zeldovich and Raizer
1967, p. 771). This duration is much shorter than the time
resolution of our pyrometer (a few ns). Consequently, with
the present state of the art, one can only measure the tem-
perature of a metal either directly from its free surface or,
in order to inhibit the full pressure unloading of the sam-
ple, through a transparent anvil.
In the case of bismuth, the free-surface temperature
was studied a few years ago over a wide range of dynamic
Correspondence to: D. Partouche-Sebban
(e-mail: david.partouche@cea.fr)
excitation pressures (Mondot 1993). Then preliminary ex-
periments (Blanco 1997; Blanco et al. 1999) have been
performed with lithium-fluoride windows, but the corre-
sponding results were not completely satisfying for two
reasons:
– the observedsignals didnot always exhibit a reason-
able time dependence (a flat “plateau” as long as no
release wave reaches the bismuth-LiF interface) as ex-
pected, andas obtainedon free-surface experiments
(Mondot 1993)
– the induced temperatures were substantially higher,
particularly at low shock pressures when comparedto
those predicted by a subsequent calculation (Wetta
andP´elissier 2001). On the contrary, for free-surface
temperatures theoretical andexperimental results
were in goodagreement andwere corroboratedby the
experimental investigation of two other phenomena:
matter ejection andvariation of surface reflectivity
(Elias et al. 1988; Mondot 1993).
So we have undertaken the present work in order to
clarify the situation. A first experiment, carriedout with
the experimental configuration described by Blanco (1997)
andBlanco et al. (1999), enabledus to identify proba-
ble sources of optical contamination andto improve the
design (see Sect. 3). Then, with the modified set-up, we
have studied the solid-liquid coexistence region of bismuth
(Sect. 4). The experiment is described below (Sect. 2), but
more information can be foundin previous works (Nellis
andYoo 1990; Bass et al. 1990; Blanco 1997; Blanco et al.
1999).
386
D. Partouche-Sebban et al.: An investigation of shock induced temperature rise and melting of bismuth
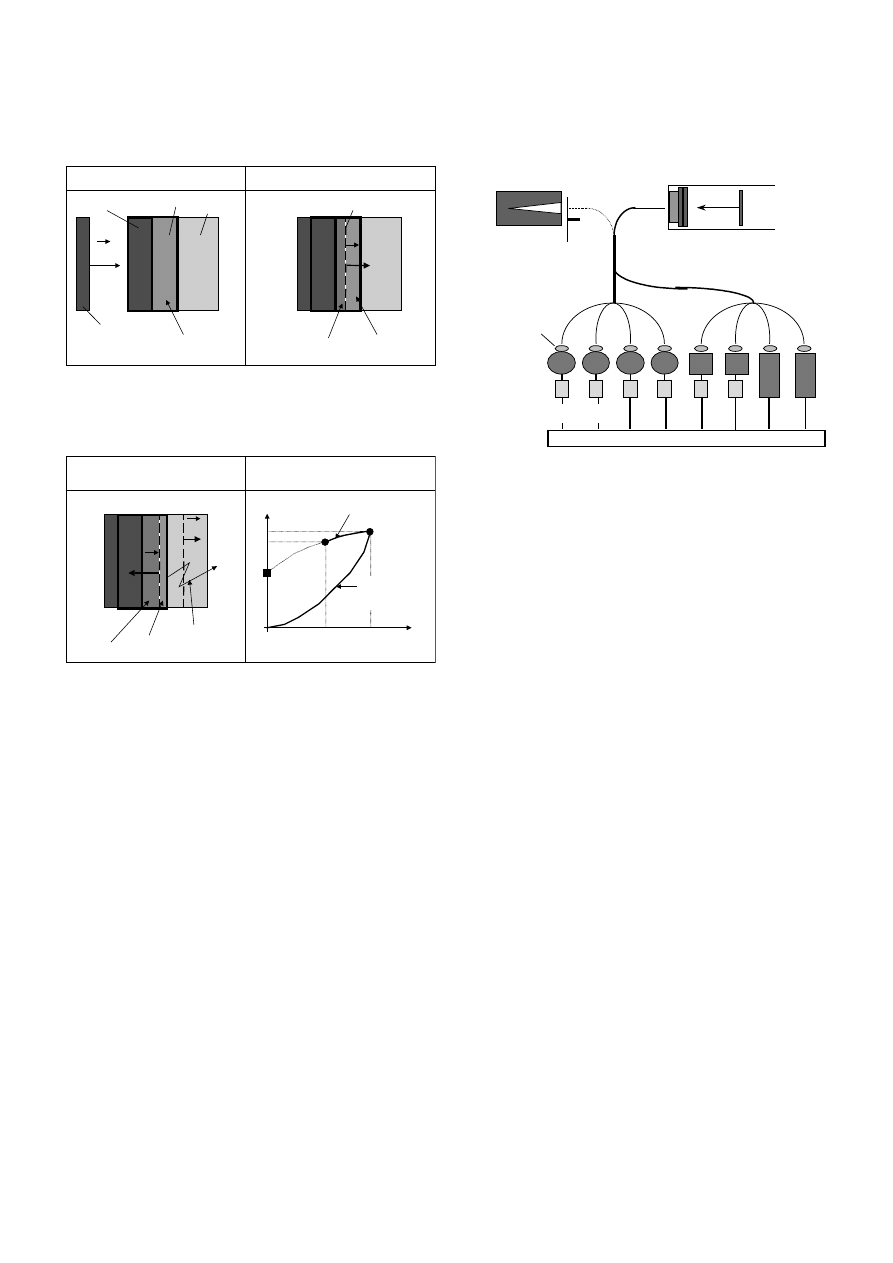
Projectile
Before impact
After impact
(p
H
,T
H
)
(p
0
,T
0
)
Shockwave
Vp
Target
Transmitter
(p
0
,T
0
)
Anvil
D
1
Fig. 1. The beginning of the experiment: (p
0
, T
0
) and (p
H
, T
H
)
are respectively the initial and Hugoniot states; and D
1
repre-
sents the shock wave velocity in the target
After shock reflection
on the sample-LiF interface
The experiment in the
(pressure,temperature) diagram
p
T
T
H
p
H
p
0
T
i
Isentropic
release
p
i
Hugoniot
curve
T
fs
(p
H
,T
H
)
(p
i
,T
i
)
D
2
D
3
Emitted
light
T
0
Fig. 2. The end of the experiment: (p
i
,T
i
) is the interface state
and T
fs
is the free-surface temperature; D
2
and D
3
represent
shock-wave or release-wave velocities
2 Description of experiment
2.1 Principle
The experiment geometry is illustratedin Fig. 1. After
impact of copper flyer, the induced shock wave trav-
els through the copper transmitter plate, andis succes-
sively transmittedto the bismuth sample plate andto
the lithium-fluoride window. As soon as the shock reaches
the bismuth-window interface, thermal radiation is emit-
tedanddetectedby the pyrometer (see Fig. 2).
Lithium fluoride (LiF) is often chosen as window for
two reasons:
– the temperature of LiF does not rise significantly un-
der shock loading (Tan and Ahrens 1990); therefore,
the corresponding optical radiance remains negligible
comparedto the sample radiance
– LiF remains transparent in the visible spectrum up to
160 GPa shock pressure (Wise andChhabildas 1986).
The metal target andLiF anvil are optically polished
andgluedtogether to minimize interface effects (Urtiew
andGrover 1974). The glue layer (Loctite
r
358) is less
than 10 µm thick. The glue remains transparent over the
Blackbody + chopper
Experimental target assembly
Optical fiber bundle
Lenses &
filters
Detectors
Amplifiers
Data acquisition system
Vp
InSb
Ge
PMT
HgCdTe
Fig. 3. Schematic diagram of the eight channel optical pyrom-
eter
investigatedpressure range andits emission can be ne-
glected, as verified experimentally (H´ereil andMabire
2000). Another solution, which we did not employ in the
present work, is to add on the window a vapour-deposited
film of the studied metal, the thickness of which is typi-
cally 10 µm (Nellis andYoo 1990; Bass et al. 1990).
In our experiments, we used a 60 mm diameter powder-
gun to launch the projectile. The velocity was measured
with Doppler Laser Interferometry (DLI) over a range be-
tween a few hundreds m · s
−1
and1500 m · s
−1
.
2.2 Pyrometer
A schematic of the pyrometer is shown in Fig. 3. The py-
rometer has eight channels spanning a range of wavelength
from 0.4 to 4 µm. All eight channels are coupledback to
the experiment by means of an optical fiber bundle (six
200 µm diameter fluoride glass IR fibers and two 550 µm
diameter visible fibers). The light from these fibers is fo-
cusedonto each IR detector element with ZnSe lenses and
restrictedto the selectedwavelength by optical passband
filters. The photomultiplier channels do not need lenses
because of their photocathode size.
Four of the detectors (HgCdTe and InSb) are liquid-
nitrogen cooled, while the remaining channels (Ge and
photomultiplier tubes) are operatedat room tempera-
ture. InSb, HgCdTe and Ge detector signals are amplified
through custom-built preamplifiers (100 MHz frequency
bandwidth for InSb and HgCdTe channels and 1 GHz for
Ge channel). PM tubes do not needamplifiers andtheir
frequency bandwidth is about 1 GHz.
Recording of the pyrometry data is performed with
standard digital oscilloscopes. We use three gain ranges
(sometimes four) for each detector to avoid digitization
noise andto assure that they were always on scale even for
large amplitudes (especially for the photomultiplier chan-
nels). The recording system (cables and oscilloscopes) has
been time-calibratedwith a pulse generator: synchrone
pulses were generatedin the eight input cables. When

D. Partouche-Sebban et al.: An investigation of shock induced temperature rise and melting of bismuth
387
the characteristics of detectors and amplifiers (rise times
andtransit times) are taken into account, this calibration
shows that cross timing between the different pyrometer
channels is about 2 ns.
Before the experiment, the first step is to calibrate the
pyrometer with a blackbody source to obtain the relation
between measuredvoltage andradiance for each channel
of the pyrometer. Blackbody radiance is calculated from
the selectedtemperature, the source emissivity (0.99) and
the wavelength dependence of each channel of the pyrom-
eter. At this stage, the blackbody is mechanically chopped
at 10 kHz to be compatible with the amplifier bandwidths.
Portable calibratedpyrometers are usedto verify that the
blackbody source is at the specifiedtemperature anduni-
form over the area of interest.
After the experiment, detector voltages and uncertain-
ties are processed, using the previous calibration, to pro-
duce the experimental radiances with their respective ac-
curacies.
2.3 Pyrometry data analysis
Planck’s law gives the spectral radiance of an ideal black-
body radiator and is used to calculate the temperature.
This expression (Eq. 1) is a function of wavelength (λ)
andtemperature (T ) (C
1
and C
2
are respectively the first
andsecondradiation constants):
L
0
(λ, T ) =
C
1
· λ
−5
exp
C
2
λ·T
− 1
(1)
For each experiment, we measure the N experimental
radiances (L
i
(λ, T ), i = 1 to N) corresponding to each
pyrometer wavelength range. The N relations between the
temperature T , the emissivities ε
i
andthe experimental
radiances L
i
(λ, T ) come from integration of Planck’s law
over the passbandof each channel (Eq. 2):
L
i
(λ, T ) =
∆λ
i
ε
i
· L
0
(λ, T ) · dλ (for i = 1toN)
(2)
Thus, we have N measurements with N + 1 unknowns
(N emissivities plus temperature) andmore information
is required. Many methods have been tried to solve this
problem, for example by adding an equation that con-
strains the relative variation of emissivity versus wave-
length. In particular, the greybody approximation is of-
ten used, i.e. emissivity is assumed to be almost the same
for two or more different channels. However, since a grey-
body calculation is very sensitive to the real wavelength
dependence of the emissivity (even for small dependence),
it frequently results in erroneous temperature values. Fur-
thermore, in case of optical contamination from other ra-
diance sources, which can easily appear in shock experi-
ments, such a calculation becomes largely inappropriate.
We have developeda robust method(Blanco 1997;
Blanco et al. 1999 andPartouche-Sebban et al. 2001) fol-
lowing the suggestion of Herv´e (Herv´e et al. 1990). Our
methodassumes two reasonable hypotheses: (a) that the
radiances of all channels of the pyrometer are described
by a single temperature (andassociateduncertainty), al-
though the emissivity of each channel may be different (as
it depends on wavelength); and (b) that the emissivity of
each channel is constrainedby an upper boundandlower
boundthat is derivedfrom physical information about the
material. The constraints on the emissivities provide ad-
ditional 2N constraints that make it possible to obtain a
single experimental temperature in a physically reason-
able way with associateduncertainties that have physical
significance.
The upper boundon the emissivity is usually assumed
to be 1 (i.e. a blackbody). For shocked surfaces, the lower
boundis taken to be the static emissivity (i.e. the initial
value of emissivity at p
0
and T
0
) of the material in the
same wavelength range as this pyrometer channel. The
static emissivity, ε
S
, is a goodlower boundbecause emis-
sivity increases with degradation of the surface state, often
with material phase transitions (andin particular melting,
see Lange andSchenck 1968) andgenerally with increas-
ing temperature (depending on material and wavelength;
see Touloukian andDeWitt 1970). Part or all of these
phenomena appear in shock heating experiments.
The driving force in the analysis, as a consequence
of Eqs. (1) and(2), is the fact that the temperature is
most strongly constrainedby the shortest wavelength (i.e.
“bluest”) pyrometer channels that have detectable levels
of radiance signal. For the “bluer” channels, the tempera-
ture can be determined quite accurately even when there
are large uncertainties in the radiance (or large uncertain-
ties in the emissivity). Correspondingly, it is very difficult
to obtain accurate temperatures at longer wavelengths
without precise knowledge of the emissivity.
The temperature calculation includes :
– only channels that have detectable energy from the
surface to be studied.
– radiance and its uncertainty for each channel (radiance
uncertainty depends on the measurement noise level
andthe calibration uncertainty).
– constraints on the emissivity for each channel, using
the static emissivity as the lower boundandthe emis-
sivity of a perfect blackbody (ε = 1) as the upper
bound.
This calculation assumes that there is a single tem-
perature (plus associateduncertainty) that produces the
observedradiances in all pyrometer channels. The inter-
section of allowed temperature bands from the different
channels provides the range of possible temperatures. The
most precise temperature measurements using this tech-
nique are obtainedwhen emissivity is strongly wavelength
dependent. Usually, in case of metals, the minimum over-
all temperature allowedby the measuredradiances is con-
strainedby the minimum temperature limit of the bluest
channel (with ε = 1). Andthe maximum allowedtemper-
ature is usually that maximum allowedby the minimum
emissivity constraint of one of the bluer channels.
Once a temperature band has been determined, one
can deduce values for the dynamic emissivity as a func-
388
D. Partouche-Sebban et al.: An investigation of shock induced temperature rise and melting of bismuth
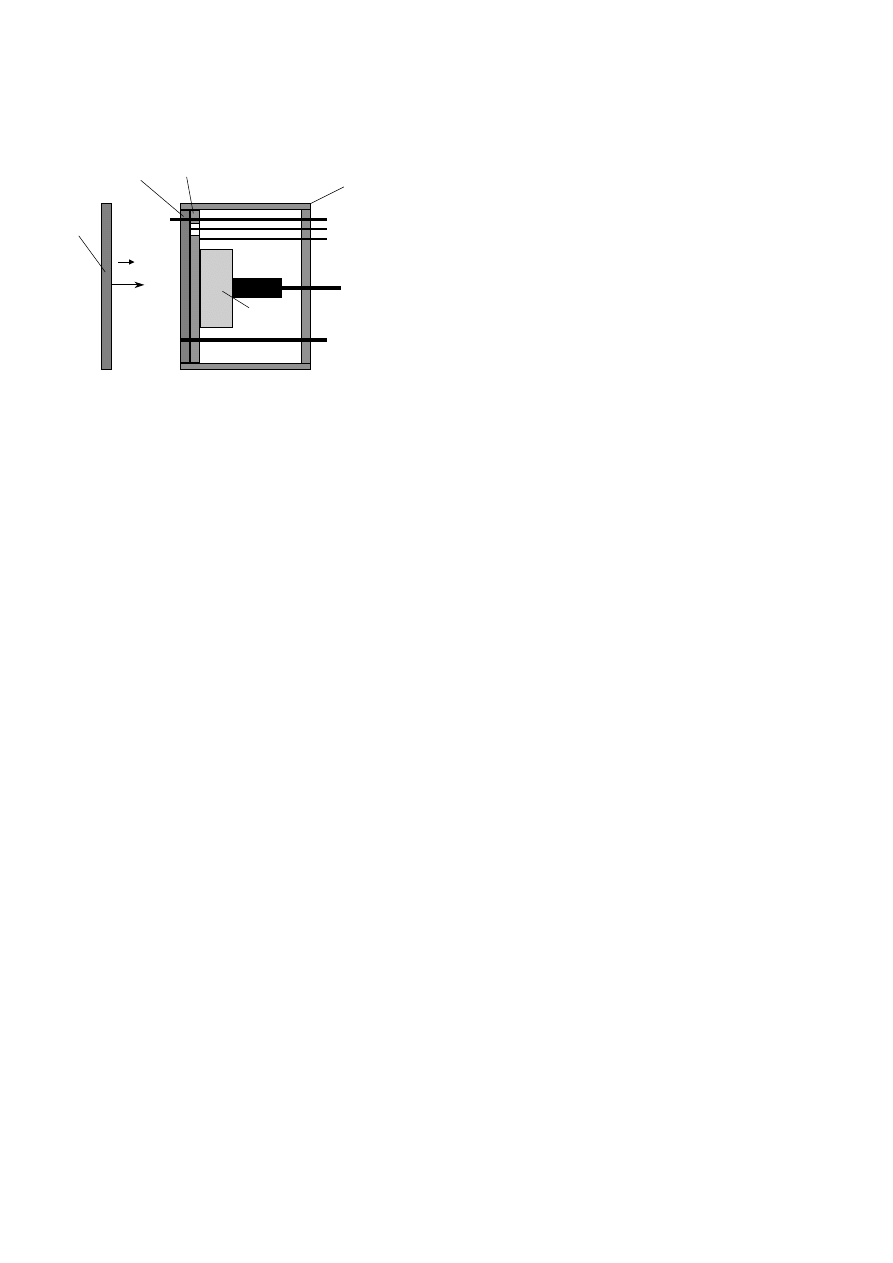
Transmitter
Target metal
8 timing pins
DLI probe
(flyer plate velocity)
(2)
(3)
(3)
Transparent
anvil
Pyrometer
fiber bundle
Wall
Flyer
plate
Vp
Fig. 4. Schematic diagram of initial experimental apparatus
tion of wavelength for each pyrometer channel. These val-
ues are not single values for each wavelength. They are
bands of allowed emissivities that can produce the band
of allowedtemperature andthe experimental radiances
(with included radiance errors) for each channel.
In case of bismuth, the static emissivity of the polished
target (deduced from reflectivity measurements, through
an integrating sphere, at room temperature) is typically
higher than 0.3 in the 300–1800 nm wavelength range and
higher than 0.2 in the 1800–3500 nm range. So we decided
to choose 0.1 as a conservative lower boundof the dynamic
emissivity in all data processing in the present paper.
3 Reduction of optical contamination
(first and second experiments)
According to calculations (Wetta and P´elissier 2001),
when the incident shock pressure is between 14 and
28 GPa, bismuth releasing against a LiF window enters its
solid-liquid coexistence region and the interface tempera-
ture becomes less sensitive to shock intensity. For this rea-
son a first experiment was performednear p
H
= 24 GPa,
where the interface temperature T
i
was expectedto be
about 1500 K.
The experimental apparatus for the first experiment
is shown schematically in Fig. 4, andis similar to the one
usedpreviously (Blanco 1997; Blanco et al. 1999). Be-
sides the DLI measurement of the flyer velocity, ferroelec-
tric pins are usedfor triggering andtiming. The copper
flyer was either 3 or 5 mm thick andthe copper trans-
mitter was either 2 or 3 mm thick. The bismuth sample
andthe LiF anvil thicknesses were always 3 and10 mm
respectively. The diameters of copper projectile, copper
transmitter, bismuth target and lithium fluoride window
are respectively 58 mm, 66 mm, 66 mm and40 mm.
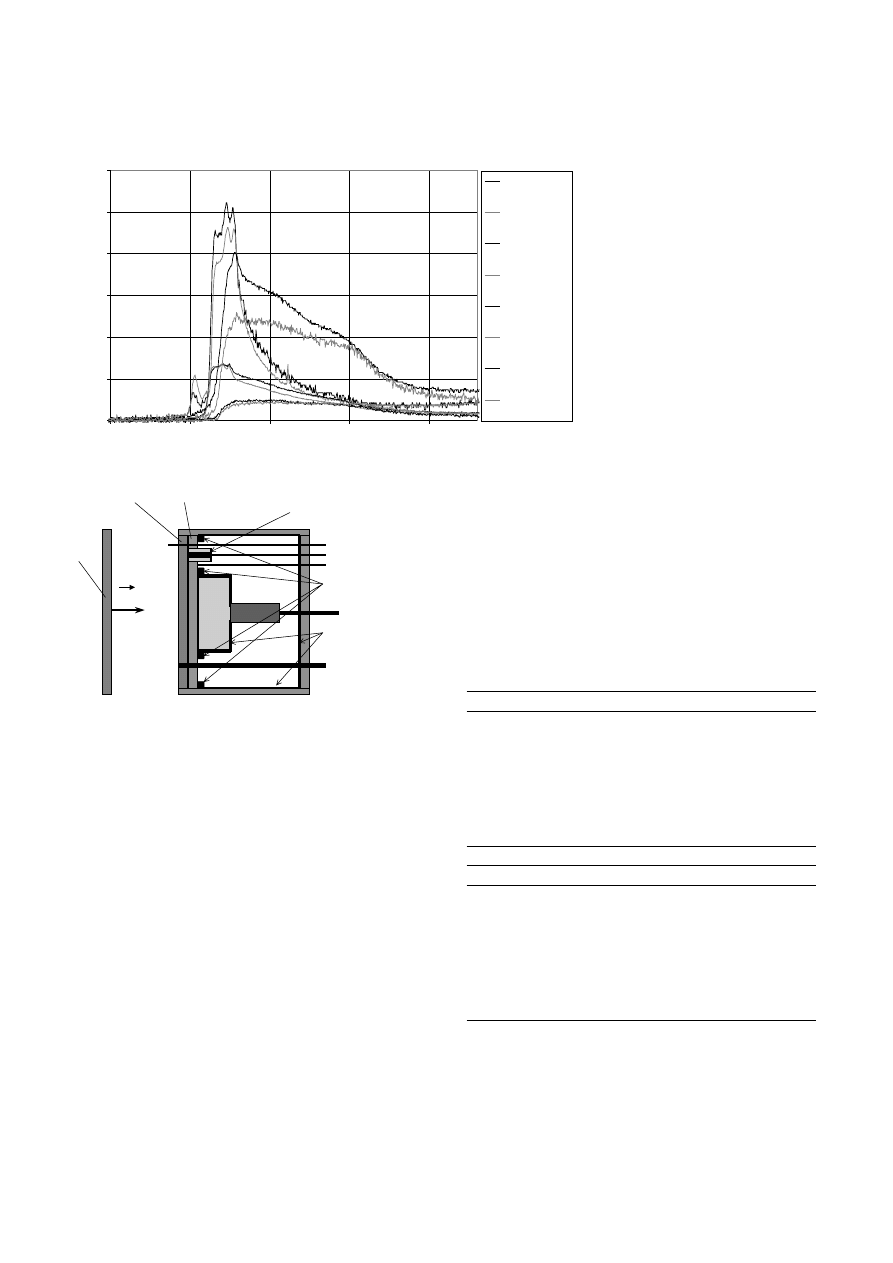
Experiment #1 provided data with significant prob-
lems (see Fig. 5): first, the shape of the detector traces
were qualitatively different for each wavelength channel
andfew of them exhibitedconstant radiances over the
constant pressure interval (∼ 1 µs). Secondly, the radi-
ances of the visible channels (PM tubes) were very high,
implying very high temperatures (T ∼ 2400 K). Finally,
andperhaps most tellingly, the apparent shock breakout
times among the various channels differed as a function
of wavelength. In particular, the visible channels begin to
grow in amplitude almost 200 ns before the redder wave-
length channels.
All these observations ledus to conclude that these
measurements were likely contaminatedby a bright opti-
cal background(mainly in the visible andnear infrared)
that arose from sources external to the LiF-bismuth sam-
ple interface. As a result, we added different features to
the secondexperiment to reduce the coupling of exter-
nal light into the optical pyrometer system (see Fig. 6).
The first modification was to apply a suspension of black
graphite to the exterior surface of the LiF anvil to prevent
light external to the target surface from entering the py-
rometer fiber bundle. Blackening was also applied to most
of the inner metal surfaces of the assembly surrounding
the LiF anvil. A clear region, tailoredto the physical di-
ameter of the fiber bundle, was left open for pyrometry
on the outer surface of the LiF anvil. The secondmodifi-
cation was motivatedby experience with jetting near the
corners of shock-loaded metal joints: black modeling clay
was put on the corners andplastic tubes were put around
some of the ferroelectric pins to help to attenuate jet light
contribution.
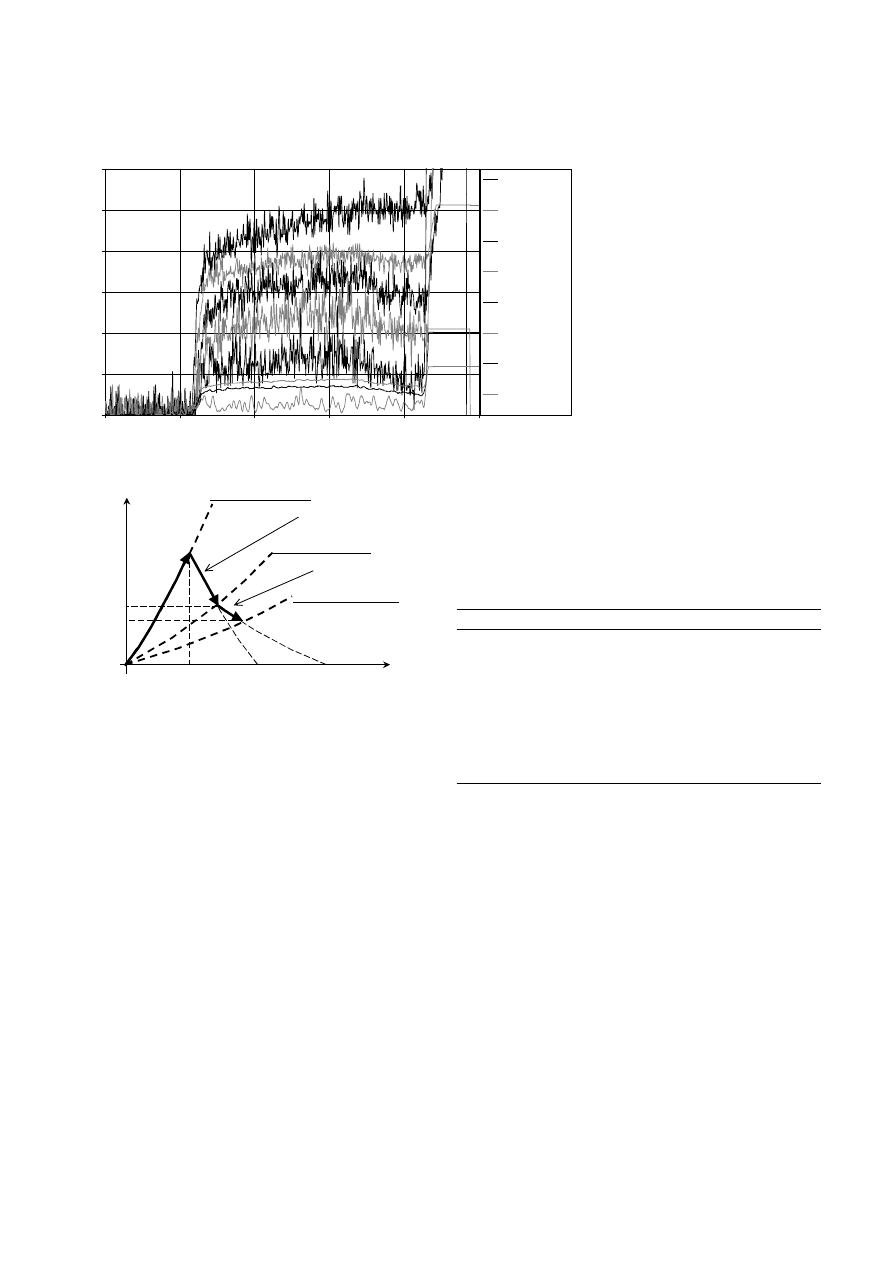
Experiment #2 provided more satisfying data than the
first. Note that the radiances are essentially flat for about
1.5 µs (see Fig. 7). The bluest channel (550 nm in wave-
length) is barely visible above baseline, as comparedto
being several volts in the first experiment. Perhaps most
importantly, the bluer wavelength channels show basically
exactly the same shape versus time as the redder wave-
length channels. The shock-breakout times among the
channels are the same within 10-20 ns, which is consistent
with the relative delays in the recording triggers among
the oscilloscopes, with delays in the detector amplifiers,
etc.
The experimental temperature appears to rise some-
what during the shock propagation in the anvil. Fur-
ther experiments exploring this question are plannedand
will be reportedin due course. A straightforwardcalcu-
lation shows that release waves coming back from the
sabot-flyer interface reach bismuth-window interface be-
yond4.6 µs, inducing in the metal a slight progressive
temperature decrease which is visible in Fig. 7. At the end
of the experiment, near 5.2 µs the shock wave breaks out
of the transparent anvil anda high level of light is pro-
duced. We calculated the interface temperature from the
data collectedbetween 3.7 and3.9 µs, i.e. just after the
time when the shock reaches the bismuth external sur-
face. The corresponding temperature is T = 1646 ± 157 K
to be rounded off to T = 1650 ± 160 K (projectile ve-
locity V
p
= 1430 ± 61 m · s
−1
). Table 1 gives further
details about pyrometry data analysis. Experiment #2
yields a much lower temperature than experiment #1
(T ∼ 2400 K, V
p
∼ 1400 m · s
−1
) which reproduces the re-
sults of previous works rather well (Blanco 1997; Blanco
et al. 1999). These earlier results were almost certainly
D. Partouche-Sebban et al.: An investigation of shock induced temperature rise and melting of bismuth
389
0
500
1000
1500
2000
2500
3000
3.0
3.5
4.0
4.5
5.0
Time (
µ
s)
V
o
lt
age (
m
V
)
0.69-0.73 µm
(/2)
0.31-0.63 µm
(*1.33)
1.08-2.12 µm
(*2)
2.05-2.60 µm
(*2.66)
1.08-1.55 µm
(*3)
1.19-1.71 µm
(*2.33)
2.07-3.03 µm
3.04-3.98 µm
Fig. 5. Experiment #1 pyrometry
data
Transmitter
Target metal
Modeling clay
Adhesive colloïdal
graphite
Plastic tubes
Flyer
plate
Vp
Fig. 6. Modifications to previous setup for experiment #2
contaminated by optical backgrounds, likely produced by
shock-generatedmetal jets.
Once the modifications discussed above were carried
out, we were in a better position to study certain inter-
esting features in the bismuth phase-diagram.
4 Investigation of bismuth melting-curve
by means of shock waves
According to a recent theoretical work (P´elissier and
Wetta 2001), under shock loading body-centered cubic
(bcc) bismuth begins to melt near 17 GPa andis com-
pletely meltedabove about 28 GPa. Furthermore, when
shockedbetween 14 GPa and28 GPa andthen released
against a lithium-fluoride window (which leads to an in-
terface pressure p
i
between 10 and18 GPa), bismuth re-
mains in the solid-liquidcoexistence region andits temper-
ature (i.e. the interface temperature T
i
) follows the melt-
ing curve (Wetta andP´elissier 2001). We have performed
eight experiments in this pressure range with the improved
device, in order to deduce part of the bismuth fusion curve
from temperature measurements on shock-loaded samples.
A similar behaviour has been observedwith magnesium
for 35 GPa < p
i
< 50 GPa (Urtiew andGrover 1977), and
Table 1. Pyrometry data analysis for experiment #2; λ is the
mean channel-wavelength, ∆λ is the optical filter bandwidth
(at 50% of the maximal transmittance), L and ∆L are respec-
tively the experimental radiance and its uncertainty; T
min
and
T
max
were calculated with ε = 1 and 0.1 respectively, the inter-
section of allowed temperature bands for the different channels
giving the highest (1803 K) and the lowest (1489 K) of the pos-
sible temperatures; finally ε
min
and ε
max
are, for each chan-
nel, the calculated minimal and maximal emissivities which
are compatible with the experimental radiance, its uncertainty
and these two limit temperatures. λ = 3.51
µ
m channel was
not used as we believe that its calibration was erroneous
λ(
µ
m) ∆λ(
µ
m) L (W · m
−2
· sr
−1
) ∆L (W · m
−2
· sr
−1
)
0.55
0.04
4.3
±2.0
0.705 0.04
26.4
±6.6
1.2
0.09
764
±34.3
1.315 0.47
4904.7
±1073.4
1.5
0.09
1123.1
±38.8
1.6
1.04
11698.1
±1640.7
2.55
0.96
6858.9
±451.8
λ(
µ
m) T
min
(K) T
max
(K)
ε
min
ε
max
0.55
1489
1838
0.13 1
0.705 1443
1803
0.1 0.64
1.2
1381
1906
0.14 0.53
1.315 1332
2009
0.19 0.43
1.5
1338
1996
0.17 0.48
1.6
1286
2032
0.18 0.39
2.55
1110
2043
0.15 0.26
the qualitative results of this early work have been later
corroboratedby calculation (P´elissier 1986). In the same
way, Ahrens et al. (1990) and Bass et al. (1990) concluded,
in case of experiments on iron andon stainless steel re-
spectively, that they couldinfer the melting curves of these
materials (typically between 120 and230 GPa) from their
390
D. Partouche-Sebban et al.: An investigation of shock induced temperature rise and melting of bismuth
0
20
40
60
80
100
120
3.0
3.5
4.0
4.5
5.0
5.5
Time (
µ
s)
V
o
lt
age (
m
V
)
3.04 - 3.98 µm
(/1.6)
2.07-3.03 µm
(/4)
1.08-2.12 µm
(/2)
1.08-1.55 µm
(/2)
0.69-0.73 µm
(/1.7)
1.46-1.55 µm
(/1.7)
1.15-1.25 µm
0.53-0.57 µm
Fig. 7. Experiment #2 pyrometry
data
Pressure
mass velocity
p
H
p
i
Vp/2
Vp
Cu shock-locus
Bi shock-locus
LiF shock-locus
Cu release isentrope
Bi release isentrope
Fig. 8. The experiment in the (mass velocity, pressure) dia-
gram
temperature measurements through lithium fluoride and
sapphire windows.
4.1 Experimental results
Our results are given in Table 2. Shock andinterface
pressures in bismuth were obtainedin the (mass veloc-
ity, pressure) diagram, as illustrated in Fig. 8. Indeed,
because of symmetrical copper-copper impact, mass ve-
locity in shockedcopper is half of the flyer velocity V
p
.
For Cu, Bi andLiF, experimental shock Hugoniot data
(Marsh 1980) were usedandthe release isentropes of cop-
per andbismuth were assumedto be the mirror images
of corresponding shock-loci. This well-known approxima-
tion (Zeldovich and Raizer 1967, p. 729) is appropriate for
copper in the investigatedpressure range. The hypothesis
seems more questionable for bismuth, which experiences a
10% volume reduction when shocked at low pressure and
also phase transitions during release (Wetta and P´elissier
2001). We have checked, by a theoretical calculation of
Bi Hugoniot curve andrelease isentropes, that the mir-
ror reflection approximation remainedreasonable in the
present case. It comes from the fact that, in our exper-
iments, LiF rather large shock-impedance prevented the
Table 2. Experimental results. Apart from bismuth interface
temperature T
i
, we have only measured the flyer velocity V
p
,
from which we have deduced (cf. text) the shock and interface
pressures (respectively p
H
and p
i
) in bismuth. Accordingto
theoretical calculations, the correspondingcompression factor
ρ
i
/ρ
0
(ρ
i
and ρ
0
beingrespectively the interface and initial
densities) varies between 1.3 and 1.34
Exp.
V
p
(m · s
−1
)
p
H
(GPa)
p
i
(GPa)
T
i
(K)
#2
1430 ± 61
24.7 ± 1.8
17.5 ± 1.1
1650 ± 160
#3
1347 ± 26
22.7 ± 0.9
16.4 ± 0.5
1470 ± 190
#4
1391 ± 21
23.2 ± 0.6
16.8 ± 0.4
1690 ± 240
#5
1329 ± 53
22.0 ± 1.5
16.0 ± 1.0
1520 ± 230
#6
972 ± 27
14.1 ± 0.8
11.1 ± 0.6
880 ± 170
#7
867 ± 30
12.4 ± 0.7
9.9 ± 0.5
800 ± 120
#8
1209 ± 36
19.5 ± 0.9
14.5 ± 0.6
1270 ± 160
#9
1167 ± 50
18.4 ± 1.2
13.8 ± 0.8
1250 ± 160
interface pressure from decreasing drastically (cf. Fig. 8);
consequently, releasing bismuth stayedin closed-packed
form (bcc or liquid) and never underwent a reverse tran-
sition to a low-density phase like Bi I.
The first two high-pressure points (experiments 2 and
3) were obtainedassuming that bismuth emissivity was
between 0.1 and1 for the two visible channels (cf. dis-
cussion in Sect. 2). Using this methodwe have shown that
the emissivity was less than 0.6 for infraredchannels. Con-
sequently for other experiments, specifically when the ob-
servedsignals are too low in the visible spectrum, we have
only usedinfraredradiances andconstrainedthe dynamic
emissivity between 0.1 and0.6.
4.2 Discussion of the results
As discussedpreviously (Wetta andP´elissier 2001), the
fact that the sample is gluedto the LiF window has two
consequences that we have not yet dealt with:
– even if glue is a goodthermal insulator (especially
regarding a ∼ 1 µs duration experiment), a small
D. Partouche-Sebban et al.: An investigation of shock induced temperature rise and melting of bismuth
391
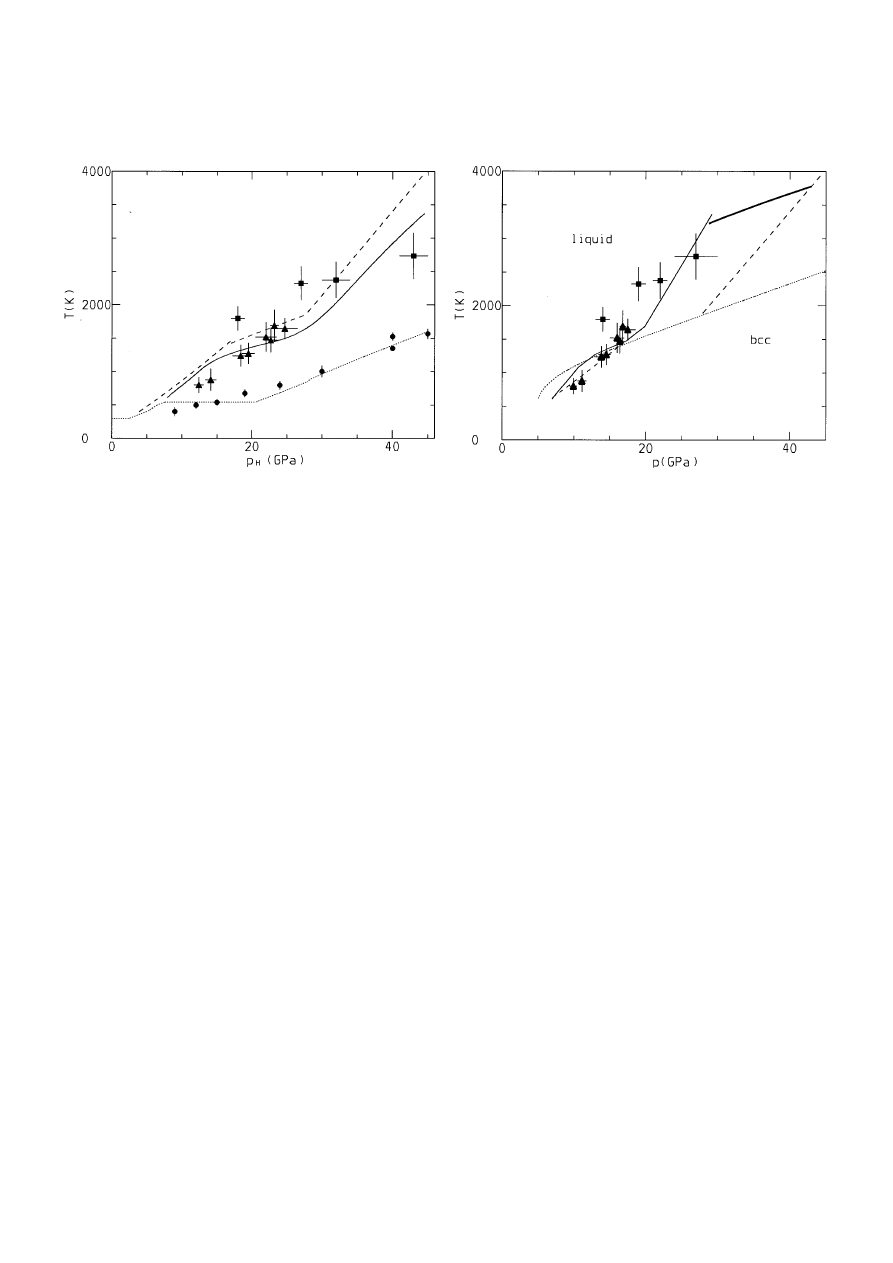
Fig. 9. Shock, interface and free-surface temperatures of
bismuth versus incident shock pressure. Theory (Wetta and
P´elissier 2001): dashed line (shock), full line (LiF window) and
dotted line (free surface). Experimental: squares, triangles (LiF
window, respectively Blanco 1997 and present work) and cir-
cles (free surface, Mondot 1993)
cooling effect takes place in the metallic sample at
the bismuth-LiF interface; this effect wouldbe much
stronger with a vapor-deposited film (Ahrens et al.
1990; Bass et al. 1990; Tan andAhrens 1990)
– a series of shocks andre-shocks occurs across the glue
layer before pressure andmass velocity come in equi-
librium on both sides of this interface; so that, since a
certain amount of irreversibility is added in this pro-
cess, the interface temperature T
i
is somewhat higher
than expected.
Fortunately, in the case of bismuth, as long as excita-
tion pressure does not exceed 35 GPa, both corrections
remain limited (about 50 or 100 K) and, according to our
estimates, typically cancel each other. Moreover, as long
as bismuth remains in the solid-liquid coexistence region,
small heating or cooling effects are inhibitedby the melt-
ing curve. Their only consequence is a variation of the
solid-liquid proportion.
Figure 9 shows that the results obtainedin the present
work are in much better agreement with theoretical pre-
diction than the previous ones. The accord becomes com-
parable to that for free-surface experiments, which is more
satisfactory. Of the previous results, only the one near
p
H
= 43 GPa seems in agreement with calculation since
the interface cooling is close to 100 K at this pressure
(which is not taken into account in the theoretical curve).
Even if bismuth andlithium fluoride are not perfectly
shock-impedance matched, for a given shock-pressure one
can note that the temperature decrease T
H
–T
i
along the
rarefaction isentrope remains rather limited.
The previous observation is confirmedby the examina-
tion of Fig. 10, where the theoretical isentrope correspond-
ing to p
H
= 43 GPa appears. This is typically the highest
shock-pressure reachedin previous experiments (Blanco
Fig. 10. Temperature of shocked bismuth against a lithium-
fluoride window in the (pressure, temperature) diagram. Locus
of interface temperature versus interface pressure for LiF anvil:
experiment (squares: Blanco 1997 and triangles: present work)
and theory (thin full line: Wetta and P´elissier 2001). The the-
oretical Hugoniot and melting curves are also recalled (respec-
tively dashed and dotted lines), and the release isentrope for
p
H
=43 GPa appears as a thick full line
1997). According to calculations, the interface temper-
ature versus interface pressure curve (for LiF window)
merges with the melting curve in the 10–18 GPa pres-
sure range, andconsequently one can expect to observe
well-markedinflections near 10 and18 GPa. The exper-
imental point set seems to indicate the fusion-line shape
but with less drastic slope-changes than predicted theoret-
ically. Similarly the plateau which characterizes the free-
surface temperature versus shock-pressure curve seemed
somewhat smoothedas shown by Fig. 9 experimental data.
A possibility (see Fig. 10) is that solid-liquid coexistence
region couldbe somewhat narrower than calculated, as in-
dicated by the two points near 10 GPa. In fact, the point
p
i
= 9.9 GPa appears to be somewhat below the melt-
ing curve, as fusion was reachedtypically at 780 K for
p = 6.5 GPa (Klement et al. 1963).
We plan to perform several more experiments on bis-
muth with lithium fluoride and sapphire windows. Since
the shock impedance of sapphire is higher than that of
bismuth, we couldobtain an interface temperature some-
what greater than shock temperature andstudy the melt-
ing curve between about 17 and28 GPa. Anda subsequent
comparison to diamond-anvil cell results in the 10–28 GPa
range wouldbe of great interest.
5 Conclusion
We have reportedthe results from a series of experi-
ments, giving the surface temperature of bismuth initially
shockedandthen partially releasedagainst a transpar-
ent lithium-fluoride anvil. During this work, previous ex-
perimental technique was refined, especially with regard

392
D. Partouche-Sebban et al.: An investigation of shock induced temperature rise and melting of bismuth
to reducing optical background. The improved device al-
lowedus to investigate dynamically a part of the melting
curve (as expectedfrom previous calculations), andseems
to provide a sound basis for future experiments.
Acknowledgements. The authors wish to thank J.P. Aubry for
his careful and professional contributions to the experiments.
We also would like to thank C. Rion, S. Verdelet and P. Os-
trowski for their help in settingup the experiment and record-
ingthe data. Finally, the authors are indebted to the referee
for interestingremarks.
References
Ahrens TJ, Tan H, Bass JD (1990) Analysis of shock temper-
ature data for iron. High Pressure Res. 2:145
Bass JD, Ahrens TJ, Abelson JR, Hua T (1990) Shock tem-
perature measurements in metals: New Results for an Fe
Alloy. J. Geophys. Res. 95:21,767
Blanco E (1997) Temp´erature et ´emissivit´e des mat´eriaux
sous choc – Etude exp´erimentale par pyrom´etrie optique
`a travers un materiau fenˆetre. Thesis, University of Paris
X, Nanterre
Blanco E, Mexmain JM, Chapron P (1999) Temperature mea-
surements of shock heated materials usingmultispectral
pyrometry:application to bismuth. Shock Waves 9:209
Elias P, Chapron P, Remiot C (1988) Etude exp´erimentale des
changements de phase du bismuth soumis `a de hautes pres-
sions dynamiques. J. Phys. 49:C3-667
H´ereil PL, Mabire C (2000) Temperature measurements of tin
under shock compression. J. Phys. IV France 10:Pr9-799
Herv´e P, Masclet P, Lef`evre A, Gobin I, Berthault J P (1990)
Ultraviolet pyrometry. Proc. 4th Symposium on temper-
ature and thermal measurement in industry and science
(Tempmeko), Helsinki
Klement W Jr, Jayaraman A, Kennedy GC (1963) Phase di-
agrams of arsenic, antimony, and bismuth at pressures up
to 70 kbars. Phys. Rev. 131:632
Lange VKW, Schenck H (1968) Messung des spectralen emis-
sionsgrades von metallen und metallegierungen. Archiv fur
das Eisenhuttenwesen, Heft 8, gruppe E, No. 2909
Marsh SP (ed) (1980) LASL Shock Hugoniot Data. University
of California Press, Berkeley
McQueen RG, Isaak DG (1990) Characterizingwindows for
shock wave radiation studies. J. of Geophys. Res. 95:21,753
Mondot M (1993) La temp´erature des mat´eriaux soumis `a une
onde de choc. Thesis, Conservatoire National des Arts et
M´etiers, Paris
Nellis WJ, Yoo CS (1990) Issues concerningshock temperature
measurements of iron and other metals. J. Geophys. Res.
95:21,749
Partouche-Sebban D, Holtkamp DB, Bartsch R, Huan L,
Schmitt GG (2001) Application of a high speed, low tem-
perature IR pyrometer in pulsed power experiments. Rev.
Sci. Instrum. 72:3008
P´elissier JL (1986) Determination of the phase diagram of
magnesium:a model-potential approach in the sub-megabar
range. Phys. Scr. 34:838
P´elissier JL, Wetta N (2001) A model-potential approach for
bismuth (I). Densification and meltingcurve calculation.
Physica A 289:459
Tan H, Ahrens TJ (1990) Shock temperature measurement for
metals. High Pressure Res. 2:159
Touloukian YS, DeWitt DP (1970) Thermophysical properties
of matter, Vol. 7, Thermal radiative properties – Metallic
elements and alloys. IFI/Plenum, New York Washington
Urtiew PA, Grover R (1974) Temperature deposition caused by
shock interactions with material interfaces. J. Appl. Phys.
45:140
Urtiew PA, Grover R (1977) The meltingtemperature of mag-
nesium under shock loading. J. Appl. Phys. 48:1122
Wetta N, P´elissier JL (2001) A model-potential approach for
bismuth (II). Behaviour under shock loading. Physica A
289:479
Wise JL, Chhabildas LC (1986) Laser interferometer measure-
ments of refractive index in shock-compressed materials.
In:Gupta YM (ed) Shock waves in condensed matter 1985,
Plenum Press, New York, pp 441–454
Zeldovich YB, Raizer YP (1967) Physics of shock waves and
high-temperature hydrodynamic phenomena. Hayes WD,
Probstein RF (eds). Academic Press, New York
Wyszukiwarka
Podobne podstrony:
cathinone an investigation of several N alkyl and methylenedioxy substituted analogs pharmacolbioche
87 1237 1248 Machinability and Tool Wear During the High Speed Milling of Some Hardened
an analysis of the legal high mephedrone bioorg med chem lett 20 4135 4139 2010
How does personality matter in marriage An examination of trait anxiety, interpersonal negativity, a
8 95 111 Investigation of Friction and Wear Mechanism of Hot Forging Steels
Summary of an artice 'What is meant by style and stylistics'
Master Wonhyo An Overview of His Life and Teachings by Byeong Jo Jeong (2010)
[Mises org]French,Doug Walk Away The Rise And Fall of The Home Ownership Myth
3 T Proton MRS Investigation of Glutamate and Glutamine in Adolescents at High Genetic Risk for Schi
Heathen Ethics and Values An overview of heathen ethics including the Nine Noble Virtues and the Th
How does personality matter in marriage An examination of trait anxiety, interpersonal negativity, a
Penier, Izabella An Outline of British and American History (2014)
Rise And Fall Of Soviet Communism A History Of 20Th Century Russia (Guidebook)
Unsolved Mysteries An Exhibition of Unsolved Mysteries and Enigmatic Findings in the History of Hum
An Analysis of Euro Area Sovereign CDS and their Relation with Government Bonds
(Trading) Paul Counsel Towards An Understanding Of The Psychology Of Risk And Succes
więcej podobnych podstron