
Working Paper
Series
_______________________________________________________________________________________________________________________
National Centre of Competence in Research
Financial Valuation and Risk Management
Working Paper No. 695
An Analysis of Euro Area Sovereign CDS and their
Relation with Government Bonds
Alessandro Fontana
Martin Scheicher
First version: June 2010
Current version: January 2011
This research has been carried out within the NCCR FINRISK project on
“Credit Risk and Non-Standard Sources of Risk in Finance”
___________________________________________________________________________________________________________

An Analysis of Euro Area Sovereign CDS and their Relation with
Government Bonds
Alessandro Fontana
1
and Martin Scheicher
2
January 2011
This paper studies the relative pricing of euro area sovereign CDS and the underlying government bonds. Our
sample comprises weekly CDS and bond spreads of ten euro area countries for the period from January 2006 to
June 2010. We first compare the determinants of CDS spreads and bond spreads and test how the crisis has
affected market pricing. Then we analyse the „basis‟ between CDS spreads and bond spreads and which factors
drive pricing differences between the two markets. Our first main finding is that the recent repricing of
sovereign credit risk in the CDS market seems mostly due to common factors. Second, since September 2008,
CDS spreads have on average exceeded bond spreads, which may have been due to „flight to liquidity‟ effects
and limits to arbitrage. Third, since September 2008, market integration for bonds and CDS varies across
countries: In half of the sample countries, price discovery takes place in the CDS market and in the other half,
price discovery is observed in the bond market.
JEL classification: G00, G01;
Keywords: Credit Spread; CDS; government bond; financial crisis, limits to arbitrage;
1
Geneva Finance Research Institute and FINRISK, Bd du Pont d‟Arve 40 Ch 1211 Geneva, Switzerkland e-mail:
alessandro.fontana@unige.ch.it;
2
Financial Research Division, European Central Bank; Kaiserstrasse 29, D – 60311, Frankfurt am Main, Germany. Tel: +49+69 1344 8337; Fax:
+49+69 1344 8552; Email: martin.scheicher@ecb.int. The opinions in this paper do not necessarily reflect those of the ECB or the
Eurosystem.
This paper has been presented at the EFMA meetings 2011 in Braga (Portugal), at the ECB and at the CREDIT 2010 Greta conference in Venice.
We would like to thank participants for helpful comments.
Financial support by the National Centre of Competence in Research "Financial Valuation and Risk Management" (NCCR FINRISK) is
gratefully acknowledged.” IP C1 "Credit Risk and Non-Standard Sources of Risk in Finance", Rajna Gibson. Research topic: AP, FE. First
draft June 2010, this draft January 2011.

2
Non-technical summary
Credit default swaps (CDS) offer trading for a wide range of instruments with exposure to credit risk.
CDS provide traded insurance against credit risk. In a standard CDS contract, two parties enter into an
agreement terminating either at the stated maturity or earlier when a previously specified credit event
occurs and the protection component is triggered. Hence, a CDS contract serves to transfer the risk that a
certain individual entity experiences a credit event from the “protection buyer” to the “protection seller”
in exchange for the payment of a regular fee.
Since late September 2008, the sovereign CDS market has attracted considerable attention. Recent market
developments peaked in an unprecedented „flight to safety‟ episode in early May 2010 in the euro area,
when investors started large scale sell-offs of a variety of risky assets.
The purpose of this paper is to provide a comprehensive analysis of the euro area sovereign CDS market.
Our sample comprises weekly observations on the CDS spreads and bond yields of ten euro area
countries from January 2006 to June 2010. Although market information indicates growing volumes and
active trading, potentially variable liquidity is certainly a major caveat in any analysis of market prices.
Our first main contribution is a comparative analysis of the determinants of spreads on CDS and the
underlying government bonds. Our approach allows us to use a comprehensive set of potential
explanatory factors such as liquidity factors or proxies for risk aversion without being constrained by the
specification of a particular pricing model. We find that the recent repricing of sovereign debt is strongly
linked to common factors some of which proxy for changes in investor risk appetite.
Due to sizeable risk premia in CDS quotes changes in credit and non-credit-related components lead to
different interpretations of market expectations. Specifically, decreasing appetite for credit-risky
instruments is a different signal of market perceptions than rising expectations about future defaults in the
underlying instruments. Hence, high CDS premia during the crisis may be in part due to declining risk
appetite and falling market liquidity, but also to concerns about an increasing number of credit rating
downgrades, rather than to principal losses on outstanding debt.
Our second main contribution is to study the „basis‟, i.e. the difference between CDS spreads and the
spreads on the underlying government bonds. In essence, both sovereign CDS and government bonds
offer exposure to sovereign debt. Hence, the basis, which should normally be close to zero, can provide
some insights into the functioning of sovereign credit markets. We find that for most countries in our
sample the spread on the government bond relative to the swap rate is below the corresponding CDS
spread. Our econometric analysis as well as the related literature allow us offer some potential
explanations for this empirical observation. In particular, a number of authors have recently provided
evidence for the existence of limits of arbitrage s and slow moving capital. They argue that deviations
from the arbitrage-free parity do not seem to be easily exploitable as market frictions and structural
changes throughout the crisis inhibit traders to arbitrage away these price differentials.

3
1.
Introduction
Since August 2007, credit markets have witnessed an unprecedented repricing of credit risk. This credit
market crisis has proceeded in several stages and has affected all sectors. The revaluation started in US
mortgage markets; subsequently corporates, in particular banks, underwent a dramatic reassessment of
their credit risk. This financial market turbulence reached a peak in the wake of the collapse of Lehman
Brothers in September 2008. After this event, many major banks on both sides of the Atlantic were in
major distress and massive state intervention was required in order to mitigate systemic risk and its
adverse macroeconomic consequences.
Since September 2008, the sovereign debt market has attracted considerable attention. Before the crisis,
trading in credit markets was concentrated on private sector instruments such as corporate credit risk or
securitisation instruments. The collapse of Lehman Brothers in fall 2008 led to a fundamental
reassessment of the default risk of developed country sovereigns. Widespread and large-scale state
support for banks as well as other stimulus measures to the broader economy quickly increased public
sector deficits to levels last seen after World War II. For example, in the UK the fiscal burden of
extensive bank support measures is estimated at 44% of UK GDP (Panetta et al, 2009).
In the euro area, sovereign debt markets in several countries came under unprecedented stress in the first
half of 2010. Massive sell-offs were observed for instance in Greek government bonds, with CDS spreads
on Greek bonds jumping above 1,000 basis points. These tensions peaked in a „flight to safety‟ episode in
early May 2010, when investors started large scale sell-offs of risky assets. European public authorities
then announced a number of measures to reduce distress in financial markets. In particular, EU finance
ministers launched the European Financial Stability Facility (EFSF), while the ECB announced several
policy measures such as interventions in bond markets under the Securities Markets Programme. The
EFSF with a planned overall volume up to EUR 440 billion is intended to support euro area governments
which face difficulties in accessing public debt markets (cf. Deutsche Bank, 2010). These measures all
helped improving sentiment in euro area sovereign debt markets.
Traditionally, valuation of government debt issued by developed country sovereigns has treated default as
a very low probability event.
3
Hence, modelling (e.g. in term structure analysis) is typically oriented
towards interest rate risk or liquidity risk, rather than default risk. The absence of defaults among
developed country governments has underpinned the widely used assumption that government bonds
provide a good proxy for the long-horizon (default-) risk-free rate. Hence, before the crisis, the CDS
market for developed country borrowers developed rather as a sideshow to the trading of emerging
market debt. In addition to the perception of very low default risk in Western sovereigns, the dramatic
experience of the 1997-1998 crisis in emerging market sovereigns also played a large role. Given this
market focus, key papers on sovereign CDS such as Pan and Singleton (2008) or Longstaff et al. (2008)
3
In the literature on credit risk modelling, default risk is usually defined as the narrow risk arising from an entity‟s failure to pay
its obligations when they are due. In contrast, credit risk also covers any losses due to an entity‟s credit rating being
downgraded (e.g. from A to BBB).

4
do not study euro area countries.
4
Only in the context of the worsening of the current crisis has attention
turned to default risk in euro area sovereign debt. Both for trading as well as for hedging reasons, market
activity in euro area sovereign CDS has grown strongly. These recent concerns about default risk in
developed country government bonds have therefore also cast doubts on using government bonds for
estimating risk-free rates, a core feature of asset pricing.
The purpose of this paper is to provide a comprehensive analysis of the Euro area sovereign CDS market
by making use of information from the underlying bonds. Our two main contributions are first a
comparative analysis of the determinants of spreads
5
and second a study of the arbitrage relationship
between CDS and the underlying bonds. In the first part, we study the common factors in the first
differences of bond spreads and CDS spreads and analyse the impact of the repricing of credit risk on
spreads. Our approach allows us to use a comprehensive set of potential explanatory factors such as
liquidity factors or proxies for risk aversion without being constrained by the specification of a particular
pricing model. In the second part of our paper we analyse the „basis‟, i.e. the difference between CDS
spreads and the spreads on the underlying government bonds. This variable is of particular interest
because arbitrage trading should generally drive it close to zero. Hence, analysis of the determinants of
the basis can help us understand market functioning as well as information transmission across the two
markets which trade the same type of risk, namely sovereign credit risk. We also conduct a variety of
robustness tests and discuss the economic significance of our results.
Our sample comprises weekly observations on the CDS spreads and bond yields of ten Euro area
countries. The sample period is from January 2006 to June 2010. Our analysis of the „basis‟ complements
the existing literature on sovereign CDS of developed countries as previous research on sovereign CDS
has not studied the interaction with the underlying bonds. In particular, information from the underlying
bond market significantly extends the information set for explaining CDS market pricing. Dieckmann and
Plank (2010) study the pricing of sovereign CDS with a focus on the „private-public risk transfer‟, i.e.
how sovereign CDS are related to the respective country‟s banking system. This question is also analysed
by Ejsing and Lemke (2010) who document linkages between CDS of Euro area banks and their
governments‟ CDS.
6
Our first main finding is that the recent repricing of the cost of sovereign debt is strongly linked to
common factors some of which proxy for changes in investor risk appetite. As regards the impact of the
crisis, we find a structural break in market pricing which coincides with the sharp increase in trading of
sovereign CDS. Furthermore declining risk appetite, which has characterised investor behaviour since
summer 2007, has provided a sizable contribution to the observed strong increase in CDS premia.
4
Pan and Singleton (2008) study Korea, Turkey and Mexico. Longstaff et al. (2008) analyse 26 countries where the only EU
countries are Bulgaria, Hungary, Poland, Romania and Slovakia.
5
Following the literature on credit markets, we use the terms ‟credit spread‟ and ‟CDS premium„ as synonyms because a CDS
premium can be interpreted as the spreads between a corporate bond and the default- risk free-rate (Duffie, 1999).
6
The analysis of euro area sovereign bond markets has typically focused on the role of fiscal fundamentals, market liquidity or
market integration (cf. Manganelli and Wolswijk, 2009). Overall, this literature looks more at migration risk (i.e. rating
downgrades) than on the risk of outright default. Euro area bond market developments in the crisis are analysed by Sgherri
and Zoli (2009), Mody (2009) or Haugh et al. (2009).

5
Second, the nature of the relation between CDS and government bonds indicates that interdependence
between the two markets differs from the patterns observed for corporate debt markets. Typically, the
basis in corporate debt markets has been below zero since the start of the crisis (Fontana, 2010). In
contrast, we observe a positive basis for most countries. One possible explanation for the CDS spread
exceeding the bond spread are „flight to liquidity‟ effects
7
, which specifically lower government bond
spreads in periods of market distress. The main exceptions to this pattern are Portugal, Ireland and Greece
where we find a temporary negative basis in 2009 and early 2010. Since September 2008, market
integration for bonds and CDS differs across countries. In half of the sample countries, price discovery
takes place in the CDS market and in the other half, price discovery is observed in the bond market. In
contrast, before the crisis, there was only limited trading activity in the CDS market which also affected
price discovery and the linkages between the bond and the derivative market.
Overall, our results on the arbitrage relationship between bonds and CDS support the existence of „limits
of arbitrage‟ (Shleifer and Vishny, 1997) during the most turbulent periods of the financial crisis from late
2008 onwards and also in spring 2010. Pricing in the CDS market and the government bond market may
have drifted apart because of „flight to liquidity‟ effects in the latter and because of increasing hurdles for
those traders who were trying to exploit what seemed to be sizable arbitrage opportunities. For instance,
the number of market participants who acted as arbitrage traders declined sharply due to decreasing risk
appetite and the exit of several major institutions such as Lehman. Overall, the crisis has had an adverse
impact on both market and funding liquidity. Similar evidence of limits of arbitrage has been reported by
Bhanot and Guo (2010) and Fontana (2010) for the basis between corporate bond spreads and the
corresponding CDS during the crisis. In general, many market segments also witnessed the breakdown of
what used to be stable relative pricing relationships before the crisis (cf. Mitchell and Pulvino, 2010 or
Krishnamurty, 2010).
The rest of this paper is organised as follows. In section 2, we discuss the mechanism of sovereign CDS
and the sample. Section 3 describes the results of the econometric analysis. Section 4 concludes the paper
by summarising the main results.
2.
Sample
2.1 A brief review of sovereign CDS
A CDS serves to transfer the risk that a certain individual entity or credit defaults from the “protection
buyer” to the “protection seller” in exchange for the payment of a regular fee. In case of default, the buyer
is fully compensated by receiving e.g. the difference between the notional amount of the loan and its
recovery value from the protection seller. Hence, the protection buyer„s exposure is identical to that of
short-selling the underlying bond and hedging out the interest-rate risk. Commonly, CDS transactions on
sovereign entities have a contractual maturity of one to ten years.
7
Beber et al. (2009) illustrate „flight to liquidity‟ effects in euro area government bonds.

6
The CDS spread is the insurance premium (in basis points per annum as a fraction of the underlying
notional) for protection against default. As in a standard interest rate swap the premium is set such that
the CDS has a value of zero at the time of origination. If a credit event occurs the protection seller
compensates the protection buyer for the incurred loss by either paying the face value of the bond in
exchange for the defaulted bond (physical settlement) or by paying the difference between the post-
default market value of the bond and the par value (cash settlement) where the post-default value of the
bond is fixed by an auction procedure. In the context of sovereign risk, the first such auction procedure
was held for Ecuador in January 2009.
In a standard CDS contract on public or corporate debt, two parties enter into an agreement terminating
either at the stated maturity or earlier when a previously specified “credit event” occurs and the
protection component is triggered. Three important credit events defined (along with other terms of the
contract) by the International Swaps and Derivatives Association (Barclays, 2010a) are:
Failure to pay principal or coupon when they are due: Hence, already the failure to pay a coupon
might represent a credit event, albeit most likely one with a high recovery (i.e. „technical
default‟).
Restructuring: The range of admissible events depends on the currency and the precise terms
which materialise.
Repudiation / moratorium.
For corporate as well as sovereign CDS, the premium can be interpreted as a credit spread on a bond
issued by the underlying reference entity.
8
By means of a no-arbitrage argument, Duffie (1999) shows
that the CDS spread should equal the spread over LIBOR on a par floating rate bond. According to this
pricing analysis, the risk-reward profile of a protection seller (who is „long‟ credit risk) therefore is very
similar to a trading strategy which combines a bond by the same entity with a short position in a default-
risk-free instrument. As will be discussed later in more detail, this theoretical equivalence allows traders
to arbitrage potential price differences between an entity‟s bonds and its CDS.
Like most CDS contracts, sovereign CDS typically serve as trading instruments rather than pure insurance
instruments. Investors commonly use sovereign CDS mainly for the following purposes:
Taking an outright position on spreads depending on traders‟ expectations over a short horizon
Hedging macro, i.e. country risk (e.g. a bank‟s exposure to a quasi-governmental body)
Relative-value trading (e.g. a short position in country X and a long position in country Y)
Arbitrage trading (e.g. government bonds vs. CDS).
In addition to country default risk, a number of additional factors may influence the information content
of CDS premia. First, in relative terms, sovereign CDS volume is small. As a measure, chart 1 uses the
publicly available DTCC data for two snapshots relative to the volume of total bonds outstanding. For
8
Since May 2009, CDS trading has undergone a „big bang‟ with prices now consisting of an upfront payment and a regular fixed
coupon (cf. Barclays 2010a). This change in their contractual features has made trading and closing out of positions easier.
Putting the two components together leads to the CDS premium which is comparable to the previous contracts. In many
cases, CDS positions are collateralised with the margin providing initial protection and also a variation component.

7
Greece, the net open CDS amount to around three percent of their outstanding sovereign debt and for
Portugal and Ireland around 7%. This magnitude is in contrast to other sovereign derivatives market, such
as the Bund future, where the derivatives market exceeds the cash market. For the Bund futures market,
Upper and Werner (2002) show that in periods of high volatility price discovery takes place in the
derivatives market rather than the cash market. Second, liquidity in CDS markets overall is also quite
heterogeneous. The most liquid instruments are index products where bid-ask spreads amount to less than
one basis point and intraday pricing is available. In contrast, prices for some single-name CDS contracts
with bid-ask spreads in the double-digit range are quite stale.
9
Third, sovereign CDS on e.g. euro
governments are typically denominated in US$ (Barclays, 2010 a). One reason for choosing a different
currency than the bond‟s original denomination is that this allows investors to avoid the risk of a severe
depreciation of the bond‟s currency in case of a credit event. This currency mismatch introduces an
element of exchange rate risk into the pricing of the contract. Finally, counterparty risk may matter far
more for sovereign CDS than for corporate CDS. In particular, CDS on major countries may not always
provide genuinely robust insurance against a large-scale default given the close linkages between
sovereigns and the financial sector.
2.2 Sample details
We use weekly CDS spreads and benchmark bond yields collected from Bloomberg. Our sample period is
1 January 2006 to 28 June 2010. The series are for 10-year CDS denominated in US$ for Austria,
Belgium, France, Germany, Greece, Ireland, Italy, Netherlands, Portugal and Spain. This country
selection is due to data availability. We focus on the ten-year horizon as this is the common horizon for
the government bond. Hence, our yield data cover benchmark bonds with a ten-year maturity.
For all countries, we calculate the bond spread relative to the ten-year swap rate because interest rate
swaps are commonly seen as the market participants‟ preferred measure of the risk-free rate (cf. Beber et
al., 2009). In addition, this approach guarantees a homogeneous benchmark across the euro area. Some
papers such as Haugh et al. (2009) use the German benchmark Bund yield as a proxy for the risk-free
rate. However, this approach has the disadvantage that the CDS on Germany has to be omitted from the
analysis. Furthermore, the benchmark role of Bunds may lead to the existence of a significant
„convenience yield„.
10
We start the description of our sample by taking an aggregated perspective on the repricing. Chart 2
shows the developments in European sovereign CDS (iTraxx SovX Western Europe index) and those for
European financials (iTraxx Main Investment Grade Financials index).
11
The chart illustrates the massive
9
For the corporate market, Blanco et al (2005) show that the CDS market already in its early stage provided the benchmark for
the market pricing of default risk whereas the bond market played a minor role. A key factor is that CDS contracts are
standardised with a maturity of five or ten years whereas the usually high number of individual bonds shows potentially
idiosyncratic components (e.g. callability, maturity or coupon). In particular, many bond investors have a hold to maturity
perspective and hence do not contribute to market liquidity.
10
For US Treasuries, Krishnamurthy and Vissing-Jorgensen (2009) estimate the „convenience yield„ at 72 BP.
11
The iTraxx Financials comprises 25 major European banks and insurance firms. The iTraxx SOVX comprises 15 Western
European sovereigns (including e.g. the UK). The index started trading in September 2009, but historical data have been
backfilled starting from 2004.

8
repricing of risk reaching its first peak in fall and winter 2008/2009 when the SovX index climbed above
150 BP (see also Ejsing and Lemke, 2010 or Dieckmann and Plank, 2010). Both financial as well as
sovereign CDS rose dramatically from October 2008 to early 2009 with the more recent market
developments in sovereign markets since November 2009 providing a relatively smaller repricing in the
index. Before the crisis, CDS for both types of entities were trading in the range of single-digit basis
points with low volatility and also low market activity.
Using a simple pricing model,
12
the implied, i.e. risk-neutral probability of default can be extracted from
CDS premia. An application of this model to the most recent observations of the SovX index in chart 2
leads to an estimate of the subjective default probability of around 1.3%. This market-implied estimate by
far exceeds the historical estimate as for instance the long-run default probability of an A-rated issuer is
around 0.1%. Such sizable differences have been observed by a number of papers in the context of the
“credit spread puzzle” (Amato and Remolona, 2003). According to this stylised fact, expected default
losses frequently account for a very small fraction of credit spreads. The residual component is
interpreted as a risk premium (Giesecke et al., 2010), which is frequently found to be related to market
liquidity or measures of investor risk appetite.
Overall, given the definition of default events outlined above, this high level of the implied default
probability for European sovereigns may be due to risk premia but also due to rising probabilities of a
scenario of “technical default” rather than market concerns about principal losses on outstanding debt in a
Lehman-type scenario. In addition, market concerns about migration risk (i.e. the risk of a sovereign
suffering a credit rating downgrade), in particular the loss of the coveted AAA rating might also have
contributed to the jumps.
From a valuation perspective, both financial and sovereign credit instruments share strong exposure to
systematic risk, i.e. a major deterioration in the macroeconomic environment, which in the case of
financials would cause large-scale defaults in their loan books. Such a scenario of extremely high losses
resembles the market‟s reassessment of the risk-return relation in asset-backed securities from summer
2007 onwards. Indeed, Berndt and Obreja (2010) show that European corporate CDS are significantly
related to a factor which captures what the authors call “economic catastrophe risk”.
Chart 3 plots the time series of bond spreads and CDS spreads for the ten countries in our sample. The
descriptive statistics are shown in tables 1 and 2. Given the pronounced changes in CDS spreads after
Lehman‟s default we report descriptive statistics for two subsamples, 1 January 2006 to 12 September
2008 („period I‟) and 15 September 2008 to 28 June 2010 („period II‟).
13
The country-level plots in chart 3 confirm the massive repricing of credit risk with sample highs mostly
reached in spring 2010. For example, the French CDS moved from a level below 3 basis points (BP) in
June 2007 to a peak of 100 BP in June 2010. The Greek CDS spread records a first peak in late 2008 /
early 2009. However, the second peak in 2010 by far exceeds the first peak as the CDS spread briefly
12
This standard model can be written as CDS Premium = (1− LGD)*PD, where loss given default is commonly assumed to be
60% and PD is the risk-neutral default probability (cf. Hull et al., 2005).
13
A caveat in this analysis is that the statistics in table 1 in the first sub-period are also influenced by the low market activity in
the sovereign CDS market.

9
surpassed 1000 BP, i.e. 10 percentage points. The same developments of two consecutive peaks within
less than a year are also observed for Belgium, France, Ireland, Italy, Portugal, and Spain. For all other
EU countries in the sample, the first peak in late 2008 and early 2009 provides the sample high.
14
In the
first part of the sample, almost all sovereigns‟ bonds traded below the swap curve as only Greece
recorded a mean positive spread. In contrast, in the second part of the sample, mean negative spreads are
only observed for Germany and France.
Until the end of June 2010 euro area sovereign CDS spreads have not returned to the levels witnessed
before the collapse of Lehman in September 2008. Given that our sample ends at the end of June 2010,
data availability precludes us from analysing the impact of the SMP and the EFSF on CDS spreads or
bond spreads. In the aftermath of Lehman‟s collapse, the highest average CDS spreads are observed for
Greece, Ireland, Italy, Spain and Portugal, where the mean premium exceeds 100 BP. We find that
volatility is also highest for these five countries. The overall lowest premium is recorded for Germany
with values of below one BP (0.70 BP) in the period before Lehman and 12 BP in the period after
Lehman. In addition, the table also illustrates the sharp increase in volatility in the second period.
The charts illustrate differences between the movements of bond spreads relative to the swap rate and
CDS spreads (we will conduct further analysis of the difference between the two variables in the next
subsection). Typically, the CDS spread is situated above the bond spread, i.e. in price terms bonds are
more expensive than CDS. Before the outbreak of the financial crisis, variation in CDS spreads was low
whereas bond spreads showed higher volatility. The comparatively low variability in CDS spreads also
indicates that trading activity was lower. In the second part of the sample period there is also comovement
between the two variables. The plots for Germany also provide evidence of the “flight to liquidity” effect.
At the height of the financial crisis in late 2008, the CDS spread jumped to levels above 90 BP in part
also due to fiscal concerns. At the same time, the Bund yield fell sharply to 75 basis points below the ten-
year euro swap rate. Such a portfolio shift into government bonds has been observed in many episodes of
market turmoil such as for example the LTCM collapse in October 1998. The typical portfolio adjustment
process is that investors sell assets perceived as risky and move into liquid government bonds which are
perceived to offer a „safe-haven‟ status (cf. Hartmann et al, 2004). This strong demand for safe - haven
assets drove bond prices up and hence yields declined. This investor strategy is also supported by the
mechanics of the Basel II capital requirements where the standardised approach allocates a risk weight of
zero to government debt with a rating above A+ (BCBS, 2006).
In order to understand market pricing market liquidity is a key variable . To estimate a proxy for this
variable, we make use of the approach proposed by Lesmond et al. (2007). This method has the advantage
that estimation only requires a sample of daily data. In essence, low market liquidity is indicated by the
fact that the price of an instrument does not change often, hence, we use the number of days per week
with unchanged CDS spreads or bond prices as the basis for our proxy.
14
At several points in time during 2010 a few countries have experienced an inversion of their credit curve (cf. Barclays, 2010 b).
This means that the CDS premium for the short horizon, e.g. one or three years exceeds the premia for a maturity of five or
ten years. Such a situation is very rare and has only been observed for high-yield corporates with a high perceived likelihood
of imminent default.

10
Chart 4 shows the weekly cross-country averages of the number of zero changes in CDS premia and bond
prices. Two observations are notable. First, the series indicates increasing CDS market liquidity with
considerable spikes at year-end. Second, liquidity in the bond market seems to be higher than in the CDS
market as there are far fewer instances of unchanged prices.
2.3 The concept of the ‘basis’ between CDS and bonds
In general, both sovereign CDS and government bonds offer investors exposure to the risk and return of
sovereign debt. The basis is defined as the CDS spread minus the credit spread on a fixed-rate bond of
similar maturity. In a basis trade, investors set up a default-risk free position by combining a bond
position with a CDS trade in order to directly profit from potential price differences. With unimpeded
access to sufficient funding (e.g. lending from prime brokers) arbitrage should over time reduce any
differentials between the two market segments. Hence, differences between the market prices of bonds
and CDS can provide information on the potential existence and size of arbitrage opportunities which
should typically be very small if credit markets are functioning normally (cf. JP Morgan, 2009).
15
To exploit a negative basis an arbitrage trader has to finance the purchase of the underlying bond and buy
protection in the CDS market. In this case, default risk arising from the underlying entity is fully removed
from the resulting position. For a positive basis a trader short-sells the underlying bond and sells CDS
protection. Hence, if the bond is cheaper than the CDS, the investor should buy the bond and buy CDS
protection to “lock in” a risk-free profit and vice versa. These two cases are summarised in the following
table:
CDS > Bond Spread
(‘positive Basis’)
CDS < Bond Spread
(‘negative Basis’)
Strategy
Sell CDS protection and
bond
Buy CDS protection and bond
Observed for
Most sovereigns
Corporates since crisis
Empirical analysis on the basis during the crisis so far only covers corporate bonds. Fontana (2010) and
Barot and Guo (2010) show that after the outbreak of the crisis, the basis between CDS and bonds has
become persistently negative. Because of the funding liquidity shortage and the increased counterparty
risk in the financial sector trading on the negative basis trade is difficult to implement in practice. Hence
during periods of distress CDS spreads and bond spreads can depart from their arbitrage-free values due
to the liquidity and CDS counterparty risk faced by financial intermediaries and investors.
2.4 Time series of the basis measure
With the dramatic repricing of risk from September 2008 on, credit markets came under severe stress,
which was reflected in both high levels and high volatility of the basis. Chart 5 plots the basis estimate.
15
The perspective taken by the basis measure is exactly the opposite of that taken in the calculation of the „non-default
component‟ in credit spreads (Longstaff et al., 2005), which subtracts the CDS from the bond spread. See also Blanco et al.
(2005).

11
As already discussed in the context of chart 3, for seven out of ten countries the basis is positive, i.e. the
CDS spread always exceeds the bond spread. Here, the mechanism of “flight to liquidity” might have
played a role in driving down bond spreads. Simultaneously, however concerns about fiscal expansion
drove CDS spreads up. The overall effect then was a positive spike in the basis. For such a situation,
arbitrage is difficult to implement as it requires short-selling the bond and selling CDS protection. Given
that liquidity in government bonds and market functioning are very heterogeneous, this positive basis
therefore is rather costly to trade on (see also Barclays Capital, 2010b).
In contrast, the basis for Ireland, Greece and Portugal differs from the other seven countries as there are
some negative observations. A negative basis arises when the spread on the government bond is higher
than the CDS spread. Such a difference could in theory be arbitraged away by buying the bond and
simultaneously buying protection in the CDS market. However, this strategy requires funding for the
bond position. Hence, in periods of market turbulence, traders may be unable or unwilling to enter such a
position. In particular, due to the price volatility, haircuts for the position are quite volatile and may be
sizable.
16
Chart 5 also shows the impact of the increased concerns about the fiscal situation of a number of euro
area countries on the basis. Furthermore, the charts and the table show the high volatility in the basis with
sharp swings materialising in particular from April 2010 on. This volatility implies that the risk-return
relation of the basis arbitrage trade was also not constant. The charts provide further evidence of a
structural break as the basis was relatively constant around 20 to 30 BP during the first part of the sample.
Parts of this deviation could be also related to „cheapest to deliver‟ options in the CDS contract (cf. JP
Morgan, 2009) as well as to measurement issues for the risk-free rate and the impact of the mismatch in
exchange rates between CDS in USD and euro-denominated bonds.
Comparing corporates to sovereigns indicates that the relationship between bonds and CDS to some
extent depends on the type of the underlying debt. Corporate debt typically has a negative basis, which is
strongly mean-reverting (cf. Fontana, 2010 or Bharot and Guo, 2010). In contrast, we have documented
that Euro area sovereigns with the temporary exception of Ireland, Greece and Portugal have a positive
basis.
2.5 Factor analysis of the sample
We apply factor analysis to evaluate the extent of common variation across CDS, bond spreads and the
basis. Table 4a shows the proportion of the total variance explained by the first factor respectively for
weekly changes in CDS, weekly changes in bond spreads, and weekly changes in the basis. The sample
periods are 2 January 2006 to 12 September 2008 (“period I) and 15 September 2008 to 28 June 2010
(“period II”).
Comparing the results across assets, we find that the strongest common factors are present in changes in
CDS and bond spreads. In these two categories, the proportion of the total variance explained by factor 1
16
Gorton and Metrick (2009) argue that due their importance in repo market haircuts are a central mechanism of the financial
crisis.

12
exceeds 80%. Overall, after September 2008, the analysis indicates the presence of significant common
components for all categories of series as the weight of the first factor is always higher than 60%. The
table also illustrates the structural break in both CDS and the basis where the increase in the role of the
common factor grows strongly from period I to period II. In contrast, the weight of the common factor in
the first differences of bond spreads declines after the collapse of Lehman in September 2008.
Overall, factor analysis shows that a common factor plays a large role in the variation in sovereign CDS
spreads and credit spreads. The existence of such a strong common determinant in Euro area sovereign
debt markets is a stylised fact in the empirical literature. As Sgherri and Zoli (2009, P.10) write “…
unanimous consensus in the literature that euro area government bond spreads are mostly driven by a
single time-varying common factor, associated with shifts in international risk appetite.”
3.
Econometric analysis
3.1 Regression Methodology
As the previous discussion has shown, fundamentals as well as changes in risk appetite with regard to
sovereign risk may be among the underlying drivers of the variation of CDS spreads as well as spreads on
government bonds. In the literature on credit spreads, researchers commonly use as a theoretical
framework the structural model introduced by Merton (1974), which is oriented towards the analysis of
corporate credit risk.
17
Gapen et al. (2005) extend this structural modelling approach towards sovereign
credit risk, thereby providing a contingent-claims based valuation of default risky government bonds.
Specifically, Gapen et al. (2005) argue that key drivers of the risk of sovereign default are the volatility of
sovereign assets and a country‟s leverage. Hence, many of the theoretical results which are relevant for
corporate credit risk are indeed also applicable to sovereign credit risk.
Our main aim is to investigate whether the same set of factors is priced in CDS spreads as well as in bond
spreads. We start with a set of explanatory variables which comprises proxies for credit risk and for the
movement of the risk-free rate. Furthermore, we include some factors, which previous research has found
to be significant determinants of credit spreads (see e.g. Collin-Dufresne et al., 2001, Campbell and
Taksler, 2003, Raunig and Scheicher, 2009 or Ericsson et al., 2009). In section 3.3 we then extend this set
of variables. We will also build on this set of variables to study the determinants of the basis in section
3.4.
Risk-free rate
According to the Merton (1974) model changes in the risk free rate in general are negatively related to
credit spreads. A rising risk-free rate decreases the present value of the expected future cash flows, i.e. the
price of the put option decreases. Furthermore, a rising risk-free rate tends to raise the expected growth
rate of the firm value and hence a higher firm value becomes more likely. In turn, this implies a lower
price of the put option on the firm value. Hence, these two effects should lower the credit spread. As a
Euro-wide homogeneous proxy we use the Euribor three-month short rate.
17
Capuano et al. (2009) discuss recent advances and challenges in credit risk modelling.

13
Risk appetite (RA)
As already discussed in the previous section credit spreads not only compensate investors for pure
expected loss (see also Hull et al., 2005). Hence, spreads may change due to changes in investors‟ risk
aversion even if the underlying fundamentals (i.e. the pricing under the “statistical measure”) are
unchanged. We use the VIX index of implied S&P 500 volatility. In order to calculate a proxy for risk
appetite, we deduct a GARCH-based estimate of volatility from the VIX index. This estimate represents
the risk premium which investors in equity options require in order to compensate them for equity market
risk.
Corporate CDS premium (iTraxx)
Given that credit spreads compensate investors for more than pure expected loss we include a measure of
aggregate credit market developments, namely the iTraxx Main Investment Grade index. The premium on
this CDS index should also contain a proxy for investors‟ overall appetite for credit risk.
Proxy for a country‟s public debt (Debt)
In structural models of sovereign credit risk (Gapen et al., 2005) a firm‟s leverage defined as the ratio of
debt to its assets is a major risk factor. This risk factor is also acknowledged in a fiscal policy perspective
as the EU‟s Stability and Growth Pact aims to cap a country‟s total debt at 60 % of its GDP. As a proxy
we use a country‟s total outstanding bonds relative to its GDP. This choice of variable is motivated by
data availability as the amount of bonds outstanding is available in Bloomberg on a monthly frequency.
18
We expect that higher debt increases changes in CDS spreads. For bonds, in a market with elastic demand
this variable also reflects bond market liquidity because a larger bond market generally contributes to
lower transaction costs. However, if overall supply of new issuance exceeds existing demand, then there
could also be an adverse impact on bond market liquidity. We expect the second effect to be primarily
relevant for bond spreads.
Idiosyncratic equity volatility (VOL)
In the structural credit risk model of Gapen et al. (2005) the volatility of sovereign assets is a major factor
in determining a country‟s default risk. Campbell and Taksler (2003) find that the variation in US
corporate spreads is more strongly linked to idiosyncratic stock price volatility than to aggregate stock
price volatility. Following this result we use the idiosyncratic volatility which we calculate as the
annualised GARCH (1, 1)-volatility of idiosyncratic stock returns (defined as a country‟s stock returns
minus Datastream euro are stock index). We expect that higher volatility raises spread changes.
Bid–ask spread (Bid_Ask)
Tang and Yan (2007) show that the bid–ask spread is significantly positively related to CDS spreads. As
there are no reliable data on issuer-specific sovereign CDS market liquidity we include the bid-ask spread
of the iTraxx Main Investment Grade index. This variable should reflect common patterns in the CDS
market liquidity.
18
We use linear interpolation to obtain weekly observations.

14
As chart 3 has indicated, there is substantial heterogeneity in our sample both across time but also across
countries. In order to deal with the first characteristic we estimate separate regressions for the two sub-
samples which we also used for the descriptive statistics in section 2. For the second type of
heterogeneity, we create a dummy (“D”) for the group of countries where the market perceives public
finances to be comparatively weak (cf. e.g. Buiter, 2010): Greece, Ireland, Italy, Portugal and Spain.
Furthermore, we differentiate between CDS spreads and bond spreads by using separate regressions. Our
baseline specification is therefore given by
Y
it
= C +
0
VOL
it
+
1
Debt
it
+
2
Risk-free rate
t
+
3
RA
t
+
4
iTraxx
t
+
5
Bid_Ask
it
+
0
D
VOL
it
+
1
D
Debt
it
+
2
Risk-free rate
t
+
3
RA
t
+
4
iTraxx
t
+
5
Bid_Ask
it
+
it
(1)
with Y
it
a vector of dimension ten representing the spread of the CDS or the bond of country i at time t.
Table 5 and chart 6 summarise the explanatory variables and the corresponding signs that we expect for
the respective estimates of the parameters. The effects of the factors are evaluated by means of a standard
panel regression approach using the change in the CDS spreads or bond spreads as the dependent variable
and also incorporating country fixed effects. The regression system is estimated with robust standard
errors. We will use a similar methodology for our analysis of the basis.
3.2 Overall results for spread changes
We estimate the baseline regression as given in equation (1) for the two sample periods, 1 January 2006
to 12 September 2008 („period I‟) and 15 September 2008 and 28 June 2010 („period II‟). From the panel
regression analysis shown in Table 6a and Table 6b, several results are notable.
We find some differences between the determinants of CDS spreads and bond spreads. Although
both markets show a strong linkage to the iTraxx index, the relation is stronger for CDS than for
bonds. Hence, credit market developments are a significant factor in the variation of Euro area
sovereign spreads. In particular, the iTraxx corporate index is significant with a positive sign in
both subperiods. Given that the iTraxx index is also a CDS spread, it seems plausible that this
variable also picks up other CDS-market related information. More generally, a similar finding
has been obtained by Haugh et al. (2009) who show that the spread on US high yield corporate
bonds is an important explanatory variable for the spreads on euro government bonds.
Since September 2008 the sovereign bond market prices country – specific factors. In the second
subperiod, bond spreads are significantly positively linked to changes in a country‟s ratio of
bonds outstanding over GDP whereas this is not the case for CDS spreads.
The dummy D for the subgroup of countries has a significant impact. Among the interaction
effects, the credit market as represented by the iTraxx index plays the largest role. In particular,
the effect is positive and highly significant, indicating that CDS spreads and bond spreads of
Greece, Ireland, Italy, Portugal and Spain react even stronger to market-wide developments.
Global risk aversion is a significant determinant. The difference between US implied and
historical volatility has a weakly positive effect only on the countries captured by the interaction
dummy.

15
Although the R squared for the second period by far exceeds the value for the first period, it
nevertheless indicates a sizable unobserved component in CDS spreads which accounts for more
than 75 % of the variation of CDS spreads.
Overall credit market information is a major factor in market pricing whereas equity-market volatility and
debt measures do not play an important role. Furthermore, we find that CDS spreads of the dummy
subgroup of countries are linked to a proxy for global risk appetite. The regressions also confirm that
before the crisis, market prices were less strongly linked to fundamental determinants or global
information.
Finally, we perform a factor analysis of the regression residuals. As Collin-Dufresne et al. (2001) show,
residuals of corporate credit spreads still show a significant co-movement despite the fact that the
regression specification has captured a wide variety of determinants. Table 4b allows us to compare the
strength of the common factor across the different markets. Overall, the weight increases from period 1 to
period 2. We find that the first principal component exceeds 40 % in both sub-periods for all residuals.
3.3
Further results for spread changes
In order to extend our benchmark regression described above we analyse a number of additional
determinants.
Idiosyncratic equity returns (R)
Following Collin-Dufresne et al. (2001) we use stock returns as a proxy for the overall state of a country‟s
economy. For the purpose of a clearer identification, we use a country‟s idiosyncratic stock returns rather
than its total returns. We define a country‟s idiosyncratic stock returns as the difference between its stock
returns and the market-wide stock return as represented by the Datastream euro area stock index. All
returns are calculated as first differences of log index values. Our hypothesis is that a positive country-
specific equity return leads to a decrease in the country‟s spreads.
EONIA (EONIA)
As an alternative measure of the short rate we use the EONIA rate, which is the overnight rate for
unsecured interbank borrowing in the euro area.
Implied volatility index (VIX)
In the extended specification we use the VIX rather than the iTraxx and the risk aversion estimate
extracted from the VIX, as the VIX itself was shown to be a significant determinant of sovereign credit
risk by Pan and Singleton (2007)
Slope of the term structure (SLOPE)
In the Longstaff and Schwarz (1995) structural credit risk model with stochastic interest rates, a rising
slope of the term structure lowers credit spreads. In this model, in the long run, the short rate converges to
the long rate. Hence an increasing slope of the term structure should lead to an increase in the expected
future spot rate. This in turn, will decrease credit spreads through its effect on the drift of the asset value
process, assuming that there are no significant term premia. We assume that a similar effect may hold for

16
sovereign spreads and define the slope of the term structure as the difference between the ten-year euro
swap rate and the three-month Euribor rate.
Exchange rate uncertainty (USDVOL)
Given that we use US$-denominated contracts, variation in the Euro-US$ rate may also influence the
variation in CDS spreads. In particular, higher uncertainty about future variation of the Euro-US$ rate
may also have an impact on CDS spreads. For this purpose, we use the implied exchange rate volatility as
a control variable. Our data source is the EVZ volatility index provided by CBOE. This index follows the
approach for the VIX index. We expect the implied exchange rate volatility to have a positive effect on
CDS spreads as higher uncertainty about the future path of the exchange rate should make protection
more costly.
Our extended panel specification is therefore given by
Y
it
= C +
0
R
it
+
1
VOLA
it
+
2
DEBT
it
+
3
VIX
t
+
4
Eonia
t
+
5
Slope
t
+
6
USDVOL
t
+
0
D R
it
+
1
D
VOLA
it
+
2
D
LEVERAGE
it
+
3
D
VIX
t
+
4
D
Eonia
t
+
5
D
Slope
t
+
6
D
USDVOL
t
+
it
(2)
Results for this specification are given in table 7. We concentrate on the second subperiod as the previous
analysis has shown that in the first period, market pricing was less strongly related to fundamentals.
Overall, replacing iTraxx and risk aversion by the VIX leads to more or less unchanged estimates
compared to the base-case model. Among the three additional variables, the EONIA rate and the
idiosyncratic returns are not significant, but the slope has a significantly negative impact on CDS and
bond spread changes with the size of the coefficient being almost identical. The implied exchange rate
volatility has an effect only when interacted with the country subgroup representing Greece, Ireland, Italy,
Portugal and Spain. Hence, only the CDS spreads of the subgroup of countries are significantly linked to
exchange rate variation.
As an alternative measure for market liquidity we evaluate the explanatory value of the proxies based on
the number of unchanged price quotations (see also section 2.2 and chart 4). The results (omitted for
reasons of space) show that both sets of variables do not have a significant effect in the regression
analysis.
3.4 Lead-lag analysis of bond spreads and CDS
We focus on the lead-lag relationship in order to measure the adjustment process between CDS and bond
spreads. Hence, we can analyse whether the derivative market or the cash market leads in the pricing
process. Given the shift in the behaviour of CDS spreads and bond spreads after Lehman‟s default we
split the sample again into two periods. In order to obtain a better overview of pricing dynamics we
analyse daily rather than weekly CDS and bond spreads.

17
As a first step, we verify the unit-root non-stationarity of the CDS and bond spread series
19
. The existence
of a cointegration relationship between the levels of two I(1) variables means that a linear combination of
these variables is stationary. Cointegrated variables move together in the long run, but may deviate from
each other in the short run, which means they follow an adjustment process towards equilibrium. A model
that considers this adjustment process is the Vector Error Correction Model (VECM)
20
.
The Vector Error Correction Model is specified as follows:
t
q
j
j
t
j
j
t
p
j
j
t
t
BondSpread
CDS
Z
CDS
1
1
1
1
1
1
1
)
(
(3a)
t
q
j
j
t
j
j
t
p
j
j
t
t
BondSpread
CDS
Z
BondSpread
2
1
2
1
2
1
2
)
(
(3b)
1
1
0
1
1
t
t
t
BondSpread
CDS
Z
(3c)
Equation (3a) and (3b) express the short term dynamics of CDS and bond spread changes.
21
Z
t-1
is the
error correction term given by the long run equation (3c) that describes deviations of CDS and bond
spreads from their approximate no-arbitrage relation.
If the cash bond market is contributing significantly to price discovery, then λ
1
will be negative and
statistically significant as the CDS market adjusts to incorporate this information. Similarly, if the CDS
market has an important role in price discovery, then λ
2
will be positive and statistically significant
22
. If
both coefficients are significant, then both markets contribute to price discovery. The existence of
cointegration between CDS and bond spreads implies that at least one market has to contribute to price
discovery and the other has to adjust
23
.
We proceed as follows. We test for cointegration between the CDS and spread bond for each single
country. Where we find cointegration we study the lead-lag dynamics by means of the bivariate VECM
and we analyse the statistical and economic significance of the coefficients λ
1
and
λ
2
. This approach
attributes superior price discovery to the market that adjusts least to price movements in the other market.
Results are shown in table 8.
24
19
We apply the augmented Dickey-Fuller test to each of the 10 Sovereign CDS and bond spread series, independently. We do not
report results for brevity. As expected, the test does not reject the null hypothesis of a unit root for all series in their levels,
but it does for all series in their first differences, i.e. all series are integrated once, I(1).
20
Cointegration analysis is carried out in the framework proposed by Johansen (1988, 1991). This test is essentially a
multivariate Dickey-Fuller test that determines the number of cointegrating equations, or cointagrating rank, by calculating the
likelihood ratio statistics for each added cointegration equation in a sequence of nested models.
21
We specify the model with the optimal number of lags for each cointegrating relation.
22
The idea is that if the error term of the equilibrium long-run regression is predicting changes in CDS, in the short run
regression, it means that bond prices move generally first; if the error is positive the CDS is above its value implied by the
equilibrium relation and it has to adjust downward, i.e λ
1
is negative. Instead, if the error term of the equilibrium long-run
regression is predicting changes in bond spreads it means that CDS move generally first; if the error is positive the bond
spread is below its value implied by the equilibrium relation and it has to adjust upward, i.e. λ
2
is negative.
23
This relation is an implication of the Granger representation theorem (Engle and Granger 1987).
24
When both λ
1
and
λ
2
are significant we use the measure of Gonzalo and Granger (1995) defined as the ratio
1
2
2
. If the
CDS market dominates the Granger-Gonzalo measure will be close to 1 while if the bond market dominates price discovery
then the measure will be closer to zero.

18
Before the crisis
From the cointegration analysis performed on each country, we find that CDS and bond spreads are not
cointegrated. We apply the Granger causality test on CDS and bond spread changes, but again no lead-lag
relation is detected. Finally, correlation analysis does not indicate econometric evidence of a relationship
for most of the countries.
For this result, one potential explanation is that the parity between CDS and bond spreads approximately
holds in the sense that the size of the basis is similar for the two groups of countries. However, probably
in part due to low trading activity in the CDS market before the crisis CDS spreads are relatively constant
(cf. table 1 and chart 3). Arbitrage forces do not come into play, i.e. CDS and bond spreads move in an
unrelated manner because they do not move outside the arbitrage bounds determined by transaction costs.
Since September 2008
As shown by the trace test statistics for CDS and bond spreads, all country pairs are cointegrated in the
second part of our sample. For Germany, France, the Netherlands, Austria and Belgium λ
1
is statistically
significant and has a negative sign, while λ
2
is not significant, meaning price discovery takes place into
the cash market. The λ
1
coefficient for Germany, the Netherlands and Austria is quite substantial and is
approximately - 0.2; for France and Belgium it is smaller, namely - 0.005. For Italy, Ireland, Spain,
Portugal and Greece λ
1
is not significant and λ
2
is significant and positive, implying that the derivatives
market is leading in price discovery and the cash market adjusts. The λ
2
coefficients for Italy and Ireland
are approximately 0.02, while for Spain, Portugal and Greece they are slightly larger, on average 0.5.
Overall our results illustrate that the market for sovereign CDS was very quiet before the peak of the
crisis in fall 2008. Since the start of the crisis, with a dramatic re-pricing of risk, for Germany, France, the
Netherlands, Austria and Belgium the cash market has a predominant role in price discovery. In the case
of Italy, Ireland, Spain, Greece and Portugal CDS markets are playing a major role in terms of price
discovery. Price discovery occurs in the market where informed investors trade at most. CDS are
unfunded instruments so they are the cheapest way to trade credit risk. Because of their synthetic nature
they do not suffer from the short-sales constraints in the cash market, and buying (or selling) relatively
large quantities of credit risk is less difficult (Blanco et. al 2005). However, this price discovery process
does not necessarily give rise to systematically profitable opportunities. We evaluate the size of these
potential arbitrage opportunities in the next section.
3.5 Regression analysis of the basis
As shown in chart 5, the basis has deviated from the long run average of about 30 bps since the onset of
the crisis in August 2007 and it has increased dramatically after the Lehman collapse in September 2008.
This raises the question to what extent market frictions and risk factors influence basis trading which
ought to make the no-arbitrage relation between CDS and bonds hold. One explanation for the persistent
non-zero basis is that CDS, which are derivatives contracts, and bonds, which are cash instruments, are
exposed to different risk factors. In principle, taking credit risk by purchasing a corporate bond or by
shorting a CDS on the reference entity is equivalent. However, from a trader‟s perspective bonds and

19
CDS are not perfect substitutes: Bond prices are affected by interest rate risk, default risk, funding risk
and market liquidity risk, whereas CDS spreads are affected, mostly, by default risk and counterparty risk.
When the basis is positive government bonds are more expensive than CDS (i.e. bond spreads are lower
than CDS). Arbitrageurs may profit from this situation by implementing a positive basis trade, short-
selling the bond, and writing CDS protection. However, in practice it might be costly to obtain the bond
via a repo transaction in order to short-sell it. At the same time, a situation in which repo rates are very
low and highly rated bonds might be difficult to obtain in order to short-sell makes it costly for protection
writers to hedge their positions.
During stress periods for government bonds, which are usually perceived as safe assets, liquidity might
play a major role in driving prices up, hence yield spreads would decline through „flight to liquidity„
effects. In contrast, deteriorating market liquidity might contribute to increasing the yields of those
government bonds which are perceived to face non-negligible default risk. Hence, the dynamics of the
sovereign CDS-bond basis may have shifted during the crisis due to „flight to liquidity‟ effects which
have had a heterogeneous impact on euro area countries. Counterparty risk might also affect the basis
dynamics as the CDS spread is affected by the creditworthiness of protection providers, i.e. major banks.
Once risk in the inter-bank sector increases default protection is perceived as less valuable.
Given that we use US$-denominated CDS contracts, variation in the Euro-US$ rate may also influence
the variation in CDS spreads. It seems plausible that the implied exchange rate volatility has a positive
effect on CDS spreads as higher uncertainty about the future path of the exchange rate should make
protection more costly. Since the protection buyer, in case of the default of the underlying, is
compensated in US$, the value of protection in US$ would have a higher value if the Euro is expected to
depreciate.
Overall, we adapt the set of variables from the previous subsections to the analysis of the basis. These
variables and their expected signs are summarised in Table 9. The Euribor-Eurepo three-month spread is
expected to have a positive impact on the basis. When the repo rate is lower that the Euribor, it is costly to
implement a positive basis trade which implies short-selling the underlying bond obtained via repurchase
agreement
25
and selling protection. The risk aversion estimate extracted from the VIX (RA) is expected to
have a positive impact on the basis, since CDS are more volatile and sensitive to shifts in risk appetite.
The uncertainty in the Euro-US$ exchange rate may influence the basis, since it is an additional source of
risk for the dealer providing protection on a European entity in US$. For this purpose, we again use the
implied exchange rate volatility USD_VOL as a control variable. We expect the implied exchange rate
volatility to have a positive effect on CDS spreads as higher uncertainty about the future path of the
exchange rate should make protection more costly.
The iTraxx Financials CDS index is expected to have a negative impact on the basis. This variable
captures the CDS market‟s assessment of major European financial institutions. Since major banks are
protection providers the index premium at least partly represents counterparty risk implicit in sovereign
25
The cost of a positive basis trade is the difference between the repo rate gained on the repo transaction and the Libor rate which
has to be paid on the shorted bond.

20
CDS contracts. In this sense CDS are expected to have a discount with respect to the bond spread when
the likelihood of the protection seller‟s default is non-negligible.
As discussed before, the ratio of the amount of bonds outstanding to GDP (Debt) represents a measure of
leverage, hence it captures the fiscal fundamentals, but it also potentially captures bond market liquidity
effects. Depending on the market environment, this variable can play different roles in the explanation of
the basis. On the one hand, in a market with elastic demand this variable generally reflects bond market
liquidity as a larger bond market generally contributes to lower transaction acts. On the other hand, if the
overall supply of newly issued bonds exceeds existing demand, then there could also be an adverse
impact on market liquidity, leading to an increase in the liquidity premium of bond spreads. We again use
the idiosyncratic equity volatility (Vol) as a second measure of country fundamentals. An increase in
idiosyncratic equity volatility captures a deterioration of country specific credit risk and is expected to
have a positive impact both on CDS and bond spreads, so the impact on the basis is ambiguous.
We estimate the regression as given below again for the two sample subperiods:
Basis
it
= C +
0
Basis
it-1
+
1
(Euribor-Eurepo)
t
+
2
RA
t
+
3
log(USD_VOL)
t
+
4
log( iTraxx
Financials)
t
+
5
log(Debt)
it
+
6
log(Vol)
it
+
1
D*(Euribor-Eurepo)
t
+
2
D* RA
t
+
3
D *
log(USD_VOL)
t
+
4
D* log(Itraxx Financials)
t
+
5
D *log(Debt)
it
+
6
D *log(Vol)
it
+
it
(4)
From the results in Table 10, two main points emerge. First, more factors are significant in the second
period than in the first period as it has also been the case to some extent for the CDS and bond spread
changes. Second, the dummy D for the subgroup of countries has a significant impact in the case of an
aggregate proxy (iTraxx Financials) and a country specific variable (total debt).
In addition we note the following results.
The basis is mean reverting. Deviations between CDS and bond spreads tend to decline. The
coefficient on the lagged basis is approximately 0.85 before and 0.73 during the crisis.
In the crisis sub-period, the Euribor-Eurepo spread rate has a positive (14.65) and significant
impact on the basis. This spread measures the cost of shorting a bond in a positive basis arbitrage
trade; this effect is homogeneous across all countries.
Proxies for aggregate risk appetite are a significant factor in the variation of the basis. In
particular, the S&P 500 risk aversion is significant with a positive (0.23) coefficient during the
crisis. Hence, an increase in US equity risk aversion raises the basis which is at least partly
related to the significant effect of the S&P 500 risk aversion on CDS spreads observed in section
3.2. This finding is in contrast to results for the corporate basis (Fontana, 2010).
In contrast to our hypothesis, the uncertainty in the Euro-US$ exchange rate does not have a
significant impact on the basis dynamics.
Idiosyncratic equity volatility is significantly negatively related (-6.87) to the dynamic of the
basis. This might be due the fact that the positive impact on bond spreads is stronger than on CDS
spreads, as the analysis of spreads in section 3.2 has shown.

21
The group of countries‟ bases without the dummy is not sensitive to the iTraxx Financials level
dynamics while for countries captured by the dummy this linkage is negative (-16.81). This
highlights the heterogeneity among countries in terms of CDS counterparty risk effects.
Protection on countries in the first group is perceived to be less risky while for the countries in
the dummy group the CDS premium is linked to creditworthiness of protection providers. Hence,
an increasing risk assessment of major financial institutions makes CDS protection less valuable.
A decrease of the CDS premium relative to the bond spread then implies a reduction of the basis.
Before the crisis the impact of debt is negative and small (-7.17) for all countries, while during
the crisis there is a crossectional difference in the impact of total debt. The basis of Germany,
France, Netherlands, Belgium and Austria is positively related to the amount outstanding of
bonds divided by GDP (coefficient of 51.93). Our analysis cannot explain the direction of the
causality, since it seems plausible that bond issuance patterns are related to the level of the
interest rates in order to optimise sovereign debt costs and to raise funds for state aid measures. In
contrast, for Greece, Ireland, Italy, Portugal and Spain which on average have lower bases, the
interaction dummy indicates an overall negative impact of the amount of bonds outstanding (total
coefficient of -12.48 = 51.93 – 64.41). As shown in the time series of the debt variable in chart 6,
governments have issued substantial amounts of debt in the period following the Lehman collapse
and the subsequent recovery in March 2009. Larger amounts of outstanding bonds may have
deteriorated bond liquidity, driving bond spreads up beyond CDS spreads, hence the basis has
become smaller and in some cases negative.
The adjusted R squared for the first and second period are respectively 0.95 and 0.75.
In sum, we find that during the crisis period the sovereign bases are mean reverting and significantly
linked to the cost of short-selling bonds, to proxies for global risk appetite and to country-specific factors.
We also find crossectional differences in the effect of counterparty risk and debt outstanding.
3.6 Further results for the regression analysis of the basis
In order to extend our benchmark regression described above we use a number of additional determinants.
Stock market trading volume (equity volume)
This variable captures country specific stock market liquidity conditions, which are expected to be
correlated with country specific bond market liquidity and hence also with the basis. One reason for using
this indirect proxy is that the segmentation of trading across a number of fixed income platforms means
that there is no reliable information on market turnover. For each country we use data for trading volumes
on a major stock index (e.g. for Germany we use the DAX or for Italy the FTSE MIB). A decrease in
equity trading volume captures the deterioration of country specific market liquidity and is expected to
drive bond spreads larger than CDS spreads. As the mean of the basis is positive, the relation between the
basis and stock market volume is expected to be negative.
Outstanding stock of U.S. dollar financial commercial paper (CP fin outstd)

22
Given that financial institutions use a substantial amount of short-term borrowing to fund their trading
operations, this variable measures the availability of market-based funding for trading operations, (see
also Adrian, Etula and Shin, 2010). Due to the lack of comparable data for Europe we use data from the
Federal Reserve Bank of New York. If the volume of CP increases, we would expect the basis to decline
towards zero as the funding allows for increased arbitrage operations.
Volume of term repurchase agreements (Term Repo Outst)
The volume of term repos is an alternative measure of potential leverage constraints for major financial
institutions. This variable represents repo transactions for the New York Federal Reserve‟s primary
dealers. The typical horizon of these operations is overnight, but the Fed can also conduct these
operations with terms out to 65 business days. Term-repo volume is not only a measure of market based
funding availability, but it might also reflect the difficulty for arbitrageurs to find government bonds to
short-sell in order to profit from the positive basis.
We estimate the regression as given below again for the two sample subperiods:
Basis
it
= C +
0
Basis
it-1
+
1
(Euribor-Eurepo)
t
+
2
RA
t
+
3
log(USD_VOL)
t
+
4
log( iTraxx
Financials)
t
+
5
log(Debt)
it
+
6
log(Vol)
t
+
7
log(Cp Fin Outst)
t
+
8
log(Term Repo Outst)
t
+
9
log(Equity Volume)
t
+
1
D*(Euribor-Eurepo)
t
+
2
D* RA
t
+
3
D * log(USD_VOL)
t
+
4
D*
log(Itraxx Financials)
t
+
5
D *log(Debt)
it
+
6
D *log(Vol)
it
+
7
D *log(Cp Fin Outst)
t
+
8
D *log(Term
Repo Outst)
t
+
9
D *log(Equity Volume)
t +
it
(5)
The introduction of these new variables does not materially affect the coefficients and the significance of
the variables from the baseline model. Results of the regression analysis are shown in Table 11. Before
the crisis the basis is significantly and positively related to the commercial paper outstanding (13.36).
When U.S. dollar funding liquidity is high, the risk appetite of dollar-funded intermediaries is high and
their required compensation for holding risky assets is low. In such a situation bond spreads are narrow
and the basis is positive. During the crisis, for the dummy group country, the basis is negatively related to
the commercial paper outstanding (-21.81). This indicates that when funding liquidity started to
deteriorate the basis in general has not been affected, but for the dummy country group it widened.
Furthermore, during the crisis, for the dummy group of countries, the basis is positively related to term-
repo (15.52).
26
Finally, the stock market volume does not affect the basis. Hence, it might be the case that
stock market liquidity conditions are already captured by other variables in the regressions, such as the
country specific idiosyncratic equity volatility.
Overall, our analysis in this subsection shows that variables which provide a measure of the availability of
market-based funding affect the sovereign basis dynamics. Results are in line with the idea that financial
institutions use a substantial amount of short-term borrowing to fund their trading operations and that this
structural feature then directly affects market pricing (see also Adrian, Etula and Shin, 2010).
26
We have also tested the overnight repo (short term funding liquidity) variable, but there is no significant effect on the basis.

23
4.
Conclusions
The crisis has led to a wide-ranging discussion on the costs and benefits of CDS. As robust and
significant evidence on many of the questions is not yet available, it seems too early to draw definite
research-based conclusions. Furthermore, a review of these general issues many of which are related to
US subprime assets is beyond the scope of this paper (Stulz, 2010 offers a comprehensive review of the
risks and benefits of the CDS market).
Our first main finding is that the recent repricing of sovereign credit risk seems mostly due to common
factors. Our regressions for CDS and bond spreads separately and the regression analysis of the basis in
some respects lead to similar findings, in particular as regards the driving factors of CDS and bond
spreads and the dynamics of the basis and the evidence for structural breaks since the outbreak of the
crisis.
Second we observe that for most countries the CDS spread exceeds the spread on the corresponding
government bond relative to the swap rate. The exceptions here are Portugal, Ireland and Greece where
we find a temporary negative basis. Since September 2008, market integration for bonds and CDS differs
across countries. In half of the sample countries, price discovery takes place in the CDS market and in the
other half, price discovery is observed in the bond market. In contrast, before the crisis, limited trading
activity in the sovereign CDS market affected price discovery and the linkages between the bond and the
derivative market. Since the start of the crisis period the sovereign bases are mean reverting and
significantly linked to the cost of short-selling bonds, to proxies for global risk appetite and to country-
specific factors. We also find a crossectional difference in the impact of counterparty risk and debt
issuance.
Overall, our results provide further supportive evidence for the existence of arbitrage crashes and slow
moving capital. Deviations from the arbitrage-free parity do not seem to be easily exploitable as market
frictions and structural changes throughout the crisis inhibit traders to arbitrage away these price
differentials. Duffie (2010) discusses how asset prices can differ from the arbitrage-free and friction-less
case when there are significant institutional impediments (i.e. „slow moving capital‟) such that market
participants can not immediately profit from apparent mispricing. According to Mitchell and Pulvino
(2010) during the crisis traders could not exploit arbitrage opportunities such as the large negative basis in
US corporate debt due to restrictions in the availability of capital. Another paper which is closely related
to our analysis is Fleckenstein et al. (2010) who document that a persistent arbitrage opportunity between
US Treasuries and TIPS is partly related to supply factors.
27
The results in this paper support the evidence that there are major commonalities as well as differences
between corporate and sovereign CDS. On the one hand, both markets have witnessed a substantial
repricing with a reassessment of the likelihood of tail events. The repricing of public debt seems to be
driven by strong common factors as well as by country-specific effects. Risk premia play an important
role in the spike in both types of CDS spreads. On the other hand, there are sizable differences. Besides
the potential importance of technical default, the mechanism of „flight to liquidity‟ is a major factor in
27
See also Mercurio (2009). Duarte et al. (2007) provide a general discussion of arbitrage in fixed income markets.

24
public debt markets. This mechanism is supported e.g. by the mechanics of the Basel II capital
requirements where the standardised approach treats government debt with a rating above A+ as risk-free.
Together with the impact of limits to arbitrage, this “flight to liquidity effect” seems to drive a wedge
between CDS spreads and the prices of the underlying government bonds. Comparing our results for
sovereigns to those for corporates, we find a significant difference as private-sector debt typically had a
negative basis (Fontana, 2010) whereas we showed that sovereign debt has a positive basis. This
essentially implies a liquidity premium in corporates and a liquidity discount in sovereigns.
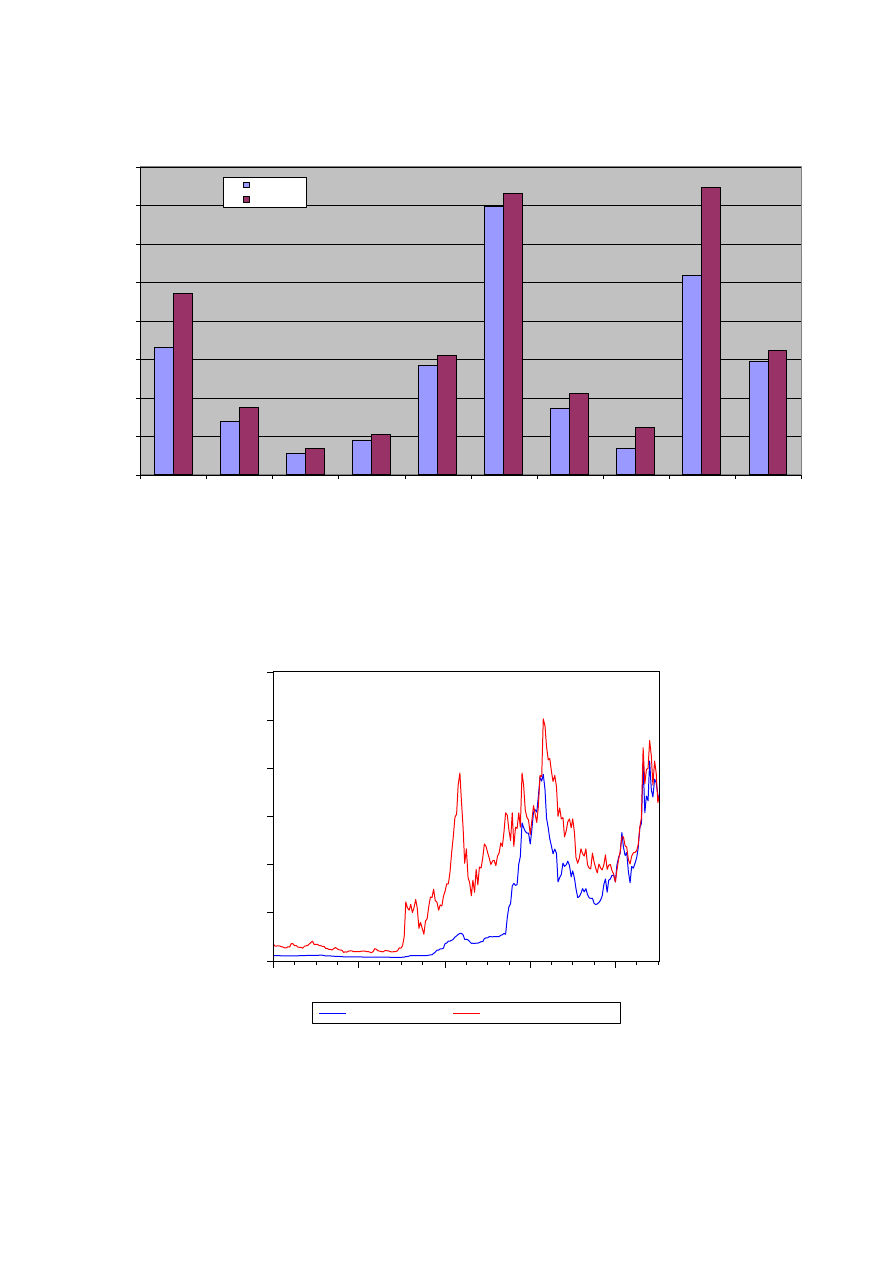
25
Chart 1: DTCC Net notional for Euro area sovereigns relative to volume of bonds outstanding
0%
1%
2%
3%
4%
5%
6%
7%
8%
A
U
ST
RIA
BE
LG
IU
M
FRA
N
CE
G
ERMA
N
Y
G
RE
EC
E
IRE
LA
N
D
IT
A
LY
N
ET
H
ERL
A
N
D
S
PO
RT
U
G
A
L
SPA
IN
6/3/2009
5/3/2010
Chart 2: iTraxx CDS index for European financials vs. West European sovereigns
0
40
80
120
160
200
240
2006
2007
2008
2009
2010
ITRAXX SOVX
ITRAXX FINANCIALS
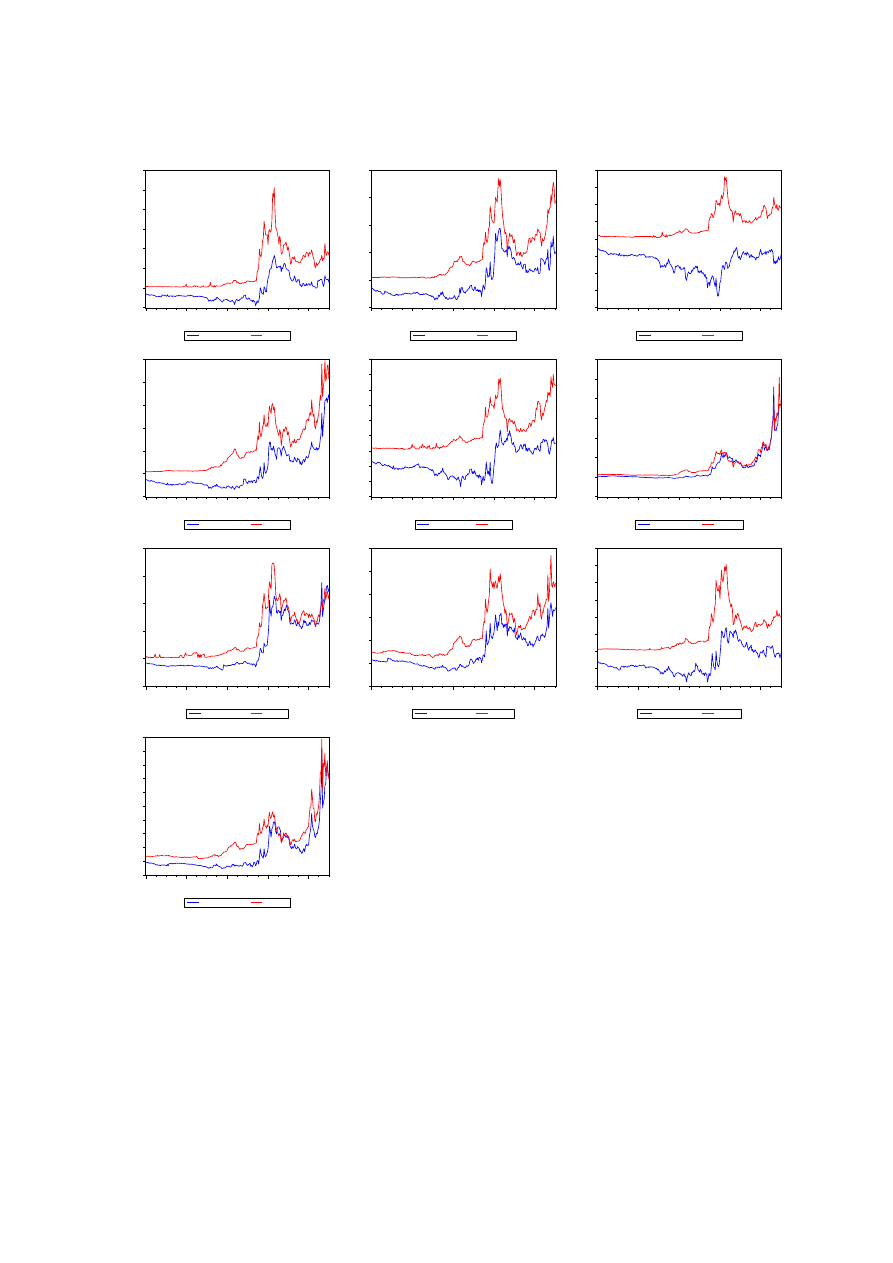
26
Chart 3: CDS spreads and bond spreads for Euro area sovereigns
-50
0
50
100
150
200
250
300
2006
2007
2008
2009
2010
Bond spread AT
CDS AT
-40
0
40
80
120
160
2006
2007
2008
2009
2010
Bond spread BE
CDS BE
-100
-75
-50
-25
0
25
50
75
100
2006
2007
2008
2009
2010
Bond spread DE
CDS DE
-50
0
50
100
150
200
250
2006
2007
2008
2009
2010
Bond spread ES
CDS ES
-60
-40
-20
0
20
40
60
80
100
120
2006
2007
2008
2009
2010
Bond spread F
CDS F
-200
0
200
400
600
800
1,000
1,200
2006
2007
2008
2009
2010
Bond spread GR
CDS GR
-100
0
100
200
300
400
2006
2007
2008
2009
2010
Bond spread IE
CDS IE
-50
0
50
100
150
200
250
2006
2007
2008
2009
2010
Bond spread IT
CDS IT
-50
-25
0
25
50
75
100
125
150
2006
2007
2008
2009
2010
Bond spread NL
CDS NL
-40
0
40
80
120
160
200
240
280
320
360
2006
2007
2008
2009
2010
Bond spread PT
CDS PT
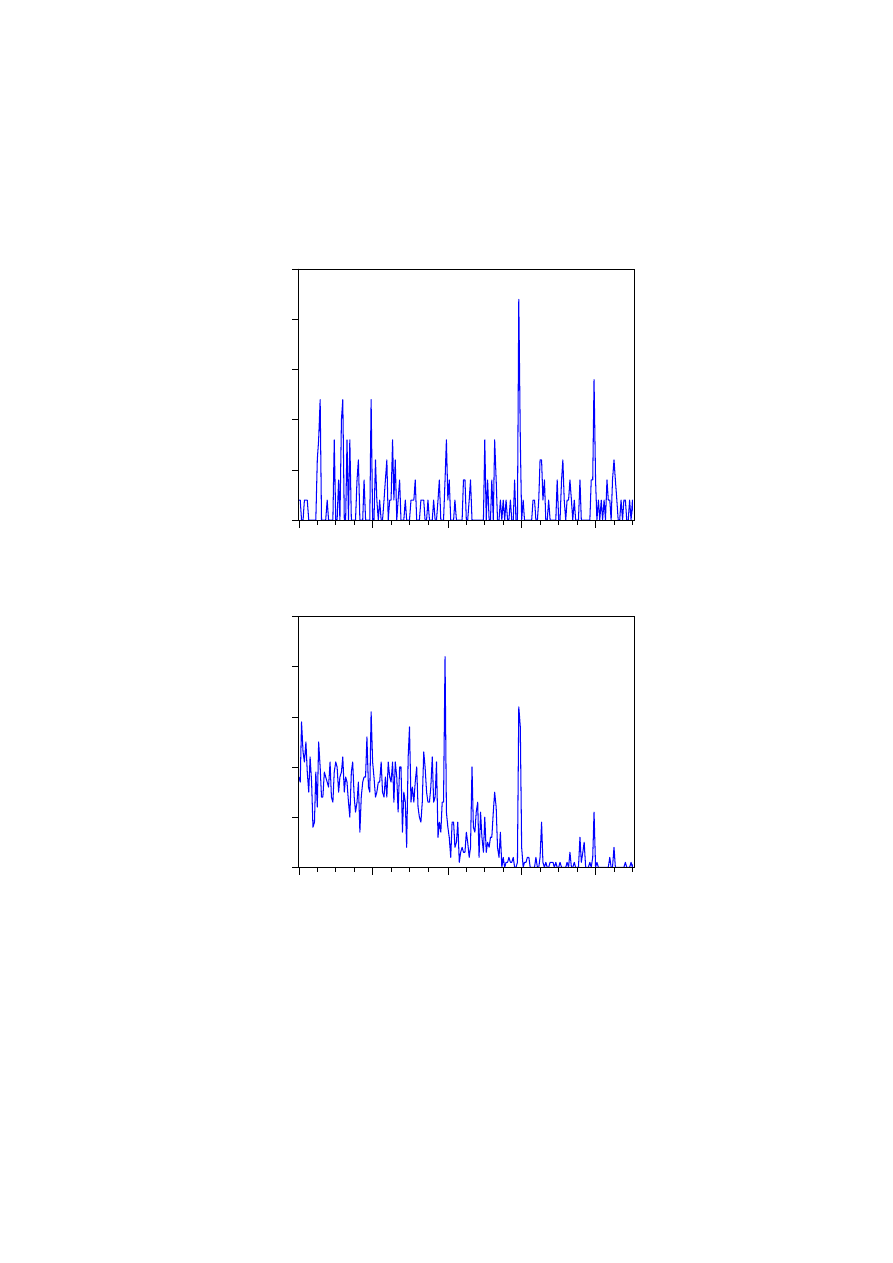
27
Chart 4: Liquidity proxies
The sample period is 1 January 2006 to 28 June 2010. The variable is constructed as the total number of
zero price changes per week. The chart shows the cross country means per week.
.00
.05
.10
.15
.20
.25
2006
2007
2008
2009
2010
Cross-country mean of bond LIQ
0
1
2
3
4
5
2006
2007
2008
2009
2010
Cross-country mean of CDS LIQ
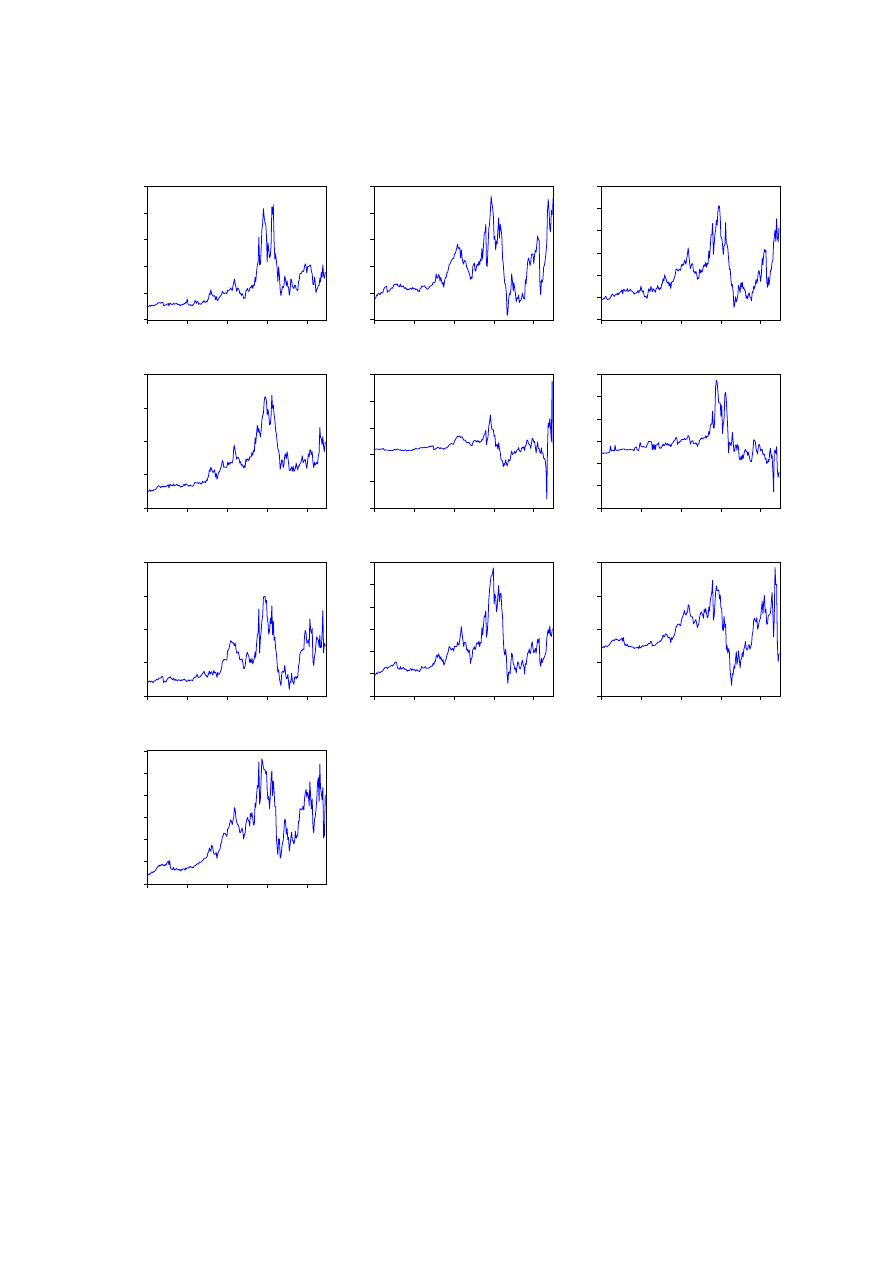
28
Chart 5: Basis (=CDS - bond spread) for Euro area sovereigns
0
40
80
120
160
200
2006
2007
2008
2009
2010
AT
0
20
40
60
80
100
2006
2007
2008
2009
2010
BE
0
20
40
60
80
100
120
2006
2007
2008
2009
2010
F
0
40
80
120
160
2006
2007
2008
2009
2010
DE
-200
-100
0
100
200
300
2006
2007
2008
2009
2010
GR
-100
-50
0
50
100
150
200
2006
2007
2008
2009
2010
IE
0
40
80
120
160
2006
2007
2008
2009
2010
IT
0
20
40
60
80
100
120
2006
2007
2008
2009
2010
NL
-40
0
40
80
120
2006
2007
2008
2009
2010
PT
0
20
40
60
80
100
120
2006
2007
2008
2009
2010
ES
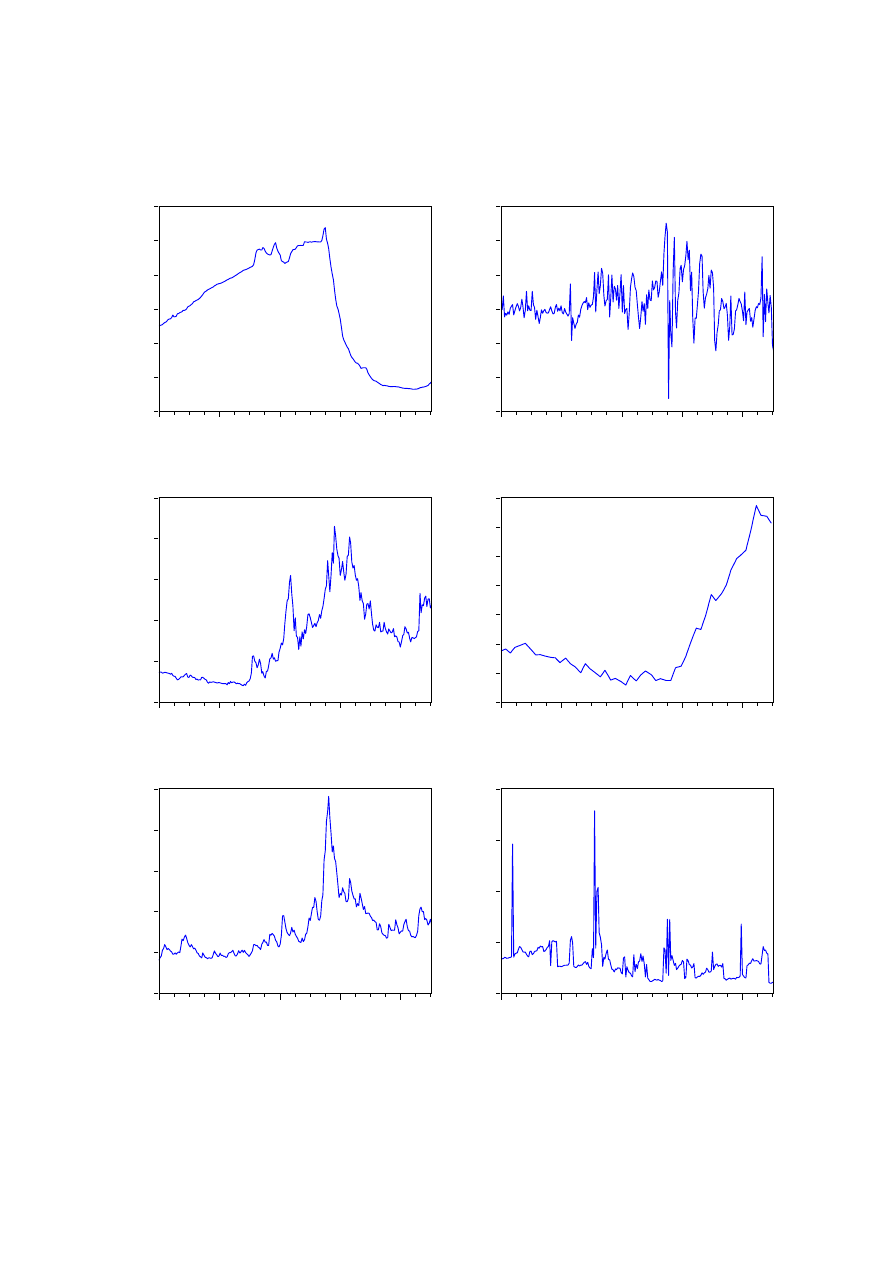
29
Chart 6: Set of explanatory variables for base case regression
0
1
2
3
4
5
6
2006
2007
2008
2009
2010
RISK-FREE RATE
-30
-20
-10
0
10
20
30
2006
2007
2008
2009
2010
RISK AVERSION
0
50
100
150
200
250
2006
2007
2008
2009
2010
ITRAXX 5Y
.44
.46
.48
.50
.52
.54
.56
.58
2006
2007
2008
2009
2010
DEBT
.00
.04
.08
.12
.16
.20
2006
2007
2008
2009
2010
VOL
.00
.02
.04
.06
.08
2006
2007
2008
2009
2010
BID_ASK

30
Table 1: Descriptive statistics of levels of CDS spreads
The sample periods are 1 January 2006 to 12 September 2008 (“period I) and 15 September 2008 to 28
June 2010 (“period II”). All statistics are in basis points.
Period I
Mean
Median
Maximum Minimum
Std. Dev.
N
AUSTRIA
6.75
3.80
19.70
1.90
5.25
141
BELGIUM
10.80
4.40
34.90
2.90
10.02
141
FRANCE
6.99
4.40
19.80
1.90
5.05
141
GERMANY
5.61
3.50
15.00
1.80
3.38
141
GREECE
30.98
25.00
73.20
11.00
16.94
141
IRELAND
14.43
10.79
39.80
2.50
12.05
141
ITALY
27.43
22.70
59.00
11.70
12.49
141
NETHERLANDS
6.21
3.56
19.30
1.80
4.83
141
PORTUGAL
21.51
14.60
56.00
7.50
14.19
141
SPAIN
17.37
7.07
54.20
4.20
16.01
141
Period II
Mean
Median
Maximum Minimum
Std. Dev.
N
AUSTRIA
97.15
86.73
255.26
16.90
42.13
94
BELGIUM
72.08
63.57
148.10
29.50
30.05
94
FRANCE
49.78
44.60
100.28
16.50
20.10
94
GERMANY
39.85
36.68
90.70
12.40
14.94
94
GREECE
251.35
200.89
1018.50
65.80
172.42
94
IRELAND
180.32
170.07
347.30
40.50
57.91
94
ITALY
121.39
113.41
234.18
53.20
39.79
94
NETHERLANDS
53.85
44.93
126.26
15.50
25.65
94
PORTUGAL
116.76
92.65
355.06
47.05
67.97
94
SPAIN
112.88
102.60
247.30
50.90
43.21
94

31
Table 2: Descriptive statistics of government bond spreads
The sample periods are 1 January 2006 to 12 September 2008 (“period I) and 15 September 2008 to 28
June 2010 (“period II”). All statistics are in basis points. The reference rate is the 10-year swap rate.
Period I
Mean
Median Maximum Minimum
Std. Dev.
N
AUSTRIA
-24.64
-22.06
-15.57
-42.14
5.84
141
BELGIUM
-19.61
-19.89
-7.38
-29.10
4.58
141
FRANCE
-25.64
-23.56
-13.35
-46.79
6.87
141
GERMANY
-32.33
-26.73
-13.99
-60.47
11.57
141
GREECE
1.33
2.20
20.16
-13.79
8.25
141
IRELAND
-26.02
-26.53
-11.55
-43.27
5.91
141
ITALY
-2.42
-1.90
12.11
-17.97
7.65
141
NETHERLANDS
-25.72
-23.96
-15.31
-44.32
5.77
141
PORTUGAL
-11.45
-11.61
-2.65
-21.67
4.49
141
SPAIN
28.82
20.07
-11.38
-34.22
5.24
141
Period II
Mean
Median Maximum Minimum
Std. Dev.
N
AUSTRIA
22.18
17.85
90.44
-54.60
30.13
94
BELGIUM
24.98
21.15
82.61
-32.72
21.29
94
FRANCE
-1.51
3.21
28.22
-52.28
18.12
94
GERMANY
-35.61
-27.07
-9.74
-83.41
18.88
94
GREECE
156.86
148.36
362.92
4.12
71.84
94
IRELAND
120.79
129.03
227.83
-39.76
61.27
94
ITALY
59.48
57.04
115.44
-2.05
22.44
94
NETHERLANDS
4.23
4.40
36.40
-53.46
18.82
94
PORTUGAL
53.99
46.28
139.12
-20.12
33.56
94
SPAIN
33.06
34.85
70.29
-27.21
21.89
94

32
Table 3: Descriptive statistics of the basis
The sample periods are 1 January 2006 to 12 September 2008 (“period I) and 15 September 2008 to 28
June 2010 (“period II”). The basis is defined as CDS spread minus bond spread (relative to the 10-year
swap rate). All statistics are in basis points.
Period I
Mean
Median
Maximum Minimum
Std. Dev.
N
AUSTRIA
31.39
26.50
61.04
19.37
10.11
141
BELGIUM
30.41
25.71
56.61
15.60
9.87
141
FRANCE
32.63
27.97
64.59
17.05
11.18
141
GERMANY
37.94
30.15
74.67
19.49
14.53
141
GREECE
29.65
23.58
68.96
13.74
15.16
141
IRELAND
40.45
40.24
62.66
20.34
10.78
141
ITALY
29.86
23.51
66.27
15.46
13.78
141
NETHERLANDS
31.93
27.21
62.32
18.56
9.82
141
PORTUGAL
32.96
26.76
69.38
16.45
15.19
141
SPAIN
28.82
20.73
68.88
7.65
17.38
141
Period II
Mean
Median
Maximum Minimum
Std. Dev.
N
AUSTRIA
76.58
69.01
172.46
35.93
32.16
94
BELGIUM
45.49
45.24
92.57
3.20
23.09
94
FRANCE
49.34
44.51
102.31
11.10
24.09
94
GERMANY
73.65
64.70
135.16
43.62
25.53
94
GREECE
30.58
25.32
273.69
-167.03
53.43
94
IRELAND
47.78
30.96
187.08
-64.24
50.31
94
ITALY
56.99
57.66
119.46
7.71
28.65
94
NETHERLANDS
50.53
42.12
115.23
11.13
25.40
94
PORTUGAL
40.79
46.18
114.03
-27.22
31.99
94
SPAIN
67.1
69.7
112.8
23.4
23.1
94

33
Table 4a: Factor analysis
The sample periods are 1 January 2006 to 12 September 2008 (“period I) and 15 September 2008 to 28
June 2010 (“period II”).
Proportion explained by factor 1 (%)
CDS – period I
72.6
CDS – period II
84.5
Bond spreads – period I
80
Bond spreads – period II
62.4
Basis – period I
64.8
Basis – period II
77.9
Table 4b: Factor analysis
This table reports the results of a factor analysis on the residuals of the baseline regressions (1) of CDS
and bond spread changes on the explanatory variables. The sample periods are 1 January 2006 to 12
September 2008 (“period I) and 15 September 2008 to 28 June 2010 (“period II”).
Proportion explained by factor 1 (%)
Bond residuals – period I
63.2
Bond residuals – period II
43.4
CDS residuals – period I
49.5
CDS residuals – period II
50.1

34
Table 5: Description of explanatory variables and expected signs for parameter estimates
This table reports the variables used in the regressions where the dependent variable is the change in the
CDS spread. The data sources are Bloomberg, Datastream and JP Morgan.
Notation
Definition
Sign
Risk-free rate
Euribor 3 M
(-)
Risk Aversion
VIX index - GARCH volatility
(+)
iTraxx
ITRAXX 5 Y CDS index
(+)
Debt
Bonds outstanding / GDP
(+)
Vol
Idiosyncratic equity volatility
(+)
Bid_Ask
Bid-Ask spread of iTraxx
(+)

35
Table 6a: Results of baseline regression model
This table reports the results from regressions of weekly CDS spread changes including country fixed
effects:
CDS
it
= C +
0
Risk-free rate
t
+
1
Risk Aversion
t
+
2
iTraxx
t
+
3
Debt
it
+
4
VOL
it
+
5
Bid_Ask
it
+
0
D Risk-free rate
t
+
1
D
Risk Aversion
t
+
2
iTraxx
t
+
3
Debt
it
+
4
VOL
it
+
5
Bid_Ask
it
+
it
The t-statistics are given adjacent to the coefficient estimates The sample periods are 1
January 2006 to 12 September 2008 (“period I) and 15 September 2008 to 28 June 2010 (“period II”).
Period I
Variable
Coefficient t-Statistic
Intercept
0.12
(1.30)
Risk-free rate
-0.61
(-0.16)
Risk aversion
-0.01
(-0.59)
Itraxx 5y
0.05
(3.31)***
Debt
8.01
(0.26)
Vol
0.31
(0.06)
Bid_ask
7.58
(0.84)
Dummy Risk-free rate
2.31
(0.46)
Dummy Risk Aversion
-0.03
(-1.06)
Dummy Itraxx 5y
0.09
(4.78)***
Dummy Debt
17.16
(0.45)
Dummy Vol
9.42
(1.46)
Dummy bid-ask
5.38
(0.48)
Adjusted R-squared
0.13
Period II
Variable
Coefficient t-Statistic
Intercept
1.94
(1.39)
Risk-free rate
-2.69
(-0.33)
Risk aversion
0.03
(0.46)
Itraxx 5y
0.54
(9.00)***
Debt
180.70
(0.92)
Vol
4.26
(0.36)
Bid_ask
-78.00
(-0.85)
Dummy Risk-free rate
8.51
(0.39)
Dummy Risk Aversion
0.55
(1.60)*
Dummy Itraxx 5y
0.64
(3.07)***
Dummy Debt
-541.76
(-0.94)
Dummy Vol
-22.63
(-0.75)
Dummy bid-ask
-407.47
(-1.26)
Adjusted R-squared
0.25

36
Table 6b: Results of baseline regression model
This table reports the results from regressions of weekly bond spread changes including country fixed
effects:
Bond spread
it
= C +
0
Risk-free rate
t
+
1
Risk Aversion
t
+
2
iTraxx
t
+
3
Debt
it
+
4
VOL
it
+
5
Bid_Ask
it
+
0
D Risk-free rate
t
+
1
D
Risk Aversion
t
+
2
iTraxx
t
+
3
Debt
it
+
4
VOL
it
+
5
Bid_Ask
it
+
it
The t-statistics are given adjacent to the coefficient estimates. The sample periods are 2 January 2006 to
8 September 2008 (“period I) and 15 September 2008 to 28 June 2010 (“period II”).
Period I
Variable
Coefficient t-Statistic
Intercept
-0.04
(-0.32)
Risk-free rate
-1.20
(-0.24)
Risk aversion
0.01
(0.40)
Itraxx
-0.12
(-3.35)***
Debt
9.84
(0.14)
Vol
-4.99
(-0.72)
bid_ask
-0.69
(-0.73)
Dummy Risk-free rate
3.92
(1.98)**
Dummy Risk Aversion
-0.02
(-1.18)
Dummy Itraxx
0.12
(5.64)***
Dummy Debt
-2.38
(-0.03)
Dummy Vol
5.80
(0.65)
Dummy bid-ask
1.45
(1.09)
Adjusted R-squared
0.57
Period II
Variable
Coefficient t-Statistic
Intercept
1.65
(1.32)
Risk-free rate
-7.28
(-0.64)
Risk aversion
-0.06
(-0.73)
Itraxx
0.15
(2.12)**
Debt
280.88
(1.64)*
Vol
1.47
(0.14)
bid_ask
-3.54
(-1.00)
Dummy Risk-free rate
-5.66
(-0.20)
Dummy Risk Aversion
0.42
(0.97)
Dummy Itraxx
0.80
(2.49)**
Dummy Debt
-860.05
(-1.22)
Dummy Vol
89.44
(1.59)
Dummy bid-ask
0.63
(0.05)
Adjusted R-squared
0.16

37
Table 7: Results of extended regression model
This table reports the results from panel regressions with country fixed effects specified as follows:
Y
it
= C +
0
R
it
+
1
VOL
it
+
2
DEBT
it
+
3
VIX
t
+
4
Eonia
t
+
5
Slope
t
+
6
USD_VOL
t
+
0
D R
it
+
1
D
VOL
it
+
2
D
LEVERAGE
it
+
3
D
VIX
t
+
4
D
Eonia
t
+
5
D
Slope
t
+
6
D
USD_VOL
t
+
it
The t-statistics based White standard errors are given adjacent to the coefficient estimates. The sample
period is 15 September 2008 to 28 June 2010.
CDS
Bond Spread
Coeff
t-stat
Coeff
t-stat
Intercept
2.38
(1.67)*
1.99
-1.7
R
34.28
-0.67
32.15
-0.88
VOL
2.88
-0.22
2.39
-0.27
DEBT
169.99
-0.73
302.55
(1.88)**
VIX
0.63
(2.95)***
-0.12
(-0.76)
EONIA
-2.74
(-0.37)
-7.37
(-1.03)
SLOPE
-14.84
(-2.18)**
-14.01
(-2.54)**
USD_VOL
0.26
-0.68
0.2
-0.39
Dummy*R
-60.82
(-0.67)
70.69
-0.94
Dummy*VOL
-47.97
(-1.53)
63.81
-1.28
Dummy*DEBT
-444.21
(-0.69)
-775.24
(-1.06)
Dummy*VIX
1.11
(2.11)**
1.09
-1.46
Dummy*EONIA
-5.66
(-0.76)
-11.98
(-1.41)
Dummy*SLOPE
-17.77
(-1.63)*
-10.49
(-0.80)
Dummy*USD_VOL
1.83
(1.93)**
2.18
-1.49
R-squared
0.13
0.07

38
Table 8: Lead-lag relationship between CDS and bond spreads
The lead-lag analysis reported in the tables below is implemented for each single sovereign entity.
Johansen cointegration test results (p. values of the trace test statistics) are reported in the first line of
table. Where we find cointegration we study the lead-lag dynamics by mean of the bivariate VECM
specified as below and we look at the adjustment coefficients λ1 and λ2.
t
q
j
j
t
j
j
t
p
j
j
t
t
BondSpread
CDS
Z
CDS
1
1
1
1
1
1
1
)
(
t
q
j
j
t
j
j
t
p
j
j
t
t
BondSpread
CDS
Z
BondSpread
2
1
2
1
2
1
2
)
(
When both λ1 and λ2 are significant the method we use, to investigate the mechanics of price discovery, is
the measure due to Gonzalo and Granger (1995) defined as the ratio:
1
2
2
. The t- statistics are given
adjacent to the coefficient estimates. When we do not find cointegration we run the Granger causality test
on the series in their levels. The sample period is 15 September 2008 to 28 June 2010.
Country Germany
France
Netherlands
Austria
Belgium
Italy
Ireland
Spain
Portugal
Greece
Trace test
p-v
0.037**
0.082*
0.000***
0.000***
0.1000*
0.065*
0.098*
0.074*
0.100*
0.069*
lambda 1
-0.019
-0.005
-0.028
-0.022
-0.004
0.014
-0.009
0.008
0.024
0.026
t-stat
[-3.405]**
[-2.682]*
[-4.166]***
[-4.696]***
[-2.856]*
[ 1.794]
[-0.868]
[ 0.599]
[ 1.540]
[ 1.337]
lambda2
-0.004
-0.004
0.001
0.002
-0.003
0.018
0.019
0.039
0.044
0.066
t-stat
[-0.483]
[-1.682]
[ 0.211]
[ 0.308]
[-1.934]
[ 3.430]**
[ 2.176]*
[ 3.773]**
[ 3.361]**
[ 3.477]**
P. discov
Bond
Bond
Bond
Bond
Bond
Cds
Cds
Cds
Cds
Cds

39
Table 9: Explaining the basis: description of explanatory variables and expected signs for
parameter estimates
This table reports the variables used in the regressions with country fixed effects where the dependent
variable is the basis defined as CDS 10y – (Yield of 10y benchmark bond – 10y swap rate). The first
group of countries is Germany, France, Netherlands, Austria and Belgium. The dummy variable defines
the second group of countries given by Italy, Ireland, Spain, Portugal and Greece. The data sources are
Bloomberg, Federal Reserve Bank of New York and Datastream.
Notation
Definition
Sign
Basis (-1)
Lagged basis
(+)
Euribor-Eurepo
3m Euribor vs. eurepo spread
(+)
Risk Aversion
S&P 500 risk aversion
(+)
USD_VOL
Implied volatility of USD/EUR
(+)
Itraxx Financials Itraxx Financials 5y CDS index
(+/-)
Debt
Bond outst/GDP
(+/-)
Vol
Idiosyncratic equity vol
(+/-)
Equity Volume
Country specific stock index volume
(-)
Cp Fin Outst
US$ Financial commercial paper outstanding
(-)
Term-Repo
Outst
Term repurchase agreements outstanding of the Federal Reserve’s
primary dealers
(-)
Dummy
Dummy for group II
(+/-)

40
Table 10: Results of the basis regression: baseline model
This table reports the results from panel regressions of weekly observations of the basis including country
fixed effects:
Basis
it
= C +
0
Basis
it-1
+
1
(Euribor-Eurepo)
t
+
2
Risk Aversion
t
+
3
log(USD_VOL)
t
+
4
log(
iTraxx Financials)
t
+
5
log(Debt)
it
+
6
log(Vol)
it
+
1
D*(Euribor-Eurepo)
t
+
2
D* Risk Aversion
t
+
3
D * log(USD_VOL)
t
+
4
D* log(Itraxx Financials)
t
+
5
D *log(Debt)
it
+
6
D *log(Vol)
it
+
it
The t-statistics is based on White cross-section standard errors are given adjacent to the coefficient
estimates. Coefficients marked *** are significant at 1 %, ** are significant at 5 % and * are significant
at 10 %. The sample periods are 2 January 2006 to 12 September 2008 (“period I) and 15 September
2008 to 28 June 2010 (“period II”).
Period I
Variable
Coefficient
t-Statistic
Intercept
-6.81
(-1.12)
Basis (t-1)
0.85
(30.45)***
Euribor-Eurepo
-3.74
(-2.49)**
Risk Aversion
0.06
(1.10)
USD_VOL
-2.43
(-0.71)
Itraxx Financials
2.53
(4.32)***
Debt
-7.17
(2.15)**
Vol
-0.05
(-0.10)
Dummy Euribor-Eurepo
0.91
(0.82)
Dummy Risk Aversion
-0.03
(-0.70)
Dummy USD_VOL
4.02
(1.26)
Dummy Itraxx Financials
-0.21
(-0.49)
Dummy Debt
-0.38
(-0.08)
Dummy Vol
0.34
(0.49)
Adjusted R-squared
0.95
Period II
Variable
Coefficient
t-Statistic
Intercept
-1.42
(-0.04)
Basis (t-1)
0.73
(7.80)***
Euribor-Eurepo
14.65
(3.63)***
Risk Aversion
0.23
(2.25)**
USD_VOL
7.36
(0.76)
Itraxx Financials
5.70
(1.04)
Debt
51.93
(2.84)***
Vol
-6.87
(-2.53)***
Dummy Euribor-Eurepo
-10.22
(-1.41)
Dummy Risk Aversion
-0.08
(-0.60)
Dummy USD_VOL
5.30
(0.51)
Dummy Itraxx Financials
-16.81
(-1.67)*
Dummy Debt
-64.41
(-3.67)***
Dummy Vol
4.91
(1.09)
Adjusted R-squared
0.75

41
Table 11: Results of the basis regression: extended model
This table reports the results from panel regressions of weekly observations of the basis including country
fixed effects:
Basis
it
= C +
0
Basis
it-1
+
1
(Euribor-Eurepo)
t
+
2
RA
t
+
3
log(USD_VOL)
t
+
4
log( iTraxx
Financials)
t
+
5
log(Debt)
it
+
6
log(Vol)
t
+
7
log(Cp Fin Outst)
t
+
8
log(Term Repo Outst)
t
+
9
log(Equity Volume)
t
+
1
D*(Euribor-Eurepo)
t
+
2
D* RA
t
+
3
D * log(USD_VOL)
t
+
4
D*
log(Itraxx Financials)
t
+
5
D *log(Debt)
it
+
6
D *log(Vol)
it
+
7
D *log(Cp Fin Outst)
t
+
8
D *log(Term
Repo Outst)
t
+
9
D *log(Equity Volume)
t +
it
The t-statistics is based on White cross-section standard errors are given adjacent to the coefficient
estimates. Coefficients marked *** are significant at 1 %, ** are significant at 5 % and * are significant
at 10 %. The sample periods are 2 January 2006 to 12 September 2008 (“period I) and 15 September
2008 to 28 June 2010 (“period II”).
Period I Period II
Variable
Coefficient
t-Statistic
Coefficient
t-Statistic
Intercept
-181.09
(-4.95)***
24.29
(0.17)
Basis (t-1)
0.80
(27.90)***
0.71
(7.42)***
Euribor-Eurepo
-1.81
(-1.41)
14.10
(3.31)***
RA
0.05
(0.83)
0.25
(2.40)**
USD_VOL
-2.87
(-0.75)
11.43
(1.18)
Itraxx Financials
0.06
(4.32)***
0.05
(1.18)
Debt
3.73
(1.05)
24.34
(1.28)
Vol
0.49
(0.95)
-7.89
(-3.07)***
Cp Fin Outst
13.36
(3.65)***
-9.00
(-1.08)
Term Repo Outst
0.29
(0.16)
6.35
(1.11)
Equity Volume
-0.55
(-1.24)
0.65
(0.52)
Dummy Euribor-Eurepo
0.04
(0.04)
-9.72
(-1.46)
Dummy RA
-0.06
(-1.07)
-0.06
(-0.43)
Dummy USD_VOL
3.62
(1.07)
11.95
(1.01)
Dummy Itraxx Financials
0.00
(-0.14)
-0.13
(-1.47)
Dummy Debt
-7.38
(-1.40)
-60.73
(-2.80)**
Dummy Vol
0.35
(0.51)
0.34
(0.09)
Dummy Cp Fin Outst
0.78
(0.22)
-21.81
(-1.73)*
Dummy Term Repo Outst
1.50
(0.97)
15.52
(1.73)*
Dummy Equity Volume
0.32
(0.68)
-2.85
(-0.99)
Adjusted R-squared
0.95
0.75

42
References
Adrian T., Etula E, and Shin H. S (2010) Risk appetite and exchange rates. NY Fed, Staff report no. 361.
Amato J. and E. Remolona (2003) The credit spread puzzle. BIS Quarterly Review, December, 51–63.
Basel Committee on Banking Supervision (2006) International Convergence of Capital Measurement and
Capital Standards: A Revised Framework - Comprehensive Version, June.
Barclays Capital (2010a) Sovereign CDS trading. Credit Research, February 2010.
Barclays Capital (2010b) Sovereign CDS: The canary or the cat? Credit Research, February 2010.
Bhanot, K. and L. Guo (2010) Types of Liquidity and Limits to Arbitrage-The Case of Credit Default
Swaps. Mimeo.
Beber, A., M.W. Brandt and K. A. Kavavejc (2009) Flight-to-Quality or Flight-to-Liquidity? Evidence
from the Euro-Area Bond Market. Review of Financial Studies 22, 925 - 957.
Berndt, A. and I. Obreja (2010) Decomposing European CDS Returns. Review of Finance, 14, 189–233.
Blanco R., S. Brennan and I.W. Marsh (2005) An empirical analysis of the dynamic relationship between
investment-grade bonds and credit default swaps. Journal of Finance 60, 2255 - 2281.
Buiter W. (2010) Sovereign Debt Problems in Advanced Industrial Countries. Citi Global Economics
View, April 2010.
Brenner R.J. and Kroner K.F. (1995) Arbitrage, cointegration, and testing the unbiasedness hypothesis in
financial markets. Journal of Financial and Quantitative Analysis 30, 23-42.
Campbell, J and G. Taksler (2003) Equity Volatility and Corporate Bond Yields. Journal of Finance, 58,
2321 – 2349.
Capuano,C., J. Chan-Lau, G. Gasha, C. Medeiros, A. Santos and M. Souto (2009) Recent Advances in
Credit Risk Modeling. IMF Working Paper 09/162.
Collin-Dufresne P., R. Goldstein and J. S. Martin (2001) The Determinants of Credit Spread Changes.
Journal of Finance 56, 2177-2207.
Deutsche Bank (2010) Understanding the EFSF. Fixed Income Special Report, October.
Dieckmann S. and T. Plank (2010) Default Risk of Advanced Economies: An Empirical Analysis of
Credit Default Swaps during the Financial Crisis. Mimeo, Wharton School.
Duarte, J., F.J. Longstaff and F. Yu (2007) Risk and Return in Fixed-Income Arbitrage: Nickels in Front
of a Steamroller? Review of Financial Studies 20, 769-811.
Duffie, D. (1999) Credit Swap Valuation. Financial Analysts‟ Journal, 83, 635–665.
Duffie, D. (2010) Presidential Address: Asset Price Dynamics with Slow-Moving Capital. Journal of
Finance, 65, 1237–1267.
Elton E.J., M.J. Gruber, D. Agrawal D. and C.Mann (2001) Explaining the rate spread on corporate
bonds. Journal of Finance 56, 247-77.

43
Ejsing, J. and W. Lemke (2010) The Janus-headed salvation: Sovereign and bank credit risk premia
during 2008-09. ECB Working Paper 1127.
Engle, R.F. and C.W.J. Granger (1987) Cointegration and error correction representation, estimation and
testing. Econometrica 55, 251-76.
Ericsson J, .K. Jacobs, and R. Oviedo-Helfenberger (2009) The Determinants of Credit Default Swap
Premia. Journal of Financial & Quantitative Analysis 44, 109–132.
M. Fleckenstein, F.A. Longstaff and H. Lustig (2010) Why does the Treasury issue TIPS? The TIPS–
Treasury bond puzzle. NBER Working Paper 16358.
Fontana, A. (2010) The persistent negative CDS-bond basis during the 2007/08 financial crisis. Mimeo.
Gapen, M., D.F. Gray, C. H. Lim and Y. Xiao (2005) Measuring and Analyzing Sovereign Risk with
Contingent Claims. IMF Working Paper 2005/155.
Gonzalo J. and C. W.J. Granger (1995). Estimation of common long-memory components in cointegrated
systems. Journal of Business and Economic Statistics 13, 27-25.
Gorton, G. and A. Metrick (2009) Haircuts. NBER Working Paper 15273.
Giesecke, K., Longstaff, F, S Schaefer and I. Strebulaev (2010) Corporate Bond Default Risk: A 150-
Year Perspective. NBER Working Paper 15848.
Haugh D., P. Ollivaud and D. Turner (2009) What Drives Sovereign Risk Premiums?: An Analysis of
Recent Evidence from the Euro Area. OECD Working Paper 718.
Hull J., M. Predescu, M. and A. White (2005) Bond prices, default probabilities and risk premiums.
Journal of Credit Risk, 1 / Spring, 53-60.
Krishnamurthy, A. (2010) How Debt Markets have Malfunctioned in the Crisis. Journal of Economic
Perspectives 24, 3-28
Krishnamurthy, A. and A. Vissing-Jorgensen (2009) The Aggregate Demand for Treasury Debt. Mimeo.
Lesmond, D., J. Ogden, and C. Trzcinka (1999) A new estimate of transactions costs. Review of Financial
Studies 12, 1113–1141.
Longstaff F, S Mithal and E Neis (2005) Corporate yield spreads: default risk or liquidity? New evidence
from the credit default swap market. Journal of Finance 60, 2213-2253.
Longstaff F, J. Pan, L. Pedersen and K. Singleton (2008) How sovereign is sovereign risk? Mimeo.
Longstaff F.J. and E. Schwartz (1995) A simple approach to valuing risky, fixed and floating rate debt.
Journal of Finance 50, 789-821.
Lucy F., Ackert, M.D. Racine, (1999). Stochastic trends and Cointegration in the market for equities.
Journal of Business and Economics Statistics 51, 133-143.
Manganelli, S. and G. Wolswijk (2009) What drives spreads in the euro area government bond market?
Economic Policy 24, April 2009, 191–240.
Mercurio, F. (2009) Interest Rates and The Credit Crunch: New Formulas and Market Models. Mimeo.

44
Merton, R. C (1974) On the Pricing of Corporate Debt: The Risk Structure of Interest Rates. Journal of
Finance 29, 449-470.
Mitchell, M. and T. Pulvino (2010) Arbitrage crashes and the speed of capital. Mimeo.
Mody, A. (2009) From Bear Sterns to Anglo Irish: How Eurozone Sovereign Spreads Related to Financial
Sector Vulnerability. IMF Working Paper 2009/108.
JP Morgan (2009) Basis handbook. JP Morgan credit research.
Pan, J. and K. Singleton (2008) Default and Recovery Implicit in the Term Structure of Sovereign CDS
Spreads. Journal of Finance 63, 2345-2384.
Panetta, F. Faeh, T. Grande, G. Ho, C., King, M. Levy, A., Signoretti, F., Taboga, M and A. Zaghini
(2009) An assessment of financial sector rescue programmes. BIS Paper 48.
Raunig, B. and M. Scheicher (2009) Are Banks Different? Evidence from the CDS Market. OeNB
Working paper 152.
Sgherri, S. and E. Zoli (2009) Euro Area Sovereign Risk During the Crisis. IMF Working paper 2009/22.
Shleifer, A., and R. W. Vishny (1997) The limits of arbitrage. Journal of Finance 52, 35-55.
Stulz, R. (2010) Credit Default Swaps and the Credit Crisis. Journal of Economic Perspectives, Winter
2010, 73 – 92.
Upper, C., and T. Werner (2002) Tail Wags Dog? Time-Varying Information Shares in the Bund Market.
Bundesbank Working Paper 24/02.
Document Outline
Wyszukiwarka
Podobne podstrony:
Kalmus, Realo, Siibak (2011) Motives for internet use and their relationships with personality trait
With Microscope and Tweezers An Analysis of the Internet Virus of November 1988
Price An Analysis of the Strategy and Tactics of Alexious I Komnenos
An%20Analysis%20of%20the%20Data%20Obtained%20from%20Ventilat
How does personality matter in marriage An examination of trait anxiety, interpersonal negativity, a
Analysis of Nazism, World War II, and the Holocaust
An analysis of the European low Nieznany
The?termath of Euro 2012 Spain, Poland and Ukraine
An%20Analysis%20of%20the%20Data%20Obtained%20from%20Ventilat
How does personality matter in marriage An examination of trait anxiety, interpersonal negativity, a
A Philosophy for all an analysis of the Tao
Prospect theory an analysis of decision under risk
An analysis of the energy efficiency of winter rapeseed biomass under
an analysis of the legal high mephedrone bioorg med chem lett 20 4135 4139 2010
An investigation of shock induced temperature rise and melting of bismuth using high speed optical p
How does personality matter in marriage An examination of trait anxiety, interpersonal negativity, a
An analysis of energy efficiency in the production of oilseed crops
an eternam now an analysis of temporality of computer games Content File PDF
więcej podobnych podstron