
An exploratory analysis of the order book, and
order ¯ow and execution on the Saudi stock
market
Mohammad Al-Suhaibani
a
, Lawrence Kryzanowski
b,*
a
Department of Economics, Imam University, Riyadh, Saudi Arabia
b
Department of Finance, Faculty of Commerce, Concordia University,
1455 De Maisonneuve Blvd. West, Montreal, Que., Canada
Received 27 October 1998; accepted 22 June 1999
Abstract
The microstructure of the Saudi Stock Market (SSM) under the new computerized
trading system, ESIS, is described, and order and other generated data sets are used to
examine the patterns in the order book, the dynamics of order ¯ow, and the probability
of executing limit orders. Although the SSM has a distinct structure, its intraday pat-
terns are surprisingly similar to those found in other markets with dierent structures.
We ®nd that liquidity, as commonly measured by width and depth, is relatively low on
the SSM. However, liquidity is exceptionally high when measured by immediacy. Limit
orders that are priced reasonably, on average, have a short duration before being ex-
ecuted, and have a high probability of subsequent execution. Ó 2000 Elsevier Science
B.V. All rights reserved.
JEL classi®cation: G15
Keywords: Market microstructure; Limit order book; Intraday patterns; Order
execution
Journal of Banking & Finance 24 (2000) 1323±1357
www.elsevier.com/locate/econbase
*
Corresponding author. Tel.: +1-514-848-2782; fax: +1-514-848-4500.
E-mail addresses: mohisuh@alumni.concordia.ca (M. Al-Suhaibani), lad®53@vax2.
concordia.ca (L. Kryzanowski).
0378-4266/00/$ - see front matter Ó 2000 Elsevier Science B.V. All rights reserved.
PII: S 0 3 7 8 - 4 2 6 6 ( 9 9 ) 0 0 0 7 5 - 8

1. Introduction
The recent availability of order, quote, and transaction data from stock
markets around the world has stimulated research on intraday stock market
phenomena. Intraday patterns identi®ed in the data of US and other developed
countries include the persistent U-shaped patterns in returns, number of shares
traded, volumes, bid±ask spreads, and volatility.
1
;
2
Other studies that examine
order-driven markets provide new evidence on patterns in the order book,
order ¯ow, and the interaction between the order book and order ¯ow.
3
In this paper, we study the Saudi Stock Market (SSM) which uses a com-
puterized trading mechanism known as Electronic Securities Information
System (ESIS). The objective is to examine the behavior of market participants
in the SSM to understand better the eect of order placement on market li-
quidity, and to determine whether certain patterns identi®ed in earlier studies
can be generalized to other trading structures. Our paper has several unique
aspects. First, the SSM, which is described in detail in the next section, is a pure
order-driven market with no physical trading ¯oor, regulated brokers or
market makers, and it is closed to foreign portfolio investments. The market
also is dierentiated by a long mid-day break, partially hidden order book, and
a constant tick size. Second, the unique data set provided by the Saudi Arabian
Monetary Agency (SAMA) includes all orders for listed stocks submitted
during the period from 31 October 1996 to 14 January 1997. This order data set
allows for the construction of the complete limit order book for this order-
driven market. The data set includes information that allows for the identi®-
cation of market and limit orders, and what we called order packages. Third,
we believe that our study is the ®rst to examine the market microstructure of
the SSM. We provide evidence on several issues related to the interaction be-
tween the order book and order ¯ow, which adds to the existing empirical
literature on order-driven markets. Finally, our paper examines a number of
new issues associated with order-driven markets. The literature on market
microstructure often discusses liquidity measures such as width, depth, resil-
1
U-shaped patterns refer to the heavy trading activity on ®nancial markets at the beginning and
at the end of the trading day, and the relatively light trading activity over the middle of the day
(Admati and P¯eiderer (1988)).
2
For the US markets, these include studies by Wood et al. (1985), Jain and Joh (1988), McInish
and Wood (1991, 1992), Brock and Kleidon (1992), Gerety and Mulherin (1992), Foster and
Viswanathan (1993) and Chan et al. (1995a,b). McInish and Wood (1990) report similar results for
the Toronto Stock Exchange and Lehmann and Modest (1994) ®nd U-shaped patterns in trading
for the Tokyo Stock Exchange.
3
A representative example is the empirical analysis by Biais et al. (1995) of the limit order book
and order ¯ow on the Paris Bourse. Niemeyer and Sandas (1995), Hedvall and Niemeyer (1996),
Niemeyer and Sandas (1996) and Hedvall et al. (1997) perform similar analyses for stock markets
in Stockholm and Helsinki.
1324 M. Al-Suhaibani, L. Kryzanowski / Journal of Banking & Finance 24 (2000) 1323±1357

iency, and immediacy that may have more relevance for market-order traders.
Our unique data set allows us to examine liquidity measures that are relevant
for limit order traders, the only suppliers of liquidity on the SSM. Using order
duration and logit regressions, we present new evidence on the probability of
executing a limit order on the SSM.
The remainder of this paper is structured as follows. Section 2 presents a
detailed description of the current trading system. The data sets are described
in Section 3. Sections 4 and 5 analyze the limit order book and order ¯ow,
respectively. Section 6 presents and analyzes the empirical ®ndings on limit
order execution. Section 7 concludes the paper.
2. Market description
The SSM is relatively new in age compared to the stock markets in the
developed countries. The ®rst company went public in Saudi Arabia in 1954.
By the end of 1982, 48 companies traded in the Saudi market, which was
completely unregulated by the government.
4
The collapse of the unregulated
stock market in Kuwait motivated the Saudi government to take regulatory
action in 1984.
5
The new regulations transferred share trading, which oc-
curred in the over-the-counter market, from the hands of the unocial
brokers to the banks. Because of low volume and lack of coordination be-
tween the banks, a delay of several days or weeks often occurred before
orders were ®lled. Several other restrictions resulted in lengthy delays. Banks
could neither hold positions in stocks nor break up large blocks of shares to
accommodate buyers.
6
A major development in trading on the SSM post-market-regulation was the
establishment in 1990 of an electronic trading system known as ESIS.
7
After
the startup of ESIS, the banks established twelve Central Trading Units
(CTUs). All the CTUs are connected to the central system at SAMA. The bank
CTUs, and designated bank branches throughout the country that are con-
nected to the CTU (ESISNET branches), are the only locations where buy and
sell orders can be entered directly into ESIS.
4
Due to religious considerations, only stocks are traded in the market. From the viewpoint of
sharia (Islamic law), interest on bonds is regarded as usury.
5
More information on the Kuwaiti ®nancial crises, which is known as the ``Souq al-Manakh''
crisis, is found in Darwiche (1986).
6
In 1992, SAMA allowed the banks to manage open-ended mutual funds for public investors.
However, the banks are still not allowed to invest directly or indirectly, through the mutual funds,
in Saudi stocks.
7
More on the history of the SSM up to 1990 is found in Malaikah (1990), Wilson (1991), and
Butler and Malaikah (1992).
M. Al-Suhaibani, L. Kryzanowski / Journal of Banking & Finance 24 (2000) 1323±1357 1325

Trading on the SSM consists of four hours per day, divided into two
daily sessions for Saturday through Wednesday. The trading day consists of
one two-hour session on Thursday. Table 1 summarizes trading hours and
trading days on the SSM. During the morning and evening hours no
trading occurs, but wasata can add and maintain order packages and orders
that were entered through their CTU or ESISNET branches. The wasata are
neither brokers nor dealers. They are order clerks whose assigned job is
merely to receive and verify orders from public traders at the CTU, and
then to enter these orders into the system. Conditional on SAMA approval,
the banks hire and pay the wasata. Sell and buy orders are generated from
the incoming sell and buy order packages. If an order package has many
®rm orders, each is dierentiated by parameters such as quantity, price and
validity period.
8
Order packages entered into the system may be valid for a
period from 1 to 12 days.
9
At some point of time during the ®rst ®ve-minute opening period, all ®rm
buy and sell orders participate in a call market.
10
Orders are executed at an
equilibrium price calculated to be the best possible price for executing the
maximum number of shares available in the market at the open. This is fol-
lowed by a continuous auction market, where marketable orders by public in-
vestors are transacted with the limit orders of other public investors.
11
In the
post-trading period, trades are routed to settlement, trading statistics are
printed, and no order package or order can be added or maintained.
Only limit orders with a speci®ed price and ®rm quantity are permitted.
Firm orders are eligible for execution during the opening and continuous
trading periods according to price-then-time priority rules. An investor can
8
In ESIS terms, order packages are called orders, and orders are called quotes. These de®nitions
dier from those usually used in the literature. Order in the literature usually refers to order with a
®rm quote that leads instantly to a bid or ask if it is a limit order, or to a trade if it is a market
order. The ®rm quotes (as de®ned by the ESIS) are more like orders as usually de®ned in the
literature. In the market, generating a ®rm quote is the same as placing an order. To be consistent
with the literature, orders are referred to as order packages, and quotes are referred to as orders.
9
Before 28 May 1994, the validity period for an order package was either 1, 5 or 10 days.
Subsequently, the validity period became 1, 6 or 12 days. From 1 October 1994, the validity period
was allowed to be any period from 1 to 12 days.
10
In a call market, orders for a stock are batched over time and executed at a particular point in
time.
11
A limit order is an order with speci®c quantity and price and for a given period of time. For a
limit buy (sell) order, the price is below (above) the current ask (bid). Marketable limit order is a
limit order with a limit price at or better than the prevailing counterparty quote. For a marketable
buy (sell) order, the price must equal or better the current ask (bid). Notice that the standard
market order (order to buy or sell a given quantity for immediate execution at the current market
price, without specifying it) is not accepted by the system. Since marketable and market orders are
essentially similar, we use the term market order when referring to marketable orders in the
remainder of the paper.
1326 M. Al-Suhaibani, L. Kryzanowski / Journal of Banking & Finance 24 (2000) 1323±1357

adjust order prices and their quantities, or change a ®rm order to on-hold at
any time.
12
With each change, the order loses its time priority. When adjusted,
the order price must be within its order package quantity and price limit.
Aggressive sell (buy) orders can walk down (up) the limit order book.
13
When
an order is partially executed, any unexecuted balance is automatically placed
in a new order at the same price and with the same execution priority as the
original order. The order package can be executed fully or partially through
more than one transaction at dierent times, with dierent orders, and even
with dierent prices.
To reduce adverse selection problems, the system has some negotiation
capability beside the automatic routing and execution.
14
A transaction only
with large value (usually SR 1/2 million [US$133,333] or more) can be executed
Table 1
Trading hours and trading days on the SSM
a
Days
From Saturday to
Wednesday
Thursday
Time
From
To
From
To
Morning period
b
8:15 AM
10:00 AM
8:15 AM
10:00 AM
The ®rst opening period
10:00 AM
10:05 AM
10:00 AM
10:05 AM
The ®rst continuous trading session
c
10:05 AM
12:00 AM
10:05 AM
12:00 AM
The second opening period
4:25 PM
4:30 PM
None
None
The second continuous trading session
c
4:30 PM
6:30 PM
None
None
Post-trading period
6:30 PM
7:00 PM
12:00 AM
12:30 PM
Evening period
b
7:00 PM
8:00 PM
12:30 PM
1:30 PM
a
Source: SAMA, ESIS: Instructions to Central Trading Units.
b
No trading occurs during these periods. However, wasta can add and maintain order packages
and orders that were entered through their CTU or ESISNET branches.
c
The ®rst and second continuous trading periods are 115 and 120 minutes in elapsed time, re-
spectively. Thus, the second continuous trading period is 5 minutes longer than the ®rst continuous
trading period.
12
All or part of an order package can be canceled by putting it ``on-hold'' or returning it back to
the market at any time. ``On-hold'' orders are out of the market but still in the system. As a result,
they have no price or time priority, and do not become automatically ®rm after executing all or part
of the outstanding ®rm quantity in the order package.
13
The limit order book (Ôthe order bookÕ) is the collection of all ®rm limit orders generated from
all order packages arrayed in descending prices for bids and in ascending prices for asks.
14
Adverse selection problems exist if some traders have superior information and cannot be
identi®ed. In such situations, the uninformed traders lose on average to informed traders. Without
uncertainty, the uninformed traders would trade with each other and not trade with the informed
traders.
M. Al-Suhaibani, L. Kryzanowski / Journal of Banking & Finance 24 (2000) 1323±1357 1327

as a put-through transaction outside the system under SAMA supervision.
15
The parties to put-through transactions have no obligation to trade at the
current quotes or clear the limit orders in between. After execution, the
transaction is immediately reported to the market.
The minimum price variation, or tick size, for all stocks in the market is SR
1 (27 cents). Transaction fees are charged on each side of the trade, and have
a minimum of SR 25 ($6.66). Transaction fees range between 0.5% and 0.1%
of the trade value depending on the number of shares executed. The com-
mission is distributed in two parts: 95% to the banks, and 5% to the SSRC for
settlement and transfer services.
16
During continuous trading periods, ®rm
orders must be priced within 10% of the opening price of the given trading
period. In turn, the opening price must lie within a price range that is within
10% of the previous dayÕs closing price. If no opening price exists for that
period, the opening price defaults to the previous dayÕs closing price. Occa-
sionally SAMA can allow the price to exceed the present ¯uctuation limit
provided the new price is reasonably justi®ed by the earnings or prospects of
the company.
The electronic limit order book is not fully visible to investors since in-
formation is displayed publicly in an aggregate format (i.e., only the best
quote with all quantities available at that quote). The status of the best
quotes and quantities is updated (almost instantaneously) on bank screens
each time an order arrives, is canceled, or is executed. Public investors can
view the price, quantity, and time of last trade. The terminals and big screens
where traders can monitor the market are only available in the CTUs and
ESISNET branches of the banks. In the early releases of ESIS, only the
wasata in the CTUs could view the best ®ve bids and asks, and valued bank
customers could easily learn this information by calling their bankÕs CTU. To
prevent this type of unfair access to market information and related front-
running problems, SAMA on 1 October 1994 restricted both the wasata in
the CTUs and the public to viewing only the best two bids and asks. The
15
Put-through transactions (so-called block trades) are not common on the SSM, and usually
are handled in an informal manner. In most cases, big traders agree in advance on the
transaction and ask SAMA to handle it as a put-through transaction. For this reason, the price
of the transaction may not re¯ect current market conditions. If this is the case, SAMA sends a
message communicating this information about the trade to the market. Occasionally, an
unocial broker brings in both sides of the put-through transaction. In rare cases, an uninformed
trader appeals for SAMA supervision to minimize the transaction costs associated with a very
large order by handling it as a put-through. To facilitate the transaction by this veri®ed
uninformed trader, SAMA sends a massage to the CTUs asking for counterparties to complete
the transaction.
16
The SSRC (Saudi Share Registration Company) was formed in 1985 by the Saudi banks to
serve as a clearing system for executed trades. Under ESIS, the major role of SSRC is to keep up-to-
date records of shareholdings in stock companies.
1328 M. Al-Suhaibani, L. Kryzanowski / Journal of Banking & Finance 24 (2000) 1323±1357

wasata still have more information about the order book since they know the
details of every order placed through their CTU or their ESISNET branches
connected to it. This includes the identi®cation of investors, the price and
quantities of ®rm and on-hold orders, and the type of ownership document
for sell orders. Details of every order are only observable to surveillance
ocials. This level of transparency on the SSM hides all ®rm orders outside
the two best quotes. Unlike on-hold orders, hidden orders have price and
time priority and can be revealed to the market or executed at any time. For
example, a ®rm order to buy with a price less than the second best bid is
hidden but becomes visible when all the quantity at the ®rst best quote is
executed. The order also can be executed while it is hidden by an aggressive
market sell order.
17
Only the wasata in the CTUs have the right to enter orders directly into
the system. Investors in the SSM consist of public investors and bank
phone customers.
18
Bank phone customers have an agreement with the
banks to change the price and ®rm quantity of their submitted orders at
any time simply by calling their BankÕs CTU. As a result, they are less
aected than other public traders by the free trading option associated with
limit orders since they can change the condition of their orders very quickly
before they are ``picked o'' when new public information arrives.
19
This group of traders includes the institutional investors (e.g. mutual funds)
and many technical traders who have trading and no fundamental infor-
mation.
The date and time of transfer of bene®cial ownership for each transaction
is the date and time of execution in the system.
20
Transaction con®rmation
slips are usually printed at CTUs and ESISNET branches and distributed to
the clients after each trading session. Following the second trading session,
transactions are routed for settlement. The settlement date depends on the
type of ownership document. Ishaar, which can be retained in the system for
17
Unlike some trading systems, ESIS does not allow traders to intentionally hide orders that are
part of the best two quotes.
18
SAMA does not allow banks to grant their customers access to the system via any computer
network.
19
As Stoll (1992) explains, a limit order provides the rest of the market with a free option. The
trader who places a buy (sell) limit order has written a free put (call) option to the market. For
example, suppose the trader submits a buy limit order at $100. If public information causes the
share price to fall below $100, this put option will be exercised and the public trader loses because
he cannot adjust the limit price quickly. The ability to change limit price more quickly by bank
phone customer makes the eective maturity of his limit order very short, and hence the value of
the put option associated with this order is almost zero.
20
The ex-dividend day usually comes before the company closes its record for dividend
payments. The company and SAMA agree in advance on this date, and communicate the date to
the CTUs.
M. Al-Suhaibani, L. Kryzanowski / Journal of Banking & Finance 24 (2000) 1323±1357 1329

future sale or printed and given to the investor, are delivered next day
morning.
21
In contrast, certi®cates take from two days to one week or
more to be delivered. Ishaar takes less time because it can be handled
electronically through ESIS Fully Automated Share Transfer (ESISFAST),
while the new certi®cate has to be issued from the companyÕs share regis-
tration department. The goal is to abolish all existing share certi®cates at
some future point in time.
22
Because of the dierence in settlement dates,
and to prevent the creation of two markets for every security, the type of
ownership document is not visible to market participants prior to a trans-
action.
3. The data sets
The data set provided by SAMA consists of intraday data on ®rm orders for
all stocks listed on the market for 65 trading days (31 October 1996 to 14
January 1997). Four of the 71 stocks are excluded due to an absence of orders,
three stocks are excluded because they have no transactions, and eight stocks
are excluded because they have a small number of transactions. The ®nal data
set includes 267,517 orders for the remaining 56 stocks. For each order, the
data set reports security code, the date and time of creation, buy±sell indicator,
limit price, quantity, and date and time when the order was terminated (can-
celed, expired, or executed). Because the data uniquely identify the order
package that generates the order, the order package data set can be easily
constructed from the order data set. Our data set has 86,425 order packages.
23
Given the information in our order data set, we construct another (a third)
data set containing the end-of-minute best ®ve quotes and their associated
depths on both sides of the market for all 13,955 minutes of trading.
24
Sub-
sequent references to quotes (bids and asks) are reserved for this data set. We
use the date and time of termination, price and quantity of orders along with
21
On March 19, 1994, SAMA reduced the ishaar delivery date to one day instead of two days.
Starting from October 1, 1994, ishaar was allowed to be issued in the same branch where the order
was submitted. Since September 1995, the buyer can know the type of ownership document
immediately after executing his buy order. The latest version of ESIS released in June 1997 permits
real time settlement for ishaar (i.e., execution and settlement times are the same).
22
During the sample period, around 95% to 97% of trades have ishaar documents.
23
Chan and Lakonishok (1995) use the trading package terminology to describe the traderÕs
successive purchases of a stock. The correspondence between their de®nition of a trade package and
an ex ante order is approximate. In contrast, for our data set, we have more information about
orders since we know the set of orders that was generated from an order package. However, we still
are unable to con®rm that two orders belong to the same ex ante order if the investor broke up a
large order into two submitted order packages.
24
The depth is the number of shares oered or demanded at a given bid or ask.
1330 M. Al-Suhaibani, L. Kryzanowski / Journal of Banking & Finance 24 (2000) 1323±1357

published daily statistics to identify the order that was part of a transaction
(trade data set). The number of transactions in our sample is 84,382. Table 2
presents some summary statistics for each of our four data sets.
Panel A in Table 2 reports summary statistics for the order data set. Limit
orders account for 71% of the orders in the sample. The percentage of buy and
sell orders is almost equal for most stocks. Most orders (63%) are executed.
Based on Panel B, most of the order packages are to sell. Execution rates are
similar and evolve around 0.5. Based on Panel C, the public limit order traders
supply immediacy to the market nearly all the time with an average inside
spread equal to SR 2.24.
Panel D reports the summary statistics for the transaction data set which
includes all market orders, the limit orders executed against them, and the
orders executed against each other during the call market at the opening. Be-
cause two orders constitute each trade, the number of observations in this data
set are twice the number of transactions as conventionally reported. Less than
10% of the trades occur during the opening period, and a very small percentage
(0.015%) of the trades are executed outside of the system (in the so-called
upstairs market). The average returns are positive since the market rose 9.23%
over the sample period.
4. Descriptive statistics about the order book
The order book collects all limit orders at any given point of time. Orders
come into the book throughout the day at the time they are submitted to the
market, and are removed from the book as they are executed, canceled, or
expired. Using the quote data set, this section presents and discusses various
descriptive statistics concerning the order book. Although our subsequent
analyses are based on the ®ve best quotes, it is important to remember that
market participants only observe the ®rst two best quotes.
4.1. Relative spreads and depths in the order book
Table 3 reports the time series means and medians of relative spreads be-
tween adjacent quotes in the book, and depths at all levels for the 56 stocks in
the sample. The spread is usually one, two or three ticks in our sample. Based
on Panel A , the mean (median) relative inside spread is 1.79% (1.6%) which is
high compared to other markets.
25
Angel (1997) uses data on the bid±ask
25
The inside spread is the dierence between the ®rst best ask (A1) and the ®rst best bid (B1).
The relative inside spread is the inside spread divided by the quote midpoint, or:
2 A1 ÿ B1= A1 B1.
M. Al-Suhaibani, L. Kryzanowski / Journal of Banking & Finance 24 (2000) 1323±1357 1331

Ta
ble
2
Summ
ary
statistics
for
each
of
the
four
data
sets
a
Ord
er
or
trade
charact
eristic
All
obser
vatio
ns
Cros
s-sect
ional
distrib
ution
across
the
56
stocks
Mean
Min
Firs
t
qu
artile
Medi
an
Third
quartile
Max
Pa
nel
A
:
Orders
data
set
Numb
er
of
ob
servations
267,517
4,777
411
1,104
3,027
6,946
26,24
0
Buy
(%)
48.88
50.10
44.74
47.96
49.22
52.00
59.72
Limit
(%)
71.24
73.84
67.44
71.34
72.63
77.09
83.10
Limit
Buy
(%
of
limit
order
s)
46.24
49.38
41.00
45.91
48.57
52.20
63.39
Mark
et
Buy
(%
of
M
arket
order
s)
55.41
51.09
32.71
48.53
53.86
56.35
61.36
Ex
ecuted
order
s
(%)
63.09
58.87
36.31
56.43
60.80
62.43
77.09
Ord
er
size
843.40
814.7
9
113.6
1
464.9
9
700.1
2
1,076.30
2,972
.80
La
rge
order
(%)
0.62
0.28
0.00
0.00
0.13
0.38
2.01
Pa
nel
B:
Orde
r
packa
ges
data
set
Numb
er
of
ob
servations
86,425
1543
138
396
1109
1900
8180
Buy
(%)
38.52
39.93
13.75
33.64
40.82
44.81
63.04
Pack
age
size
2,610.
64
2,359
.90
272.0
2
1,341
.20
2,157
.40
3,080.20
8,409
.40
Ord
ers
pe
r
pack
age
3.095
2.969
2.015
2.637
2.909
3.206
4.350
Ex
ecution
rate
0.5711
0.548
0.343
0.516
0.546
0.590
0.793
1332 M. Al-Suhaibani, L. Kryzanowski / Journal of Banking & Finance 24 (2000) 1323±1357

Panel
C:
Quote
s
data
set
Numb
er
of
ob
servations
778,593
13,90
3
11,96
0
13,95
5
13,955
13,955
13,95
5
Avai
lability
of
immediac
y
(%)
97.66
97.66
80.75
97.67
100.00
100.00
100.0
0
Insi
de
spread
2.247
2.274
1.038
1.278
1.533
2.541
10.35
1
Quote
mid
point
return
(´
1000
)
)
0.005
)0.015
0.002
0.005
0.008
0.019
Panel
D:
Transact
ions
data
set
Numb
er
of
ob
servations
168,764
3,014
154
656
2,045
4,281
17,43
8
Trade
s
at
open
(%)
8.81
10.96
3.10
5.28
7.72
14.52
34.48
Trade
size
560.88
518.7
8
52.03
284.7
6
483.58
721.98
1,372
.10
Transa
ction
pric
e
267.3091
196.0
7
23.62
70.65
111.81
253.94
959.1
7
Trade
-to-trad
e
return
(´
1000)
)
0.114
)0.615
0.007
0.051
0.147
2.039
Put-t
hrou
gh
trade
s
(%)
0.15
0.10
0.00
0.00
0.00
0.13
1.04
a
For
the
65
trading
days
over
the
period
between
Octo
ber
31,
1996
and
Janu
ary
14,
1997
,the
®rst
co
lumn
reports
variou
s
order
and
trade
charac
-
teristics
af
ter
poolin
g
all
stocks.
Th
e
other
co
lumns
repor
tthe
cross-se
ctio
nal
distribu
tion
of
thes
e
stat
istics
across
the
56
st
ocks
in
the
sam
ple
.All
the
repor
ted
statist
ics
are
mean
values
exc
ept
for
the
numbe
r
of
observat
ions
and
the
percenta
ges.
The
size
stat
istics
are
compu
ted
using
the
nu
mber
of
shares.
The
large
order
s
and
pu
t-through
tr
ades
are
tho
se
wi
th
volum
es
large
r
than
SR
0.5
million.
Imm
ediacy
is
conside
red
available
w
hen
bot
h
bid
and
ask
are
establish
ed.
Insi
de
spre
ad
is
the
diere
nce
betw
een
the
®rst
best
ask
and
the
®rst
best
bid.
The
quote
midpo
int
returns
are
based
on
the
end-
of-m
inute
quote
mid
points,
while
trade-
to-trad
e
retu
rns
are
co
mputed
using
the
time
series
of
tr
ansactio
n
prices.
Exec
ution
rat
e
is
the
numb
er
of
sh
ares
that
are
®lled
divi
ded
by
the
total
numb
er
of
shares
subm
itted
as
a
pack
age.
M. Al-Suhaibani, L. Kryzanowski / Journal of Banking & Finance 24 (2000) 1323±1357 1333
Ta
ble
3
The
rela
tive
spreads
and
depth
s
in
the
book
a
Pa
nel
A
:
The
rela
tive
spreads
betw
een
succes
sive
lev
els
of
the
limit
orde
r
book
(x1
00)
Rela
tive
spread
B4
±B5
B3±B
4
B
2±B3
B1±B
2
A1±B1
A2±A
1
A3±A
2
A4±A
3
A5±A
4
Mean
1.271
1.297
1.240
1.193
1.790
1.281
1.337
1.412
1.348
Med
ian
1.288
1.205
1.115
1.057
1.600
1.246
1.251
1.393
1.436
Pa
nel
B:
Th
e
averag
e
volu
mes
at
diere
nt
lev
els
of
the
limit
orde
r
book
Depth
B5
B4
B3
B2
B1
A1
A2
A3
A4
A5
Mean
4394
5741
8321
10,31
9
5616
4072
6926
6374
5672
4410
Med
ian
2081
2711
3370
3448
1910
1514
2764
2949
2665
2443
Pa
nel
C
:
Test
of
equalit
y
of
spre
ads
and
dep
ths
acro
ss
levels
in
the
orde
r
book
Hypo
thesis
Te
st
statist
ic
Calculat
ed
F-proba
bility
All
rela
tive
spread
s
are
eq
ual
F(8,492
)
1.938
0
0.052
6
All
rela
tive
spread
s
excludin
g
inside
spread
are
equa
l
F(7,492
)
0.288
4
0.969
8
All
de
pths
are
equa
l
F(9,550
)
2.637
9
0.005
4
All
de
pths
are
equa
l
(exc
luding
the
de
pths
at
the
second
best
quote
s)
F(7,550
)
1.325
5
0.220
3
a
Using
the
best
bids
and
asks
and
thei
rasso
ciated
depth
s,
this
table
rep
orts
the
mean
sand
medians
of
the
relative
spreads
between
adjace
nt
quote
sand
the
qu
antities
oere
d
or
de
manded
at
thes
e
quote
s.
The
repor
ted
de
pth
is
the
origina
lnumbe
r
of
sha
res
divi
ded
by
100.
A
and
B
denote
ask
and
bid,
respec
tively
.
B
1
is
the
®rst
be
st
bid
,
and
A1±B1
is
the
rela
tive
insid
e
spread
[(®rst
be
st
ask
±
®rst
best
bid)/Q
uote
mid
point]
time
s
100.
The
qu
ote
midpo
int
is
calculated
as
(®rst
best
ask
+
®rst
best
bid
)/2.
1334 M. Al-Suhaibani, L. Kryzanowski / Journal of Banking & Finance 24 (2000) 1323±1357

spread for major market indices for ®fteen countries and ®nds that the median
relative spread equals 0.65%. The relative tick size, as is shown in the next
section, is the major contributing factor to this high relative spread. The rel-
ative inside spread is larger than all other relative spreads on either side of the
book. The other relative spreads are moderately constant. In contrast, the
average numbers of shares at the ®rst best quote are small (and the smallest on
the ask side), are the largest at the second best quote, and decrease beyond the
second quotes.
26
Based on the test results reported in Panel C, the hypotheses that all relative
spreads and all depths are equal are rejected, but not rejected when we exclude
the inside relative spread, and the depth at the second quotes.
27
The liquidity
provision is greater on the bid side. On average, depths are larger and relative
spreads are smaller on the bid side.
Our results lie somewhat between those of Biais et al. (1994) and Niemeyer
and Sandas (1995). Using data from the Paris Bourse, Biais et al. ®nd that
the order book is slightly concave, with an inside spread more than twice as
large as the dierence between the other levels of the book (which is similar
to our results). They also ®nd that the volumes oered or demanded at the
®rst best quotes are smaller than the volumes further away from the best
levels. In contrast, Niemeyer and Sandas ®nd that the order book on the
Stockholm Stock Exchange is convex. Spreads are wider further away from
the inside spread, and volumes are larger close to the inside spread. In fact,
they ®nd as we do that the average volumes at the second best quote are the
largest.
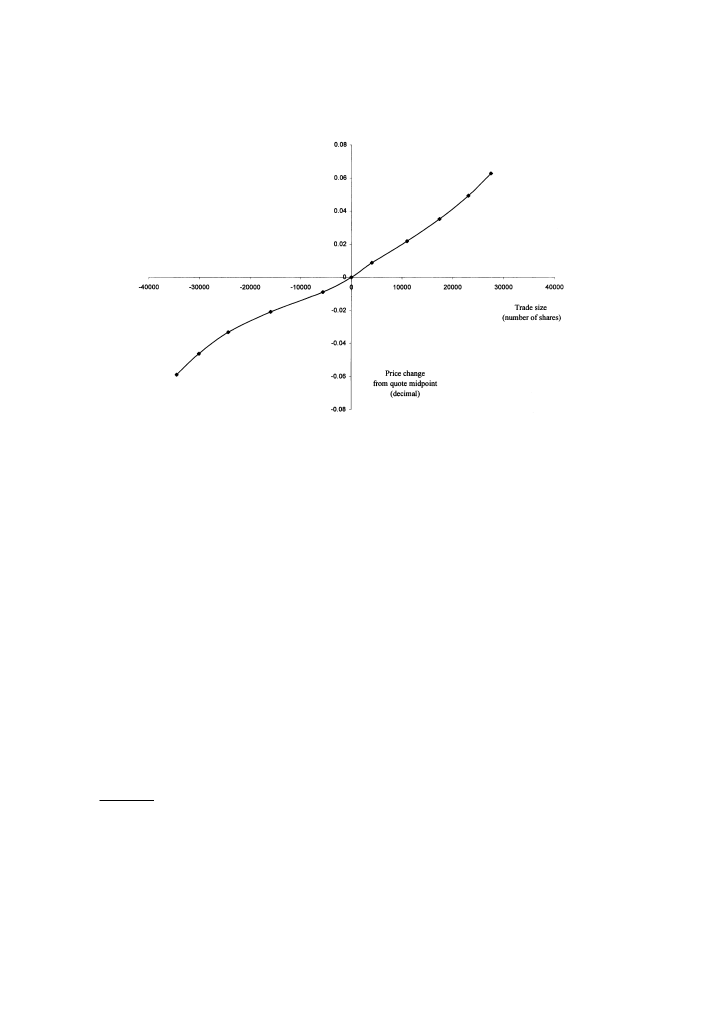
As Fig. 1 shows, the slope of the order book in our market does not depart
strongly from linearity.
28
It is slightly concave near the second quote and
convex thereafter. One possible interpretation for this shape is that the adverse
selection problem is more pronounced closer to the inside spread. This leads to
a higher inside spread, and smaller volumes at the ®rst best quotes. Since all of
the ®ve best quotes are available to market participants on the Paris Bourse,
and only the best two on the SSM, the contradiction between our results and
26
The number of orders contributing to each quote (not reported) also has the same pattern as
the volumes. Namely, they exhibit an inverted U-shape. They are largest at the second best quotes,
and smaller for the other quotes.
27
The test is conducted using dummy variable regressions of the form y b
1
d
1
b
p
d
p
,
where y is the relative inside spread (or the depth) for all stocks after we stack all observations; d
i
,
i 1; . . . ; p, is a dummy equal to one if the observation y belongs to the book level i; and p equals 9
for relative spread tests and 10 for the depth tests. We perform the reported equality tests using
dierent sets of linear restrictions.
28
On the SSM, large trades that execute against several limit orders at dierent prices will have
two prices: marginal and average prices. The plot of price changes for trades of dierent sizes (as in
Fig. 1) is an approximation of the marginal price function of the limit order book or of the slope of
the book.
M. Al-Suhaibani, L. Kryzanowski / Journal of Banking & Finance 24 (2000) 1323±1357 1335
those of Biais et al. may be due to the dierence in the information available,
which can aect the strategies of market participants. However, our data do
not allow us to determine how the volume would be distributed for a dierent
information disclosure structure.
Because the relative inside spread is larger and the depth lower, market li-
quidity as usually measured by width and depth is relatively low.
29
Market
order traders can buy or sell a large number of shares but only at high
transaction costs.
4.2. Tick size and price discreteness
The SSM has one tick size of SR 1, which imposes price discreteness and
forms a lower bound on the spread. The prices of the stocks in our sample
range from 24 to 956 SR implying a minimum relative spread (or relative tick
Fig. 1. The average price schedule on the SSM. Using the average relative spreads and depths at
various levels of the order book, this ®gure plots the decimal changes in the transaction price
relative to the quote midpoint for trades of dierent sizes. Negative trade sizes represent sell
transactions.
29
Four dimensions are often associated with liquidity in the market microstructure literature:
width, depth, immediacy and resiliency. According to Harris (1990), width refers to the spread for a
given number of shares, depth refers to the number of shares that can be traded at given quotes,
immediacy refers to how quickly trades of a given size can be done at a given cost, and resiliency
refers to how quickly prices revert to former levels after they change in response to large order ¯ow
imbalance initiated by uninformed traders. Overall, a market is liquid if traders can quickly buy or
sell large numbers of shares when they want at a low transaction cost.
1336 M. Al-Suhaibani, L. Kryzanowski / Journal of Banking & Finance 24 (2000) 1323±1357

size 1/price) between 4.21% and 0.1%. The median relative tick size is 0.9%
which is relatively large compared to the median relative tick size for major
stock markets. Using data for 2517 stocks that constitute the majority of the
capitalization in the world equity market, Angel (1997) ®nds that the median
relative tick size is equal to 0.259%.
Theoretically, a large tick size encourages limit order traders to provide li-
quidity to the market, and imposes higher transaction costs on market order
traders. Given the price and time priority rules, the limit order trader has a ®rst
mover advantage only if the tick size is large enough to prevent quote
matching.
30
If the tick size is small, then the quote matcher obtains time
precedence by submitting an order at a price slightly better than the standing
quote.
Based on the summary statistics on tick size reported in Table 4, 53.77% of
the inside spreads are binding (the inside spread equals one tick), 22.48%
equal two ticks, and 23.75% equal three or more ticks. Tick size is more
important for lower priced stocks. The tick size is binding for 76.7% of the
observations for stocks in the lowest price category, and for only 25.86% of
the stocks in the highest price category. In unreported results, we ®nd that the
majority of the other spreads are binding even for highly priced stocks. The
last row of Table 4 supports the assertion that large tick size encourages limit
order traders to provide liquidity to the market. The percentage of limit or-
ders submitted to the market increases as the relative tick size increases. This
might suggest that a larger tick induces liquidity. A larger tick however in-
creases transaction costs for market order traders, which may reduce overall
liquidity for stocks. The optimal tick, as Angel (1997) concludes, is not zero.
Its optimal size represents a trade-o between the bene®ts of a nonzero tick
for limit order traders and the cost that a tick imposes on market order
traders.
4.3. Availability of immediacy
Immediacy is available in the market when a market order can be in-
stantaneously executed. In an order-driven market as the SSM, the avail-
ability of immediacy depends upon the limit order traders. Immediacy will be
unavailable if no public limit orders are present. Table 5 summarizes the
percentages of time when immediacy is unavailable at all levels of the book.
Despite the absence of market makers, market liquidity measured by im-
mediacy is notably high. On average, the immediacy at the ®rst best bid
and ask is unavailable for only 1.51% and 1.19% of the total trading time,
30
Quote-matchers are traders whose willingness to supply liquidity depends on the limit orders
of other liquidity suppliers. Harris (1990) discusses the quote-matcher problem in detail.
M. Al-Suhaibani, L. Kryzanowski / Journal of Banking & Finance 24 (2000) 1323±1357 1337

respectively.
31
As expected, most active stocks have even lower percentages.
The dierence between the ®ve categories becomes more evident as we move
away from the ®rst best quotes.
4.4. Intraday pattern in the order book
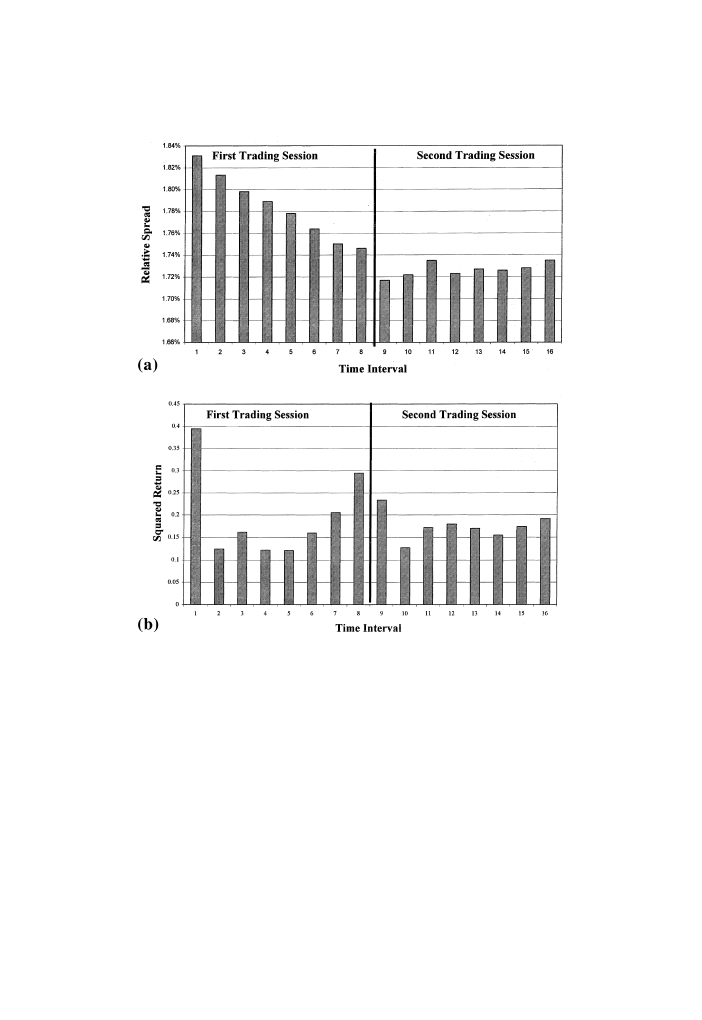
In this section we examine the intraday patterns in the relative inside spread,
depth and the squared quote midpoint return.
32
As shown in Fig. 2, the rel-
ative inside spread decreases over the ®rst trading session, and is fairly constant
over the second. The test results reported in Panel A of Table 6 support this
result. In the ®rst session, the last trading interval has the lowest relative spread
(1.74%). The regression is constructed so that the slopes represent the dierence
between the mean relative spread in this interval and the other intervals in the
Table 4
Tick size statistics for the SSM
a
Variable
All
stocks
Price level sub-samples
1 (Lowest) 2
3
4
5 (Highest)
Number of quotes at all
levels (in millions)
5.688
0.913
1.111
1.120
1.255
1.164
Quote midpoint range
23.62 to
956.15
23.62 to
64.71
64.71 to
93.48
93.48 to
167.71
167.71 to
329.57
329.57 to
956.15
Average quote midpoint
195.27
46.37
77.94
118.72
226.32
469.73
Inside spreads that equal
one tick (%)
53.77
76.70
62.10
52.77
52.09
25.86
Inside spreads that equal
2 ticks (%)
22.48
16.89
21.98
25.34
25.97
21.97
Inside spreads that equal
3 or more ticks (%)
23.75
6.41
15.91
21.89
21.93
52.17
Spread (in ticks)
2.278
1.336
1.825
1.965
2.193
4.196
Relative inside spread
1.79%
3.12%
2.27%
1.70%
1.02%
0.91%
Relative tick size
1.04%
2.38%
1.30%
0.87%
0.46%
0.22%
Limit order (%)
59.4
64.2
61.4
60.9
58.1
56.8
a
This table presents statistics on tick sizes on the SSM. The statistics are computed for all 56 stocks
in the sample and for ®ve sub-samples classi®ed by the mean of stock price during the sample
period. We classify the sample using price because the tick is constant and equal to SR 1 for all
stocks, which implies that the relative tick size can be measured by the inverse of price. Since the
tick size is one, the spread (in ticks) is the same as the observed spread in the market. The relative
inside spread is (®rst best ask ± ®rst best bid)/quote midpoint. Quote midpoint (®rst best
ask + ®rst best bid)/2. The relative tick size is 1/quote midpoint. Limit order is the percentage of
limit orders to the total number of orders.
31
We should keep in mind that these statistics are for the more active stocks in the market since
we eliminated the most thinly traded stocks from our sample.
32
The quote midpoint is the average of the best bid and ask quotes.
1338 M. Al-Suhaibani, L. Kryzanowski / Journal of Banking & Finance 24 (2000) 1323±1357

session. As constructed, the t-statistics are direct tests of whether any dier-
ences exist in mean relative spreads. Moving from the ®rst to the seventh co-
ecient estimate one ®nds that both the dierence and signi®cance decrease.
We also reject the hypothesis that all dierences are zero. In contrast, no sig-
ni®cant patterns are identi®ed in the second trading session.
While many studies document a U-shaped intraday pattern for the
spread,
33
other studies report patterns similar to that found in our market.
Chan et al. (1995a) ®nd that NASDAQ spreads are at their highest at the open
and narrow over the trading day. Similar results are reported by Chan et al.
(1995b) for the CBOE options, and by Niemeyer and Sandas (1995) and He-
dvall (1995) for two order-driven markets, the Stockholm Stock Exchange and
the Helsinki Stock Exchange, respectively.
If the spread is a good proxy for transaction costs, the relative inside spread
pattern together with patterns found in trading activities (see Section 5.3) is not
supportive of most of the models for explaining trade concentration. Admati
and P¯eiderer (1988) present a model where concentration of trading may be
generated at an arbitrary time of the day. Liquidity traders, particularly traders
who have to trade within a given time period, pool their trades in an eort to
Table 5
The availability of immediacy at all levels of the book on the SSM
a
Variable
All stocks Order frequency sub-samples
1 (Lowest)
2
3
4
5 (Highest)
Mean number
of orders
4777
564
1536
3157
5897
11,544
Immediacy is unavailable (%)
B5
43.66
73.98
70.47
45.04
19.92
8.75
B4
30.36
58.83
55.50
23.25
12.02
2.88
B3
16.25
39.85
29.13
8.93
3.55
0.46
B2
5.30
15.78
5.86
3.60
1.39
0.04
B1
1.51
4.35
0.64
1.50
1.07
0.00
A1
1.19
4.59
0.16
1.21
0.01
0.00
A2
4.68
16.68
4.24
1.71
1.03
0.00
A3
13.42
40.97
23.14
2.73
1.22
0.02
A4
23.30
64.18
44.05
8.10
1.40
0.12
A5
32.73
80.04
60.22
21.84
2.04
0.48
a
This table summarizes the relative durations of times when immediacy is unavailable at the best
®ve quotes on both sides of the market. Immediacy will be unavailable whenever there is no limit
order to buy or sell. Relative duration is the total time that immediacy was impaired as a percentage
of the time that the SSM was open over the sample period. B and A denote bid and ask, respec-
tively. B1 and A1 are the ®rst best bid and the ®rst best ask, respectively.
33
Studies which ®nd a U-shaped pattern in the spread include Brock and Kleidon (1992),
McInish and Wood (1992), Foster and Viswanathan (1993) and Lehmann and Modest (1994).
M. Al-Suhaibani, L. Kryzanowski / Journal of Banking & Finance 24 (2000) 1323±1357 1339
reduce their transaction costs. Informed traders, in an attempt to hide their
trading intentions, also trade at the same time. The model predicts that traded
volume should be highest when transaction costs are lowest. Similarly, Brock
and Kleidon (1992) conjecture that periodic market closure results in greater
liquidity demand at the open and close. In response, liquidity suppliers may
practice price discrimination by changing their quotes during these periods of
high demand. This model implies high transaction volumes and concurrent
wide spreads at both the open and close.
Fig. 2. Intraday patterns in the order book. This ®gure reports the intraday relative inside spreads
and squared quote midpoint returns. Each trading session is divided into eight intervals, and the
daily relative spread and squared midpoint return are computed for each interval for all stocks in
the sample. The bars are the averages over the 65 days in the sample. The relative inside
spread (best ask ) best bid)/QMP, where QMP denotes quote midpoint (best ask + best bid)/2.
The quote midpoint return is calculated as log(QMP
t
) ) log(QMP
tÿ1
). (a) Intraday relative spread.
(b) Intraday squared return (´100,000).
1340 M. Al-Suhaibani, L. Kryzanowski / Journal of Banking & Finance 24 (2000) 1323±1357

Ta
ble
6
Test
s
for
intra
day
patte
rns
in
the
order
book
for
the
SS
M
a
Interval
Coe
cient
t-St
atistic
P
-valu
e
Pa
nel
A
:
Relativ
e
inside
spre
ad
(´
100)
Firs
t
sess
ion
No.
of
observat
ions
520
Om
itted
interval
8
B
8
1.745
6
86.60
36
0
F(7
,512)
2.302
B
1
±B
8
0.085
7
2.990
6
0.0029
P
-value
0.025
6
B
2
±B
8
0.067
3
2.450
1
0.0146
B
3
±B
8
0.051
9
1.863
4
0.063
B
4
±B
8
0.043
8
1.545
2
0.1229
B
5
±B
8
0.032
1
1.131
6
0.2583
B
6
±B
8
0.018
7
0.654
0.5134
B
7
±B
8
0.004
9
0.173
2
0.8626
Seco
nd
sess
ion
No.
of
observat
ions
432
Om
itted
interval
1
B
1
1.717
73.88
43
0
F(7
,512)
0.093
3
B
2
±B
1
0.004
8
0.149
3
0.8814
P
-value
0.998
6
B
3
±B
1
0.018
0.581
0.5616
B
4
±B
1
0.005
8
0.190
8
0.8487
B
5
±B
1
0.010
1
0.328
7
0.7426
B
6
±B
1
0.008
9
0.292
6
0.7699
B
7
±B
1
0.011
4
0.379
5
0.7045
B
8
±B
1
0.017
7
0.611
1
0.541
Pa
nel
B:
Sq
uared
quote
midp
oint
retur
n
(
100,000)
Firs
t
sess
ion
No.
of
observat
ions
520
Om
itted
interval
5
B
5
0.121
1
5.241
7
0
F(7
,512)
4.235
4
B
1
±B
5
0.273
8
6.000
2
0
P
-value
0.000
1
B
2
±B
5
0.003
1
0.115
3
0.9083
B
3
±B
5
0.040
8
1.511
4
0.1313
B
4
±B
5
0.001
2
0.046
2
0.9632
M. Al-Suhaibani, L. Kryzanowski / Journal of Banking & Finance 24 (2000) 1323±1357 1341

Table
6
(Con
tinued
)
Inte
rval
Coe
cient
t-Stat
istic
P
-valu
e
B
6
±B
5
0.038
4
1.362
7
0.173
6
B
7
±B
5
0.083
6
2.444
8
0.014
8
B
8
±B
5
0.173
4
1.400
3
0.162
Seco
nd
sessi
on
No.
of
ob
servations
432
Om
itted
interval
2
B
2
0.127
9
7.821
1
0
F
(7
,512)
1.0904
B
1
±B
2
0.105
1
3.439
5
0.000
6
P
-value
0.3683
B
3
±B
2
0.044
4
1.371
9
0.170
8
B
4
±B
2
0.051
6
1.043
5
0.297
3
B
5
±B
2
0.041
6
1.047
1
0.295
7
B
6
±B
2
0.027
4
0.905
8
0.365
5
B
7
±B
2
0.045
8
1.612
2
0.107
7
B
8
±B
2
0.064
2
2.883
4
0.004
1
a
This
table
rep
orts
the
results
from
regr
essing
relativ
e
spread
s
and
squared
midpoin
t
retu
rns
on
a
set
of
du
mmy
variable
s.
Each
tradi
ng
sess
ion
is
divi
ded
into
eight
intervals.
The
daily
rela
tive
spread
s
and
squared
midpo
int
returns
are
comp
uted
for
each
interval
for
all
stocks
in
the
sam
ple.
The
regr
ession
equation
takes
the
form
Y
C
+B
1
D
1
+
+B
8
D
8
,whe
re
Y
denotes
the
rela
tive
inside
spread
(or
squared
quote
midpoin
treturn)
durin
g
all
inte
rvals
and
day
saft
er
all
the
obser
vatio
ns
are
stacked;
and
D
i
,i
1,
..
.,
8,
is
a
du
mmy
varia
ble
that
equa
ls
on
e
if
the
ob
servation
y
be
longs
to
interval
i.
T
o
avo
id
linear
dependen
cy
among
the
explan
atory
varia
bles,
on
ly
seven
of
the
eight
possib
le
dummy
varia
bles
are
use
d
in
each
regr
ession
.The
dummy
variable
belongin
g
to
the
interval
with
the
lowe
st
mean
is
deleted
for
this
purp
ose.
In
this
formulation,
the
co
nstant
term
repres
ents
the
coe
cient
of
the
de
leted
dummy
varia
ble,
w
hile
the
oth
er
coecients
rep
resent
the
di
erence
betw
een
each
of
the
other
inte
rvals
and
the
omit
ted
inte
rval.
t-Statisti
cs
bas
ed
on
White
covaria
nce
matr
ix
estimati
on
provid
e
a
direct
test
of
w
hether
any
intra
day
dieren
ces
exis
t
betw
een
the
omitt
ed
inte
rval
and
the
oth
er
intervals.
F-stat
istics
show
the
overall
signi®can
ce
(all
di
erences
are
ze
ro).
Sepa
rate
regressions
are
performe
d
for
eac
h
trading
sess
ion.
1342 M. Al-Suhaibani, L. Kryzanowski / Journal of Banking & Finance 24 (2000) 1323±1357

However, the observed spread pattern for the SSM can be explained using
the model of Madhavan (1992). The high spread in the morning is due to
greater uncertainty. As information asymmetries are partially resolved, traders
become informed by observing the market. This leads to a decline in the spread
during the day. The explanation oered by Chan et al. (1995b) attributes such a
spread pattern to the absence of specialist market power.
We use the squared midpoint quote returns as a measure of stock return
volatility. As shown in Fig. 2 and the regression results reported in Panel B of
Table 6, volatility is at its highest during the ®rst trading interval, followed by
the last trading interval before the close.
34
Considered in isolation, this ®nding
is consistent with the information-based model of Admati and P¯eiderer
(1988), which predicts that high volume periods have more informative and
hence more volatile prices. No signi®cant patterns are identi®ed for the number
of shares and volume for the ®rst best quotes.
5. Order ¯ow dynamics on the SSM
In this section, we investigate the dynamics of order ¯ow on the SSM. We
condition our analysis on order direction (buy or sell), price position, state of
the book, and time of the day.
5.1. Order ¯ow and the limit price position
We divide the orders into 14 categories (or events) based on limit price
position. On the buy side, the price position of a buy order may be above the
prevailing ask (aggressive market buy), at the prevailing ask (market buy),
within the existing spread (limit buy within), at the prevailing bid (limit buy at),
below the prevailing bid but above or at the second bid (limit buy below), and
below the second bid (hidden limit buy). The last event is the cancelation of a
previously posted limit buy. Orders on the sell side are categorized similarly.
The frequency of each occurrence is documented in the last row of Table 7.
With regard to market orders, the most frequent events are market sell and buy
orders (11.48% and 13.41%, respectively). The frequency of aggressive orders is
very small. On the limit order side, the most frequent events are limit orders at
prevailing quotes.
In Table 7, the columns correspond to an event at time t, and the rows to
events at time t ) 1. Each row reports the percent frequency of each of the
34
The U-shaped pattern in volatility is documented for other markets by Wood et al. (1985),
Harris (1986), McInish and Wood (1992), Foster and Viswanathan (1993), and Lehmann and
Modest (1994).
M. Al-Suhaibani, L. Kryzanowski / Journal of Banking & Finance 24 (2000) 1323±1357 1343

Table
7
Ord
er
¯o
w
condit
ional
on
the
posit
ion
of
the
last
limit
pric
e
a
t
Numbe
r
of
observatio
ns
Aggr
essive
mar
ket
sell
Aggr
essive
marke
t
buy
M
arket
sell
Mark
et
buy
Limit
sell
within
Lim
it
buy
w
ithin
Limit
sell
at
tÿ
1
Panel
A:
All
obse
rvatio
ns
Aggr
essive
mar
ket
sell
2297
50.63
0.04
3.27
1.31
4.01
0.87
0.44
Aggr
essive
mar
ket
bu
y
5307
0.00
50.29
0.96
2.37
0.49
4.22
1.51
Mark
et
sell
3158
0
1.72
0.15
35.46
3.97
8.04
1.56
2.59
Mark
et
buy
3690
1
0.06
1.86
3.25
44.81
2.56
8.92
24.26
Limit
sell
within
1082
5
0.06
0.78
6.15
32.47
13.67
2.82
7.17
Limit
buy
within
1025
0
0.36
0.39
25.23
6.25
4.01
13.32
5.86
Limit
sell
at
3191
1
0.05
0.21
3.07
22.51
1.91
2.38
29.96
Limit
buy
at
3391
1
0.04
0.16
21.72
3.77
3.14
1.96
6.75
Limit
sell
above
1203
5
0.07
6.12
4.37
7.18
2.68
2.46
9.40
Limit
buy
below
1241
3
1.84
0.37
7.79
5.04
3.44
2.77
7.21
Hidde
n
limit
sell
2775
9
0.12
2.03
5.01
5.64
3.14
2.83
8.03
Hidde
n
limit
bu
y
1828
8
0.71
0.51
5.93
4.59
2.98
2.53
5.17
Cancel
limit
sell
2538
2
0.19
0.60
8.56
6.02
3.58
2.84
9.09
Cancel
limit
bu
y
1657
2
0.29
0.42
8.00
5.82
3.48
3.23
8.00
Unco
nditional
2752
46
0.83
1.93
11.48
13.41
3.94
3.73
11.60
Limit
buy
at
Limit
sell
above
Limit
buy
below
Hid
den
limit
sell
Hidde
n
limit
buy
Cancel limit
sell
C
ancel
limit
bu
y
Aggr
essive
mar
ket
sell
1.18
0.30
23.29
0.96
7.10
0.96
5.66
Aggr
essive
mar
ket
bu
y
0.89
19.79
0.55
10.97
1.41
5.88
0.70
Mark
et
sell
38.22
0.94
1.03
1.94
1.36
1.53
1.62
Mark
et
buy
3.35
1.10
0.99
2.55
1.53
3.96
0.87
Limit
sell
within
6.55
4.72
3.12
9.40
4.91
5.89
2.30
1344 M. Al-Suhaibani, L. Kryzanowski / Journal of Banking & Finance 24 (2000) 1323±1357
Limit
buy
within
8.78
3.47
7.06
8.13
8.57
5.68
3.08
Limit
sell
at
5.61
4.68
3.35
8.82
4.08
11.56
1.83
Limit
buy
at
22.06
3.36
6.77
8.67
5.98
7.29
8.41
Limit
sell
above
7.47
17.57
4.15
17.03
5.57
15.0976
0.847
5
Limit
buy
below
12.28
3.89
13.43
10.06
13.73
1.45
16.70
Hidden
limit
sell
7.38
5.86
4.13
26.46
6.57
21.86
0.95
Hidden
limit
bu
y
6.56
3.06
6.04
9.65
21.77
0.88
29.60
Cancel
limit
sell
8.45
5.31
4.24
15.30
5.45
27.34
3.18
Cancel
limit
bu
y
11.24
3.96
7.52
10.42
16.70
3.50
17.62
Uncon
ditio
nal
12.32
4.37
4.51
10.09
6.65
9.22
6.01
Panel
B:
Diag
onal
percen
t
frequ
encies
in
the
sub-sa
mples
Nu
mber
of
ob
servations
Aggr
essive
marke
t
sell
Aggressive marke
t
buy
M
arket
sell
Mark
et
buy
Limit
sell
within
Limit
buy
winth
in
Limit
sell
at
The
same
trade
r
79627
86.92
88.94
73.52
77.19
43.92
51.46
22.82
Dierent
tr
aders
1955
63
2.73
10.41
2.83
8.81
4.79
4.20
31.13
Lim
it
buy
at
Limit
sell
above
Limit
bu
y
below
Hid
den
limit
sell
Hidden limit
buy
Cancel limit
sell
Canc
el
limit
bu
y
The
same
trade
r
30.21
12.24
8.5
30.45
27.1
18.75
17.16
Dierent
tr
aders
20.79
19.18
15.21
24.57
17.72
28.33
17.71
a
For
all
tr
ading
days
and
stocks,
this
table
reports
the
empirical
pe
rcent
freque
ncies
for
14
events
rela
ted
to
limit
price
position,
condit
ional
on
th
e
previo
us
event.
The
events
are
as
they
are
de®ned
in
Section
5.1.
Row
s
corres
pond
to
events
at
time
tÿ
1,
and
co
lumns
corres
pond
to
events
at
time
t.
Each
row
adds
up
to
100%
.
M. Al-Suhaibani, L. Kryzanowski / Journal of Banking & Finance 24 (2000) 1323±1357 1345

twelve events conditional on the event in that row. The table supports the
``diagonal eect'' found in Biais et al. (1995) that the probability that a given
event will occur is larger after this event has just occurred than it would be
unconditionally. For example, market sell (buy) orders are most frequent after
market sell (buy) orders.
35
Biais et al. put forward three explanations for this
correlation. First, the succession of identical types of orders could re¯ect
strategic order splitting, either to reduce the market impact of a non-infor-
mational trade, or to get the most from private information about the value of
the stock. Second, if dierent traders are imitating each other, the cause of the
correlation is the order ¯ow itself. Finally, traders could react similarly to the
same events related to a particular stock or the economy as a whole.
Since our data sets do not identify traders, we cannot explicitly investigate
the three hypotheses concerning individual order submission behavior. How-
ever, we know that orders originating from the same order package certainly
belong to one trader, and this allows us to infer a subset of orders belonging to
the same trader. The fraction of observations where the same trader acted in
two subsequent events is 28.94% of all of the order ¯ow events.
36
If the order-
splitting hypothesis is the dominant factor in explaining order ¯ow correlation,
then we should observe higher percentages of subsequent events that are
initiated by the same trader. This is indeed the case as shown in Panel B in
Table 7. The percentages of the same trader subsequent events are larger for
most events, which indicates that the ``diagonal eect'' is more common in the
same trader subset. Hedvall and Niemeyer (1996) use a data set from the
Helsinki Stock Exchange that includes dealer identities and ®nd, as in our
market, that strategic order splitting is more common than imitation. Further,
the imitation hypothesis cannot explain the diagonal eect in hidden orders.
Since the traders have no incentive to split hidden orders, the only possible
explanation is traders reacting to similar information events.
The diagonal eect in the case of limit orders within the best quotes, not
conditional on trader identity, has been explained by the undercutting and
overbidding behavior of traders competing to supply liquidity to the market
(Biais et al., 1995). The results in Panel B of Table 7 do not support this ex-
planation. The gradual narrowing of the spread, as a result of placing quotes
within the spread, comes mainly from the same trader and not from compe-
35
The diagonal eect is present beyond one lag. When we account for additional lags, we ®nd
similar eects.
36
Given the limited information concerning trader identi®cation for our data set, the frequencies
of subsequent order events on dierent sides of the market from one trader are always zero. In
reality, these frequencies may not be zero. However, the fact that market regulation does not match
and execute two orders if they are generated from the same trader makes this possibility less likely.
One trader can make a market in one or more stocks by posting limit orders on both sides of the
market, but he can not make a false market by executing his market orders against his limit orders.
1346 M. Al-Suhaibani, L. Kryzanowski / Journal of Banking & Finance 24 (2000) 1323±1357

tition between dierent traders. However, the succession of cancelation is
consistent with the explanation that traders imitate each other or react simi-
larly to the same events.
Based on Panel A of Table 7, we ®nd that market buys (sells) are excep-
tionally frequent after asks (bids) at and within the best quotes. Traders prefer
to wait for additional liquidity to be provided, and preferably at a better price,
before deciding to trade. In contrast, limit orders to buy (sell) at the quotes are
particularly frequent after market sell (buy) orders. Since a market sell (buy)
order consumes the existing liquidity and may lead to a downward (upward)
shift in the book, the observed behavior may re¯ect competition between limit
order traders to restore liquidity. Market liquidity in terms of resiliency is
considerable.
Several other observations are consistent with information eects in the
order process. After aggressive and market sell (buy) orders, there are often
new limit sell (buy) orders placed within the quotes. Furthermore, limit buy
(sell) orders placed away from the quote and cancelations on the buy (sell) side
of the book are more frequent after aggressive market sell (buy) orders. The
order book tends to shift downward (upward) after aggressive market sell (buy)
orders. This behavior could re¯ect the adjustment in market expectations to the
information content of these trades. Biais et al. observe a similar eect after
large trades, and attribute their observation to the information eect.
Using v
2
tests for the signi®cance of the equality between the conditional
and unconditional probability for all stocks, we reject the hypothesis at the 1%
level.
5.2. Order ¯ow and the state of the order book
Table 8 reports the probabilities of dierent types of orders and trades oc-
curring given the previous state of the book. The state of the book is sum-
marized by the size of the inside bid±ask spread and the depth at the ®rst best
quotes. Both the spread and depth for a given stock are de®ned to be large
(small) when they are larger (smaller) than their respective time series medians
over the sample period. Consistent with earlier theoretical and empirical
®ndings for order ¯ow, market orders occur more frequently when the spread is
tight. Limit orders occur within the spread more frequently when the spread is
large. Limit orders ``oer liquidity when it is scarce'' and market orders
``consume it when it is plentiful'' (Biais et al., 1995).
Limit orders within the spread occur more frequently when the depth at the
quote is large, and limit orders at the quotes are relatively more frequent when
the depth is small. Given the price and time priority rules, the only way to
increase the probability of execution when the depth is large (and especially
when the spread is large) is to undercut or overbid the best quote. Based on v
2
M. Al-Suhaibani, L. Kryzanowski / Journal of Banking & Finance 24 (2000) 1323±1357 1347

Ta
ble
8
Ord
er
¯o
w
cond
itional
on
the
st
ate
of
the
order
book
a
Sprea
d
Depth
Numb
er
of
obser
-
vatio
ns
Aggres- sive market sell
Aggr
es-
sive mar
ket
bu
y
M
arket
sell
Market buy
Limit sell within
Limit buy within
Limit sell
at
Limit buy
at
Limit sell above
Limit buy below
Canc
el
limit sell
Canc
el
limit buy
La
rge
Large
128,486
0.73
1.71
11.02
13.46
5.31
5.11
11.31
11.11
12.64
9.81
10.81
6.98
Small
104,145
0.65
1.54
9.75
10.87
3.04
2.63
13.26
14.98
17.44
13.40
7.50
4.93
Small
Large
17,30
4
2.06
4.63
13.75
16.68
2.70
3.63
8.62
8.76
11.06
9.73
10.60
7.78
Small
25,31
1
1.30
2.80
19.29
21.35
1.46
1.28
8.25
9.98
12.83
9.73
7.31
4.41
Unco
n-
ditio
nal
275,246
0.83
1.93
11.47
13.41
3.94
3.73
11.60
12.32
14.37
11.16
9.22
6.02
a
For
all
tradi
ng
days
and
stocks,
this
table
rep
orts
the
empirical
percent
freq
uencies
for
twelve
events
related
to
limit
price
po
sition
condit
ional
upon
the
stat
e
of
the
book
(summarized
by
spread
and
depth)
one
sec
ond
before
subm
itting
the
ord
er.
Aggressive
(mar
ket)
order
is
an
order
with
pric
e
better
than
(equal
to)
the
opposit
e
prevailing
qu
ote.
Limit
order
w
ithin
(at,
above
or
below)
is
the
ord
er
priced
within
(at,
away
fr
om)
the
inside
spread.
For
each
stoc
k,
the
spread
and
de
pth
are
de®ned
to
be
large
,i
f
they
are
larger
than
thei
r
time-s
eries
media
ns
during
the
sam
ple
period
.
1348 M. Al-Suhaibani, L. Kryzanowski / Journal of Banking & Finance 24 (2000) 1323±1357

tests, we reject the null hypothesis at the 1% level of the independence between
the order and trade events and the state of the book.
5.3. Order ¯ow and the time of the day
In this section, we examine the pattern of number and volume of all, limit
and sell orders, and all, small and large transactions. As Fig. 3 shows, the
number and volume of all new orders and transactions exhibit a U-shaped
pattern during each within-day session, and a W-shaped pattern over the
trading day. The proportions of orders and trades submitted are largest in the
morning. The proportions in the ®rst trading interval in the second session are
usually larger than the proportions at the end of the day. The concentration
around the open and close are like those observed in many stock markets with
dierent microstructures.
37
The call market may be a contributing factor to the concentration at the
opening. Since all qualifying orders are executed at a single price at the open,
traders bene®t from their orders being executed at a price better than their
quote. Limit order traders are less aected by free option problems at the
open, and lose less to informed traders if they trade during the call mar-
ket.
38
The large proportion of limit orders during the ®rst interval of each
session supports this explanation. The high level of limit orders at the end of
every trading session could result from limit price adjusting.
39
Less patient
traders start to adjust their prices as the end of the session approaches in
order to induce other traders to execute against them (Niemeyer and Sandas,
1995).
A larger proportion of small orders is executed at the opening, whereas
larger proportions of large orders are executed during and at the end of the
session. One possible explanation for this behavior put forward by Biais et al.
(1995) is that small traders at the opening contribute to price discovery, while
large trades tend to occur after price discovery has already occurred.
We test for the signi®cance of the patterns in number and volume for new
orders and transactions using a similar regression to the regression used in
Section 4.4. The unreported results indicate signi®cant U-shapes. No signi®-
cant intraday pattern was identi®ed for transaction price.
37
See, for example, Jain and Joh (1988), McInish and Wood (1990,1991), Gerety and Mulherin
(1992), Foster and Viswanathan (1993), Biais et al. (1995) and Niemeyer and Sandas (1995).
38
If a trader trades only at the call, then the option value of his order is smaller because it is good
at the time of the call.
39
Adjusting the limit order price or quantity results in the order receiving new date and time
stamps. Accordingly, an order adjustment leads to two events: canceling an existing order, and
submitting a new one.
M. Al-Suhaibani, L. Kryzanowski / Journal of Banking & Finance 24 (2000) 1323±1357 1349
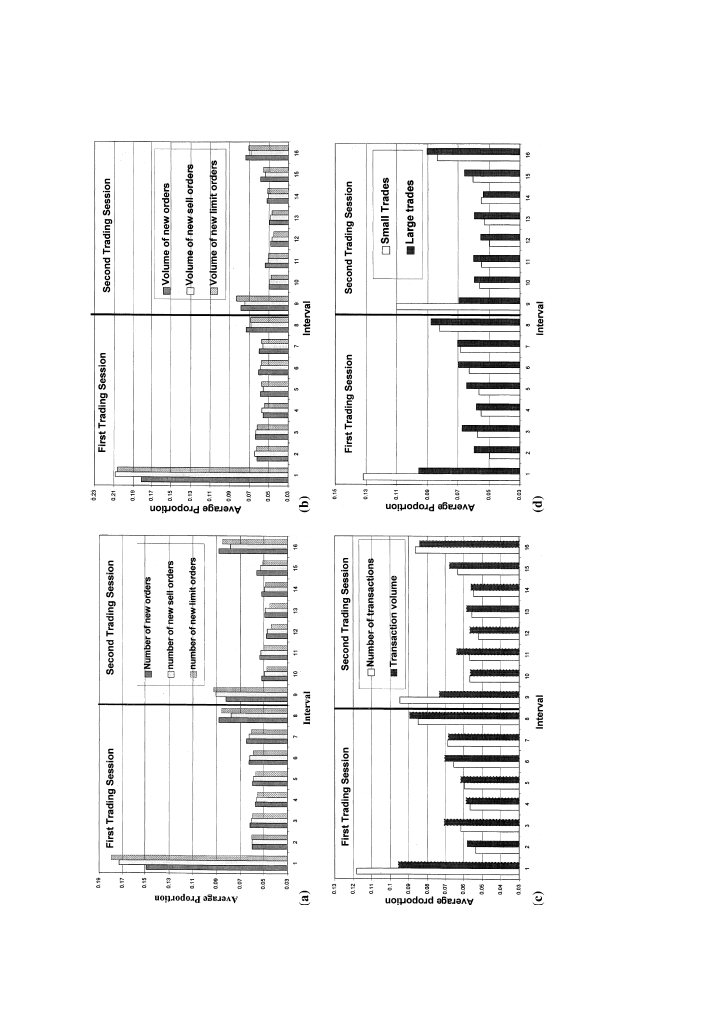
Fig.
3.
Intraday
patterns
in
the
order
¯ow
on
the
SSM.
V
arious
plots
of
the
number
and
volume
of
new
orders
and
transactions
are
provided
below.
Each
trad
ing
session
is
divided
into
eight
trading
intervals,
and
the
number
and
volume
of
orders
(transactions)
in
each
interval
are
computed
as
proportions
of
th
e
total
daily
number
and
volume
of
orders
(transactions).
Each
bar
is
the
average
proportion
across
the
65
trading
days
in
the
sample.
Transactions
are
de®ned
to
be
large
if
they
exceed
their
time
series
medians
over
the
sample
period.
(a)
Number
of
orders.
(b)
O
rder
volume.
(c)
Transactions.
(d)
T
rade
size.
1350 M. Al-Suhaibani, L. Kryzanowski / Journal of Banking & Finance 24 (2000) 1323±1357

6. The analysis of order execution
Market liquidity can be measured by the cost of eecting a transaction at a
given point of time, or by the time it takes to transact (Lippman and McCall,
1986; Amihud and Mendelson, 1989). In our examination of the order book
and order ¯ow, various aspects of the cost measure of market liquidity (such as
width, depth, resiliency and the availability of immediacy) were addressed. The
cost measure of liquidity is more relevant to market order traders whose ob-
jective is to obtain immediacy at a low cost. The time measure of liquidity is
more relevant to limit order traders, who supply liquidity on the SSM. In a
setting where limit orders provide immediacy and wait for order execution,
liquidity is measured by the expected time to execute a limit order at a given
price, and more generally, by the probability of limit order execution. In this
section, we examine these issues.
6.1. Order duration given limit order characteristics
The duration of an order, T
i
, is the length of time until the order is executed,
canceled or expired. In this subsection, we analyze order duration data using
survival analysis. This statistical technique is very suitable for modeling order
duration, since order durations are non-negative and random. This statistical
technique allows us to estimate the conditional distribution of limit order ex-
ecution times, T
i
, as a function of explanatory variables, x
i
, such as order
characteristics and state of the book, F(T
i
<t | x
i
). F is the CDF of the
Weibull distribution, 1 ÿ exp ÿk
i
t
p
and k
i
exp ÿx
0
i
b.
40
The parameters p
and b can be estimated by maximum likelihood. Following Lo et al. (1997), we
treat limit orders that are canceled or expired as censored observations. Ig-
noring the information in non-executed orders can bias the estimator of the
conditional distribution of execution times.
We estimate the survival model for buy and sell limit orders. The set of
regressors in x includes a constant, an aggressiveness indicator, order size,
number of orders per package, the inside spread, order imbalance, shares in the
book, prior market order, and a volatility measure. Following Harris (1996),
we measure order aggressiveness by 1 ÿ 2 A ÿ P= A ÿ B for buy orders and
the negative of this quantity for sell orders, where A(B) denotes the ®rst best
ask (bid), and P is the limit order price. This measure assigns a value of one to
market orders and less than one to limit orders. Limit orders placed at the
40
We used the Weibull distribution because it allows for duration dependence. The hazard
function for the Weilbull distribution can be monotonically increasing or decreasing in t depending
on p.
M. Al-Suhaibani, L. Kryzanowski / Journal of Banking & Finance 24 (2000) 1323±1357 1351

quote have a value of ±1, and the dierence between the order price and the
best quote on the same side increases as this value gets smaller.
The order imbalance variable is de®ned as k Q
b
= Q
b
Q
s
, for buy orders
and 1 ÿ k for sell orders, where Q
s
Q
b
is the number of shares oered at A
(demanded at B) at the time of order entry. Shares in the book is the number of
shares in the book ahead of the order which have a higher priority for exe-
cution. Prior market order is the ratio of the market orders that are initiated by
the same side of the market to the total market orders submitted during the last
half-hour. Following Lo et al. (1997), we use the ratio of trades (market orders)
in the last half hour to trades in the last one hour as a proxy for high frequency
changes in volatility. The sign of the coecient on each explanatory variable
indicates the direction of the eect of that variable on the conditional proba-
bility of executing limit orders and on the expected time to execution. We es-
timate the model using the pooled data for all 56 stocks in the sample.
Table 9 reports the estimates of the coecients and the median of the
Weibull distribution. The negative sign on the aggressiveness indicator implies
Table 9
Survival analysis results
a;b
Buy orders
Sell orders
Number of observations
Number of observations
80257
89987
Censored observations
39.21%
44.35%
Parameter estimate for independent variable
Constant
6.7729
1.0914
Price aggressiveness
)2.0145
)0.4465
Number of orders per package
)0.0024
0.0317
Number of shares
0.0958
)0.0061
Inside spread
0.4332
0.1766
Order imbalance
1.2208
0.6988
Shares in the book
0.0001
0.0002
Prior market order
1.2423
3.3825
Volatility
0.274
0.9144
P
0.3238
0.2827
Median duration
72.5764
36.4784
a
This table reports the parameter estimates of the survival analysis of order durations using the
Weibull model, F tjx 1ÿ exp()kt)p and k exp ÿx
0
b). The duration of an order is the length of
time in minutes that the order stays active (®rm) in the market. Censored observations are limit
orders that are canceled or expired. The set of regressors in x includes a constant, an aggressiveness
indicator, order size, number of orders per package, the inside spread, order imbalance, shares in
the book, prior market order, and a volatility measure as they are de®ned in Section 6.1 of the body
of the paper. The estimate of median duration is calculated using, log(2)
1=p
k.
b
Also the hypothesis that the dierence between the coecient estimates for buy and sell orders for
each independent variable is equal to zero is rejected using the Wald test for all of the independent
variables.
*
Statistically signi®cant at the 1% level.
1352 M. Al-Suhaibani, L. Kryzanowski / Journal of Banking & Finance 24 (2000) 1323±1357

that the more aggressive the limit order price the shorter is the expected time to
execution. The result is a natural outcome of the price priority rule. The
number of orders per package is used to measure the degree of trader activity in
the market, where large numbers indicate more active traders. The eects of
this variable and order size on the expected time to execution are small and
change in sign. The inside spread has a positive eect on the expected time to
execution. These results imply that orders placed when the spread is wide are
more dicult to execute. A wider spread implies a higher transaction cost,
which provides little incentive for market order traders to execute against the
existing limit orders. Consistent with the prediction of the theoretical model of
Handa et al. (1996), as the order imbalance increases in favor of the other side
of the market, the expected time to execution increases. The sign of the esti-
mated coecient for the shares in the book variable is as expected. As the
number of shares that have higher priority of execution increases, we anticipate
an increase in the expected time to execution. However, the magnitude of the
eect is nearly zero. The estimated coecent for the variable of prior market
order is positive. This indicates that if the same side of the market initiates
most trades in the last half-hour, a longer time to execution is expected. The
result is intuitive because rising (falling) markets reduce the probability of
executing buy (sell) orders. Finally, the positive sign of the estimated coecient
for the volatility variable implies that a longer time to execution is expected
when the market is more volatile.
The estimate of p is 0.32 and 0.28 for buy and sell orders, respectively. This
means that the hazard function has negative duration dependence. That is, the
likelihood of executing a limit order at time t, conditional upon duration up to
time t, is decreasing in t. The longer a limit order waits for execution, the less
likely it is that it will be executed within, say, the next trading period.
6.2. The probability of executing limit orders
When immediacy is available during a continuous trading session, a trader
can trade with certainty using a market order and not a limit order. The
probability of executing a limit order is always less than one. In this section, we
analyze the probability of order execution using a logistic probability model.
The dependent variable, y, is the execution indicator, which equals one if the
order is executed and zero otherwise. The probability of execution is condi-
tioned on a set of regressors, x, Proby 1jx K x
0
b, where K() is the lo-
gistic cumulative distribution function. The marginal eect of x on the
probability is K x
0
b1 ÿ K x
0
bb. The set of regressors in x includes the same
set used in survival analysis. After pooling the data for all stocks, we estimate
the coecient, b, and the marginal eect (the slope). The results are reported in
Table 10. The marginal eect, K(), is evaluated at the mean of the variable.
Similar to the ®ndings in the previous subsection, price aggressiveness has a
M. Al-Suhaibani, L. Kryzanowski / Journal of Banking & Finance 24 (2000) 1323±1357 1353

positive eect on the probability of execution. Overall, limit orders with
``reasonable'' prices are highly liquid in terms of executability. The results also
indicate that more active traders have higher probabilities of execution. Active
traders frequently have standing ®rm orders at and away from the quote either
to make a market, or to seize the free option quickly. Since they also monitor
the market more closely, we expect them to adjust their exposed orders more
frequently than others. The negative signs on the estimated coecients for the
order size variable suggest that larger orders are more dicult to execute. The
signs of the estimated coecients of the volatility measure variable imply that
sell (buy) orders have higher (lower) probabilities of execution when market
conditions are more active. This could be attributed to the 9.23% rise in the
market index over the sample period. This rising market period also may
Table 10
Logit regression results
a;b
Number of observations and
R-squared values
Buy orders
Sell orders
Number of observations
80257
89987
Dependent variable equals one
47.28%
48.71%
McFadden pseudo R-squared
0.4149
0.4149
Parameter estimates for following
independent variables
Coecient
Slope
Coecient
Slope
Constant
3.3114
2.7978
Price aggressiveness
0.9419
0.1448
0.6327
0.0946
Number of orders per package
0.0063
0.001
0.0028
0.0004
Number of shares
)0.0637
)0.0098
)0.0323
)0.0048
Inside spread
)0.2052
)0.0315
)0.1947
)0.0291
Order imbalance
)0.7468
)0.1148
)0.157
)0.0235
Shares in the book
)0.0000
)0.0000
)0.0000
)0.0000
Prior market order
)0.5502
)0.0846
)1.2109
)0.1811
Volatility
)0.2434
)0.0374
0.2926
0.0438
a
This table reports the results for the logit regressions, yjx K(x
0
b, where y is a dummy variable
that is equal to one if the order is executed, and zero otherwise. The set of regressors in x includes a
constant, an aggressiveness indicator, order size, number of orders per package, the inside spread,
order imbalance, shares in the book, prior market order, and a volatility measure as they are de-
®ned in Section 6.1 of the text of this paper. K() is the logistic cumulative distribution function. The
coecient is the b estimate. The slope is the marginal eect of x on the probability of execution, as
given by K x
0
b)[1 ) K(x
0
bb, when K(x
0
b) is evaluated at the mean of the regressors. McFadden
pseudo R-squared is 1)(ln L/ln L
0
), where ln L and ln L
0
are the log-likelihood functions evaluated
at the unrestricted and restricted estimates (all coecients, except the constant, are zero), respec-
tively.
b
The hypothesis, that all the coecients (except the constant term) are equal to zero, is rejected
using both the Likelihood Ratio and Wald tests. The hypothesis, that the dierence between the
estimated coecients for buy and sell orders for each independent variable is equal to zero, also is
rejected using the Wald test for all but one variable (namely, the Number of shares).
*
Statistically signi®cant at the 1% level.
1354 M. Al-Suhaibani, L. Kryzanowski / Journal of Banking & Finance 24 (2000) 1323±1357

explain the signi®cant dierences between buy and sell orders identi®ed in
Tables 9 and 10. Other regression results in Table 10 are generally consistent
with the ®ndings that we obtained from the survival analysis.
7. Concluding remarks
In this paper, we describe and analyze the microstructure of the SSM under
the computerized trading system, ESIS. We analyze the order book, order ¯ow
and order execution using four rich data sets on orders, order packages, quotes
and transactions. Although the SSM has a distinct structure, its intraday
patterns are surprisingly similar to those found in other markets with dierent
structures. These include U-shaped patterns in traded volume, number of
transactions and volatility. Like other order-driven markets, the SSM exhibits
a U-shaped pattern in the placement of new orders.
We ®nd that the relative inside spread is higher only at the open and declines
gradually afterwards on the SSM. This pattern is similar to the one observed
for a number of markets without designated market makers. We ®nd that the
average relative inside spread is large compared to other markets, mainly due
to a relatively high tick size. Tick size is an important determinant of the inside
spread for low priced stocks, and for all other relative spreads. As in other
studies, we detect a ``diagonal eect'' in order ¯ow. Strategic order splitting
rather than imitation or competition hypothesis appears to be the dominant
factor causing this eect.
We ®nd that liquidity, as commonly measured by width and depth, is rel-
atively low on the SSM. However, it is exceptionally high when measured by
immediacy. We also present new evidence on other measures of market li-
quidity that are more relevant to order-driven markets. For example, we ®nd
that limit orders that are priced reasonably, on average, have a shorter ex-
pected time to execution, and have a high probability of subsequent execution.
Acknowledgements
Financial support from FCAR (Fonds pour la formation de chercheurs et
l'Aide a la Recherche), SSHRC (Social Sciences and Humanities Research
Council of Canada) and the Imam University are gratefully acknowledged. We
appreciate the comments of Anastasios Anastasopoulos, Abraham Brodt,
Gordon Fisher, Michael Sampson and two referees of this journal on earlier
versions of this paper. We would like to thank the Saudi Arabian Monetary
Agency for assistance in obtaining the data used in this paper. All remaining
errors are the authors' responsibility. Comments are welcomed.
M. Al-Suhaibani, L. Kryzanowski / Journal of Banking & Finance 24 (2000) 1323±1357 1355

References
Admati, A., P¯eiderer, P., 1988. A theory of intraday patterns: Volume and price volatility. The
Review of Financial Studies 1 (1), 3±40.
Amihud, Y., Mendelson, H., 1989. The eect of computer based trading on volatility and liquidity.
In: Lucas, H., Schwartz, R.A. (Eds.), The Challenge of Information Technology for the
Securities Markets: Liquidity, Volatility, and Global Trading. Dow Jones-Irwin, Homewood,
Illinois.
Angel, J., 1997. Tick size, share prices, and stock splits. Journal of Finance 52, 655±681.
Biais, B., Hillion, P., Spatt, C., 1995. An empirical analysis of the limit order book and the order
¯ow in the Paris Bourse. Journal of Finance 50, 1655±1690.
Brock, W., Kleidon, A., 1992. Periodic market closure and trading volume: A model of intraday
bids and asks. Journal of Economic Dynamics and Control 16, 451±489.
Butler, K., Malaikah, S., 1992. Eciency and ineciency in thinly traded stock markets: Kuwait
and Saudi Arabia. Journal of Banking and Finance 16 (1), 197±210.
Chan, L., Lakonishok, J., 1995. The behavior of stock prices around institutional trades. Journal of
Finance 50, 1147±1174.
Chan, K., Christie, W., Schultz, P., 1995a. Market structure and the intraday pattern of the bid±ask
spreads for NASDAQ securities. Journal of Business 68 (1), 35±60.
Chan, K., Chung, P., Johnson, H., 1995b. The intraday behavior of bid±ask spreads for NYSE
stocks and CBOE options. Journal of Financial and Quantitative Analysis 30 (3), 329±346.
Darwiche, F., 1986. The Gulf Stock Exchange: The rise and fall of the Souq Al-Manakh. Croom
Helm, London.
Foster, F., Viswanathan, S., 1993. Variations in trading volume, return volatility and trading costs:
Evidence on recent price formation models. Journal of Finance 48, 187±211.
Gerety, M., Mulherin, H., 1992. Trading halts and market activity: An analysis of volume at the
open and the close. Journal of Finance 47, 1765±1784.
Handa, P., Schwartz, R., Tiwari, A., 1996. The determinants of bid±ask spread in an order-driven
market, Working paper.
Harris, L., 1986. A transaction data study of weekly and intradaily patterns in stock returns.
Journal of Financial Economics 16, 99±117.
Harris, L., 1990. Liquidity, trading rules, and electronic trading systems, New York University
Salomon Center, Leonard N. Stern School of Business, New York.
Harris, L., 1996. Does a large minimum price variation encourage order exposure, Working paper,
University of South California.
Hedvall, K., 1995. Trade concentration hypotheses: An empirical test of information vs. demand
models on the Helsinki Stock Exchange. Journal of International Financial Markets,
Institutions and Money 3, 135±163.
Hedvall, K., Niemeyer, J., 1996. Order ¯ow dynamics: Evidence from the Helsinki Stock Exchange,
Working paper, Swedish School of Economics and Business Administration.
Hedvall, K., Niemeyer, J., Rosenqvist, G., 1997. Do buyers and sellers behave similarly in a limit
order book? A high-frequency data examination of Finnish Stock Market. Journal of Empirical
Finance 4, 279±293.
Jain, P., Joh, G., 1988. The dependence between hourly prices and trading volume. Journal of
Financial and Quantitative Analysis 23 (3), 269±282.
Lehmann, N., Modest, D., 1994. Trading and liquidity on the Tokyo Stock Exchange: A birdÕs eye
view. Journal of Finance 49, 951±984.
Lippman, S., McCall, J., 1986. An operational measure of liquidity. American Economic Review 76
(1), 43±55.
Lo, A.W., MacKinlay, A.C., Zhang, J., 1997. Econometric models of limit-order executions.
Working paper no. W6257, Cambridge, MA.
1356 M. Al-Suhaibani, L. Kryzanowski / Journal of Banking & Finance 24 (2000) 1323±1357

Madhavan, A., 1992. Trading mechanism in securities markets. Journal of Finance 47, 607±641.
Malaikah, S., 1990. Saudi Arabia and Kuwait: A study of stock market behavior and its policy
implications, Ph.D. dissertation, Michigan State University.
McInish, T., Wood, R., 1990. An analysis of transactions data for the Toronto Stock Exchange.
Journal of Banking and Finance 14, 441±458.
McInish, T., Wood, R., 1991. Hourly returns, volume, trade size, and number of trades. Journal of
Financial Research 14 (4), 303±315.
McInish, T., Wood, R., 1992. An analysis of intraday patterns in bid±ask spreads for NYSE stocks.
Journal of Finance 47, 753±764.
Niemeyer, J., Sandas, P., 1995. An empirical analysis of the trading structure at the Stockholm
Stock Exchange, Working paper, Stockholm School of Economics.
Stoll, H., 1992. Principles of trading market structure. Journal of Financial Research 6, 75±107.
Wilson, Peter W, 1991. A question of interest: The paralysis of Saudi banking. Westview, Boulder,
CO.
Wood, R., McInish, T., Ord, J., 1985. An investigation of transactions data from NYSE stocks.
Journal of Finance 40, 723±741.
M. Al-Suhaibani, L. Kryzanowski / Journal of Banking & Finance 24 (2000) 1323±1357 1357
Wyszukiwarka
Podobne podstrony:
A systematic review and meta analysis of the effect of an ankle foot orthosis on gait biomechanics a
With Microscope and Tweezers An Analysis of the Internet Virus of November 1988
Price An Analysis of the Strategy and Tactics of Alexious I Komnenos
Chordia, Sarkar And Subrahmanyam An Empirical Analysis Of Stock And Bond Market Liquidity
An%20Analysis%20of%20the%20Data%20Obtained%20from%20Ventilat
Preliminary Analysis of the Botany, Zoology, and Mineralogy of the Voynich Manuscript
An Overreaction Implementation of the Coherent Market Hypothesis and Options Pricing
Babi Yar Message and Writing Analysis of the Poem
Crime and Punishment Analysis of the Character Raskol
An analysis of the European low Nieznany
Death of a Salesman Breakdown and Analysis of the Play
Crime and Punishment Analysis of the Character Raskolnikov
Pride and Prejudice Analysis of the Theme of the Novel
An%20Analysis%20of%20the%20Data%20Obtained%20from%20Ventilat
A Philosophy for all an analysis of the Tao
An analysis of the energy efficiency of winter rapeseed biomass under
an analysis of the legal high mephedrone bioorg med chem lett 20 4135 4139 2010
Comparative Analyses of the Bacterial Microbiota of the Human Nostril and Oropharynx
więcej podobnych podstron