
Comparative Analyses of the Bacterial Microbiota of the Human
Nostril and Oropharynx
Katherine P. Lemon,
a
Vanja Klepac-Ceraj,
b
* Hilary K. Schiffer,
b
* Eoin L. Brodie,
c
Susan V. Lynch,
d
and Roberto Kolter
b
Division of Infectious Diseases Children’s Hospital, Harvard Medical School, Boston, Massachusetts, USA
a
; Department of Microbiology and Molecular Genetics, Harvard
Medical School, Boston, Massachusetts, USA
b
; Ecology Department, Earth Sciences Division, Lawrence Berkeley National Laboratory, Berkeley, California, USA
c
; and
Department of Medicine, Colitis and Crohn’s Disease Center, University of California, San Francisco, California, USA
d
* Present address: Vanja Klepac-Ceraj, Applied Molecular Photomedicine Laboratory, the Forsyth Institute, Boston, Massachusetts, USA; Hilary K. Schiffer, Biomedical Graduate Studies
Program in Cell and Molecular Biology, Department of Microbiology, University of Pennsylvania School of Medicine, Philadelphia, Pennsylvania, USA
ABSTRACT
The nose and throat are important sites of pathogen colonization, yet the microbiota of both is relatively unexplored
by culture-independent approaches. We examined the bacterial microbiota of the nostril and posterior wall of the oropharynx
from seven healthy adults using two culture-independent methods, a 16S rRNA gene microarray (PhyloChip) and 16S rRNA
gene clone libraries. While the bacterial microbiota of the oropharynx was richer than that of the nostril, the oropharyngeal mi-
crobiota varied less among participants than did nostril microbiota. A few phyla accounted for the majority of the bacteria de-
tected at each site: Firmicutes and Actinobacteria in the nostril and Firmicutes, Proteobacteria, and Bacteroidetes in the orophar-
ynx. Compared to culture-independent surveys of microbiota from other body sites, the microbiota of the nostril and
oropharynx show distinct phylum-level distribution patterns, supporting niche-specific colonization at discrete anatomical
sites. In the nostril, the distribution of Actinobacteria and Firmicutes was reminiscent of that of skin, though Proteobacteria were
much less prevalent. The distribution of Firmicutes, Proteobacteria, and Bacteroidetes in the oropharynx was most similar to that
in saliva, with more Proteobacteria than in the distal esophagus or mouth. While Firmicutes were prevalent at both sites, distinct
families within this phylum dominated numerically in each. At both sites there was an inverse correlation between the preva-
lences of Firmicutes and another phylum: in the oropharynx, Firmicutes and Proteobacteria, and in the nostril, Firmicutes and
Actinobacteria. In the nostril, this inverse correlation existed between the Firmicutes family Staphylococcaceae and Actinobacte-
ria families, suggesting potential antagonism between these groups.
IMPORTANCE
The human nose and throat, though connected, contain distinct niches that are important sites of colonization by
pathogenic bacteria. For many of these pathogens, colonization increases the risk of infection. Most research on the microbiota
of nose and throat habitats has focused on carriage of one or a few pathogens. We hypothesized that increased knowledge of the
composition of the complex bacterial communities in which these pathogens reside would provide new insights into why some
individuals become colonized with pathogens, while others do not. Indeed, in the nostril microbiota of participants, there was an
inverse correlation between the prevalences of the Staphylococcaceae family (Firmicutes), whose members include important
pathogens, and the Corynebacteriaceae and Propionibacteriaceae families (both Actinobacteria), whose members are more com-
monly benign commensals. An improved understanding of competitive bacterial colonization will increase our ability to define
predispositions to pathogen carriage at these sites and the subsequent risk of infection.
Received 5 May 2010 Accepted 13 May 2010 Published 22 June 2010
Citation Lemon, K. P., V. Klepac-Ceraj, H. K. Schiffer, E. L. Brodie, S. V. Lynch, et al. 2010. Comparative analyses of the bacterial microbiota of the human nostril and oropharynx.
mBio 1(3):e00129-10. doi:10.1128/mBio.00129-10.
Editor John J. Mekalanos, Harvard Medical School
Copyright © 2010 Lemon et al. This is an open-access article distributed under the terms of the Creative Commons Attribution-Noncommercial-Share Alike 3.0 Unported
License, which permits unrestricted noncommercial use, distribution, and reproduction in any medium, provided the original author and source are credited.
Address correspondence to Katherine P. Lemon, katherine.lemon@childrens.harvard.edu.
T
he outermost segment of the nose, the nostrils or anterior
nares, is a transition zone from the skin to the nasal cavity. Like
skin, the nostrils contain sebaceous glands, sweat glands, and hairs
and are lined by a keratinized, stratified squamous epithelium
more similar to that of skin than to the mucus-producing, ciliated,
columnar epithelium of the nasal cavity (1). The nostrils help filter
inhaled air, which contains low numbers of extremely diverse mi-
crobes (2, 3). In addition, the nostrils are exposed to microbes
present in the drainage from the nasal cavity and sinuses. The
throat, or pharynx, can be divided into three sections. Like the
nasal cavity, the nasopharynx (the upper region of the throat be-
hind the nose) is lined by a ciliated, columnar epithelium. The
oropharynx, located immediately behind the mouth, is lined by a
nonkeratinized stratified squamous epithelium, as is the more dis-
tal laryngopharynx. The oropharynx is constantly exposed to both
inhaled and ingested microbes, those cleared by mucociliary
mechanisms from both the upper and lower respiratory tracts and
those contained in saliva. The nostril and oropharynx are distinct
habitats. While the pathogen Staphylococcus aureus colonizes both
sites (1, 4–6), cultivation-based studies suggest that these sites
RESEARCH ARTICLE
July/August 2010 Volume 1 Issue 3 e00129-10
share few other common bacterial residents. This led us to explore
the bacterial community compositions of the microbiota of these
two habitats in conjunction with each other.
As mentioned above, most of the knowledge on nose and
throat microbiota has been generated via cultivation and has fo-
cused on pathogen carriage. The nostrils are known to harbor
bacteria from the genera Corynebacterium, Propionibacterium,
and Staphylococcus, including the important pathogen Staphylo-
coccus aureus (1). The adjacent nasal cavity appears dominated (at
least by cultivation) by Corynebacterium spp. and Staphylococcus
spp. (7). The oropharynx harbors species from the genera Strep-
tococcus, Haemophilus, Neisseria, and to a lesser extent Staphylo-
coccus and various anaerobic bacteria (1). It is the site of carriage of
many important human pathogens, including Streptococcus pneu-
moniae, Streptococcus pyogenes, Haemophilus influenzae, Neisseria
meningitidis, Moraxella catarrhalis, and Staphylococcus aureus (1,
4, 6). Three recent culture-independent surveys focused on skin or
gastrointestinal microbiota included either the nostril or the
throat (8–10), though none compared the microbiota of the nos-
tril to that of the throat.
The recent application of culture-independent analyses to the
healthy adult human mouth (11, 12), saliva (13), gastrointestinal
tract (8, 14–17), vagina (18–20), outer ear (21), and skin (9, 10,
22–25) has revealed that hundreds of types of bacteria colonize
various human body niches. These surveys indicate that a limited
number of phyla account for the majority of bacteria present at
each site, with phylum-level conservation among healthy humans
(26). They also show a high degree of interpersonal variation in
species-level bacterial community composition at each site.
A more complete understanding of human microbiota begins
with in-depth surveys of the bacterial community present in each
niche. In identifying the bacteria present and determining their
relative abundances, such surveys provide fundamental informa-
tion on aspects of the microbiota that correlate with human
health. For example, correlations are reported between health and
microbiota compositions in obesity (27, 28) Crohn’s disease (29,
30), periodontitis (31), or bacterial vaginosis (32, 33). Such sur-
veys also serve as the foundation for identifying bacteria that
might have significant influence on overall community composi-
tion and dynamics. The construction and sequencing of clone
libraries of 16S rRNA genes from myriad sources have uncovered
an immense diversity of bacteria. However, due to economic con-
straints, clone libraries cannot be feasibly applied for in-depth
sampling of microbial communities. 16S rRNA gene microarrays
offer an alternate approach. One such microarray, the PhyloChip
(34, 35), possesses 500,000 probes and can detect approximately
8,500 bacterial taxa in a single experiment. On this array, a taxon is
broadly defined as a cluster of 16S rRNA gene sequences with
ⱕ3% divergence (34). The PhyloChip has been used to examine
bacterial community profiles from a number of different sample
types, including mouse gastrointestinal tract (36) and human (37–
39) samples. Comparison between the PhyloChip and 16S rRNA
clone libraries indicates that the array is orders of magnitude more
sensitive in its ability to identify diversity, detecting low-
abundance taxa (0.01% of the community) even when the com-
munity is dominated by a small number of highly abundant mi-
crobes (2, 35).
Here we describe the application of the PhyloChip to profile
the bacterial community composition of nostril and oropharyn-
geal samples from seven healthy adults. In addition, we con-
structed and sequenced parallel 16S rRNA gene clone libraries
from the samples of the first four participants to identify the most
prevalent bacteria by 16S rRNA gene sequencing, as well as to
provide a comparative method.
RESULTS
Phylum-level comparison of nostril and oropharyngeal bacte-
rial communities. Paired mucosal surface swabs (one swab from
each site) were collected from the nostril and the posterior wall of
the oropharynx of seven healthy adults aged 26 through 45 years
who had not taken antimicrobials in the preceding 2 months, were
not pregnant, and were not acutely ill.
Taxonomy previously defined for the PhyloChip was used to
classify bacteria detected using both methods (40, 41). Microarray
analyses detected a total of 39 phyla from both sites, with 34 from
the nostril and 38 from the oropharynx (see Fig. S1 in the supple-
mental material). 16S rRNA gene clone library analyses of samples
from four of the seven participants identified eight phyla, six from
the nostril and seven from the oropharynx (filled circles in Fig. S1
in the supplemental material).
An averaged phylum-level distribution pattern for each site
demonstrated that both nostril and oropharyngeal microbiota
have a phylum-level distribution distinct from those of other body
sites (26). At both sites, a few phyla accounted for both the major-
ity of the hybridization signal from the microarrays and the ma-
jority of cloned 16S rRNA gene sequences, with similar phyloge-
netic distribution patterns (Fig. 1; see Fig. S2A to C in the
supplemental material), suggesting good concordance between
these profiling approaches. From the nostril samples, these were
Firmicutes and Actinobacteria (light blue and dark blue, respec-
tively, in Fig. 1 and see Fig. S2C in the supplemental material). In
1 2 3 4 5 6 7
0%
20%
40%
60%
80%
100%
AV
1-7
AV
1-4
CL
1-4
1 2 3 4 5 6 7
AV
1-7
AV
1-4
CL
1-4
nostril
oropharynx
samples
samples
% total community
Firmicutes
Other
Fusobacteria
Actinobacteria
Proteobacteria
Bacteroidetes
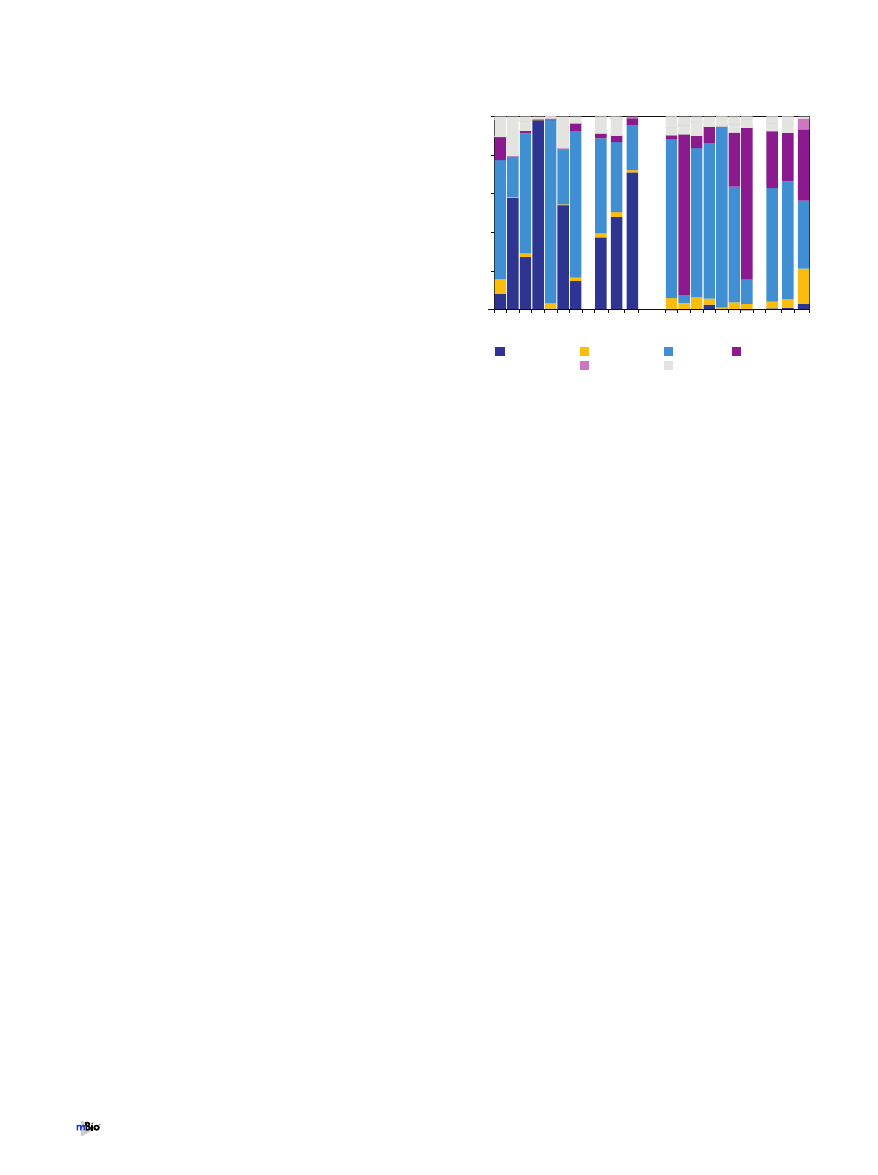
FIG 1 Bar graph showing the relative distributions of the major bacterial
phyla in the nostril and oropharyngeal samples as detected with a PhyloChip.
We used the microarray hybridization intensity to estimate the 16S rRNA gene
copy number for each taxon detected on the array and then summed these to
estimate the relative prevalence of each phylum in order to compare commu-
nities from all participants. Each bar labeled sample 1 to 7 represents 100% of
the bacteria detected in a sample by the microarray analysis. Bars labeled AV
1-7 represent the average community composition detected from all 7 seven
samples for a site by the microarray. Bars labeled AV 1-4 represent the average
community composition detected by the microarray from samples 1 to 4. Bars
labeled CL 1-4 represent the average of the relative abundances of phyla in the
16S rRNA gene clone libraries from samples 1 to 4.
Lemon et al.
2
July/August 2010 Volume 1 Issue 3 e00129-10
the oropharynx, the most prevalent phyla were Firmicutes, Pro-
teobacteria, and Bacteroidetes (light blue, maroon, and yellow, re-
spectively, in Fig. 1 and see Fig. S2C). From the microarrays, the
16S rRNA copy number was estimated based on the fluorescence
intensity of each taxon deemed present, to permit calculation of
the relative ratio of each phylum detected relative to the total
bacteria detected (2). Interpersonal variation at the phylum level
was evident, with the relative abundances of the core phyla at each
site varying across samples.
Family-level comparison of nostril and oropharyngeal bac-
terial communities. Firmicutes accounted for a large percentage
of the bacteria present in both the nostril and oropharynx; how-
ever, the most abundant families of this phylum varied by site. In
the nostrils, the Staphylococcaceae and Lachnospiraceae accounted
for the majority of the Firmicutes detected by the array, while in
the oropharynx, the majority of the signal was due to the Strepto-
coccaceae, Lachnospiraceae, and an unclassified group of Clostridia
(Fig. 2). Similarly, in the clone libraries, sequences from the family
Staphylococcaceae were abundant in the nostril samples, and se-
quences from the families Streptococcaceae and the clostridial fam-
ilies Acidaminococcaceae and Lachnospiraceae were abundant in
the oropharyngeal samples (see Fig. S3 in the supplemental mate-
rial).
Inverse correlation between Firmicutes and another phylum
in both sites. There was a strong inverse correlation in the relative
prevalences of Actinobacteria and Firmicutes in nostril communi-
ties (Fig. 3A) (Pearson correlation coefficient
⫽ ⫺0.95, P ⬍
0.001). At a finer level of phylogenetic resolution, this inverse
correlation was evident between members of the Firmicutes family
Staphylococcaceae and the Actinobacteria families Corynebacteri-
aceae and/or Propionibacteriaceae (Fig. 3B) (Spearman correlation
coefficient
⫽ ⫺0.93, P ⬍ 0.001). Unlike with the phylum-level
comparison, the latter relationship did not appear linear, as there
was a sharp decrease in the prevalence of Staphylococcaceae once
the combined prevalences of the Actinobacteria families rose
above ~22% of the total community (Fig. 2). This apparent non-
linearity was the reason for using the Spearman correlation coef-
ficient rather than the Pearson correlation coefficient. Also, for the
family-level comparison, the relative prevalence of each was log
10
transformed prior to regression analysis (Fig. 3B). A similar trend
was observed in the data from the nostril clone libraries.
In the oropharyngeal communities, there was an inverse cor-
relation in the relative prevalences of Firmicutes and Proteobacte-
1
2
3
4
5
6
7
1
2
3
4
5
6
7
0
10
20
30
40
50
60
70
80
90
100
10
20
30
40
50
60
70
80
90
100
nostril
samples
oropharynx
samples
family abundance (% total community)
Firmicutes
Firmicutes
Proteobacteria
Actinobacteria
Staphylococcaceae
Lachnospiraceae
Streptococcaceae
Clostridia Class, unclassified order
Peptostreptococcaceae
Corynebacteriaceae
Propionibacteriaceae
Acidaminococcaceae
Neisseriaceae
Pasteurellaceae
Campylobacteraceae
Clostridiaceae
Clostridiales Order, unclassified family
gut clone group Class, unclassified order
Xanthomonadaceae
Other Proteobacteria
Other Firmicutes
A
B
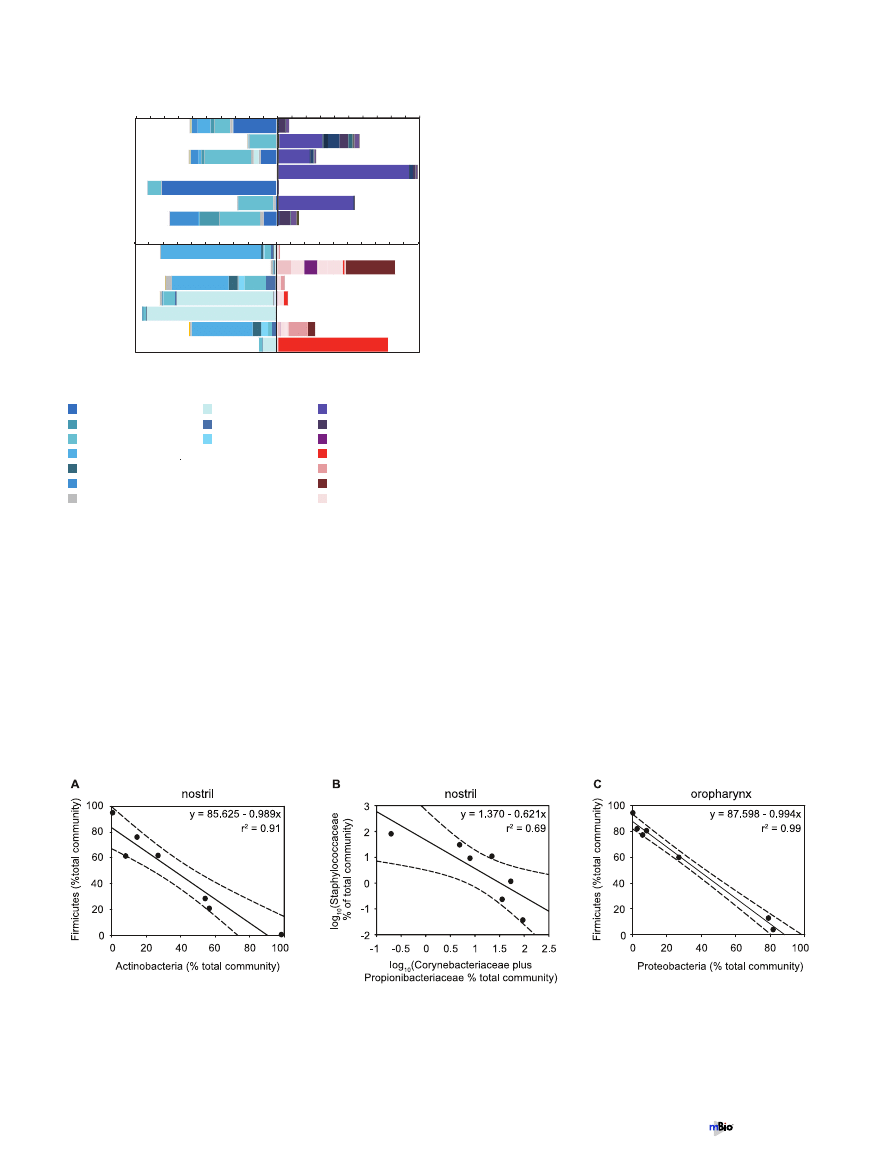
FIG 2 Relative abundances of the most common Firmicutes families com-
pared to relative abundances of Actinobacteria families in nostril samples (A)
and compared to relative abundances of Proteobacteria families in the oro-
pharynx samples (B) as detected by PhyloChip analysis. For comparison, back-
to-back graphs are shown for each site, each with the families from the speci-
fied phylum colored as indicated. We used the microarray hybridization
intensity to estimate the 16S rRNA gene copy number for each taxon detected
on the array and then summed these to estimate the relative abundance of each
phylum.
FIG 3 Inverse correlation between the relative prevalences of members of the phylum Firmicutes and another phylum at each site. Dashed lines indicate
95% confidence intervals. (A) Linear regression of the relative prevalences (percentages of the total community) of bacteria from the phylum Firmicutes and the
phylum Actinobacteria in the nostril communities. Pearson correlation coefficient
⫽ ⫺0.95; P ⬍ 0.001. r
2
⫽ 0.91; P ⬍ 0.001. (B) Linear regression of the
log
10
-transformed relative prevalences (percentages of total community) of the Firmicutes family Staphylococcaceae and the Actinobacteria families Corynebac-
teriaceae and Propionibacteriaceae in the nostril communities. Spearman correlation coefficient (of nontransformed data)
⫽ ⫺0.93; P ⬍ 0.001. r
2
⫽ 0.69; P ⬍
0.05. (C) Linear regression of the relative prevalences (percentages of the total community) of bacteria from the phylum Firmicutes and the phylum Proteobacteria
in the oropharyngeal communities. Pearson correlation coefficient
⫽ ⫺0.994; P ⬍ 0.001. r
2
⫽ 0.99; P ⬍ 0.001.
Nostril and Oropharyngeal Bacterial Microbiota
July/August 2010 Volume 1 Issue 3 e00129-10
ria (Fig. 3C). We were unable to discern the potential underpin-
nings of this inverse correlation at a finer phylogenetic level.
Nostril- and oropharynx-associated taxa detected using the
microarray. At a finer phylogenetic level, PhyloChip analysis de-
tected a total of 1,325 bacterial taxa from across all sites. Cumula-
tively, 911 bacterial taxa were detected from the nostril samples,
and 1,066 were detected from the oropharyngeal samples (see Ta-
ble S1 in the supplemental material). A comparison of the taxa
from both sites identified 259 taxa unique to the nostril (high-
lighted blue in Table S1 in the supplemental material) and 414
taxa unique to the oropharynx (highlighted pink in Table S1). As
shown in Fig. 4A, the majority of these taxa were detected at very
low levels. Like all methods, the PhyloChip has limitations. As we
did not attempt to validate the identification of these many rare
taxa, the total number of taxa detected might be an overestima-
tion. At each site there was a high degree of interpersonal variation
in the taxon-level community composition (see Fig. S4 in the sup-
plemental material).
Nostril and oropharyngeal bacterial microbiota based on
16S rRNA gene clone libraries. We also examined the microbiota
of the nostril and oropharynx from four of the seven participants
sampled using 16S rRNA gene clone libraries. The PhyloChip de-
tects rare taxa that are unlikely to be detected in standard-sized
clone libraries of 200 to 500 clones per sample, provided that there
are probes for these taxa on the array. Clone libraries, however,
permit direct identification of highly prevalent 16S rRNA gene
sequences present in the sample. In total, from all four adults, we
analyzed 719 nostril-derived clones and 666 oropharynx-derived
clones. We detected 36 taxa (defined by clustering at 97% nucle-
otide identity) from the nostrils and 71 taxa from the oropharynx
(see Fig. S2A and B in the supplemental material). At 97%, the
Chao 1 value (an estimate of community richness) for nostrils was
50 taxa (standard deviation
⫾ 7.2) and for the oropharynges 120
taxa (SD
⫾ 17). The 36 taxa present in the nostril samples clus-
tered within five bacterial phyla: Actinobacteria, Firmicutes, Pro-
teobacteria, Bacteroidetes, and Fusobacteria (in addition to chloro-
plasts [see Fig. S2A in the supplemental material]). The 71 taxa
detected in the oropharyngeal samples clustered within seven bac-
terial phyla: Firmicutes, Proteobacteria, Bacteroidetes, Fusobacteria,
Actinobacteria, TM7, and SR1 (see Fig. S2B). As stated above, the
relative abundance of each phylum in each site was similar to that
detected by the microarrays (Fig. 1 and see Fig. S2C in the supple-
mental material). Rarefaction analysis demonstrated that at 97%
sequence clustering, the combined libraries for each site were be-
ginning to saturate (see Fig. S2D). This is best explained by the
large proportion of rare taxa detected using the microarray (each
present at
⬍0.05% of the estimated total 16S rRNA gene copy
number based on hybridization signals, as shown in Fig. 4A),
which are unlikely to appear within clone libraries of the size con-
structed for this study.
The microbiota of the oropharynx has greater richness than
nostril microbiota. The richness (number of different taxa) and
evenness (relative abundance of taxa) of a sampled community are
often calculated in order to characterize and compare the sampled
community with other communities. Using the microarray, the
number of taxa per nostril sample (dark-gray bars on the left in
Fig. 4A and B) varied from 125 to 778, with an average of 342.7
taxa per person (standard error of the mean [SEM], 86.8). The
number of taxa per oropharyngeal sample (dark-gray bars on the
right in Fig. 4A and B) varied from 444 to 788, with an average of
561.7 taxa per community sampled (SEM, 48). The oropharyngeal
bacterial microbiota had a greater average number of taxa per
sample than did the nostril microbiota (t test, P
⬍ 0.05). The clone
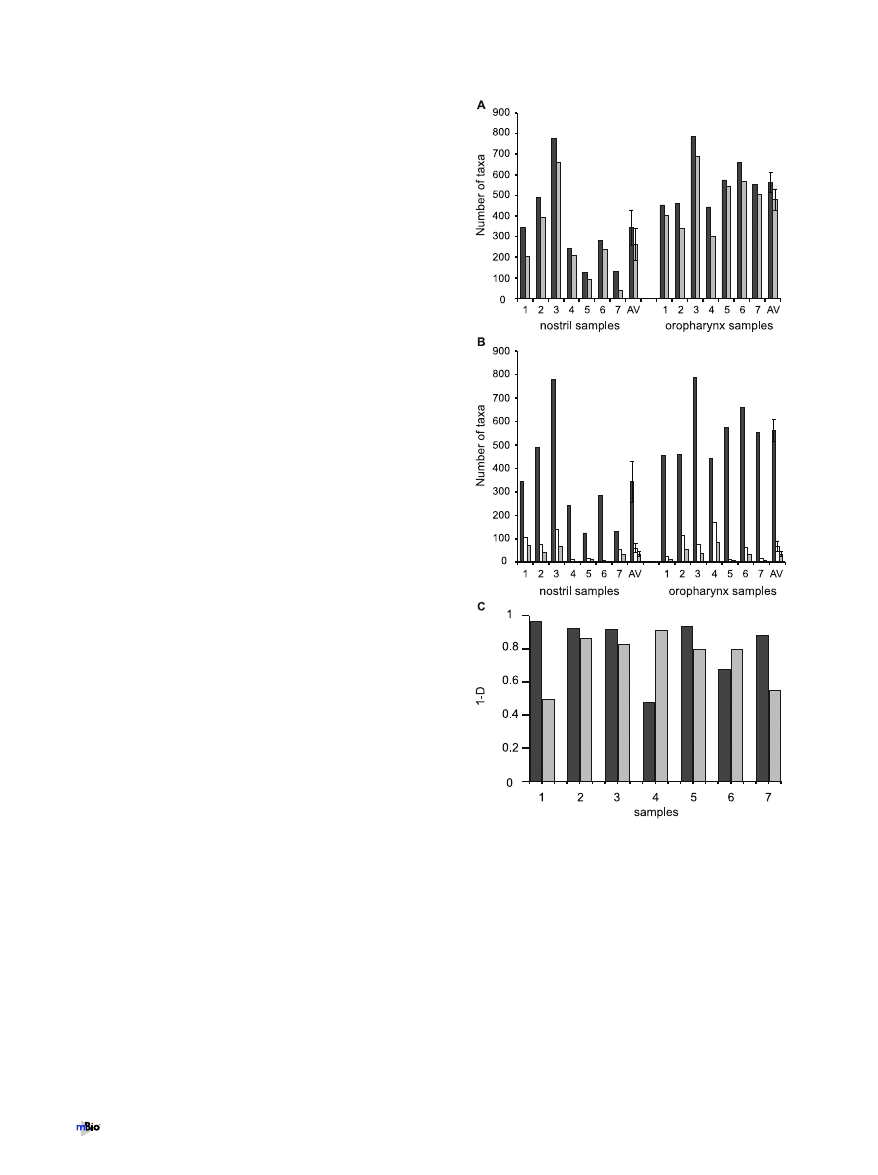
FIG 4 Taxonomic diversity detected by the microarray in samples from the
nostril and oropharynx. (A) Total number of taxa detected in each sample and
average number (AV) of taxa detected for each site (dark-gray bars). Numbers
of taxa detected in each sample and on average per site (AV) that each made up
⬍0.05% of the total community (light-gray bars) are shown. Error bars rep-
resent the standard errors of the means. (B) Numbers of taxa that constituted
100% (dark-gray bars), 95% (white bars), and 90% (light-gray bars) of the
total bacteria detected by the microarray in each sample and on average per site
(AV). Error bars represent standard errors of the means. (C) Simpson’s index
of diversity (1
⫺ D) for each sample from the nostril (dark-gray bars) and the
oropharynx (light-gray bars) calculated using the estimated 16S rRNA gene
copy number derived from microarray hybridization intensity data. Data are
graphed as 1
⫺ D, such that the higher the bar, the greater the diversity.
Lemon et al.
4
July/August 2010 Volume 1 Issue 3 e00129-10
libraries also demonstrated greater richness in the oropharyngeal
microbiota, with an average of 33 taxa per oropharynx versus 15
taxa per nostril (t test, P
⬍ 0.05) (see Fig. S5A in the supplemental
material).
The microarray detected a large number of taxa in each sample
that were present at low levels, each accounting for
⬍0.05% of the
total estimated 16S rRNA gene copy number as determined from
the hybridization signal (light-gray bars in Fig. 4A). In the nostril
samples, an average of 71% of the taxa in each sample were present
at
⬍0.05% each (SEM, 7.9%), and in the oropharynx, an average
of 84% of the taxa detected were present at
⬍0.05% each (SEM,
3.8%).
The evenness of the communities varied from person to per-
son, with as few as 11 taxa and as many as 171 taxa accounting for
95% of the total estimated 16S rRNA gene copy number, as deter-
mined from the hybridization signals for sampled communities
(white bars in Fig. 4B). The average number of taxa representing
90% of the community detected with the microarray (light-gray
bars in Fig. 4B) was similar to the average number of taxa per
community detected by the clone libraries for each site (see
Fig. S5A in the supplemental material).
To assess the diversity (both the richness and evenness) of each
community, we used Simpson’s index of diversity (D) (Fig. 4C; see
Fig. S5B in the supplemental material). Simpson’s diversity index
indicates the probability that any two bacteria detected in a sample
are of the same species (taxon) (42). Person-to-person variation in
whether the nostril or oropharynx harbored greater diversity
(greater value of 1
⫺ D), as measured by Simpson’s index, was
indicated by both the microarray (Fig. 4C) and the clone library
(see Fig. S5B in the supplemental material) data.
Interpersonal comparison of nostril and oropharyngeal mi-
crobiota. To explore potential relationships between sampled
communities without a priori expectations, we used correspon-
dence analysis (CoA). This analysis revealed that the bacterial
communities analyzed by microarray grouped by site and not by
individual, with nostril and oropharyngeal communities cluster-
ing separately (Fig. 5A and B). Correspondence axis 1 is graphed
against both axes 2 and 3 to illustrate the grouping between sites
and also the relationship of communities from the same site. Nei-
ther nostril nor oropharyngeal communities appeared to be more
closely related among themselves by this analysis.
To better discern the relationship between bacterial commu-
nities from the same site but different individuals, we performed
cluster analysis using weighted UniFrac, which takes into account
both phylogenetic relationships and relative abundances of taxa
within each community (43). Each terminal branch of the den-
drogram represents the community from one sample as detected
by the microarray (i.e., one individual, one site) (Fig. 5C). Again,
the nostril and oropharyngeal communities clustered separately,
supporting the conclusion that one individual’s nostril micro-
biota is more similar to another individual’s nostril microbiota
than to his/her own oropharyngeal microbiota. Similar results
were obtained using unweighted UniFrac (data not shown). No
discernable pattern emerged from within-site gender or age com-
parisons in the CoA and UniFrac analyses (data not shown). A
comparison of the weighted UniFrac distances within all the nos-
tril samples and within all the oropharyngeal samples indicated
that the oropharyngeal microbiota was less varied among the
seven individuals than was the nostril microbiota (Fig. 5D). Again,
similar results were obtained using unweighted UniFrac (data not
shown). There was no statistical difference found in the weighted
Unifrac distances when communities were compared between all
14 samples, nostril and oropharynx, versus between the paired
nostril and oropharyngeal microbiota from each individual
(Fig. 5D).
DISCUSSION
We utilized two different 16S rRNA gene-based culture-
independent techniques to survey the bacterial composition of the
microbiota sampled from healthy adult nostril and oropharynx.
The number of participants in this study (n
⫽ 7) was comparable
to those in the majority of initial culture-independent surveys of
microbiota from different body sites (11, 15, 16, 19, 22, 24), al-
though small in comparison to the hundreds to thousands of in-
dividuals included in epidemiological surveys. Nostril and oro-
pharyngeal microbiota each had a distinct phylum-level
distribution pattern, which was robust across methods (Fig. 1
and see Fig. S2C in the supplemental material). Similar to what
occurred at other body sites, there was a large degree of interper-
sonal variation in taxon-level community compositions, along
with some variation at the phylum level. This suggests that multi-
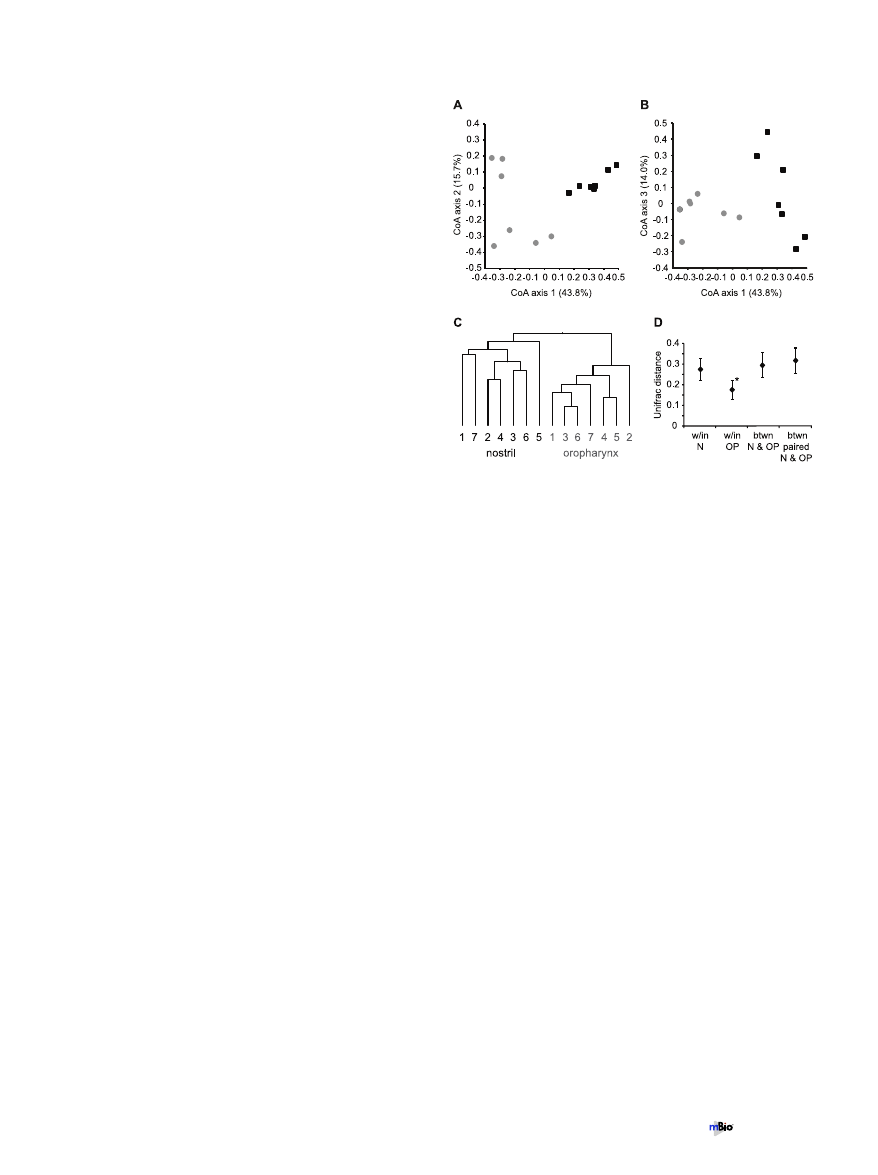
FIG 5 Bacterial communities grouped by site and not by individual. (A and
B) Correspondence analysis of the total microarray hybridization profile from
each sample performed in MeV v4.4. Black squares, nostrils; gray circles, oro-
pharynges. For clarity the data are shown in two dimensions, with axis 1
graphed against both axis 2 (A) and axis 3 (B). The percentage in parentheses
for each axis indicates the percent variation that is explained by that axis. (C
and D) Weighted UniFrac analysis of the total microarray hybridization profile
from each sample. (C) Each terminal branch represents the total bacterial
community detected from one person’s sample from the specified site. All
nodes were recovered at 100% using the Jackknife method. (D) UniFrac dis-
tances measured within the nostril microbiota samples (w/in N), within the
oropharyngeal microbiota samples (w/in OP), between all the nostril and oro-
pharyngeal samples (btwn N and OP), and between the paired nostril and
oropharyngeal microbiota for each individual person (btwn paired N and OP).
*, statistically different from values for the others as determined by one-way
ANOVA with Tukey’s test (set to 0.05) on pair-wise UniFrac values. Error bars
represent standard deviations.
Nostril and Oropharyngeal Bacterial Microbiota
July/August 2010 Volume 1 Issue 3 e00129-10

ple species might be capable of performing discrete and essential
functions and that functional redundancy within communities
might serve as a hallmark of community stability and potentially
as a biomarker for human health (28, 44).
An inverse correlation between Firmicutes and Actinobacte-
ria in nostril microbiota. In the nostril, the numerical dominance
of Actinobacteria and Firmicutes was reminiscent of skin; however,
Proteobacteria were much less common (10, 22, 24, 25). The
prevalences of Firmicutes and Actinobacteria were inversely corre-
lated, and this was statistically significant across the seven nostril
samples. At the family level, this inverse correlation existed be-
tween the Firmicutes family Staphylococcaceae and the Actinobac-
teria families Corynebacteriaceae and Propionibacteriaceae, sug-
gesting possible antagonism between these groups. The
Staphylococcaceae include important community-acquired and
nosocomial pathogens, e.g., S. aureus and coagulase-negative
Staphylococcus spp. The observed inverse correlation raises the
intriguing possibility that nostril bacterial communities in which
Actinobacteria are most prevalent might protect against carriage of
Staphylococcus spp., including the pathogen S. aureus. Consistent
with this, based on cultivation of nasal bacteria from 156 healthy
adults, Uehara and colleagues observed lower rates of S. aureus
carriage in persons colonized with Corynebacterium (8.5%) than
in those without (44.6%), though Staphylococcus spp. other than
S. aureus were detected by cultivation in all individuals (45). An-
other cultivation-based study of S. aureus nostril carriage in 216
adults reports similar findings (46). Multiple possible explana-
tions exist for such an inverse correlation, from variations in host
factors, such as attachment sites and substrates, to various forms
of bacterial competition, such as competition for common attach-
ment sites and small-molecule-mediated inhibition. In the future,
it will be exciting to elucidate the molecular mechanisms that
drive this observed inverse correlation.
Comparison of nostril microbiota compositions from
culture-independent surveys. A recent survey of skin microbiota
using 16S rRNA gene clone libraries included naris (nostril) sam-
ples from 10 healthy adults and found that Actinobacteria were the
most abundant sequences from this site (10). We speculate that
differences in methodology might account for the increased prev-
alence of Firmicutes in our samples, for example, slightly different
exclusion criteria, dry versus wet swabs, and differences in proto-
cols for DNA preparation and 16S rRNA gene amplification. It
seems less likely that differences in participant characteristics were
contributory, as both surveys included adults of similar ages, 20 to
41 years (10) versus 26 to 45 years, and both surveys were per-
formed in similar geographic locations (cities on the east coast of
the United States). Another recent survey of the microbiota from
multiple adult body sites using bar-coded tag pyrosequencing of
16S rRNA genes also included the nares (9). All but one of the
participants was 30 to 35 years of age, and all lived in Boulder, CO,
with a mix of males and females. In agreement with results pre-
sented here, this survey detected both Actinobacteria and Firmi-
cutes as the most prevalent phyla in nostril samples. As with our
clone library results, the nostril bacterial communities were all
numerically dominated by members of the Actinobacteria. The
one notable difference is that the Actinobacteria were overwhelm-
ingly (
⬎60%) from the family Propionibacteriaceae (9), whereas
we observed a large number of both Corynebacteriaceae and Pro-
pionibacteriaceae among the Actinobacteria detected using both
methods (Fig. 2, and see Fig. S3 in the supplemental material).
Again, methodological differences might account for this.
The phylum-level bacterial composition in the oropharynx
differs from that in the esophagus and mouth but is similar to
that in saliva. The increased presence of Gram-negative bacteria,
particularly from the phylum Proteobacteria, in the oropharynx
compared to their presence in the nostril is consistent with culti-
vation data. Compared to other human sites analyzed with
culture-independent methods, the Proteobacteria signal from the
oropharynx is rivaled only by those from skin (10, 22, 24–26) and
saliva (13). The distal esophagus microbiota is numerically dom-
inated by Firmicutes and Bacteroidetes of genera similar to those
found in the oropharynx but with many fewer Proteobacteria (16).
The healthy mouth likewise is host to an abundance of Firmicutes;
in one study, Firmicutes were out of proportion to any other phy-
lum present (11, 26), and in another, the phylum-level distribu-
tion pattern was similar to that of saliva (12). Of the human body
niches analyzed with culture-independent methods, our clone li-
brary results from the oropharyngeal microbiota showed a
phylum-level composition pattern most similar to that of saliva.
The composition of phyla in the salivary microbiota detected by
16S rRNA gene clone libraries from 120 individuals (with ~120
16S rRNA gene sequences per person) is as follows: Firmicutes,
~37.8%; Proteobacteria, ~28%; Bacteroidetes, ~20%; Actinobacte-
ria, ~7%; and others, 7.2% (13). A recent survey of gut microbiota
using bar-coded tag pyrosequencing of 16S rRNA gene amplicon
pools included the throat (8). Only ~5% of the sequences from
their throat samples (4.7%
⫾ 3.4) cluster in the phylum Proteobac-
teria, whereas ~15% (14.5
⫾ 3.9) cluster within the Actinobacteria
(8). Differences in methods are likely to account for these different
observations. Another possible source of variation is differences in
the sampled populations. The six participants in the study by
Andersson and colleagues both were older and had underlying
medical conditions (three aged 42 to 73 years with duodenal ulcer
and three controls aged 70 to 75 years with dyspepsia) (8). These
differences suggest a need for surveys of healthy respiratory tract
microbiota from a greater number of individuals with a broad age
range.
At the phylum level, from both the nostril and oropharynx,
Firmicutes were detected as a greater proportion of the total com-
munity by using the microarrays than by using the clone libraries.
For both, we followed the same protocols, used the same bacterial
DNA mixture, and, in most cases, used the same amplicon pool.
The differences observed suggest either that the microarray over-
represented Firmicutes or that the clone libraries underrepre-
sented them for these sites. The relative proportions of probes on
the microarray for Firmicutes versus Bacteroidetes and Actinobac-
teria might have contributed to the difference in prevalence of
these phyla as detected by each method. Alternatively, some have
speculated that cloning through Escherichia coli might lead to a
slight decrease in detection of AT-rich organisms, i.e., Firmicutes,
though to our knowledge, this has never been directly demon-
strated. In fact, a recent assessment of the underrepresentation of
marine SAR11 biodiversity based on techniques that rely on clon-
ing through E. coli (fosmid and bacterial artificial chromosome
[BAC] libraries) suggests that the underrepresentation of this low-
GC-content group using these methods is unlikely to be due to its
AT richness (47).
Combined 16S rRNA gene-based approaches to study micro-
biota composition. All of the 16S rRNA gene-based techniques
Lemon et al.
6
July/August 2010 Volume 1 Issue 3 e00129-10

likely have specific biases and strengths, though generally similar
patterns are expected from each; thus, a combined approach offers
advantages. Most molecular analyses of human microbiota to date
have utilized 16S rRNA gene clone libraries, and we used both this
method and the PhyloChip to analyze samples from the first four
participants. The number of clones per person per site was similar
to those of other human body site clone libraries reported (10, 13,
14, 16, 22, 24). The number of taxa identified by the PhyloChip
was much greater than the number identified from 16S rRNA gene
clone libraries and was at least comparable to what might be ex-
pected using 454 pyrosequencing of the 16S rRNA gene. However,
by using the microarray, we were able to analyze a larger number
of individuals than would have been possible at the time for a cost
comparable with pyrosequencing. While the microarray does not
identify previously unreported taxa, the combined approach with
the microarrays and 16S rRNA gene clone libraries enabled iden-
tification of predominant members of sampled communities via
their 16S rRNA gene sequence. Furthermore, the total hybridiza-
tion pattern of each chip can be used as a community “signature”
for analyses comparing the communities (e.g., beta diversity).
As mentioned in the results, the exact number of taxa detected
by the microarray is best viewed as an estimate. That said, both the
nostril and oropharynx are continually exposed to a large number
of environmental bacteria via inhaled air. Additionally, the oro-
pharynx is exposed to microbes present in food and liquids. Thus,
it is not surprising that a wide variety of bacteria associated with
outside sources were detected at very low levels in samples from
each site. Both a larger data set and validation of the presence of
rare taxa via other methods will be required to discern if any of
these rare taxa are long-term residents of these sites, or if these are
simply transiently present.
Bacterial microbiota of the nostril compared to that of the
oropharynx. Analyses of the microbiota sampled from the nostril
and oropharynx revealed that the bacterial communities grouped
by site and not by individual, similar to what has been observed for
other body sites (9). The differences we observed largely reflected
disparities in each taxon’s signal abundance at each site. As both
the oropharynx and nostril receive drainage from common
sources (nasopharynx, sinuses, and nasal cavity), it is not surpris-
ing that there was a large overlap in the taxa detected. Variation
might arise then from different sources; bacteria in the orophar-
ynx could be introduced via the mouth, saliva, and ingestions,
whereas the nostrils filter air before it reaches the oropharynx. We
postulate that the differences in bacterial microbiota composi-
tions from the two sites are largely due to differences in niche
environments, such as substrate and surface differences (e.g., ker-
atin and sebum in the nostril), the slightly lower temperature of
the nostrils, and the expected variations in pH between the sites
(not measured in this study) (1).
Among the seven adults sampled, there was more conservation
among the oropharyngeal microbiota compositions than among
the nostril microbiota compositions based on a comparison of
UniFrac distances within all the nostril and oropharynx samples
(Fig. 5D). Previously, throat microbiota was shown to have less
interpersonal variation than the stomach or fecal microbiota (8).
Studies analyzing bacterial communities from a number of differ-
ent body sites from a larger number of individuals will be required
to determine if, in general, oropharyngeal microbiota demon-
strate more interpersonal compositional conservation. Unlike
with the gender differences in palmar skin microbiota composi-
tions (23), we did not observe any differences in the nostril or
oropharyngeal microbiota compositions that correlated with gen-
der among the individuals sampled, although our sample size
might have impacted this assessment. This survey of the micro-
biota of the nostril and oropharynx from seven healthy adults
contributes to the growing understanding of the composition of
healthy human microbiota and its interpersonal variation. Such
surveys are a necessary foundation for future research aimed at
identifying the impact of various perturbations, e.g., antibiotics,
vaccines, infections, diseases, and medical interventions, on the
ecology of human-associated microbial communities and corre-
lations between human health and microbiota composition.
MATERIALS AND METHODS
Participant enrollment. We enrolled seven healthy adult volunteers, four
male and three female, whose ages were 26 through 45 years. After receiv-
ing an explanation of the study and details about sample collection, all
provided verbal consent prior to participation. Exclusion criteria for this
pilot study were as follows: (i) use of any antimicrobials within the past
2 months, (ii) pregnancy, (iii) any intercurrent illness, and (iv) an age less
than 21 years or greater than 65 years. The Institutional Review Board
(IRB) at Children’s Hospital Boston ceded review to the IRB at Harvard
Medical School, which approved this study.
Sample collection and DNA extraction. Separate mucosal swabs were
collected from one nostril and from the posterior wall of the oropharynx
of each participant and rapidly frozen at
⫺80°C (BBL CultureSwab; Bec-
ton, Dickinson and Co.). The posterior wall of the oropharynx was
swabbed without touching the tonsils, uvula, tongue, or other oral struc-
tures. For nucleic acid extraction, the top of the swab was aseptically
snipped off into a sterile 2-ml lysing matrix B tube (MP Biomedicals)
containing 600
l buffer RLT Plus (Qiagen) with 2-mercaptoethanol
(Sigma-Aldrich, Inc.). After bead beating (30 s at 5.5 m/s), genomic DNA
was purified from sample supernatants using the AllPrep DNA/RNA kit
(Qiagen, 2005).
PCR amplification and purification of 16S rRNA genes. To minimize
potential PCR amplification bias, we amplified 16S rRNA genes from
DNA extracts using a temperature gradient (48°C to 56°C) in eight repli-
cate reactions with the bacteria-specific 16S primer set 27F (5=-AGAGTT
TGATCCTGGCTCAG-3=) and 1492R (5=-GGTTACCTTGTTACGACT
T-3=) (48) as previously described (39). For each sample, amplified
products were pooled, purified by isopropanol precipitation, and quanti-
fied by gel electrophoresis using a 2% E-gel with a low-mass-DNA quan-
tification ladder (Invitrogen Corp.).
16S rRNA gene clone library construction and analysis. To construct
the clone libraries for nostril and oropharyngeal samples from the first
four participants, amplicon pools were ligated and cloned using the stan-
dard protocol from the TOPO TA cloning kit for sequencing (Invitrogen).
Individual cloned 16S rRNA gene sequences were first amplified using the
M13F and M13R primers (TOPO TA cloning kit for sequencing manual)
and then sequenced from the 5= end with the 27F primer using an ABI3700
(Applied Biosystems, Inc.). After primer and vector sequences were re-
moved, the 16S rRNA gene sequences were trimmed by removing any
leading and trailing bases that contained ambiguities and for which con-
fidence was less than 25%, and the chromatogram of each sequence was
manually inspected for any remaining base caller errors by using Se-
quencher (Gene Codes Corp.). Sequences with a minimal length of 500 bp
were then grouped based on
ⱖ97% sequence identity. The 97% clustering
was done to facilitate comparison with taxa detected by the PhyloChip, for
which a taxon is broadly defined as a cluster of 16S rRNA gene sequences
with
ⱕ3% divergence (34). Sequences were aligned using NAST on the
Greengenes website (40, 49). Putative chimeras were identified using Chi-
meraCheck in RDP and Bellerophon and discarded from the data set (50).
Grouped 16S rRNA gene cloned sequences were compared to sequences
in two databases, NCBI and RDP, using sequence alignment (BLAST) to
Nostril and Oropharyngeal Bacterial Microbiota
July/August 2010 Volume 1 Issue 3 e00129-10

identify the best-named matches. The NAST-aligned sequences, along
with the best BLAST matches retrieved from the two databases for indi-
vidual cloned sequences, were imported into the Greengenes database
using the ARB software suite (40, 51). Sequences were added to the uni-
versal ARB dendrogram using the ARB parsimony algorithm with a Lane
mask filter (48). Cloned sequences and their closest named reference se-
quence(s) were then retrieved and assembled using parsimony into the
trees shown for the clone libraries. Ultimately, there were 141, 261, 176,
and 141 clones from individual nostril samples and 199, 217, 171, and 79
clones from individual oropharyngeal samples, for a total of 719 nostril-
derived sequences and 666 oropharynx-derived sequences.
Hybridization of pooled PCR amplicons to the PhyloChip. We
spiked 250 ng of pooled 16S rRNA gene amplicon from each sample with
a mix containing known concentrations of control amplicons to permit
normalization of interarray variation (2). The combined mixture for each
sample was then fragmented, biotin labeled, and hybridized to the Phylo-
Chip (version G2; Affymetrix) as previously described (2, 34, 35). Phylo-
Chips were washed, stained, and scanned using a GeneArray scanner (Af-
fymetrix) as previously described (34). Each scan was captured using
standard Affymetrix software (GeneChip Microarray Analysis Suite, ver-
sion 5.1), and array data were processed as previously described (2, 34,
35). On the PhyloChip, each taxon was represented with a minimum of 11
probe pairs, and some were represented with up to 55. As previously
described, a taxon was considered to be “present” in a sample when the
number of positive probe pairs divided by the total number of probe pairs
in a probe set was equal to or greater than 0.9 (34). Hybridization values
(fluorescence intensity) for each taxon were calculated as a trimmed av-
erage (with maximum and minimum values removed before averaging)
(34). Hybridization values were converted to estimated gene copy num-
bers using a formula derived from a Latin square assay as described pre-
viously (2).
Analysis of PhyloChip data. All of the taxa detected by the PhyloChip
from all 14 samples were added using parsimony to the existing phyloge-
netic tree based on the ARB parsimony tree delivered with the Greengenes
ARB database (October 2006 release) (40). To compare the numerically
dominant phyla from each body site, correlation coefficients and linear
regression were performed using Sigma Plot 11. We performed weighted
and unweighted UniFrac analyses using the neighbor-joining tree of all
taxa represented on the PhyloChip that have
⬎1,200-bp 16S rRNA se-
quences (40, 43, 52, 53; file bacteria.6190.tree at
). A t test on the UniFrac distance ma-
trix was used to determine if the UniFrac distances were on average
significantly different for the bacterial communities detected in the two body
sites. To determine if the community compositions within and between oro-
pharynx and nostril groups were different, we used one-way analysis of vari-
ance (ANOVA) with Tukey’s test (set to 0.05) on pair-wise UniFrac values.
To determine how bacterial community compositions varied across
samples, we also compared total hybridization profiles for each sample
using correspondence analysis (CoA) in MeV v4.4 (54). Analysis was done
on the log
2
-transformed hybridization intensity data for each sample,
with a percentage cutoff filter set to 0.02%.
16S rRNA gene sequence accession numbers. Sequences from clone
libraries grouped at 99% identity (53 from nostril and 109 from orophar-
ynx) were deposited in the NCBI database with GenBank accession num-
bers HM172637 to HM172798.
ACKNOWLEDGMENTS
We thank the individuals who participated in this study. We also thank
members of the Kolter Laboratory, Darren Higgins, and members of the
Higgins laboratory for thoughtful discussions. We thank Rebecca J. Case,
Erin A. Gontang, and Hera C. Vlamakis for critical review of the manu-
script. We thank Yvette M. Piceno, Todd DeSantis, and Gary Andersen for
assistance as we set up PhyloChip processing at Harvard.
H.K.S. was supported in part by REU site grant DBI-0552060 from the
National Science Foundation. S.V.L. is supported in part by the Rainin
Foundation. Part of this work was performed at Lawrence Berkeley Na-
tional Laboratory under the Department of Energy Contract no. de-
AC02-05CH11231. This work was supported in part by grants GM58213
and GM082137 to R.K.
SUPPLEMENTAL MATERIAL
Supplemental material for this article may be found at
/lookup/suppl/doi:10.1128/mBio.00129-10/-/DCSupplemental
Table S1, PDF file, 0.43 MB.
Figure S1, EPS file, 0.32 MB.
Figure S2, EPS file, 1.26 MB.
Figure S3, EPS file, 0.45 MB.
Figure S4, EPS file, 2.80 MB.
Figure S5, EPS file, 0.65 MB.
REFERENCES
1. Wilson, M. 2005. Microbial inhabitants of human: their ecology and role
in health and disease. Cambridge University Press, Cambridge, United
Kingdom.
2. Brodie, E. L., T. Z. DeSantis, J. P. Parker, I. X. Zubietta, Y. M. Piceno,
and G. L. Andersen. 2007. Urban aerosols harbor diverse and dynamic
bacterial populations. Proc. Natl. Acad. Sci. U. S. A. 104:299 –304.
3. Fierer, N., Z. Liu, M. Rodriguez-Hernandez, R. Knight, M. Henn, and
M. T. Hernandez. 2008. Short-term temporal variability in airborne bac-
terial and fungal populations. Appl. Environ. Microbiol. 74:200 –207.
4. Mertz, D., R. Frei, B. Jaussi, A. Tietz, C. Stebler, U. Fluckiger, and A. F.
Widmer. 2007. Throat swabs are necessary to reliably detect carriers of
Staphylococcus aureus. Clin. Infect. Dis. 45:475– 477.
5. Wertheim, H. F., D. C. Melles, M. C. Vos, W. van Leeuwen, van A.
Belkum, H. A. Verbrugh, and J. L. Nouwen. 2005. The role of nasal
carriage in Staphylococcus aureus infections. Lancet Infect. Dis. 5:751–762.
6. Widmer, A. F., D. Mertz, and R. Frei. 2008. Necessity of screening of
both the nose and the throat to detect methicillin-resistant Staphylococcus
aureus colonization in patients upon admission to an intensive care unit. J.
Clin. Microbiol. 46:835.
7. Rasmussen, T. T., L. P. Kirkeby, K. Poulsen, J. Reinholdt, and M.
Kilian. 2000. Resident aerobic microbiota of the adult human nasal cavity.
APMIS 108:663– 675.
8. Andersson, A. F., M. Lindberg, H. Jakobsson, F. Backhed, P. Nyren, and
L. Engstrand. 2008. Comparative analysis of human gut microbiota by
barcoded pyrosequencing. PLoS One 3:e2836.
9. Costello, E. K., C. L. Lauber, M. Hamady, N. Fierer, J. I. Gordon, and
R. Knight. 2009. Bacterial community variation in human body habitats
across space and time. Science 326:1694 –1697.
10. Grice, E. A., H. H. Kong, S. Conlan, C. B. Deming, J. Davis, A. C.
Young, G. G. Bouffard, R. W. Blakesley, P. R. Murray, E. D. Green,
M. L. Turner, and J. A. Segre. 2009. Topographical and temporal diver-
sity of the human skin microbiome. Science 324:1190 –1192.
11. Aas, J. A., B. J. Paster, L. N. Stokes, I. Olsen, and F. E. Dewhirst. 2005.
Defining the normal bacterial flora of the oral cavity. J. Clin. Microbiol.
43:5721–5732.
12. Bik, E. M., C. D. Long, G. C. Armitage, P. Loomer, J. Emerson, E. F.
Mongodin, K. E. Nelson, S. R. Gill, C. M. Fraser-Liggett, and D. A.
Relman. 2010. Bacterial diversity in the oral cavity of 10 healthy individ-
uals. ISME J., in press. doi:10.1038/ismej.2010.30.
13. Nasidze, I., J. Li, D. Quinque, K. Tang, and M. Stoneking. 2009. Global
diversity in the human salivary microbiome. Genome Res. 19:636 – 643.
14. Bik, E. M., P. B. Eckburg, S. R. Gill, K. E. Nelson, E. A. Purdom, F.
Francois, G. Perez-Perez, M. J. Blaser, and D. A. Relman. 2006. Molec-
ular analysis of the bacterial microbiota in the human stomach. Proc. Natl.
Acad. Sci. U. S. A. 103:732–737.
15. Eckburg, P. B., E. M. Bik, C. N. Bernstein, E. Purdom, L. Dethlefsen, M.
Sargent, S. R. Gill, K. E. Nelson, and D. A. Relman. 2005. Diversity of the
human intestinal microbial flora. Science 308:1635–1638.
16. Pei, Z., E. J. Bini, L. Yang, M. Zhou, F. Francois, and M. J. Blaser. 2004.
Bacterial biota in the human distal esophagus. Proc. Natl. Acad. Sci.
U. S. A. 101:4250 – 4255.
17. Tap, J., S. Mondot, F. Levenez, E. Pelletier, C. Caron, J. P. Furet, E.
Ugarte, R. Munoz-Tamayo, D. L. Paslier, R. Nalin, J. Dore, and M.
Leclerc. 2009. Towards the human intestinal microbiota phylogenetic
core. Environ. Microbiol. 11:2574 –2584.
18. Kim, T. K., S. M. Thomas, M. Ho, S. Sharma, C. I. Reich, J. A. Frank,
Lemon et al.
8
July/August 2010 Volume 1 Issue 3 e00129-10

K. M. Yeater, D. R. Biggs, N. Nakamura, R. Stumpf, S. R. Leigh, R. I.
Tapping, S. R. Blanke, J. M. Slauch, H. R. Gaskins, J. S. Weisbaum, G. J.
Olsen, L. L. Hoyer, and B. A. Wilson. 2009. Heterogeneity of vaginal
microbial communities within individuals. J. Clin. Microbiol. 47:
1181–1189.
19. Zhou, X., S. J. Bent, M. G. Schneider, C. C. Davis, M. R. Islam, and L. J.
Forney. 2004. Characterization of vaginal microbial communities in adult
healthy women using cultivation-independent methods. Microbiology
150:2565–2573.
20. Zhou, X., C. J. Brown, Z. Abdo, C. C. Davis, M. A. Hansmann, P. Joyce,
J. A. Foster, and L. J. Forney. 2007. Differences in the composition of
vaginal microbial communities found in healthy Caucasian and black
women. ISME J. 1:121–133.
21. Frank, D. N., G. B. Spiegelman, W. Davis, E. Wagner, E. Lyons, and
N. R. Pace. 2003. Culture-independent molecular analysis of microbial
constituents of the healthy human outer ear. J. Clin. Microbiol. 41:
295–303.
22. Dekio, I., H. Hayashi, M. Sakamoto, M. Kitahara, T. Nishikawa, M.
Suematsu, and Y. Benno. 2005. Detection of potentially novel bacterial
components of the human skin microbiota using culture-independent
molecular profiling. J. Med. Microbiol. 54:1231–1238.
23. Fierer, N., M. Hamady, C. L. Lauber, and R. Knight. 2008. The influence
of sex, handedness, and washing on the diversity of hand surface bacteria.
Proc. Natl. Acad. Sci. U. S. A. 105:17994 –17999.
24. Gao, Z., C. H. Tseng, Z. Pei, and M. J. Blaser. 2007. Molecular analysis
of human forearm superficial skin bacterial biota. Proc. Natl. Acad. Sci.
U. S. A. 104:2927–2932.
25. Grice, E. A., H. H. Kong, G. Renaud, A. C. Young, G. G. Bouffard, R. W.
Blakesley, T. G. Wolfsberg, M. L. Turner, and J. A. Segre. 2008. A
diversity profile of the human skin microbiota. Genome Res. 18:
1043–1050.
26. Dethlefsen, L., M. McFall-Ngai, and D. A. Relman. 2007. An ecological
and evolutionary perspective on human-microbe mutualism and disease.
Nature 449:811– 818.
27. Ley, R. E., P. J. Turnbaugh, S. Klein, and J. I. Gordon. 2006. Microbial
ecology: human gut microbes associated with obesity. Nature 444:
1022–1023.
28. Turnbaugh, P. J., M. Hamady, T. Yatsunenko, B. L. Cantarel, A.
Duncan, R. E. Ley, M. L. Sogin, W. J. Jones, B. A. Roe, J. P. Affourtit,
M. Egholm, B. Henrissat, A. C. Heath, R. Knight, and J. I. Gordon.
2009. A core gut microbiome in obese and lean twins. Nature 457:
480 – 484.
29. Dicksved, J., J. Halfvarson, M. Rosenquist, G. Jarnerot, C. Tysk, J.
Apajalahti, L. Engstrand, and J. K. Jansson. 2008. Molecular analysis of
the gut microbiota of identical twins with Crohn’s disease. ISME J.
2:716 –727.
30. Willing, B., J. Halfvarson, J. Dicksved, M. Rosenquist, G. Jarnerot, L.
Engstrand, C. Tysk, and J. K. Jansson. 2009. Twin studies reveal specific
imbalances in the mucosa-associated microbiota of patients with ileal
Crohn’s disease. Inflamm. Bowel Dis. 15:653– 660.
31. Colombo, A. P., S. K. Boches, S. L. Cotton, J. M. Goodson, R. Kent,
A. D. Haffajee, S. S. Socransky, H. Hasturk, T. E. Van Dyke, F.
Dewhirst, and B. J. Paster. 2009. Comparisons of subgingival microbial
profiles of refractory periodontitis, severe periodontitis, and periodontal
health using the human oral microbe identification microarray. J. Peri-
odontol. 80:1421–1432.
32. Fredricks, D. N., T. L. Fiedler, and J. M. Marrazzo. 2005. Molecular
identification of bacteria associated with bacterial vaginosis. N. Engl. J.
Med. 353:1899 –1911.
33. Oakley, B. B., T. L. Fiedler, J. M. Marrazzo, and D. N. Fredricks. 2008.
Diversity of human vaginal bacterial communities and associations with
clinically defined bacterial vaginosis. Appl. Environ. Microbiol. 74:
4898 – 4909.
34. Brodie, E. L., T. Z. Desantis, D. C. Joyner, S. M. Baek, J. T. Larsen, G. L.
Andersen, T. C. Hazen, P. M. Richardson, D. J. Herman, T. K. Toku-
naga, J. M. Wan, and M. K. Firestone. 2006. Application of a high-
density oligonucleotide microarray approach to study bacterial popula-
tion dynamics during uranium reduction and reoxidation. Appl. Environ.
Microbiol. 72:6288 – 6298.
35. DeSantis, T. Z., E. L. Brodie, J. P. Moberg, I. X. Zubieta, Y. M. Piceno,
and G. L. Andersen. 2007. High-density universal 16S rRNA microarray
analysis reveals broader diversity than typical clone library when sampling
the environment. Microb. Ecol. 53:371–383.
36. Ivanov, I. I., K. Atarashi, N. Manel, E. L. Brodie, T. Shima, U. Karaoz,
D. Wei, K. C. Goldfarb, C. A. Santee, S. V. Lynch, T. Tanoue, A.
Imaoka, K. Itoh, K. Takeda, Y. Umesaki, K. Honda, and D. R. Littman.
2009. Induction of intestinal Th17 cells by segmented filamentous bacte-
ria. Cell 139:485– 498.
37. Flanagan, J. L., E. L. Brodie, L. Weng, S. V. Lynch, O. Garcia, R. Brown,
P. Hugenholtz, T. Z. DeSantis, G. L. Andersen, J. P. Wiener-Kronish,
and J. Bristow. 2007. Loss of bacterial diversity during antibiotic treat-
ment of intubated patients colonized with Pseudomonas aeruginosa. J.
Clin. Microbiol. 45:1954 –1962.
38. Huang, Y. J., E. Kim, M. J. Cox, E. L. Brodie, R. Brown, J. P. Wiener-
Kronish, and S. V. Lynch. 2010. A persistent and diverse airway micro-
biota present during chronic obstructive pulmonary disease exacerba-
tions. OMICS 14:9 –59.
39. Klepac-Ceraj, V., K. P. Lemon, T. R. Martin, M. Allgaier, S. W. Kembel,
A. A. Knapp, S. Lory, E. L. Brodie, S. V. Lynch, B. J. M. Bohannan, J. L.
Green, B. A. Maurer, and R. Kolter. 2010. Relationship between cystic
fibrosis respiratory tract bacterial communities and age, genotype, antibi-
otics, and Pseudomonas aeruginosa. Environ. Microbiol. 12:1293–1303.
40. DeSantis, T. Z., P. Hugenholtz, N. Larsen, M. Rojas, E. L. Brodie, K.
Keller, T. Huber, D. Dalevi, P. Hu, and G. L. Andersen. 2006. Green-
genes, a chimera-checked 16S rRNA gene database and workbench com-
patible with ARB. Appl. Environ. Microbiol. 72:5069 –5072.
41. Hugenholtz, P. 2002. Exploring prokaryotic diversity in the genomic era.
Genome Biol. 3:REVIEWS0003.
42. Simpson, E. H. 1949. Measurement of diversity. Nature 163:688.
43. Lozupone, C. A., M. Hamady, S. T. Kelley, and R. Knight. 2007.
Quantitative and qualitative beta diversity measures lead to different in-
sights into factors that structure microbial communities. Appl. Environ.
Microbiol. 73:1576 –1585.
44. Ley, R. E., D. A. Peterson, and J. I. Gordon. 2006. Ecological and
evolutionary forces shaping microbial diversity in the human intestine.
Cell 124:837– 848.
45. Uehara, Y., H. Nakama, K. Agematsu, M. Uchida, Y. Kawakami, A. S.
Abdul Fattah, and N. Maruchi. 2000. Bacterial interference among nasal
inhabitants: eradication of Staphylococcus aureus from nasal cavities by
artificial implantation of Corynebacterium sp. J. Hosp. Infect. 44:127–133.
46. Lina, G., F. Boutite, A. Tristan, M. Bes, J. Etienne, and F. Vandenesch.
2003. Bacterial competition for human nasal cavity colonization: role of
staphylococcal agr alleles. Appl. Environ. Microbiol. 69:18 –23.
47. Feingersch, R., and O. Beja. 2009. Bias in assessments of marine SAR11
biodiversity in environmental fosmid and BAC libraries? ISME J.
3:1117–1119.
48. Lane, D. J. 1991. 16S/23S rRNA sequencing, p. 115–175. In E. Stacke-
brandt and M. Goodfellow (ed.), Nucleic acid techniques in bacterial sys-
tematics. John Wiley and Sons, New York, NY.
49. DeSantis, T. Z., Jr., P. Hugenholtz, K. Keller, E. L. Brodie, N. Larsen,
Y. M. Piceno, R. Phan, and G. L. Andersen. 2006. NAST: a multiple
sequence alignment server for comparative analysis of 16S rRNA genes.
Nucleic Acids Res. 34:W394 –W399.
50. Huber, T., G. Faulkner, and P. Hugenholtz. 2004. Bellerophon: a pro-
gram to detect chimeric sequences in multiple sequence alignments.
Bioinformatics 20:2317–2319.
51. Ludwig, W., O. Strunk, R. Westram, L. Richter, H. Meier, Yadhukumar,
A. Buchner, T. Lai, S. Steppi, G. Jobb, W. Forster, I. Brettske, S. Gerber,
A. W. Ginhart, O. Gross, S. Grumann, S. Hermann, R. Jost, A. Konig, T.
Liss, R. Lussmann, M. May, B. Nonhoff, B. Reichel, R. Strehlow, A.
Stamatakis, N. Stuckmann, A. Vilbig, M. Lenke, T. Ludwig, A. Bode, and
K.-H. Schleifer. 2004. ARB: a software environment for sequence data. Nu-
cleic Acids Res. 32:1363–1371.
52. Lozupone, C., M. Hamady, and R. Knight. 2006. UniFrac—an online
tool for comparing microbial community diversity in a phylogenetic con-
text. BMC Bioinformatics 7:371.
53. Lozupone, C., and R. Knight. 2005. UniFrac: a new phylogenetic method
for comparing microbial communities. Appl. Environ. Microbiol. 71:
8228 – 8235.
54. Saeed, A. I., V. Sharov, J. White, J. Li, W. Liang, N. Bhagabati, J.
Braisted, M. Klapa, T. Currier, M. Thiagarajan, A. Sturn, M. Snuffin, A.
Rezantsev, D. Popov, A. Ryltsov, E. Kostukovich, I. Borisovsky, Z. Liu,
A. Vinsavich, V. Trush, and J. Quackenbush. 2003. TM4: a free, open-
source system for microarray data management and analysis. Biotech-
niques 34:374 –378.
Nostril and Oropharyngeal Bacterial Microbiota
July/August 2010 Volume 1 Issue 3 e00129-10
Document Outline
- Comparative Analyses of the Bacterial Microbiota of the Human Nostril and Oropharynx
- RESULTS
- Phylum-level comparison of nostril and oropharyngeal bacte-rial communities.
- Family-level comparison of nostril and oropharyngeal bac-terial communities.
- Inverse correlation between Firmicutes and another phylum in both sites.
- Nostril- and oropharynx-associated taxa detected using the microarray.
- Nostril and oropharyngeal bacterial microbiota based on 16S rRNA gene clone libraries.
- The microbiota of the oropharynx has greater richness than nostril microbiota.
- Interpersonal comparison of nostril and oropharyngeal mi-crobiota.
- DISCUSSION
- An inverse correlation between Firmicutes and Actinobacte-ria in nostril microbiota.
- Comparison of nostril microbiota compositions from culture-independent surveys.
- The phylum-level bacterial composition in the oropharynx differs from that in the esophagus and mouth but is similar to that in saliva.
- Combined 16S rRNA gene-based approaches to study micro-biota composition.
- Bacterial microbiota of the nostril compared to that of the oropharynx.
- MATERIALS AND METHODS
- ACKNOWLEDGMENTS
- SUPPLEMENTAL MATERIAL
- REFERENCES
- RESULTS
Wyszukiwarka
Podobne podstrony:
Walterowicz, Łukasz A comparative analysis of the effects of teaching writing in a foreign language
Analysis of Roosevelt's New?al and the Great?pression
Lester et al 2012 Comparative analysis of strawberry total phenolics via Fast Blue BB vs Folin–Cio
Babi Yar Analysis of Yevtushenko's Writing Style and Meani
Analysis of residual styrene monomer and other VOC in expand
A Cost Analysis of Typical Computer Viruses and Defenses
To Kill a Mockingbird Analysis of Boo Radley, Atticus, and doc
comparative study of homelessness in UK and Japan
Oedipus Rex Analysis of Bliss in Ignorance and Socratic Vi doc
A comparative view of Englis, Czech, French and Germa idioms
SOLAR AND GEOMAGNETIC ACTIVITIES AND RELATED EFFECTS ON THE HUMAN PHYSIOLOGICAL AND CARDIO HEALTH ST
An%20Analysis%20of%20the%20Data%20Obtained%20from%20Ventilat
Pancharatnam A Study on the Computer Aided Acoustic Analysis of an Auditorium (CATT)
Analysis of the Persian Gulf War
Extensive Analysis of Government Spending and?lancing the
Analysis of the Holocaust
Illiad, The Analysis of Homer's use of Similes
Analysis of the Infamous Watergate Scandal
Road Not Taken, The Extensive Analysis of the Poem
więcej podobnych podstron