
System Dynamic Model for Computer Virus Prevalance
Hazem Y. Abdelazim
Assistant Professor, IT Department,
College of Computer Science, Cairo University
hazem@imaginet-software.com
Khaled Wahba
Assistant Professor, Systems and Biomedical Engineering Department
Faculty of Engineering, Cairo University
Tel: +2 02 737 6006, Fax: +2 02 739 1380
Khaled.wahba@riti.org
ABSTRACT
Regardless of how sophisticated anti-virus technology may become, computer viruses will
forever remain in an uneasy coexistence with us and our computers. Individual strains will
wax and wane, but as a whole, computer viruses and anti-virus technology will co -evolve
much as biological parasites and hosts do. “Dynamics of Computer Virus Prevalence”
remains a challenging research area for modeling and simulation, in an attempt to devise
policies, and guidelines to control virus prevalence and spreading in organizations.
Standard SIR Epidemic models is used as the backbone of this study, capitalizing on the dual
nature of the biological Virus, and computer Virus Prevalence. The basic SIR Model, has
been extended to account for an important concept of a “Kill signal” which is generated as
an Infected machine is virus-cleared. The “Kill Signal” Spreads through a ‘Word of Mouth
Contact Rate” informing physically connected machines, or machines that has exchanged
Software with the infected one about the virus. The Mathematical Model of the extended SIR
is formulated with some details.
As a Policy Design it is suggested that the Kill Signal Level, represented by a Word of Mouth
Contact Rate (WMCR) to be dynamically increasing as the Infectious Population level
Increases. This has proven theoretically using the Simulation model to push down the
Epidemic Level significantly, and thus suggesting a very cost effective organizational policy
to control the computer Virus Spreading. On the prevention level policy, the authors have
suggested, controlling the infectivity as well as the contact rate (through network topology or
transfer media) will help decrease the infection rate of the PC’s.
Keywords: Computer Viruses, Epidemiological, SIR Model
1 INTRODUCTION
Computer viruses have pervaded popular culture at least as successfully as they have the
world's computer population. Computer viruses have become the subject of widespread urban
legends and hoaxes, popular television shows and movies. Yet they have not received much
scientific scrutiny.
Table of Contents
Go Back

Much of their popular presence is attributable to an obvious but deep biological analogy:
computer viruses replicate by attaching themselves to a host (a program or computer instead
of a biological cell) and co-opting the host's resources to make copies of themselves [3].
Biological analogy has been found to be key in understanding the propagation of computer
viruses on a global scale and inspirational in the development of defenses against them.
Computer viruses can trace their pedigree to John von Neumann's studies of self-replicating
mathematical automata in the 1940s. Although the idea of programs that could infect
computers dates to the 1970s, the first well-documented case of a computer virus spreading
"in the wild" occurred in 1986 [6], when a code snippet known as the "Brain" virus appeared
on several dozen diskettes at the University of Delaware. Today viruses afflict at least a
million computers every year. Users spend several hundred million dollars annually on anti-
virus products and services, and this figure is growing rapidly.
Appendix B, demonstrates a very interesting Time-Line History for Virus Prevalence starting
from 1949 up to date.
There are three main classes of PC viruses, file infectors, boot-sector viruses and macro
viruses.
File Infectors: Roughly 85 percent of all known viruses infect files containing applications
such as spreadsheet programs or games. When a user runs an infected application, the virus
code executes first and installs itself independently in the computer's memory so that it can
copy itself into subsequent applications that the user runs. Once in place, the virus returns
control to the infected application; the user remains unaware of its existence. Eventually a
tainted program will make its way to another computer via a shared diskette or network, and
the infection cycle will begin anew.
Boot-sector viruses: Accounts for about 5 percent of known PC virus strains, reside in a
special part of a diskette or hard disk that is read into memory and executed when a computer
first starts. Once loaded, a boot-sector virus can infect any diskette that is placed in the drive.
It also infects the hard disk, so that the virus will be loaded into memory whenever the system
is restarted. Boot viruses are highly effective: even though there are fewer strains, they were
for a time much more prevalent than file infectors were.
Macro viruses: The third category, macro viruses, are independent of operating systems and
infect files that are usually regarded as data rather than as programs. Many spreadsheet,
database and word-processing programs can execute scripts --prescribed sequences of actions-
-embedded in a document. Such scripts, or macros, are used to automate actions ranging from
typing long words to carrying out complicated sequences of calculations.
Antivirus Technology: Antivirus software has existed since shortly after computer viruses
first appeared. Generic virus-detection programs can monitor a computer system for virus -like
behavior (such as modification of certain crucial files or parts of main memory), and they can
periodically check programs for suspicious modifications. Such software can even detect
hitherto unknown viruses, but it can also be prone to false alarms because some legitimate
activities resemble viruses at work.

2 PROBLEM DEFINITION AND OBJECTIVE THE PAPER
With the resurgence of the Internet, computer viruses are able to propagate much faster, and
more aggressively. As early as 1988, Robert Tappan Morris launched what came to be known
as the "Internet Worm," a program that exploited security holes and invaded hundreds of
computers around the world in less than a day. Also New type of viruses Like “Melissa”, and
Love Bug Spread through Outlook Contacts by replicating Fake e-mails.
Most Researches on Computer Viruses [4] are on the Microscopic Level (Virus structure,
Replication mechanism, Type, and extent of damage, … etc).
The focus of this study, however, is more on the macroscopic level, where Dynamics models
for Computer Virus Prevalence inspired from Mathematical epidemiological models are
presented.
Standard Epidemiological SIR Model is being presented, however a logical and practical
extension has been introduced for the case of computer viruses. This extension accounts for a
“Word of Mouth Contact Rate WMCR” or also known as “Kill Signal”, whereby a known
detected Virus is associated by Central reporting and spreading of “Word of Mouth”
awareness to other computer users, with direct adequate contact with the Infected Machine.
It will be demonstrated that this Central Reporting and Word of mouth spreading portrays a
very important message, and a Policy design criteria, perhaps more important than relying on
the latest anti-virus technology, in order to push down the virus below epidemic threshold.
Mathematical formulation for the dynamics of Computer Virus Prevalence will be presented.
Reference Modes for Various types of Computer Viruses are introduced, and used for testing
the model. Causal Loop Diagram is designed and used to develop, a Stock and Flow model
used to simulate the Problem. Various Sensitivity Analyses are explored, and Finally Policy
Decisions are discussed and applied to the Simulation model.
3 MATHEMATICAL FORMULATION
3.1 Basic SIR Model
In our modeling of computer virus spread [1] some important concepts and simplifications
have been borrowed from the well-established field of mathematical epidemiology [3].
In particular, the standard SIR (Susceptible, Infectious, and Recovered) Model [1] is used as
the base for the mathematical Formulation.
Standard SIR model is shown as follows in Fig. 1
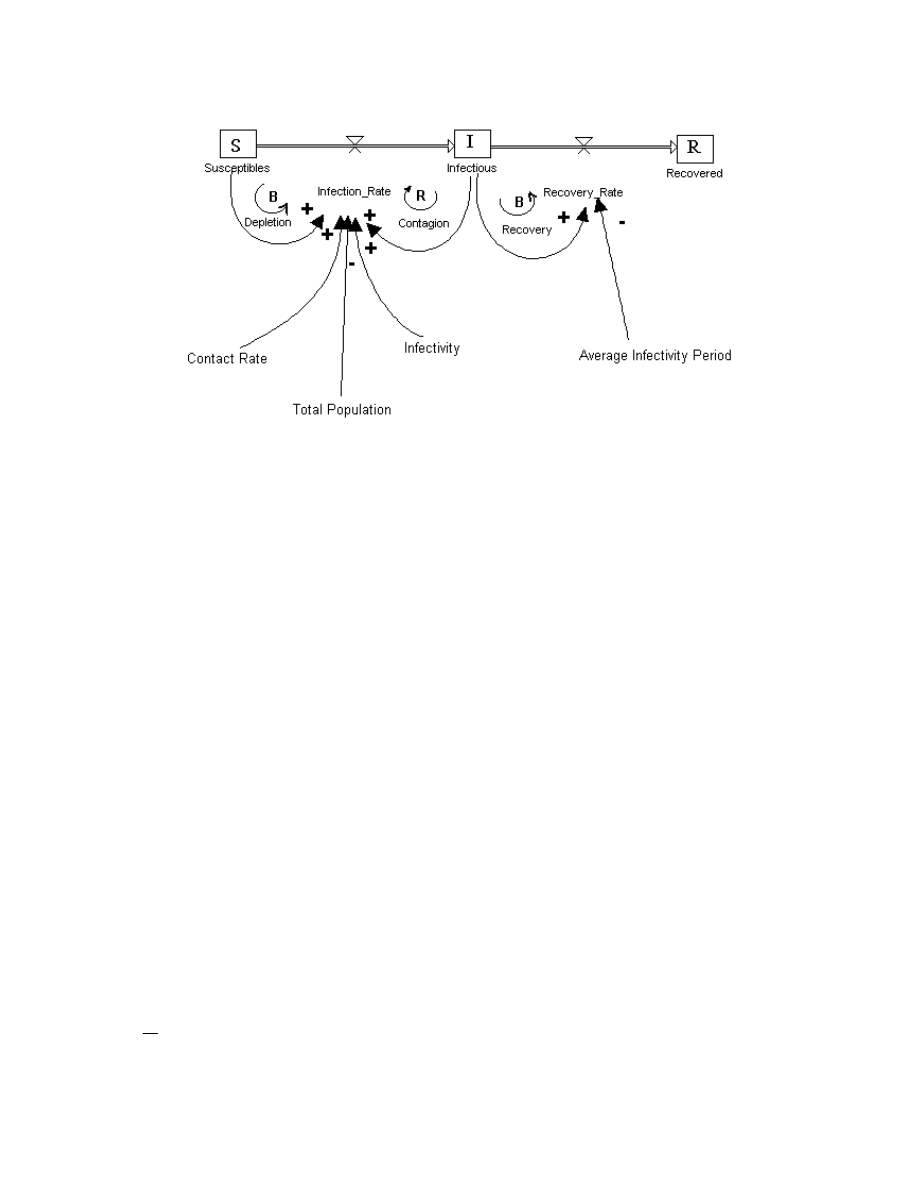
Figure 1: Standard SIR Epidemiological Model
Starting from a Total population of N objects (in this case PCs), Contact Rate “c” is defined
and measured as Computers Interfaced or contacted per unit of Computer Population per time.
Contact Rate “c” is mainly a function of Network topology and Nature of Computers
Interconnections. The term “contact” here, does not only imply physical contact but also
through Software Exchange (for e.g. Diskettes exchange). In that case contact rate implies
rate of S/W workers exchanging Software per population machine per time.
Infectivity i is a dimensionless Factor that represents the probability that a susceptible
machine gets infected when connected to an infectious machine (or to the network).
In the SIR model it is assumed that the Infected machine remains infected for a certain period,
which is the Average Infectivity period “d
i
”, after which the machine is scanned for the virus,
and then cleared. The Model does not take into consideration that the machine can be
reformatted, this is considered as out of the scope of the research.
The parameter d
i
affects the flow rate from the Infectious population of PC’s to the Recovered
Population.
With Reference to the SIR Model, the Susceptibles, Infectious, and Recovered PC Population
are governed by the Relationship;
S + I + R = N
(1)
The dynamics of the above SIR model is governed by the set of Non-Linear coupled
Differential Equations described as follows,
dt
dI
= (IR – RR)
(2)

dt
dR
= – RR
(3)
where IR, and RR are the Infection Rate, and Recovery Rate, respectively.
IR =
N
ciS
(4)
RR =
i
d
I
(5)
Substituting Equations 4, and 5 into equations 2, and 3, and substituting for S in Equation 4
for I, and R in Equation 1, we get,
dt
dI
=
N
R
I
N
ciI
)
(
−
−
-
i
d
I
(6)
and,
dt
dR
=
i
d
I
(7)
3.2 Extended SIR Model
The basic SIR Model represented above has been extended [3,5], to account for a practical
observation that exists in the SW Workers Community, which will lead to the conc ept of
Word of Mouth Contact Rate (WMCR), or kill signal discussed earlier.
This is the concept of a Word of Mouth Contact Rate (WMCR), that starts spreading much
like an epidemic. When a computer virus is detected, SW worker starts informing other
Workers who have exchanged SW in the last period, and contacts them verbally or by e-mails
to warn them for the possibility of a certain virus prevalence. This as will be depicted later in
the simulation will have a great impact in reducing the original virus Spreading, and will thus
represent a key Policy Decision Criteria for pushing down the virus below the epidemic
threshold.
Mathematically, the WMCR will be represented by “c
k
”, where the Subscript k represents a
“kill” signal. Hence WMCR, c
k
will be defined as the number of colleagues contacted
(assuming each colleague has one machine), per Machines Population per time.
The Introduction of c
k
lowers the Infection Rate by a Quantity which is proportional to the
Current Infectious, and Recovered Population, given by, c
k
IR/N
Accordingly Equation (6) will be modified to,
dt
dI
=
N
R
I
N
ciI
)
(
−
−
-
i
d
I
-
N
IR
c
k
(8)
In the extended SIR model we do not assume that the recovered machine will remain for
Eternity, but after a certain period of time will be susceptible to new viruses again. This is the
Average Recovery period “d
r
”, after which the machine is susceptible to new viruses. This
parameter d
r
affects the flow rate from the Recovered population to the Susceptible
Population. The effect of d
r
is accounted for in Equation (7) as follows,
dt
dR
=
N
IR
c
k
-
r
d
R
+
i
d
I
(9)
3.3 Endogenous Focus and Causal Loop Analysis
In what follows the dynamic hypothesis is explained in terms of the endogenous
consequences of Feedback Structures.
As shown in the Accompanying Causal Loop Diagram, 6 Causal loops are inherent in our
model. Three loops are positive Re-enforcing Loops, and three are negative Balancing. These
Loops interact, to generate the dynamic Behavior that simulates the reference modes as will
be presented in simulation and Testing section.
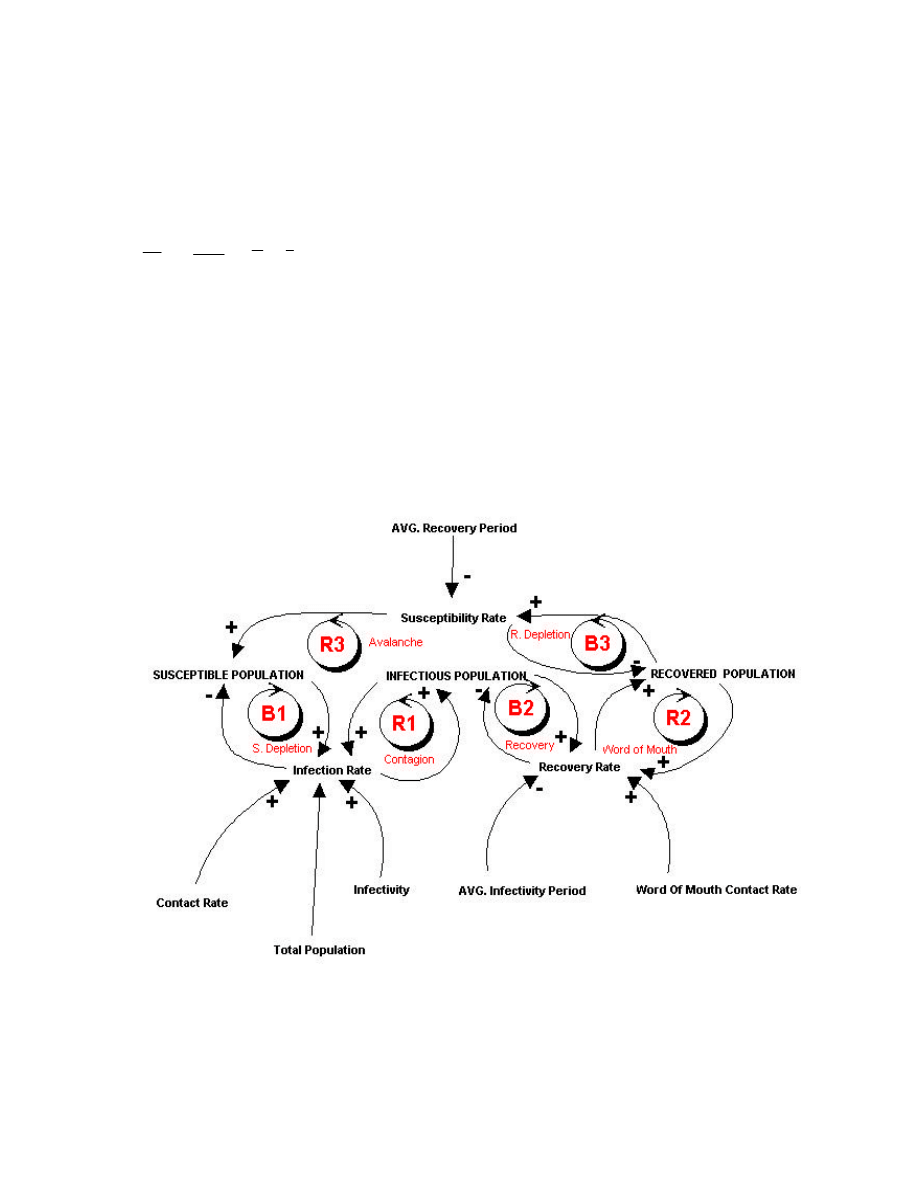
Figure 2: Causal Loop Diagram for the Computer Virus Prevalence Model

In what follows each loop is analyzed,
B1: S. Depletion Loop
In this loop, S. Stands for Susceptible Population, accordingly this loop main function is to
deplete the Susceptible Population Stock. As the Susceptible Population Increase the Infection
Rate Increases, and as the Infection Rate Increases (outflow with respect to the susceptible
population), the Susceptible Population is depleted.
R1: Contagion Loop
In this loop, this loop main function is to raise the Infection Population. As the Infection
Population Increases, the Infection rate Increases, which increases more the Infection
Population.
B2: Recovery Loop
The main function of this loop is to deplete the Infectious Population Stock, and accordingly
increase the Recovered Population. As the Infectious Population Increase the recovery Rate
Increases, and as the recovery Rate Increases (outflow with respect to the infectious
population), the Infectious Population is depleted, and the recovered Population rises.
R2: Word of Mouth Loop
The main function of this loop is to raise the Recovered Stock. This is the key contribution in
this study, is that the Word of Mouth Spreading that a Virus has been detected by machine
speeds up Recovery, since other contacted/connected machine will be aware, and start
detecting and Clearing the Virus. As the recovered population increases, the recovery Rate
Increases through the Word Mouth Effect, and as the recovery Rate Increases, then the
Recovered Population increases.
B3: R. Depletion Loop
In this loop, where R. Stands for Recovered Population, accordingly this loop main function
is to deplete the Recovered Population Stock. As the level of the Recovered Population
Increases, the Susceptibility Rate Increases, and as the Susceptibility Rate Increases (outflow
with respect to the recovered population), the Recovered Population is depleted.
R3: Avalanche Loop
This Loop tends to re-enforce all populations. In case of an open Community, and assuming
that this loop is dominant, it tends to increase exponentially, and indefinitely the levels of all
population stocks, namely the Susceptible, Infectious, and Recovered. In our model however,
we assume a closed community, accordingly, the Total Sum of population is N, as in Equation
(1). This Loop actually passes through all endogenous Variables.
The Following is the corresponding Stock and Flow Simulation diagram Figure 3. Appendix
B shows the stock and flow equations used in the model.
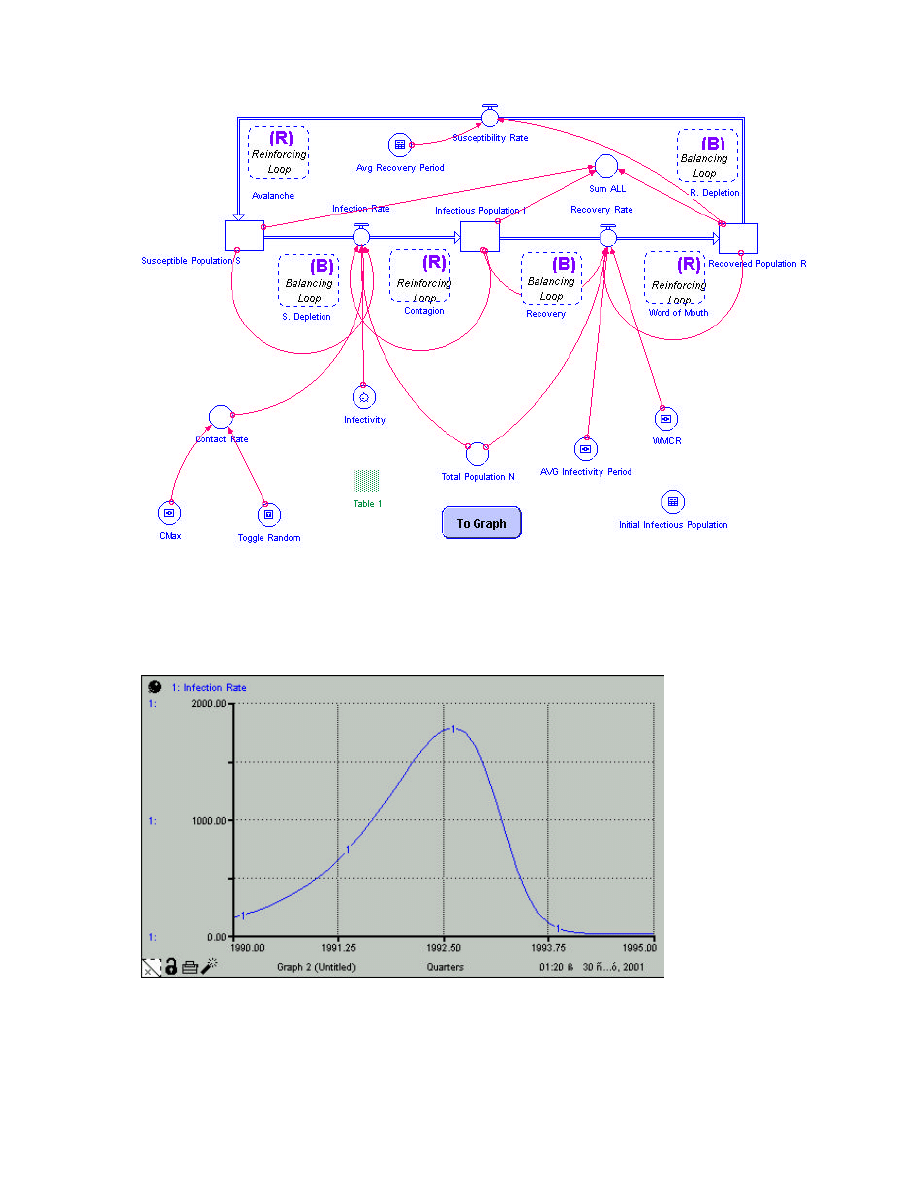
Figure 3: Stock and Flow Diagram for the Computer Virus Prevalence Model
4 MODEL SIMULATION RESULTS
The Following Figure shows a Typical Run for the Infection Rate.
Figure 4: Infection Rate (I)
The Infection Rate as shown in Figure 4 exhibits an exponential rise followed by a decline
due to the interaction of several loops, as discussed in the Dynamic Hypothesis
In the above Run the Following data were used,
•
Total Population N: 1000
•
Infectivity: 30%
•
Contact Rate: 5
•
WMCR: 16
•
Average Infectivity Period: 8
•
Average Recovery Period: 10
In the full paper, sensitivity analysis is being performed and demonstrated using key model
parameters
5 POLICY DESIGN AND EVALUATION
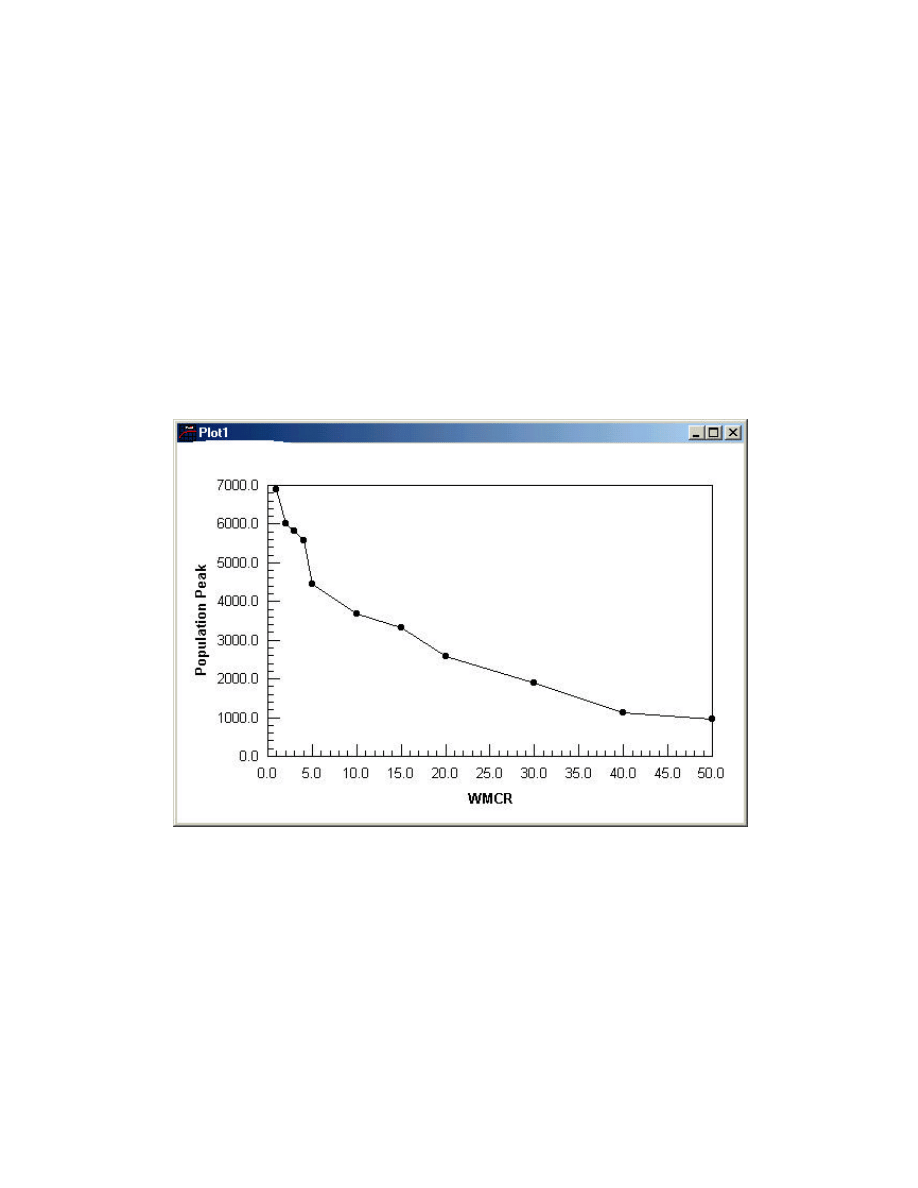
Word of Mouth Contact plays a significant role in pushing down, and slowing down the Viral
Epidemic. Several Runs of the simulation model for various values of WMCR while
observing the Infectious population peak, has revealed a rather negative exponential
relationship, as shown in the next Figure 5.
Figure 5: Population Peak as a Function of WMCR
This relationship fits to a good extent the following Formula,
Infectious Population = 6593 exp (-0.046819*WMCR)
(10)
Therefore, a suggested Policy is to derive a negative Feedback loop through a positive
relationship between the Level of Infectious Population Stock and WMCR. Hence WMCR
will increase as the Infectious population Increases.
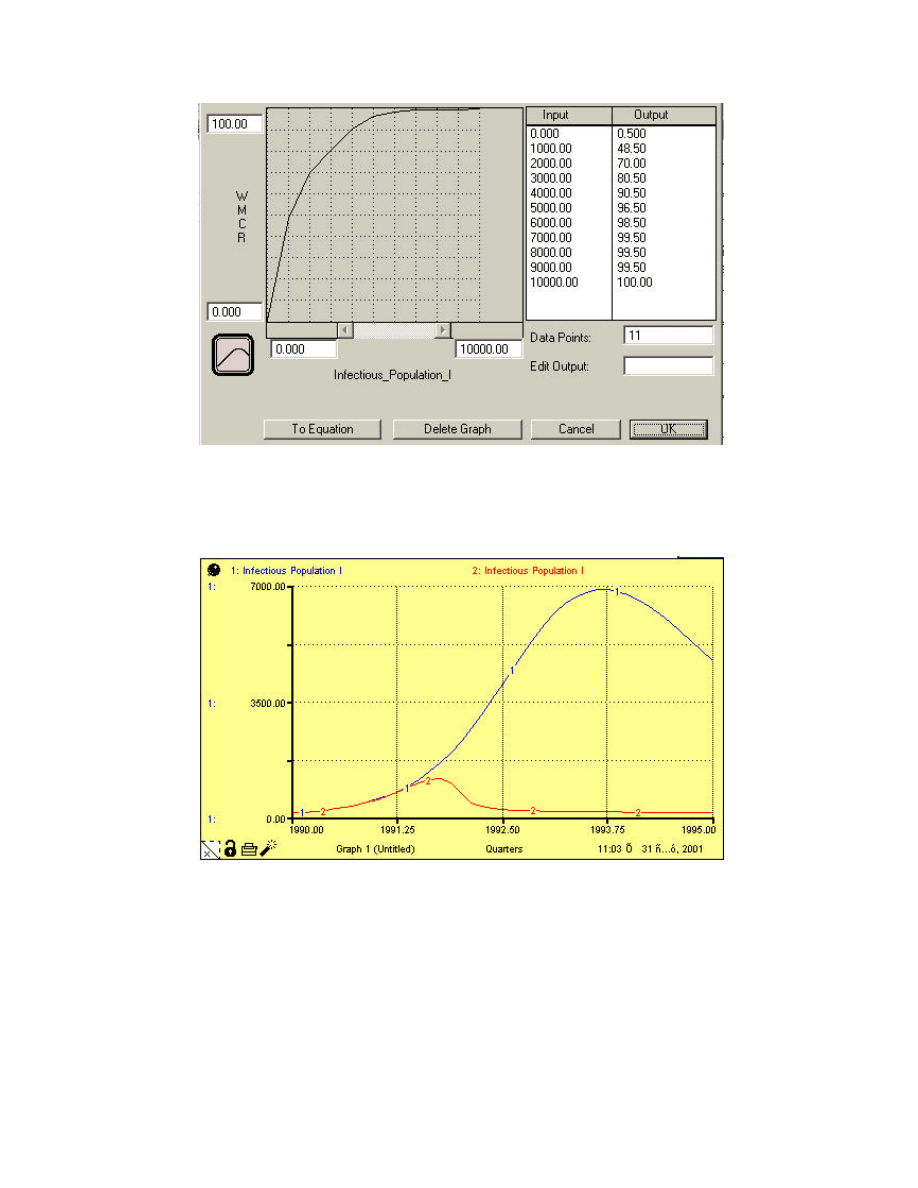
Figure 6: Policy Design Functional Relationship
Applying this suggested Policy on the Simulation model, shows a remarkable effect on the
Epidemic by pushing down the peak value, and decreasing the epidemic Duration as shown in
next figure.
Figure 7: Infectious Population after Applying Policy Decision
Run #1 Infectious Population without the application of the suggested Policy
Run #2 Infectious Population after applying the Suggested Policy.
The above figure shows the importance of the Word of Mouth Contact rate, and the concept
of the Kill signal to push down the Computer Viral Epidemic to a great extent. This suggests
that central reporting of virus incidence, followed by dissemination of these findings to
largest possible number of related machines, in addition to the users awareness, and
responsiveness will alleviate to a great extent the computer virus Epidemic Effect.

On the prevention level policy, the authors have suggested, controlling the infectivity as well
as the contact rate (through network topology or transfer media) will help decrease the
infection rate of the PC’s. However, this suggestion has been tested and attempted.
6 SUMMARY AND CONCLUSION
Background Information is overviewed covering various types of viruses, and anti-virus
technologies. An interesting time line of most common viruses is shown in
Appendix A.
Mathematical formulation of the problem is presented with some details. Standard SIR
Epidemic model was used as the backbone of the study. The main contribution in this paper is
developing and simulating an extended SIR model using STELLA Software. The concept of
“Kill Signal” represented by a Word of Mouth Contact Rate Parameter is introduced. The
basic idea is that as much as the computer virus starts exercising it’s epidemic behavior, and
as computer viruses are detected, and cleared, Kill signal starts spreading through a word of
mouth to machines that has been contacted or exchanged Software with the infected machine.
The governing equations that dictate this effect have been also incorporated in the model.
The Standard Steps in the modeling process are followed. Starting from Problem articulation
to Dynamic hypothesis to testing and simulation.
Time Horizon is selected to be in the period 1990-1995, in order to test and verify against the
reference modes that was collected from the Literature in this period. (This is shown in the
full paper)
Causal Loop Diagram of the problem, and the associated endogenous focus, has been
presented and explained. A Complete workable Stock and flow model has been built using
Stella Software.
The observed behavior of the Infection rate for all viruses showed, an epidemic rise followed
by a decline, which has been verified in the Simulation Model.
Sensitivity Analysis of Key exogenous variables has shown logical consistency as for the
Expected sensitivity results.
The main focus in the Sensitivity Analysis was on the Effect of WMCR (Kill Signal) in
slowing down the extent of the Epidemic. It has been demonstrated that as the WMCR
increases the peak of the Epidemic decreases exponentially by data fitting this relationship.
As a Policy Design a feedback mechanism (ano ther Balancing loop) is suggested, where the
WMCR is dynamic and increases as the Infectious Population level Increases. The dynamic
reaction of the WMCR means as the Infectious population increases the extent of Virus
Central Reporting should widen to inform more users about Virus Existence. This slowed
down significantly the virus epidemic level.
These theoretical results on kill signals (WMCR) are exciting because they suggest a very
cost-effective technique for thwarting viral spread. A number of different implementations
can be considered, including user education (getting people to tell their friends if they
discover a computer virus) and organizational policies which encourage users to report virus

incidents to a central agency, which can then ensure that machines in the vicinity of the
infected machine are scanned for viruses and cleaned up.
REFERENCES
[1]
Sterman, J. “Business Dynamics: System thinking and Modeling for A Complex
World”. Irwin / McGrew Hill, ISBN 0 07-2311355, 2000.
[2]
Kirkwood, C., W., “System Dynamics Methods: A Quick Introduction” College of
Business Arizona State University, 1986.
[3]
Kephart J. O, Chess D M and White S.R, “Computers and Epidemiology”, IEEE
Spectrum, May 1993.
[4]
“Anti-Virus Research”, a Collection of Scienti fic Papers,
http://www.research.ibm.com/antivirus/SciPapers.htm
[5]
Kephart J. O, and White S.R, “ Measuring and Modeling Computer Virus
Prevalence”,
Proceedings of the 1993 IEEE Computer Society Symposium on Research in
Security and Privacy, Oakland, California, May 24-25, 1993; pp.2 -14.
[6]
Solomon, A, “A Brief History of PC Viruses”, Sep. 1995.
http://www.bocklabs.wisc.edu/~janda/solomhis.html#H06

APPENDIX A: STOCK AND FLOW EQUATIONS
Infectious_Population_I(t) = Infectious_Population_I(t - dt) + (Infection_Rate - Recovery_Rate) * dt
INIT Infectious_Population_I = Initial_Infectious_Population
INFLOWS
Infection_Rate=
Contact_Rate*Susceptible_Population_S*Infectious_Population_I*Infectivity/Total_Population_N
OUTFLOWS
Recovery_Rate=
Infectious_Population_I/AVG_Infectivity_Period+Infectious_Population_I*Recovered_Population_R*WMCR/
Total_Population_N
Recovered_Population_R(t) = Recovered_Population_R(t - dt) + (Recovery_Rate - Susceptibility_Rate) * dt
INIT Recovered_Population_R = 0
INFLOWS
Recovery_Rate=
Infectious_Population_I/AVG_Infectivity_Period+Infectious_Population_I*Recovered_Population_R*WMCR/
Total_Population_N
OUTFLOWS
Susceptibility_Rate = Recovered_Population_R/Avg_Recovery_Period
Susceptible_Population_S(t) = Susceptible_Population_S(t - dt) + (Susceptibility_Rate - Infection_Rate) * dt
INIT Susceptible_Population_S = Total_Population_N -Infectious_Population_I - Recovered_Population_R
INFLOWS
Susceptibility_Rate = Recovered_Population_R/Avg_Recovery_Period
OUTFLOWS
Infection_Rate=
Contact_Rate*Susceptible_Population_S*Infectious_Population_I*Infectivity/Total_Population_N
AVG_Infectivity_Period = 2
Avg_Recovery_Period = 2
CMax = 7
Contact_Rate = IF(Toggle_Random=1) THEN RANDOM(1,CMax) ELSE CMax
Epidemic_Threshold = Infection_Rate/Recovery_Rate
Infectivity = 1
Initial_Infectious_Population = 0.01
Sum_ALL = Infectious_Population_I+Recovered_Population_R+Susceptible_Population_S
Toggle_Random = 1
Total_Population_N = 10000
WMCR = 0.5

A
PPENDIX
B: T
IME
L
INE OF
C
OMPUTER
V
IRUSES
(1949 – T
O
D
ATE
)
1949
Theories for self-replicating programs are first developed.
1981
Apple Viruses 1, 2, an d 3 are some of the first viruses "in the wild," or public
domain. Found on the Apple II operating system, the viruses spread through
Texas A&M via pirated
computer games
.
1983
Fred Cohen, while working on his dissertation, formally defines a computer
virus
as "a computer program that can affect other computer programs by modifying
them in such a way as to include a (possibly evolved) copy of itself."
1986
Two programmers named Basit and Amjad replace the executable code in the
boot sector of a
floppy disk
with their own code designed to infect each 360kb
floppy accessed on any drive. Infected floppies had "© Brain" for a volume label.
1988
One of the most common viruses, Jerusalem, is unleashed. Activated every Friday
the 13th, the virus affects both .EXE and .COM files and deletes any programs run
on that day.
1990
Symantec launches
Norton AntiVirus
, one of the first anti-virus programs
developed by a large company.
1991
Tequila is the first widespread
polymorphic
virus found in the wild. Polymorphic
viruses make detection difficult for virus scanners by changing their appearance
with each new infection.
1992
1300 viruses are in existence, an increase of 420% from December of 1990.
The Michelangelo scare predicts 5 million computers will crash on March 6. Only
5,000–10,000 actually go down.
1994
Good Times
email hoax
tears through the computer community. The hoax warns
of a malicious virus that will erase an entire hard drive just by opening an email
with the subject line "Good Times." Though disproved, the
hoax
resurfaces every
six to twelve months.
1998
Currently harmless and yet to be found in the wild, StrangeBrew is the first virus
to infect Java files. The virus modifies CLASS files to contain a copy of itself within
the middle of the file's code and to begin execution from the virus section.

1999
The Melissa virus, W97M/Melissa, executes a macro in a document attached to an
email, which forwards the document to 50 people in the user's Outlook address
book. The virus also infects other Word documents and subsequently mails them
out as attachments. Melissa spread faster than any other previous virus.
2000
The Love Bug, also known as the ILOVEYOU virus, sends itself out via Outlook,
much like Melissa. The virus comes as a VBS attachment and deletes files,
including MP3, MP2, and JPG. It also sends usernames and passwords to the
virus' author.
W97M.Resume.A, a new variation of the Melissa virus, is determined to be in the
wild. The "resume" virus acts much like Melissa, using a Word macro to infect
Outlook and spread itself.
The "Stages" virus, disguised as a joke email about the stages of life, spreads
across the Internet. Unlike previous viruses, Stages is hidden in an attachment
with a false ".txt" extension, making it easier to lure recipients into opening it.
Until now, it has generally been safe to assume the text files are safe.
2001
The Anna Kournikova virus, also known as VBS/SST, which masquerades as a
picture of Tennis Star Anna Kournikova, operates in a similar manner to Melissa
and The Love Bug. It spreads by sending copies of itself to the entire address
book in Microsoft Outlook. It is believed that this virus was created with a so-
called virus creation kit, a program which can enable even a novice programmer
to create these malicious programs.
In May, the HomePage email virus hit no more than 10,000 users of Microsoft
Outlook. When opened, the virus redirected users to sexually explicit Web pages.
Technically known as VBSWG.X, the virus spread quickly through Asia and
Europe, but was mostly prevented in the U.S. because of lessons learned in
earlier time zones. The author of the virus is said to live in Argentina, and have
authored the Kournikova virus earlier in the year.
The Code Red I and II worms attacked computer networks in July and August.
According to Computer Economics they affected over 700,000 computers and
cau sed upwards of 2 billion in damages. A worm spreads through external and
(then) internal computer networks, as opposed to a virus which infects computers
via email and certain websites. Code Red took advantage of a vulnerability in
Microsoft's Windows 2000 and Windows NT server software. Microsoft developed
a patch to protect networks against the worm, and admits that they too were
attacked. Other major companies affected include AT&T, and the AP.
Back to the Top
Wyszukiwarka
Podobne podstrony:
Modeling computer virus prevalence with a susceptible infected susceptible model with reintroduction
A dynamic model for solid oxide fuel cell system and analyzing of its performance for direct current
A Feature Selection and Evaluation Scheme for Computer Virus Detection
Adequacy of Checksum Algorithms for Computer Virus Detection
A Computational Model of Computer Virus Propagation
A note on Cohen s formal model for computer viruses
N gram analysis for computer virus detection
Computer Virus Propagation Model Based on Variable Propagation Rate
Prosecuting Computer Virus Authors The Need for an Adequate and Immediate International Solution
Classification of Packed Executables for Accurate Computer Virus Detection
Blueprint for a Computer Immune System
A Model for Detecting the Existence of Unknown Computer Viruses in Real Time
Model for energy conversion in renewable energy system with hydrogen storage
The dynamics of computer virus infection
Use of an Attenuated Computer Virus as a Mechanism for Teaching Epidemiology
A framework for modelling trojans and computer virus infection
Elementy systemów dynamicznych Simulink
Overview of ODEs for Computational Science
58 829 845 A New Model for Fatique Failure due to Carbide Clusters
więcej podobnych podstron