
Does an Electronic Stock Exchange Need an Upstairs Market?*
Hendrik Bessembinder
Blaine Huntsman Chair in Finance
David Eccles School of Business
University of Utah
1645 East Campus Center Drive
Salt Lake City, UT 84112
e-mail: finhb@business.utah.edu
and
Kumar Venkataraman
Edwin L. Cox School of Business
Southern Methodist University
PO Box 750333, Dallas, TX 75275
e-mail: kumar@mail.cox.smu.edu
Initial Draft: April 2000
Current Draft: May 2002
* We thank Seung Ahn, Chris Barry, Bill Christie, Jeffrey Coles, Naveen Daniel, Herbert Kaufman,
Peter Locke, George Oldfield, Elizabeth Odders-White, Rex Thompson, and seminar participants at the
2000 FMA Annual Meetings, the Fall 2001 NBER market microstructure meetings, Arizona State
University, College of William and Mary, Texas Christian University, Texas Tech University, and
Southern Methodist University for valuable comments and discussion. We are grateful to Patricia
Ranunkel of Bank Indosuez (Paris) and Marianne Demarchi of the Paris Bourse for information on the
Paris upstairs market.

Does an Electronic Stock Exchange Need an Upstairs Market?
Abstract
We examine block trades on the Paris Bourse to test several theoretical predictions regarding upstairs
trading, and exploit cross-sectional variation in “crossing rules” on the Paris Bourse to provide evidence
on their relevance. Paris provides an excellent setting to test the implications of upstairs intermediation
models, because its electronic limit order market closely resembles the downstairs markets envisioned by
theorists.
We present direct evidence in support of Grossman’s (1992) prediction that upstairs brokers lower
execution costs by tapping into pools of unexpressed liquidity, as actual execution costs upstairs are less
than one third as large as would be anticipated if block trades were executed against displayed liquidity in
the downstairs market. Consistent with prior analyses, the Paris data also supports the Seppi (1990)
hypothesis that upstairs brokers certify trades as uninformed.
We find that participants in stocks with less restrictive crossing rules agree to outside-the-quote
executions for more difficult trades and at times when downstairs liquidity is lacking. These likely
represent trades that could not have been otherwise completed, suggesting that market quality can be
enhanced by allowing participants more flexibility to execute blocks at prices outside the quotes, a
consideration particularly relevant to U.S. markets in the wake of decimalization.

1. Introduction
Glosten (1994) emphasizes the efficiencies that result from consolidating financial market trading
in a centralized electronic limit order book. A computerized market has relatively low operating costs,
the book's price and time priority rules provide incentives for liquidity providers to bid aggressively for
market orders, and the consolidation of trading ensures that each order is exposed to all other displayed
orders. Despite these efficiencies, virtually every stock market (including those featuring an electronic
limit order book) is accompanied by a parallel "upstairs" market, where larger traders employ the services
of brokerage firms to locate counterparties and negotiate trade terms. This paper provides empirical
description of the upstairs market and tests of theoretical models of upstairs trading using data from the
Paris Bourse. The Bourse is particularly well suited to this endeavor because the downstairs market in
Paris is an electronic limit order mechanism very similar to that envisioned by theoreticians, and because
of cross-sectional variation in the "crossing rules" that govern upstairs executions.
1
Theoretical analyses of upstairs trading focus on two issues that are of particular importance to
larger traders: order exposure and trades' information content. Prices are likely to move adversely if the
existence of a large unexecuted order becomes widely know, as other traders may "front run" the order or
simply infer information about future price movements from its presence. A large limit order, in
particular, provides free trading options and risks being "picked off" if market conditions change.
Grossman (1992) argues that the trading preferences of many large investors are not expressed publicly,
and that a role of the upstairs broker is as a repository of information on large investors' hidden or
unexpressed trading interests. Given that some trading interest is not publicly expressed, a large market
order sent to the downstairs market will "walk the book", bypassing unexpressed liquidity and increasing
execution costs. In contrast, an upstairs broker who receives a large customer order can tap the pool of
unexpressed trading interest, while minimizing the degree to which the customer's order is exposed.
A second branch of research on upstairs markets considers the role of upstairs brokers in
certifying trades' information content. Easley and O'Hara (1987) demonstrate that an investor trading on

2
private information regarding security values will prefer to trade larger quantities. Their model implies
that liquidity providers will charge more to complete larger orders. Large traders who transact for
liquidity rather than informational motives therefore have incentives to identify themselves as such.
Seppi (1990) describes mechanisms by which an upstairs broker can distinguish between informed and
uninformed traders. This allows the broker to screen informed traders from the upstairs market, lowering
adverse selection costs for large liquidity traders.
This paper extends our understanding of the role of upstairs markets, focusing in particular on the
Paris Bourse, where the upstairs market competes with an electronic limit order market. The Paris market
is well suited for studying upstairs trading, particularly as compared to the New York Stock Exchange.
Theoretical analyses of upstairs trading typically compare the benefits of a negotiated upstairs market
with a pure auction mechanism in the downstairs market. The NYSE floor is more complex, and may
replicate some benefits of upstairs trading. In particular, NYSE floor brokers can "work" client orders
without fully revealing them. Chakravarty (2001) argues that NYSE specialists and floor brokers can
sometimes deduce the identity of trade initiators, thereby lowering the risk of adverse selection.
2
Further,
the NYSE specialist, being positioned at the center of a trading "crowd" on the exchange floor, has
information on unexpressed trading interests on the floor.
3
While these features likely increase the appeal
of the NYSE trading floor to investors, they interfere with clean tests of upstairs trading models.
Two recent papers, Smith, Turnbull and White (2001) and Booth, Lin, Martikainen, and Tse
(2001) also study upstairs trading when the downstairs market is electronic. The former studies the
Toronto Stock Exchange (TSE) and focuses on the empirical properties of trades routed upstairs, while
the latter studies the Helsinki Stock Exchange, and focuses on issues related to price discovery.
Booth,
Lin, Martikainen, and Tse document that prices are mainly discovered in the downstairs market, while
1
See Biais, Hillion, and Spatt (1995) for description of the Paris limit order market.
2
Benveniste, Marcus and Wilhelm (1992) argue that the long-standing professional relationships between the floor
traders and specialists result in information exchange, which can mitigate adverse selection costs.
3
In addition, Venkataraman (2001) suggests that the trading rules in a floor-based market structure allow large
traders to selectively participate in block trades and better control the risk of order exposure. Hence, large traders are
more likely to express their demands in the downstairs market in a floor-based market structure.

3
upstairs prices consist of the downstairs component plus a transitory factor.
4
Our paper is distinguished from these studies and earlier work partly because the downstairs market
in Paris more closely resembles that envisioned in the theory papers, but mainly because we test a broad
set of hypotheses that the prior papers could or did not.
5
Notably, we present the first empirical evidence
regarding Grossman’s (1992) prediction that the upstairs broker lowers execution cost by tapping into
pools of unexpressed liquidity. Prior empirical work has focused mainly on Seppi’s (1990) prediction
regarding the informational role of the block broker, while the Grossman prediction remained untested
due to the lack of an empirical proxy for expressed liquidity beyond the inside quotes. We are able to use
the unique Weighted Average Spread (WAS) measure provided by the Paris Bourse to measure expressed
liquidity and thereby extend the understanding of the role of block brokers. We also provide the first
empirical test of the Burdett and O’Hara (1987) implication that the extent of downstairs price leakage
prior to an upstairs trade will increase with the number of counterparties contacted and time taken for
facilitation.
Further, we are able to exploit variation in the “crossing rules” that were in effect on the Paris
Bourse during our sample period to present evidence on their relevance. Upstairs trades in most Paris
Bourse stocks must be executed at prices at or within the best bid-offer (BBO) quotes in the downstairs
market at the time of the trade. However, for a subset of liquid stocks (called eligible stocks), the Paris
Bourse allows block trades to be executed at prices away from the BBO. The possibility of allowing
outside-the-quote executions may open the upstairs market in a broader set of circumstances. We
examine the factors that govern when the option to complete trades outside the quotes is used, and the
quality of these executions. An investigation of the effect of different crossing rules is particularly useful
in the wake market decimalization in the United States. The NYSE generally requires upstairs trades to
be executed at prices that match or improve on the downstairs quotes. This requirement has become more
4
This finding might be interpreted as an affirmative answer to a variation of the question posed in the title of this
paper: "Does an Upstairs Market Need an Electronic Stock Exchange?"

4
restrictive in the wake of decimalization, which has substantially tightened bid-ask spreads.
We investigate the popular view that an automated execution system is inherently less expensive
than a trading mechanism with human intermediation. To do so, we implement econometric techniques
that control for self-selection bias in traders’ choice between upstairs and electronic trading, and measure
the inherent cost of completing trades in each market. The results indicate that a randomly selected order
would incur higher execution costs in the upstairs market than in the electronic market. Finally, we
provide a methodological enhancement by defining a block trade on the basis of share price and normal
trading activity, in contrast to the traditional approach of defining a block trade as any trade larger than
10,000 shares, independent of share price or normal trading activity.
We analyze 92,170 block trades in a broad cross-section of 225 Paris stocks. The upstairs market
at the Paris Bourse is an important source of liquidity for large transactions, as almost 67% of the block
trading volume is facilitated upstairs. The option to complete upstairs trades in eligible stocks at prices
outside the quotes is exercised for larger trades, when the downstairs spread is unusually narrow, and
when there is relatively little depth in the limit order book. This suggests that more flexible crossing rules
allow some trades to be completed that otherwise would not.
Overall trading costs for those block trades completed upstairs are lower than for block trades
completed downstairs, despite the fact that selectivity-adjusted estimates indicate higher fixed costs in the
upstairs market. This reflects the strong support in the Paris data for the Seppi (1990) prediction that
upstairs brokers screen on the basis of information content: upstairs trades contain less information than
downstairs trades, despite being larger. This result complements that provided by Smith, Turnbull, and
White (2001) for the Toronto Stock Exchange. We also find strong support for the notion that traders
strategically choose across the upstairs and downstairs markets to minimize expected execution costs.
We find more limited support for the Keim and Madhavan (1996) hypotheses that upstairs trade execution
costs are concave in trade size and positively related to the cost of finding counterparties, and strong
5
Even the electronic market at the TSE differs from a pure auction market, due to the presence of a designated
market maker. The liquid stocks at the Paris Bourse that we study do not have a designated market maker. The Paris

5
support for the Burdett and O’Hara (1987) prediction that buyer-initiated trades are more costly and less
welcome in the upstairs market.
Execution costs for upstairs trades are much lower than would be expected if the trade were
simply executed against the expressed liquidity downstairs, which provides direct evidence if favor of the
Grossman (1992) prediction that upstairs brokers are able to tap into unexpressed trading interest.
However, the finding that the unconditional (selectivity-bias-adjusted) liquidity cost in the upstairs market
exceeds that in the downstairs market supports the popular perception that the upstairs market represents a
trading mechanism that is inherently more expensive than the electronic market.
Some upstairs trades in stocks listed on the Paris Bourse are completed in London rather than
Paris, and are not included in our database. Jacquillat and Gresse (1995) estimated the London market
share of French stocks at 8.4% in 1993, while Demarchi and Foucault (1999) report similar numbers for
1998. As a consequence, our results understate the importance of upstairs trading for Paris-listed stocks.
6
This paper is organized as follows. Section 2 describes market structure at the Paris Bourse and
the testable predictions of theoretical models of upstairs trading, while Section 3 describes the sample.
Section 4 investigates the effect of varying crossing-rules at the Paris Bourse. In Section 5 we present
empirical evidence regarding trading costs in the upstairs and downstairs market. Section 6 presents
evidence on the execution cost of a typical order in both markets, after controlling for selection bias in the
data. Section 7 summarizes results and discusses policy implications for electronic stock exchanges.
market therefore is a closer approximation to the downstairs markets considered in upstairs theory papers
6
Pagano (1997) argues that the reported trading volumes in the London dealer market and the French auction
market are not directly comparable, noting (page 6) “A direct customer trade with a London exchange member
generates a “cascade” of inter-dealer transactions, by which the dealer rebalances his inventories – an effect not
present in an auction market when two customers’ orders are crossed”. Inventory rebalancing trades are likely to be
particularly important for block transactions that leave dealers with large inventory imbalances. In contrast to the
evidence reported by Jacquillat and Gresse (1995) and Demarchi and Foucault (1999), Friederich and Tonks (2001)
report that the London market share of liquid French firms averaged between 40% and 50% during the 1990s.

6
2. Market Structure and Testable Predictions on Block Trading at the Paris Bourse
A. Upstairs Market Structure
This discussion of the upstairs market in Paris is based on conversations with officials of the Paris
Bourse, and the manual titled “The organization and operation of the regulated market operated by SBF-
Paris Bourse,” dated March 30
th
, 1998, which is published by SBF-Paris Bourse. Appendix A provides
more detail as to rules in effect on the Bourse during our sample period.
In a typical Paris upstairs transaction, an institutional investor (block initiator) submits a large
order to a member firm (upstairs broker) with whom the block initiator ordinarily has a long-standing
relationship. The broker generally has discretion to (a) send the order to the downstairs market to execute
against standing limit orders, (b) act as a dealer (i.e., principal) and execute the block against his own
inventory, or (c) act as a broker (i.e., agent), and search for counterparties.
The upstairs broker deals with numerous institutional investors on a daily basis, and typically has
some information on their current holdings and latent trading interest. The block broker contacts potential
counterparties and negotiates the transaction price. The identity of the block initiator is not revealed
during the search process, though counterparties are informed of the block size. All upstairs transactions
are reported immediately to the Paris Bourse, which publishes a majority of the transactions with no
delay. Block trades in which a member firm acts a dealer may be made public with delay to enable the
member firm to reverse its position. It is important to note that, although some principal trades are made
public with a delay, the Base de Donnees de Marche (BDM) database that we use indicates actual trade
times. Upon publication of the transaction by the system the public learns the details of the transaction,
except whether the member firm acted as a dealer or a broker.
B. The Benefits and Costs of Upstairs Trading
Theoretical papers model the benefits and costs of upstairs intermediation. Grossman (1992)
suggests that upstairs brokers have knowledge on the states of nature that are likely to induce customers
to trade. One such state would be the opportunity to trade with a block initiator who wishes to trade for
liquidity rather than information-based reasons. Seppi (1990) focuses on this idea, suggesting that the

7
upstairs broker screens informed traders from the upstairs market.
7
Liquidity providers can therefore
charge a smaller information premium, which lowers the execution cost. Grossman also emphasizes that
potential block traders may prefer to not quantify or publicly reveal their trading interest. The upstairs
broker has information on the unexpressed trading interests of these customers, and accessing this
unexpressed demand increases the effective liquidity of the upstairs market, thus reducing execution costs
to the block initiator.
The insights provided by Seppi and Grossman are related, but distinct. The ability of the upstairs
broker to tap into pools of unexpressed liquidity can reduce the cost of trading for any order, informed or
not, implying that the Grossman reasoning could be empirically supported even if the Seppi hypothesis
were not. However, the hypotheses are not competing, in the sense that they could both be correct, a
conclusion supported by our empirical results.
Though the benefits of trading in the upstairs market could be significant, the search process in
the upstairs market is costly. In Keim and Madhavan (1996), the cost of upstairs facilitation is an
increasing function of the number of counterparties located. In Burdett and O'Hara (1987), a cost of
upstairs trading is information leakage in the downstairs market. In Grossman (1992), a cost of upstairs
trading is the extra volatility (price uncertainty) of trading in a decentralized market. Each block trader
can select the upstairs or downstairs market based on expected costs and benefits.
C. Testable Predictions on Block Trading
The theoretical analyses of block trading provide several testable implications. These are stated
in terms of both trades’ information content; observed empirically as permanent (on average) price
changes around trades, and in terms of the liquidity costs of trading; observed empirically as execution
prices that are inferior (on average) to the post-trade value of the stock.
The liquidity effect, or temporary price impact, of a block trade measures compensation provided
to the counterparties for providing liquidity. Keim and Madhavan (1996) predict the temporary price
7
For example, the broker may require the trader to make a “no bagging” commitment to not trade again for a
specified interval. This commitment is not costly to a liquidity trader who has revealed their full trading program,

8
effect to be an increasing and concave function of trade size. The concavity arises because the block
broker, at the margin, chooses between searching for more counterparties or making a concession on the
block price. This implies that the search function of an upstairs broker is particularly useful for locating
counterparties to large transactions, and for less liquid and more volatile stocks. Grossman (1992)
suggests that the upstairs broker has information on the hidden or unexpressed trading interests of large
investors that allows him to lower execution costs of block transactions upstairs, relative to the expressed
(or displayed) liquidity in the downstairs market.
The prediction that larger (block) orders are more likely to be initiated by informed traders
(Easley and O’Hara (1987)) provides uninformed block traders with incentives to distinguish themselves
from informed traders. Seppi (1990) suggests that the upstairs market improve on the terms of trade
faced by uninformed traders by screening informed traders from the upstairs market. Therefore, the
certification role of the upstairs broker implies that (a) orders routed to the upstairs market have less
likelihood of being initiated by an informed trader, and (b) the incentives to use the upstairs market
increase with order size.
These analyses support the following testable hypotheses:
Hypothesis I: Grossman (1992) predicts that execution cost for an upstairs trade will be lower than
the cost of completing a similar trade against the displayed liquidity in the downstairs market.
Hypothesis II: Proposition 1 in Keim and Madhavan (1996) implies that the absolute temporary effect
is an increasing and strictly concave function of trade size.
Hypothesis III: Proposition 2 in Keim and Madhavan (1996) implies that, for given order size, the
temporary price component is positively related to the cost of locating counterparties and the variance
of the risky asset's return, and the relationship will be stronger for larger order sizes.
Hypothesis IV: Seppi (1990) predicts that the permanent price effects of block trades routed to the
upstairs market will be less than that of similar trades sent to the downstairs market.
Hypothesis V: Proposition 4 of Keim and Madhavan (1996) predicts that the permanent price effects
but can be costly to a strategic informed trader.

9
(price increase for buys and decrease for sells) of upstairs trades will an increasing and concave
function of order size.
Hypothesis VI: The Burdett and O’Hara’s (1987) analysis implies that the extent of downstairs price
leakage will increase with the number of counterparties contacted and time taken for facilitation.
We provide empirical tests of Hypotheses I through VI. In addition, we provide evidence
regarding the importance of variation in crossing rules and on the inherent cost of executing trades in the
upstairs and electronic markets.
3. Sample Selection and the Distribution of Block Trading Volume
A. Sample Selection
As our objective is to investigate the significance of an upstairs market across a broad cross-
section of firms, we focus on firms comprising the SBF-250 Index at the beginning of our April 1997 to
March 1998 sample period. SBF250 represents all sectors of the French economy and includes all
component firms of the CAC40 and SBF-120 indexes. Trade and quote data are obtained from the BDM
database made available by the Paris Bourse.
8
To remain in the sample, a firm must (a) trade in the
continuous (not batch) downstairs auction market, so that downstairs prices are available to calculate
trades’ price effects (deletes 13 firms), (b) trade common equity with voting rights (deletes 5 firms), and
(c) have normal trade and quote data during the sample period (deletes 7 firms)
9
. The remaining 225
stocks are further divided into liquidity quintiles based on the average daily trading volume during the
sample period.
8
We use a series of filters to delete trades and quotes that have a high likelihood of reflecting errors. Trades are
omitted if (a) trade price is non-positive (b) involves a price change (since the prior trade) greater than absolute
value of 25% (c) occurs on a day when change in overnight price is greater than 15% (d) occurs on the day of stock
split. Quotes are deleted if (a) bid or ask is non-positive (b) bid-ask spread is negative (c) change in bid or ask price
is greater than absolute value of 10% (d) bid or ask depth is non-positive.
9
These 7 firms have large quoted depth on only one side of the market for many months, and subsequently delist.
During this period, trades only occur on the deeper side of the market. It is possible that professional market makers
may be providing price support for these stocks before delisting occurs. Inclusion of these firms would bias results.

10
Ideally, analyses of upstairs markets would be conducted using order level data on the entire
trading programs of all institutional investors. In practice, however, publicly available datasets (e.g.,
NYSE’s TAQ, SBF-Paris Bourse’s BDM, TSE’s Order and Trade) have broad coverage, but do not
provide data on the orders that underlie trades or on trading intentions. We follow Madhavan and Cheng
(1997), Smith, Turnbull, and White (2001) and Booth, Lin, Martikainen and Tse (2001) in using trades as
the basic unit of observation.
10
In Paris, a large marketable order to buy (sell) can exhaust the depth on
the inside quote and walk up (down) the limit order book. Such a large order is reported as multiple
trades occurring at the same time in the BDM database. Following Biais, Hillion, and Spatt (1995),
Piwowar (1997), and Venkataraman (2001), we classify these simultaneous trades as one large trade. The
size of the trade is calculated as the size-weighted average of the simultaneously reported trades, and the
transactions price is calculated as the size weighted average of the simultaneous trade prices.
We analyze large transactions that occur during regular market trading hours, for three reasons.
First, the theoretical models of the upstairs market focus on liquidity provision for large orders. Second,
to understand the factors that affect the choice between the two markets, we need to restrict our analysis
to transactions executed when both markets are open. Third, the price effects of block trades can most
readily be measured when the downstairs market is open.
B. Definition of a block trade
The empirical literature typically follows the NYSE definition, and considers a transaction of
greater than 10,000 shares to be a block trade. In our view, however, the definition of a large, or block,
trade should vary depending on share price and typical liquidity in the stock, as measured by average
trading volume and typical quote or limit order depths. Share price variation is particularly relevant for
this study. Figure 1 reports on the distribution of share prices for NYSE (all common stocks) and Paris
(the 225 stocks in this study). On April 1, 1997, the average stock price at the Paris Bourse is FF800 (or
10
A notable exception is Keim and Madhavan (1996), who use a non-public dataset obtained from Dimensional
Fund Advisors (DFA) that includes orders. However, their dataset reflects orders by only a single institutional
trader, who specializes in small-capitalization stocks. It is difficult to know the extent to which analyses based on
proprietary datasets that reflect a small slice of overall trading can be generalized beyond the specific sample.

11
U.S. $142), compared to $41 on the NYSE. Also, stock prices are more widely dispersed at the Paris
Bourse than the NYSE.
11
Since traders are likely to be concerned about the dollar (or franc) size of the
transaction, it is reasonable to suggest that the block size in shares at the Paris Bourse should be smaller
than the NYSE on average, and should vary across stocks.
The Paris Bourse defines a “normal block size” (NBS) for those stocks that are eligible for special
block trading rules, including 80 stocks in our sample. We use the Bourse definition of NBS for these 80
stocks. We also compute a normal block size (NBS) for the remaining sample stocks, using a method
similar to the Bourse, as follows. First, for firm “i”, we calculate the average market price, average daily
trading volume in the downstairs market, and the average depth on the inside quotes in the limit order
book for month “m”. We define block size as NBS
i,m
= MAX [NBS
1
, NBS
2
, NBS
3
], where NBS
1
= 7.5 *
(average depth of the inside quotes in the limit order book), NBS
2
= 2.5 % of average daily downstairs
trading volume, and NBS
3
= FF 500,000 / average price. The NBS for a calendar quarter is the average
value of NBS
i,m
for the preceding quarter.
12
We define as block transactions those with size greater than or equal to the computed NBS of the
firm. In our view, researchers who study block trading in diverse international markets will be better
served by defining a stock-specific block size measure along the lines of the one used here, as opposed to
using a uniform definition such as 10,000 shares. In the present sample, the average block size is 1.45
million French francs, or about $290,000. Computed block sizes vary substantially across liquidity
quintiles, from an average 0.5 million francs for the least liquid to 4.3 million francs for the most liquid.
C. Descriptive Statistic on Paris Block Trading
Table 1 presents sample summary statistics. Sample firms are classified into liquidity quintiles. The
average stock price and market capitalization of the sample on April 1, 1997, is FF 799 and FF 13,544
11
See Angel (1997) for additional description of diverse stock price distributions across world markets.
12
As a check, we compare computed measures of NBS with the block sizes provided by the Paris Bourse for the 80
sample stocks that are eligible for special block trading rules, and find a correlation of 0.86. The Bourse ensures that
any change in trading activity is permanent before announcing a change in block size. In the same spirit, we
minimize the effect of temporary abnormal trading activity by identifying stocks where the absolute change in NBS
from one quarter to the next is greater than 100% (14 observations). If the change is due to a stock split, then we

12
million respectively. Average market capitalization increases monotonically from FF 1,614 million for
the least liquid quintile to FF 48,670 million for the most liquid quintile.
The sample includes 92,170 block trades. Of these, 31,088 (33.7%) were facilitated in the upstairs
market. The average size of a block trade in the upstairs market is FF 11.5 million, compared to FF 2.9
million for block trades in the downstairs market. The substantial difference between mean and median
trade sizes indicates that some trades in both markets are very large. As expected, the number of trades,
the average trade size, and trading volume tend to increase across liquidity quintiles.
The upstairs market at the Paris Bourse is a significant source of liquidity for large transactions,
with almost 67% of cumulative block trading volume facilitated upstairs. By comparison, Hasbrouck,
Sofianos and Sosebee (1993) report that 27% of block volume in all NYSE-listed stocks is facilitated
upstairs, while Madhavan and Cheng (1997) find that 20% of the block volume in the DJIA index stocks
is facilitated in the upstairs market. The greater percentage of block volume facilitated upstairs at the
Paris Bourse as compared to the NYSE is consistent with the conjecture that the upstairs market will play
a more significant role at an electronic stock exchange than when the downstairs market includes a
trading floor.
13
Results in Panel A of Table 2 indicate that large trades are more likely to be facilitated in the
upstairs market. Here, we classify block trades as small if (NBS
≤trade size< 2*NBS), medium if
(2*NBS
≤trades size< 5*NBS), and large if (trade size ≥ 5*NBS). For small block trades, only 20% of
the trades and cumulative trading volume is facilitated in the upstairs market. However, for large block
trades, almost 80% of the trades and 87% of cumulative block volume is facilitated upstairs. Finding that
large trades are more likely to be routed upstairs in Paris is broadly consistent with the results reported by
change the NBS on the day on which the split is effective (3 occasions). If the increase in NBS is due to abnormal
trading behavior in a single month, then we retain the NBS from the previous quarter (8 occasions).
13
In a result not reported in the Tables, we find blocks are bought and sold with similar frequency in Paris. This
finding contrasts with results for the U.S. market, (e.g., Kraus and Stoll (1972), Chan and Lakonishok (1995)) where
blocks are sold with a higher frequency.

13
Smith, Turnbull, and White (2001) for the Toronto Stock Exchange.
14
Results in Panel B of Table 2 indicate that firms with less liquidity in the downstairs market have
a higher level of upstairs participation. In this analysis, trades are first classified into trade size (in FF)
quintiles. We calculate the upstairs participation rate for each firm, and report the median upstairs
participation rate by size quintile. Results indicate that within a trade size quintile, the upstairs
participation rate increases for less liquid firms. For example, in trade size quintile 3, the upstairs
participation rate increases from 19.9% for firms in the most liquid quintile to 57.1% for firms in the least
liquid quintile.
4. Crossing Rules and Execution Costs
We next evaluate the effect of variation in crossing rules on execution costs. An exchange’s
crossing (or interaction) rules stipulate the allowable price range for upstairs trades, and whether
downstairs orders that offer superior prices for smaller quantities will be allowed to participate in the
transaction. At the NYSE, for example, upstairs trades must typically be completed at prices at or within
the downstairs BBO, and downstairs participants are allowed to take a portion of the block.
15
At the TSE,
upstairs trades need to be executed at or within the best bid-offer (BBO) quotes in the downstairs market
at the time the order is received by the upstairs broker. As Smith, Turnbull and White (2001) note, this
obligation leads upstairs market makers in Toronto to submit most orders immediately to the downstairs
markets.
While the same crossing rules apply to all stocks at the NYSE and TSE, the crossing rules in
effect at the Paris Bourse during our sample period varied depending on liquidity. For the majority of
14
Although the key result is similar, we view our finding as more robust. Smith, Turnbull and White use a logit
regression on all trades in all firms. By limiting our analysis to block transactions, we ensure that internalization of
small orders by member firms do not affect our results. Also, we calculate upstairs participation rates for trade size
categories within a firm. This approach controls for other firm characteristics that could be correlated with trade
size.
15
NYSE rule 127 does allow for blocks to be completed at prices outside the downstairs BBO after "exploring
crowd interest". However, this process is costly, and Hasbrouck, Sofianos, and Sosebee (1993) report that less than
one half of one percent of NYSE share volume occurs under Rule 127. Madhavan and Cheng (1997) note that

14
stocks listed on the Paris Bourse, upstairs trades need to be completed at or within the BBO quotes in the
downstairs market at the time of the trade.
16
However, for a subset of liquid stocks (called eligible
stocks), the Paris Bourse allowed block trades to be executed at prices away from the BBO at the time of
the trade. However, trades in eligible stocks must still be completed within the "weighted average
spread" computed by the Paris Bourse, as discussed below. Appendix A provides more detail regarding
crossing rules on the Paris Bourse. We exploit the existence of variation in crossing rules to present
evidence on their relevance.
Panel A in Table 3 reports locations of transaction prices for upstairs trades relative to the bid-ask
quotes at the time of the cross. For each firm, we calculate the percentage of buyer- and seller-initiated
trades that are executed: (a) outside the relevant quote, (b) at the quote, and (c) between the quote and the
midpoint. For eligible firms (N=80) and non-eligible firms (N=145) in our sample, Panel A reports the
median percentage of trades executed and the median trade size, in each location category. Also reported
is the average quoted depth, inside spread, the average total execution cost, and, for eligible firms, the
weighted average spread in the downstairs market at the time of the trade. The execution cost measure
reported compares the block transaction price with the quote mid-point at the time of the trade, and is
similar to the effective spread measure in the literature (e.g., Huang and Stoll (1996)). The weighted
average bid (ask) is computed by the Bourse for eligible stocks, and gives the weighted average price of
executing a market sell (buy) order of order size equal to the NBS against the limit order book. Hence, it
takes depth away from the inside quotes into account and is an empirical measure of the displayed block
liquidity in the book.
17
For eligible firms, about 10% of upstairs trades occur outside the quotes, and these trades pay
NYSE crossing rules provide incentives for upstairs NYSE participants to complete the negotiated transaction as a
“clean cross” on a regional stock exchange rather than the NYSE floor.
16
The Bourse does allow an exception for very large blocks (called structural blocks), which can be executed at
prices away from the quotes, provided the trade size exceeds an amount as determined by an SBF-Paris Bourse
Instruction.
17
The Bourse allows for hidden limit orders, which are not displayed in the book, but are executable against market
orders (see Harris (1996) for details). As a consequence, the downstairs market allows traders to access committed
but unexpressed liquidity. In contrast, the role of the upstairs broker is to access uncommitted and unexpressed
liquidity.

15
execution costs that are about 40 to 50 basis points higher than for upstairs trades executed at or within
the quotes.
18
However, trades completed outside the quotes are larger than average, and occur when
downstairs spreads and depths are unusually small. For example, buyer-initiated trades completed above
the ask price occur when the downstairs spread is 0.13% and the quoted depth is 11% of the NBS,
compared to a spread of 0.27% and depth that is 16% of NBS when buyer initiated trades are completed
below the ask price. These statistics are consistent with the reasoning that those block trades completed
outside the quotes would not otherwise have been completed at all.
Panel B of Table 3 presents additional information on liquidity in the limit order book around the
time upstairs trades are crossed. For all stocks and across all trade sizes, quoted spreads are wider at the
time of the trade than 30 minutes before the trade. This result is consistent with the reasoning expressed
by Biais, Hillion, and Spatt (1995) that block traders respond to crossing rule constraints by submitting
market orders that clear out limit orders and widen the downstairs spread, so that they can then cross
upstairs trades at desired price. Note, though, that the increase in spreads at the time of the trade is larger
(about fifteen basis points on average) for non-eligible firms than for eligible firms (about four basis
points on average). This result is consistent with the reasoning that more flexible crossing rules reduce
incentives to manipulate downstairs spreads.
A key result that can be observed on Panel B of Table 3 is that average execution costs for
upstairs trades in eligible stocks, including those in the large block category, are significantly lower than
the weighted average spreads at the time of the trade. Recall that the weighted average spread is
calculated as the cost that would be incurred if a trade equal to the normal block size were to execute
against displayed liquidity in the limit order book. The block trades we examine are larger than the
normal block size by definition. Hence the weighted average spread is a downward biased measure of the
cost that would have been incurred if the block trade had been executed against the publicly displayed
liquidity. Observing that actual upstairs execution costs are close to the quoted spreads and significantly
18
Only a miniscule proportion of upstairs trades in non-eligible firms are executed away from the inside
quotes.

16
less than the weighted average spread therefore provides direct support for the Grossman (1992)
prediction (Hypothesis I) that block facilitators are able to tap into pools of unexpressed liquidity to
provide better upstairs executions relative to the displayed liquidity in the downstairs market.
The point estimates reported on Table 3 indicate that the effect on trading costs of being able to
tap into unexpressed liquidity is large. Actual execution costs in the upstairs market are on average only
about a third as large as weighted average spreads. More specifically, trading costs average 21 (23) basis
points for buyer (seller) initiated trades, compared to weighted average spreads of 73 (85) basis points at
the time of buyer (seller) initiated trades.
We next turn to an analysis of the decision to execute a trade in an eligible stock outside the
quotes. We consider all 23,634 upstairs trades in eligible stocks. For these trades, we estimate a pooled
time-series cross-sectional probit model with firm-specific indicator variables. The dependent variable
equals one if the trade is completed outside the quote and zero otherwise. Explanatory variables include:
the quoted spread at the time of the trade, trade size relative to the NBS, a buy order dummy, a first hour
of trade dummy, a last hour of trade dummy, and a measure of the imbalance in the downstairs market,
defined as in Handa, Schwartz, and Tiwari (1998) as Imb
t
= (weighted average quote on the same side –
quote midpoint)/weighted average spread. The imbalance variable takes a value closer to zero (one) when
there is more (less) downstairs trading interest on the side of the initiating order.
Block initiators are likely to be more receptive to executions outside the quotes when downstairs
liquidity is lacking, implying a positive coefficient estimate on the imbalance measure and a negative
coefficient on the spread width. Larger trades and buy orders are generally more difficult to facilitate, so
we also anticipate a positive coefficients on these variables. If traders wait to observe market conditions
after the open we anticipate a negative coefficient on the first hour of trading indicator. Finally, if traders
place a premium on completing the transaction before the market close we anticipate a positive
coefficient on the last hour of trading indicator.

17
Results of estimating the probit model are reported below (the a superscript indicates statistical
significance at the .01 level):
Each coefficient estimate is of the anticipated sign, with the exception of the last hour indicator,
and all are statistically significant except the buy order dummy. Market participants are more likely to
agree to having a block trade executed at a price outside the quotes when the inside spread is narrow,
when there is relatively little liquidity in the downstairs book on the side of the initiated trade, for large
trades, and for buy orders. They are less likely to complete block trades outside the quotes during the first
and last hours of trading. This last result may reflect the possibility of trading during after-hours crossing
sessions. On balance, these results are consistent with market participants agreeing to outside the quote
executions for more difficult trades completed during more difficult market conditions, and with the
notion that these trades might not have been completed at all in the absence of the option to take the price
outside the quotes.
As noted above, the NYSE effectively requires all upstairs trades to be completed at prices at or
within the best downstairs quotes. The recent (January 2001) reduction in the NYSE tick size to one cent
has narrowed the inside bid-ask spread and reduced the depth of the NYSE quotes (see, for example,
Bessembinder (2001)). In short, decimalization has made the requirement to complete upstairs-facilitated
trades at or within the quotes more restrictive. Our analysis of cross-sectional variation in crossing rules
suggests that market quality could be improved by allowing upstairs initiators to agree to prices outside
the quotes. Consistent with this view, the Euronext market (which was created by the September 2000
Probit Analysis of the Decision to Execute Away from the Inside Quotes
Dependent Variable = 1 if the upstairs trade is executed away from the inside quotes, and 0 otherwise
-1.452
a
-1.233
a
0.841
a
0.007
a
0.014
-0.453
a
-0.145
a
Order
Buy Order
Trade Size/
NBS
First Hour
Last Hour
spread
Imbalance
Dummy
Dummy
Dummy
Constant
Bid-ask

18
merger of the Paris, Brussels, and Amsterdam stock markets) now allows block trades in all stocks to be
executed outside the quotes.
19
5. Trading costs in the upstairs and downstairs markets
We next present evidence on trading costs for a broad cross-section of stocks in the broker
facilitated upstairs and electronic downstairs markets at the Paris Bourse. Comparisons of upstairs and
downstairs trading costs have been presented for narrow cross-sections of stocks in prior papers. These
include Madhavan and Cheng (1997), who focus on the 30 liquid DJIA index firms and Booth, Lin,
Martikainen, and Tse (2001), who study only the 20 most active Helsinki stocks. Smith, Turnbull, and
White (2001) analyze all firms listed on the TSE, but do not differentiate based on firm’s liquidity.
A. Empirical measures of price effects
Kraus and Stoll (1972) first delineated measures of temporary and permanent price changes
around a block trade, and their interpretation as liquidity costs and informational effects, respectively.
20
Figure 2 provides a graphical representation of the price effects of a block buy order. The temporary
component (
τ(Q)) represents compensation to liquidity providers (i.e., counterparties), and can be
measured by the price reversal after the block trade:
τ(Q) = ln(P
b
) - ln(P
1
), where P
b
is the block trade
price and P
1
is a measure post-trade value.
21
The permanent component (P(Q)) can be divided into post-trade impact and pre-trade leakage.
The post-trade impact (
π(Q)) represents the change in the market's perception of a security's value after
the announcement of the block trade:
π(Q) = ln(P
1
) - ln(P
0
), where P
0
is the pre-trade value of the security,
19
See section 4403/2B of “Harmonized Market Rules, Book I”, which is available at
www.euronext.com
.
20
Some empirical studies in microstructure, such as Huang and Stoll (1996) and Bessembinder and Kaufman
(1997), have defined the permanent and temporary components of trades as price impact and realized spreads,
respectively.
21
We examine the sensitivity of results to four different proxies for P
1:
(a) the mid-point of the first quote reported
30 minutes after the trade, (b) first quote mid-point reported after 12:00 noon the next trading day, (c) mid-point of
the closing quotes the next trading day, and (d) mid-point of the closing quote on the 3
rd
trading day after the trade.
Since some principal trades are reported with delays of up to a day, results based on measures (c) and (d) are
arguably more valid. In actuality, the empirical results are similar across all four measures, and we only report
results obtained while using the mid-point of the closing quotes on the next trading day.

19
proxied by the last quote midpoint before the announcement of the block trade. The leakage effect (L(Q))
represents price movements in the downstairs market while the block is being facilitated (or “shopped”)
in the upstairs market; L(Q) = ln(P
0
) - ln(P
d
), where P
d
is the security value when the upstairs broker
initiates the search process.
22,
23
The total execution cost (T(Q)) to the block initiator is the sum of the
liquidity and information effects, i.e., T(Q) = P(Q) +
τ(Q) = ln(P
b
) - ln(P
d
). All measures are expected to
be positive for a block buy and negative for a block sell. We adjust each measure for overall market
movements by subtracting the SBF120 index's market return from the stock's return.
B. Price effects in the upstairs and downstairs market
Table 4 presents execution costs measures for seller- and buyer-initiated block trades. Our
discussion focuses on results obtained when using quotes three days prior as the pre-trade benchmark.
Results using the one-day prior benchmark are similar. For seller-initiated trades (Panel A), the average
execution cost is 59.4 basis points (bp) in the upstairs market and 73.7 bp in the downstairs market.
Separating total trading costs into permanent and temporary price effects reveals that the information
content of an upstairs trade is significantly lower than that of a downstairs trade, in each liquidity quintile.
On average, a seller-initiated trade permanently lowers prices by 11 bp in the upstairs market and 57 bp in
the downstairs market. However, compensation to counterparties (measured by the temporary price
effect) is larger in the upstairs market (48.4 bp) than in the downstairs market (16.7 bp). In both markets,
average trading costs are lower for stocks with higher liquidity.
For a buyer-initiated trade (Panel B), the benefit of facilitating a trade in the upstairs market is
significantly larger. Average execution costs are 65.9 bp in the upstairs market compared to 119.2 bp in
the downstairs market. Execution costs in the upstairs market are lower by at least 50 bp in each liquidity
quintile, except quintile 4. The cost advantage in the upstairs market for buy orders again originates from
22
We consider three proxies for P
d
: (a) the mid-point of the quotes 30 minutes before the trade, (b) the mid-point of
the closing quotes the day before the block trade (t
-1
), and (c) the mid-point of the closing quotes three days before
the block trade. We report results using (b) and (c). Demarchi and Thomas (1996) survey the member firms at the
Paris Bourse and find that most block orders are facilitated within a day.

20
a lower adverse selection component. The permanent price effect is significantly lower in the upstairs
market (64.2 bp) relative to the downstairs market (156.8 bp), and this finding holds across liquidity
quintiles.
24
To summarize, a block trade initiator incurs lower trading costs in the upstairs market than in the
downstairs market. This result holds across most liquidity quintiles, and the execution cost advantage of
the upstairs market is significantly larger for a buyer-initiated trade.
25
An analysis of the components of
execution cost provides strong support of the certification role of the upstairs broker (Seppi (1990). While
trades in both markets contain information, the adverse selection component of execution cost is
significantly lower in the upstairs market relative to the downstairs market. Liquidity-motivated traders
are able to use the services of an upstairs broker to obtain lower trading costs. In addition, counterparties
may also prefer to provide liquidity in the upstairs market, as the lower risk of adverse selection provides
greater compensation to them even while providing lower execution costs to block initiators.
The results obtained here concerning the lower information content of upstairs block trades can
be contrasted with those of Madhavan and Cheng (1997). Their results indicate only slightly lower
information content for upstairs NYSE trades, and in some subsamples their results indicate larger
information content for upstairs trades. The lack of strong support for the certification hypothesis in
NYSE data, contrasted with the strong support in the Paris data presented here and in the TSE data
analyzed by Smith, Turnbull, and White (2001), support the contention that theories of upstairs trading
can best be tested when the downstairs market is an electronic stock exchange.
C. Regression analysis of the price effects
We next analyze the systematic determinants of variation in the price impacts of block trades.
23
Although the measure L(Q) has traditionally (e.g. Keim and Madhavan (1996) been interpreted as measuring pre-
trade information leakage, an alternate perspective is that L(Q) could be positive because traders following
momentum strategies will buy after price increases, and vice versa.
24
Counterparties to upstairs block buys receive insignificant compensation for their services, while counterparties to
block buys in the downstairs market lose money on average (-37.6 bp), as the stock price tends to increase after a
block buy. The possibility that counterparties take losses on block transactions is addressed by Burdett and O’Hara
(1987). They note that the counterparty might be an active risk averse investor with a desire to transact, who would
prefer the certainty of a small loss to the uncertain cost of demanding liquidity in the market.

21
Hypotheses II and V, which are due to Kiem and Madhavan (1996), concern relations between permanent
and temporary price impacts, respectively, and trade size. In their model, tradeoffs between search costs
and price concessions depend on the probability of locating a counterparty. Since this probability is likely
to differ across firms, we test these hypotheses using time series data. The following regression is
estimated for each firm, and we report the mean and median values of regression coefficients across the
sample of firms:
Model 1:
|Y(Q)| =
β
0
+
β
1
* Q +
β
2
* Q
2
+
β
3
* I +
ε; for each stock
(1)
where Q is the trade size normalized by the NBS, I is a dummy variable which equals 1 for a buyer-
initiated trade, and 0 otherwise, and |Y(Q)| is equal to |
τ(Q)| for results reported on Panel A of Table 5,
and |P(Q)| in Panel B of Table 5. The Keim and Madhavan analysis predicts
β
1
> 0 and
β
2
< 0. This
analysis is restricted to a sub-sample of 132 firms that have at least 30 upstairs trades during the sample
period.
Results in Panel A of Table 5 provide weak evidence of a concave relationship between
temporary price effect of upstairs trades and trade size, as implied by Hypothesis II. The coefficients are
of the predicted sign i.e., positive on the trade size variable and negative on the squared trade size
variable. However, the coefficient on the squared trade size variable is statistically insignificant. The
coefficient on the buy/sell dummy variable indicates that counterparties earn lower compensation for
participating in buyer-initiated trades.
Results in Panel B of Table 5 provide little support for the notion of a positive concave
relationship between absolute permanent price effect of upstairs trades and trade size (Hypothesis V). The
coefficients on trade size and squared trade size are statistically insignificant. These results are, however,
consistent with the Seppi (1990) conjecture that larger order size does not increase the likelihood that the
trade is informed, given that the non-anonymous trade initiator has signaled the trade to be uninformed.
Finally, consistent with Burdett and O’Hara (1987), buyer-initiated trades in the upstairs market contain
more information than seller-initiated trades.

22
Table 6 presents the results of testing Hypotheses III and VI, which concern relations between the
temporary and leakage price effects of upstairs trades and firm characteristics such as stock volatility and
liquidity. Conditional on trade size, the cost of locating counterparties is likely to be higher for firms with
less liquidity. Hence, these hypotheses have testable implications across a cross-section of firms, after
controlling for the effect of trade size. Keim and Madhavan (1996) suggest that short sale constraints and
the difficulty in locating traders with large holdings of a particular asset will result in larger temporary
price effects for block buys. To test these hypotheses, we first classify trades into quintiles based on their
size in francs. Next, for each trade size quintile, we calculate the average temporary and leakage price
effect for each stock, and estimate the following cross-sectional regression:
Model 2:
|Y
i
| =
β
0
+
β
1
* Liquidity
i
+
β
2
* Volatility
i
+
β
3
* I +
ε
i
,
(2)
Where |Y
i
| is the average temporary price effect in Panel A and the leakage price effect in Panel B for
block trades in stock “i”, volatility is the variance of the daily quote-midpoint stock returns, liquidity is
measured as the stock mean of (price * NBS / 1,000,000), and I is a dummy variable which equals 1 for a
buyer-initiated trade, and is 0 otherwise.
Consistent with Hypothesis III, we find evidence of an inverse relationship between temporary
price effects and firm liquidity (Panel A of Table 6). However, we find the relationship to be statistically
significant in the larger trade size quintiles only. These results support the Keim and Madhavan (1996)
prediction that the upstairs broker will be forced to provide larger price concessions while filling larger
orders in illiquid stocks. Also, counterparties earn lower compensation for participating in buyer-initiated
trades. Results in Panel B of Table 6 provide weak evidence of a relationship between leakage effects
and firm characteristics such as liquidity and volatility, as implied by Hypothesis VI. The coefficient
estimate on liquidity is of the predicted sign for all size quintiles except the third, but is statistically
significant only for quintile two. As predicted by Burdett and O’Hara (1987) leakage effects prior to
upstairs trades are larger for buyer-initiated than for seller-initiated trades.

23
6. Transaction costs and self-selection of trading venue
The preceding sections of this paper reported on execution costs for those trades routed to the
upstairs and downstairs markets. Since trade initiators presumably select the market they expect to
provide the lowest cost execution for their trade, the observed execution cost measures must be
interpreted as conditional on self-selection of venue. In this section we present an analysis of
unconditional execution costs, i.e. costs for orders selected at random, to measure the inherent cost of
completing trades in the upstairs market and in the electronic limit order market. This analysis allows us
to investigate the validity of the perception that execution costs will be lower in an electronic market, and
to validate empirically the intuition that traders do strategically select the market to route their order.
To do so, we implement econometric techniques to control for self-selection bias. The technique to
correct for self-selection of trading venue involves two stages (refer to Maddala (1983) for a general
discussion, and Madhavan and Cheng (1997) for a similar implementation that uses data from the NYSE
trading floor). In the first stage, the block initiator's choice process is modeled as a structured Probit. In
the second stage, the expected liquidity effects of random orders in each market are estimated after
correcting for the selection bias.
A. Determinants of the Choice of the Trading Venue
The block initiator is anticipated to route his order to the market with the lowest expected
execution cost. This will depend in part on liquidity in the limit order book. As empirical proxies for
liquidity we use the bid-ask spread and a measure of order imbalance (as defined in Section 4). Other
variables that likely affect the choice of the trading venue are the block size (normalized by the NBS),
return volatility, and the (inverse) stock price. A dummy variable that denotes buyer-initiated trades is
also included.
The choice of the market to complete the block order is modeled as a structured probit, where the
dependent variable is an indicator variable that equals 1 for an upstairs trade and 0 for a downstairs trade.
We expect that a block initiator will more likely route his order to the upstairs market for larger order

24
sizes, during periods of wider downstairs spreads, during larger order imbalances, and when volatility is
lower. If buyer-initiated trades are more likely to be initiated by an informed trader, as implied by Burdett
and O’hara (1984) and Saar (2001), then the probability of an upstairs execution will be lower for a
buyer-initiated trade.
To control for firm-specific effects and allow valid inference, we estimate the first-stage probit
and the second-stage regressions simultaneously, using maximum likelihood estimation (MLE), on a
firm-by-firm basis. This approach differs from Madhavan and Cheng (1997), who perform the analysis
after pooling all trades in the DJIA firms. Panel A of Table 7 reports median coefficient estimates from
the Probit model for the 115 firms with more than 30 block trades where the MLE routine converged. All
average coefficient estimates are of the predicted sign and are statistically significant. The likelihood of
routing a trade to the upstairs market is higher: (a) during periods of wider spreads, larger order
imbalance, and lower volatility, (b) for larger orders, and (c) for a seller-initiated trade.
B. The Endogenous Switching Regression Model
Trading costs in the two markets can be modeled as:
E [
τ
i
u
| U
i
= 1 ] =
β
u
* X
i
+
σ
u
* [
φ (γ*Z
i
) /
Φ (γ*Z
i
) ]
(3)
E [
τ
i
d
| U
i
= 0] =
β
d
* X
i
+
σ
d
* [ -
φ (γ*Z
i
) / (1 -
Φ (γ*Z
i
)) ]
(4)
where
φ (.) denotes the standard normal density function, Φ (.) denotes the cumulative standard normal
distribution, Z’s represent explanatory variables affecting choice of venue,
γ’s represent coefficient
estimates from the probit model, and X’s represent the variables affecting expected liquidity costs. If
traders strategically select their execution market, then liquidity costs conditional on selection of a market
will be lower than the unconditional liquidity costs. That is, we expect
σ
u
<0 and
σ
d
>0.
Since theory suggests that order size affects execution costs in both markets, we include order
size (Q
i
) (normalized by the NBS) as an explanatory variable. The asymmetric effects of buyer versus
seller-initiated orders are again captured by an indicator variable that equals one for buyer-initiated trades.
Also, we include the product of the buyer-initiated indicator variable and order size to allow for

25
differences in marginal effects of order size across buyer- and seller-initiated trades. The slope
coefficients in (3) and (4) estimate the marginal effects of characteristics of random orders in each
market.
The results of the regression analysis are presented in Panel B of Table 7. The dependent variable
is the liquidity effect,
τ(Q), in basis points. As predicted by theory, the estimate of σ
u
is significantly
negative while the estimate of
σ
d
is significantly positive, empirically confirming that traders strategically
select the market that provides lower execution costs.
The intercept term in the upstairs market regression is statistically and economically significant
(34.5 basis points), and the difference between the intercepts in the upstairs and downstairs market is
positive. This result is consistent with the reasoning that the upstairs market has a higher fixed cost,
reflecting the need for screening, search, and negotiation. Somewhat surprisingly, the marginal effect of
order size on execution costs is not statistically significant in either market. In the upstairs market this
likely reflects that trader reputation, rather than order size, is the determinant of execution costs.
The parameter estimates from Table 7 can be used to estimate the difference in expected liquidity
effects orders in the upstairs and downstairs market as:
E [Y
i
u
- Y
i
d
] = (
β
u
-
β
d
) * X
i
(5)
We evaluate (5) based on an order with average characteristics for each firm. In Panel C of Table 7 we
report cross-sectional median estimates indicating that, for a random seller (buyer) initiated order,
liquidity costs are lower in the downstairs markets by 41 (64) basis points. Estimates of this cost
differential are little altered when we evaluate (5) for larger or smaller trade sizes, because coefficient
estimates on trade size are close to zero.
This analysis confirms that traders self-select to the market that will provide the better execution
cost for their trades, and indicates that the liquidity cost of executing a typical block order is lower in the
downstairs market than in the upstairs market. This provides support for those who argue that an
electronic trading process is inherently less expensive than a trading process with human intervention.

26
Glosten (1994), for example, argues that the electronic limit order book is “inevitable”, unless alternative
market structures can provide tangible benefits to overcome their greater costs. Based on the estimates
obtained here, the Paris upstairs market is a viable alternative for those traders who gain at least 41 (64)
basis points by reacting strategically to time variation in relative liquidity across the upstairs and
downstairs markets, or by credibly signaling that their sell (buy) orders do not reflect private information.
7. Conclusions and Discussion
This paper investigates the role of an upstairs market operating in parallel with an electronic stock
exchange, using data on 92,170 block trades completed at the Paris Bourse. The answer to the question
posed in the title of this paper is clearly "yes". Despite the inherently lower costs of the electronic
downstairs market, the upstairs market is efficient for many large traders. Previous work in the literature
has attributed the efficiencies to the certification role of upstairs brokers as described by Seppi (1990).
While our analysis confirms the importance of block broker certification, we also provide strong
empirical evidence in support of Grossman’s (1992) hypothesis that upstairs brokers are able to tap pools
of unexpressed liquidity, which also attributes to upstairs efficiencies.
We argue that Paris provides an excellent setting to test the implications of upstairs
intermediation models, because its electronic limit order market closely resembles the downstairs markets
envisioned by theorists. We find strong support for the predictions that: (1) upstairs brokers lower the
risk of adverse selection by certifying block orders as uninformed, (2) upstairs brokers are able to tap into
pools of "hidden" or "unexpressed" liquidity, (3) traders strategically choose across the upstairs and
downstairs markets to minimize expected execution costs, (4) trades are more likely to be routed upstairs
if they are large, or are in stocks with less overall trading activity, and (5) buyer-initiated trades are less
welcome and pay higher costs in the upstairs markets. We find weaker empirical support for the
predictions that (1) permanent and temporary price effects of upstairs block trades are concave in order
size, (2) temporary price effects are greater for trades in less-liquid stocks, and (3) pre-trade leakage is
greater for buyer-initiated upstairs trades and trades in less liquid stocks.

27
We investigate the effect of variations in crossing rules at the Paris Bourse on execution costs.
For the subset of stocks with less restrictive crossing rules (eligible stocks), we find that market
participants agree to outside-the-quote execution mainly for more difficult trades and at times when
downstairs liquidity is lacking. These outside the quote executions likely represent trades that could
likely not have been otherwise completed, suggesting that market quality can be enhanced by allowing
participants more flexibility to execute blocks at prices outside the quotes. We also find evidence
suggesting that more flexible crossing rules reduce incentives to manipulate the downstairs spread that
otherwise constrain upstairs prices. Consistent with this reasoning, the Euronext market has recently
adopted rules that allow large block trades in all Paris stocks to be executed outside the quotes. These
findings are particularly relevant to U.S. markets since quoted spreads and depths have decreased
substantially in the wake of decimalization.
Overall execution costs for Paris block trades completed in the upstairs market are lower than for
those completed in the downstairs market, a result that holds across firms with different liquidity
characteristics. However, results of estimating a self-selection econometric model indicates higher costs
for the upstairs market for randomly selected trades. This supports the common perception that electronic
trading is inherently less expensive than a trading process with human intermediation. The estimates
indicate that intermediated upstairs trading is an efficient choice only for those who can obtain significant
cost savings by responding to time variation in the relative liquidity of the upstairs and downstairs
markets, or by signaling that their trades are not information motivated.
If the upstairs market offers significant advantages to certain types of block traders, then there are
important implications for the design of the next generation of electronic stock markets. The upstairs
market in Paris completes two thirds of block trading volume, compared to 20% on the NYSE. A likely
explanation is that the NYSE floor allows large traders to execute customized strategies through a floor
broker, while avoiding the risks of order exposure. If orders submitted to electronic markets do not allow
block initiators to limit order exposure and trade strategically, then order flow is likely to migrate to
alternative trading venues such as the upstairs market.

28
If an objective of a stock exchange is to consolidate order flow in a centralized market, then the
next generation of electronic trading systems should include more features to meet the needs of large
traders. For example, if investors have difficulty in managing order exposure in an electronic exchange,
then a wider range of order types that include state contingent exposure and execution algorithms can be
made available. In short, to avoid losing orders to competing venues, the electronic exchanges need to
allow a greater degree of strategic interaction among orders, to replicate some benefits of trading floors
and upstairs markets.

29
REFERENCES
Angel, J., 1997. Tick size, share price, and stock splits. The Journal of Finance 52, 655-681.
Benveniste, L.M., Marcus, A.J., Wilhelm, W.J., 1992. What's special about the specialist? Journal of
Financial Economics 32, 61-86.
Bessembinder, H., 2001. "Trade execution costs and market quality after decimalization", working paper,
University of Utah.
Bessembinder, H., Kaufman, H., 1997. A comparison of trade execution costs for NYSE and NASDAQ-
listed stocks. Journal of Financial and Quantitative Analysis 32, 287-310.
Biais, B, P. Hillion, and Spatt, C. 1995. An empirical analysis of the limit order book and the order flow
in the Paris Bourse. Journal of Finance 50, 1655-1689.
Booth, G., J. Lin, T., Martikainen, and Tse, Y., 2001, Trading and Pricing in Upstairs and Downstairs
Stock Markets, forthcoming, Review of Financial Studies.
Burdett, K., O'Hara, M., 1987. Building blocks: An introduction to block trading. Journal of Banking and
Finance 11, 193-212.
Chakravarty, S., 2001. Stealth trading: Which traders’ trades move stock prices? Journal of Financial
Economics 61, 289-307.
Chan, L., Lakonishok, J., 1995. The behavior of stock prices around institutional trades. Journal of
Finance 50, 1147-1174.
Demarchi, M., Thomas, S., 1996, French Institutional investors: Investment process, trading practices,
and expectations. SBF – Bourse de Paris.
Demarchi, M., Foucault, T., 1999. Equity trading systems in Europe: A survey of recent changes.
Unpublished working paper. SBF-Bourse de Paris and HEC.
Easley, D., O'Hara, M., 1987. Price, trade size and information in securities markets. Journal of Financial
Economics 21, 123-142.
Friederich, S., Tonks, I., 2001. Competition between European equity markets: Evidence from dually
traded French stocks. Unpublished working paper. Financial Market Group, London School of
Economics, Universite de Paris and University of Bristol.
Glosten, L., 1994, “Is the electronic open limit order book inevitable”? Journal of Finance, 49, 1127-
1161.
Grossman, S., 1992, The informational role of upstairs and downstairs markets. Journal of Business 65,
509-529.
Handa, P., Schwartz, R., Tiwari, A., 1998. The economic value of the Amex trading floor. Unpublished
working paper, University of Iowa.

30
Harris, L. E., 1996. Does a large minimum price variation encourage order exposure? NYSE Working
Paper 96-05.
Hasbrouck, J., Sofianos, G., Sosebee, D., 1993. New York stock exchange systems and trading
procedures. NYSE working paper 93-01.
Huang, R, Stoll, H., 1996. Dealer versus auction markets: A paired comparison of execution costs on
NASDAQ and NYSE. Journal of Financial Economics 41, 313-357
Jacquillat, B., Greese, C., 1995. The diversion of order flow on French shares from the CAC market to the
SEAQ International: An exercise in transaction accounting. Unpublished working paper, Universitė
Paris Dauphine.
Keim, D ., Madhavan, A., 1996. The upstairs market for large block transactions: Analysis and
measurement of price effects. Review of Financial Studies 9, 1-36.
Kraus, A., Stoll, H., 1972. Price impacts of block trading on the New York Stock Exchange. Journal of
Finance 27, 569-588.
Lee, C., Ready, M., 1991. Inferring trade directions from intraday data. The Journal of Finance 46, 733-
746.
Madhavan, A., Cheng, M., 1997. In search of liquidity: Block trades in the upstairs and downstairs
market. Review of Financial Studies 10, 175-203.
Maddala, G. 1983, Limited Dependent and Qualitative Variables in Econometrics, Cambridge University
Press.
Pagano, M., 1997. The changing microstructure of European Equity markets. The European Securities
Markets: The Investment Services Directive and Beyond, edited by Guido Ferrarini, Kluwar Law
International, 1998.
Piwowar, M., 1997, Intermarket order flow and liquidity: A cross-sectional and time-series analysis of
cross-listed securities on U.S. stock exchanges and Paris Bourse. Working paper. The Pennsylvania
State University.
Saar, G., 2001, Price Impact Symmetry of Block Trades: An Institutional Trading Explanation, Review of
Financial Studies, 14, 1153-1181.
Seppi, D., 1990. Equilibrium block trading and asymmetric information. Journal of Finance 45, 73-94.
Seppi, D., 1992. Block trading and information revelation around quarterly earnings announcements.
Review of Financial Studies 5, 281-305.
Smith, B. F., Turnbull, A.S., White, R.W., 2001. Upstairs markets for principal and agency trades:
Analysis of adverse information and price effects, Journal of Finance, 56, 1723-1746.
Venkataraman, K., 2001. Automation versus Floor Trading: An analysis of execution costs on the Paris
and New York exchanges. Journal of Finance, 56, 1445-1885.

31
Appendix A: Trading Rules at the Paris Bourse
The trading rules described below were in effect in Paris during our sample period and are outlined
in the manual titled “The organization and operation of the regulated market operated by SBF-Paris
Bourse,” dated March 30
th
, 1998, which is published by SBF-Paris Bourse. We also held extensive
discussions with exchange officials for additional clarifications on the trading rules and the BDM dataset.
A.1. Crossing Rules
During our sample period, the Paris Bourse had two distinct sets of rules for block trading. Upstairs
trades in most Paris Bourse stocks must be executed at prices at or within the best bid-offer (BBO) quotes
in the downstairs market at the time of the trade (Article N.4.1.17 and N.4.2.6). However, the Paris
Bourse classified certain stocks as being eligible for the special rules of block trading (Article N.4.2.8).
For these eligible stocks, the Bourse specified a standard block size (NBS) and continuously disseminated
the weighted average spread (WAS). The weighted average bid (ask) gives the weighted average price of
executing a market sell (buy) order of order size equal to the NBS against displayed liquidity in the limit
order book.
An upstairs trade in an eligible stock with size greater than the NBS can be executed at prices at or
within the WAS (Article N.4.2.9, N.4.2.10, and N.4.2.13). During our sample period, upstairs trades in
the non-eligible stocks cannot trade through the book.
A.2. Reporting Rules
An upstairs trade could involve a member firm as a dealer (principal) or broker (cross-trade). All
upstairs trades have to be reported immediately to the Paris Bourse (Article N.4.2.15). Cross-trades and
ordinary principal trades are published with no delay (Article N.4.2.17). Principal block trades that are
less than five times the NBS are published at the end of a two-hour period commenced upon notification.
Structural block trades that are at least five times larger than the standard block size are published at the
opening of the next trading session.
The BDM dataset provides the time at which an upstairs trade is reported to the exchange, and not
the time at which an upstairs trade is publicly published. While the data set does not distinguish between
principal and cross-trades, the exchange officials told us that the majority of upstairs trades are cross-
trades and are published with no delay. However, to account for delayed reporting, we use the mid-point
of closing quotes on the next trading day to calculate our measures of trades' permanent and temporary
price impacts.
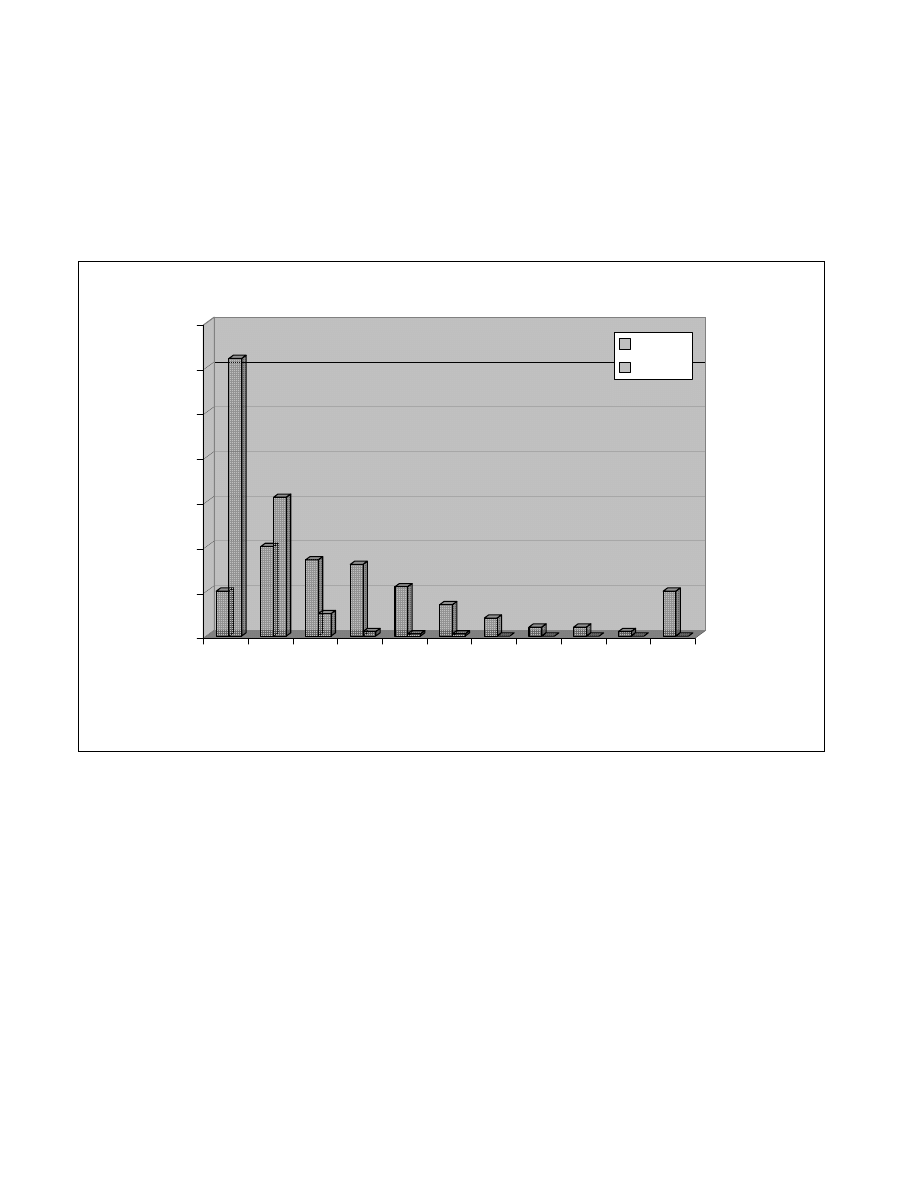
32
Figure 1: Distribution of Stock Prices in the NYSE and the Paris Bourse
The figure presents the graphical distribution of the share prices for all common stocks at the NYSE and
the 225 sample stocks at the Paris Bourse on April 1, 1997.
0
10
20
30
40
50
60
70
Pe
rcent
age
< 30
60
-
90
12
0 -
1
5
0
18
0 -
2
1
0
24
0 -
2
7
0
> 300
Price (in $)
Stock Prices in the NYSE and Paris Bourse
PARIS
NYSE
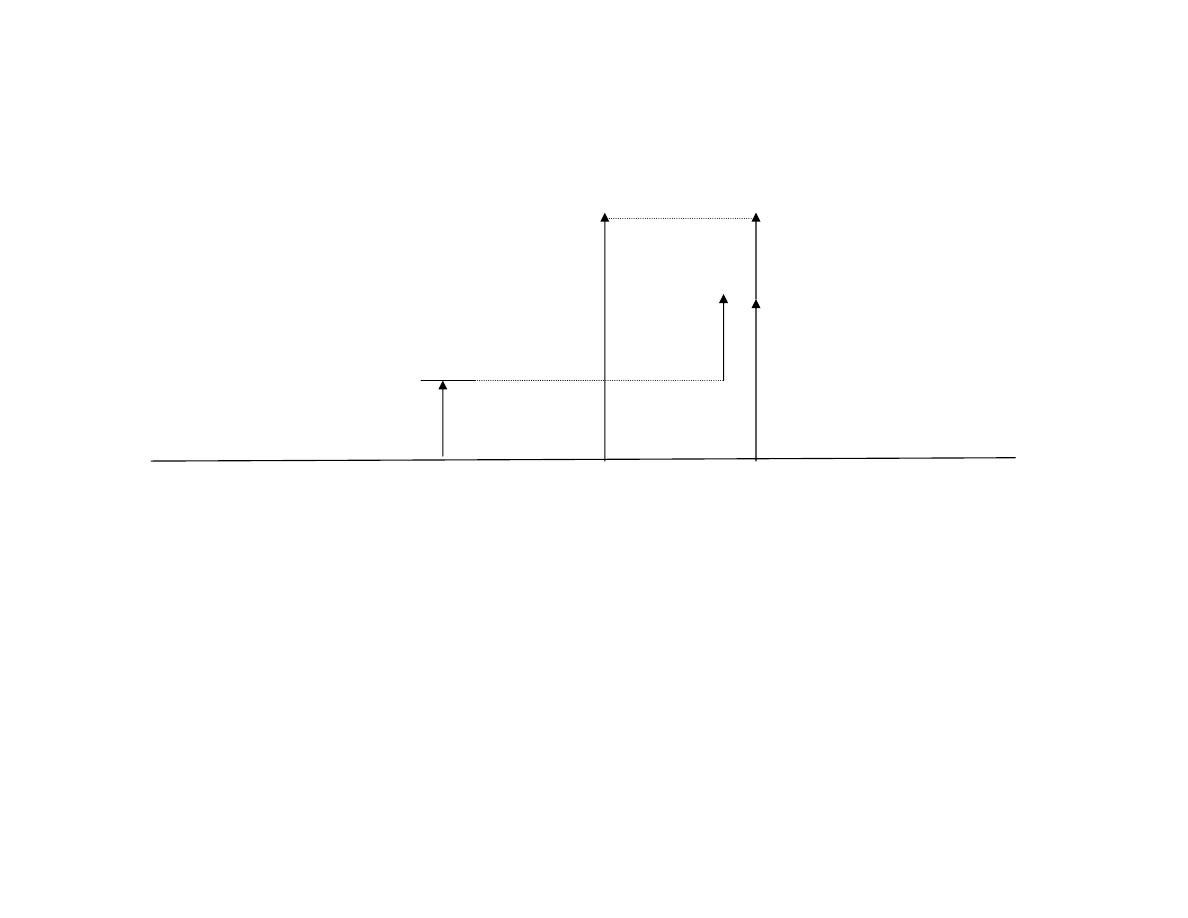
33
P
b
P
1
____
P
0
P
d
t
d
t
0
t
b
t
1
Figure 2: Liquidity and information effects of a block buy
The figure provides a graphical representation of the expected price effects of a block buy. The facilitation process is initiated at
time=t
d
in the upstairs market. The leakage of information of the block size may move the security value in the downstairs
market. The security value just before the block trade (time=t
0
) is P
0
. The block of size=Q is executed in the upstairs market at
(time=t
b
) at price=P
b
. The liquidity effect of the block results in a price reversal and moves prices to P
1
.
• Temporary component of price change τ(Q): ln(P
b
) - ln(P
1
)
• Post-trade impact π(Q): ln(P
1
) - ln(P
0
)
• Leakage effect L(Q): ln(P
0
) - ln(P
d
)
• Permanent component of price change P(Q): ln(P
1
) - ln(P
d
)
•
Total execution cost of the block trade T(Q): ln(P
b
) - ln(P
d
)
Total
execution
cost of
the Block
Trade
Leakage Effects
Post
Trade
Impact
Temporary Component
of Price Change
Permanent Component
of Price Change

34
Table 1: Sample Summary Statistics and the Distribution of Block Trading Volume
The Paris Bourse sample consists of the component firms of the SBF-250 Index that trade common stock in the continuous auction market on
April 1, 1997. The sample period is from April 1997 to March 1998 and the data source is the BDM-database. The firms are classified into
quintiles based on their liquidity, which is measured by average (Price * NBS) during the sample period, where NBS is a proxy for the block size
of each firm. Only block trades executed during regular market hours are included in the analysis. Reported are the average market price and
market capitalization of the sample of firms on April 1, 1997. For upstairs and downstairs block trades, the table reports the total number of trades,
the mean and median trade size, the cumulative trading volume and the percentage of the trades and cumulative trading volume executed in the
upstairs market during the entire sample period.
Stock
Market
Price
Size
N
%age
Mean
Median
(in FF
(%age of all
( in FF)
(in FF ml)
million)
volume)
Full Sample
799
13,554
Downstairs
61,082
2,871,875
1,835,000
175,420
Upstairs
31,088
33.7%
11,491,550
5,047,500
357,249
67.1%
Most Liquid
800
48,670
Downstairs
26,342
4,414,975
3,055,000
116,300
Upstairs
20,323
43.6%
14,709,025
7,452,000
298,931
72.0%
Quintile 4
1,184
8,903
Downstairs
17,741
2,063,000
1,487,500
36,600
Upstairs
5,617
24.0%
6,036,575
2,542,500
33,907
48.1%
Quintile 3
1,016
5,334
Downstairs
11,680
1,401,825
988,575
16,373
Upstairs
2,967
20.3%
5,436,975
1,800,000
16,132
49.6%
Quintile 2
604
3,252
Downstairs
3,795
1,192,025
856,350
4,524
Upstairs
1,453
27.7%
3,921,725
1,542,000
5,698
55.7%
Least Liquid
391
1,614
Downstairs
1,524
1,065,700
734,200
1,624
Upstairs
728
32.3%
3,544,550
1,269,450
2,580
61.4%
Cumulative Volume
Number of trades
Trade size (in FF)
35
Table 2: Firm Liquidity, Trade Size and Upstairs Participation Rates
The table presents the average upstairs market participation rate for 225 firms at the Paris Bourse for the period April 1997 to March 1998. The
firms are classified into quintiles based on their liquidity, which is measured by average (Price * NBS) during the sample period, where NBS is a
proxy for the block size for the firm, and is unique for each firm. In Panel A, trades are classified as (a) small if (NBS
≤Trade size<2*NBS) (b)
medium if (2*NBS
≤Trade size<5*NBS) (c) large if (trade size≥5*NBS). Reported are the median percentage of trades and cumulative trading
volume executed in the upstairs market in trade size categories. In Panel B, trades are also classified into trade size (in FF) quintiles, producing a
5X5 classification. Reported is the median percentage of trades executed in the upstairs market, for each classification.
Panel A: Trade Size and Upstairs Participation Rates
Number of trades
Trade size
Small
Medium
Large
Small
Medium
Large
Full Sample
18.5%
42.6%
80.0%
19.7%
45.2%
87.3%
Most Liquid
30.7%
66.3%
90.9%
35.2%
70.9%
96.2%
Quintile 4
13.7%
35.0%
72.4%
14.5%
37.3%
77.3%
Quintile 3
15.9%
35.8%
69.4%
16.8%
37.5%
80.1%
Quintile 2
14.9%
40.0%
80.0%
16.3%
37.8%
86.7%
Least Liquid
21.9%
52.4%
88.9%
25.5%
53.0%
90.0%
Cumulative trading volume
Panel B: Firm Liquidity and Upstairs Participation Rates
Liquidity
Overall
Small
2
3
4
Large
Quintiles
Most Liquid
41.7%
0.0%
13.1%
19.9%
34.4%
74.4%
Quintile 4
22.2%
9.8%
14.5%
27.3%
47.7%
77.7%
Quintile 3
28.1%
11.9%
24.7%
37.1%
61.5%
86.8%
Quintile 2
32.2%
15.6%
32.0%
50.0%
75.0%
100.0%
Least Liquid
38.6%
26.3%
50.0%
57.1%
100.0%
100.0%
Trade Size (FF) Quintiles

36
Table 3: Crossing Rules and Execution Costs
Panel A reports the locations of transaction prices for upstairs trades relative to the bid-ask quotes at the time of the cross for eligible and non-
eligible stocks. The Paris Bourse allows block trades in eligible stocks to be executed at prices away from the BBO at the time of the trade. For
both firm-types, reported are the cross-sectional median percentage of trades executed and the median trade size, in each location category. For a
buyer (seller) initiated trade, location categories are (a) above (below) the ask (bid) price, (b) at the ask (bid) price and (c) between the ask (bid)
price and quote-midpoint. For eligible firms, the average quoted spreads (%), quoted depth, and weighted average spread at the time of the upstairs
trade, and execution cost (%) are also reported. Panel B reports the trade size, quoted spreads (%), quoted depth, weighted average spreads (%)
and execution cost (%) of upstairs trades in eligible and non-eligible stocks, by trade size category. Trades are classified as (a) small if
(NBS
≤Trade size<2*NBS) (b) medium if (2*NBS≤Trade size<5*NBS) (c) large if (trade size≥5*NBS), where NBS is a proxy for the block size
of the firm and is unique for each firm.
Panel A: Location of the upstairs transaction relative to the quotes
Percentage Quoted Quoted Weighted
Execution Trade Size
Percentage
Trade Size
of Trades Spread Depth
Average
Cost
/NMS
of Trades
/NMS
Executed
(%)
/NMS Spread (%) Upstairs (%)
Executed
Seller-initiated trades
Below the bid price
9.3%
0.141
0.121
0.721
0.690
5.4
0.0%
21.6
At the bid price
51.8%
0.175
0.170
0.621
0.175
3.5
42.3%
4.1
Above the Bid
40.2%
0.263
0.154
0.766
0.113
3.5
57.1%
3.9
Buyer-initiated trades
Above the ask price
10.4%
0.125
0.107
0.624
0.582
3.9
0.0%
170.7
At the ask price
53.5%
0.177
0.181
0.586
0.177
3.5
42.9%
3.4
Below the Ask
35.0%
0.269
0.159
0.745
0.117
3.6
58.3%
3.8
Cross-sectional Medians of Firm-Specific Means are reported
ELIGIBLE FIRMS (N=80)
N = 23,637 trades
NON ELIGIBLE FIRMS (N=145)
N = 4,474 trades
37
Table 3 (continued)
Panel B: Liquidity in the downstairs market during an upstairs transaction
Trade size
Weighted
Execution
/ NMS
At the time 30 min before
At the time 30 min before
Average
Cost
of the trade
the trade
of the trade
the trade
Spreads (%)
Upstairs (%)
I. Eligible firms
Seller-initiated trades
Small block trade
1.3
0.236
0.190
0.305
0.351
1.158
0.213
Medium block trade
2.9
0.229
0.185
0.699
0.521
0.776
0.211
Large block trade
15.5
0.232
0.199
1.397
1.331
0.729
0.341
Overall
4.9
0.232
0.191
0.819
0.753
0.851
0.230
Buyer-initiated trades
Small block trade
1.3
0.216
0.177
0.219
0.220
0.723
0.191
Medium block trade
2.9
0.224
0.192
0.228
0.238
0.738
0.204
Large block trade
17.2
0.233
0.187
0.375
0.291
0.742
0.267
Overall
5.2
0.225
0.185
0.247
0.236
0.732
0.214
II. Non eligible firms
Seller-initiated trades
Small block trade
1.4
0.613
0.519
0.194
0.161
0.375
Medium block trade
3.1
0.620
0.500
0.174
0.157
0.402
Large block trade
23.7
0.728
0.538
0.201
0.170
0.572
Overall
7.9
0.679
0.536
0.187
0.157
0.474
Buyer-initiated trades
Small block trade
1.4
0.660
0.469
0.157
0.137
0.398
Medium block trade
3.0
0.693
0.525
0.158
0.132
0.370
Large block trade
16.7
0.661
0.554
0.161
0.123
0.425
Overall
7.4
0.681
0.519
0.158
0.132
0.436
Quoted Spreads (%)
Quoted Depth / NMS

38
Table 4: Price Effects of Seller-initiated and Buyer-initiated Block Trades
The table presents the average components of price effects of seller- and buyer-initiated trades in the upstairs and the downstairs market for 225
firms at the Paris Bourse for the period April 1997 to March 1998. All price effects are adjusted for market movements in the SBF120 index. The
adjustment is made by subtracting the relevant market index return from the stock's return. The trades are classified into market buys and sells
using the Lee and Ready (1991) algorithm. The firms are classified into quintiles based on their liquidity, which is measured by average (Price *
NBS) during the sample period, where NBS is a proxy for the block size of each firm. The price effects are stated in percentage basis points.
Panel A: Price Effects of Seller-Initiated Block Trades
Overall
Downstairs
-26.9
b
-5.3
-30.1
a
-57.0
-16.7
a
-52.1
a
-73.7
a
Upstairs
-20.6
b
-3.7
9.6
-11.0
-48.4
a
-42.5
a
-59.4
a
Most Liquid
Downstairs
-36.1
c
-22.9
b
1.1
-35.0
b
-21.1
a
-42.9
a
-56.1
a
Upstairs
1.6
-7.3
c
0.8
2.4
-21.2
a
-27.7
b
-18.8
c
Quintile 4
Downstairs
-6.4
-7.6
-22.1
b
-28.5
b
-14.7
c
-44.4
a
-43.2
a
Upstairs
-5.2
7.3
-6.2
-11.4
-21.6
b
-20.5
c
-33.0
b
Quintile 3
Downstairs
-43.5
b
0.0
-36.8
a
-80.3
a
-9.2
-46.0
a
-89.5
a
Upstairs
-53.8
a
-9.2
14.4
-39.4
a
-56.5
a
-51.3
a
-95.9
a
Quintile 2
Downstairs
-13.2
13.0
-33.6
b
-46.8
b
-24.7
c
-45.3
a
-71.5
a
Upstairs
0.0
0.0
31.5
b
31.5
b
-84.5
a
-53.0
a
-53.0
a
Least Liquid Downstairs
-36.0
-8.2
-63.3
a
-99.3
a
-14.5
-86.0
a
-113.8
a
Upstairs
-47.5
-9.4
9.4
-38.1
c
-62.3
c
-62.3
a
-100.4
a
Panel B: Price Effects of Buyer-Initiated Block Trades
Overall
Downstairs
70.4
a
41.2
a
86.4
a
156.8
a
-37.6
a
90.0
a
119.2
a
Upstairs
30.3
a
20.1
a
33.9
a
64.2
a
1.7
55.7
a
65.9
a
Most Liquid
Downstairs
83.6
a
51.7
a
44.9
a
128.5
a
-24.6
a
72.0
a
103.9
a
Upstairs
33.0
a
16.5
a
1.7
34.7
b
17.8
a
36.0
a
52.5
a
Quintile 4
Downstairs
61.1
b
37.5
a
68.5
a
129.6
a
-30.0
a
76.0
a
99.6
a
Upstairs
48.4
a
29.6
a
19.9
b
68.3
a
16.7
66.2
a
85.0
a
Quintile 3
Downstairs
54.1
b
41.8
a
72.7
a
126.8
a
-24.1
b
90.4
a
102.7
a
Upstairs
33.4
b
27.8
a
27.7
b
61.1
a
3.4
58.9
a
64.5
a
Quintile 2
Downstairs
107.9
b
54.4
a
92.9
a
200.8
a
-29.5
b
117.8
a
171.3
a
Upstairs
15.6
20.7
38.7
b
54.3
a
5.7
65.1
a
60.0
a
Least Liquid Downstairs
42.6
18.2
163.2
a
205.8
a
-85.8
a
95.6
a
120.0
a
Upstairs
19.4
4.3
88.4
a
107.8
a
-39.9
52.8
a
67.9
a
a signifies: p-value < 0.01; b signifies: 0.01 £ p-value < 0.05; c signifies: 0.05 £ p-value < 0.10
Total Trading
Cost (PE
-3
)
Effect (P
-3,+1
)
Temporary
Effect (T
+1
)
Total Trading
Cost (PE
-1
)
Leakage Price
Effect (L
-3
)
Leakage Price
Effect (L
-1
)
Post Trade
Impact (P
+1
)
Permanent

39
Table 5: Regression Analysis of Price Effects in the Upstairs Market and Trade Size
The table presents mean and median values of the coefficients from a regression of temporary and permanent price effects in the upstairs market
on trade size. The regression coefficients are computed for the 132 firms at the Paris Bourse that have at least 30 upstairs trades for the period
April 1997 to March 1998. All price effects are adjusted for market movements in the SBF120 index. The price effects are stated in percentage
basis points. The trades are classified into market buys and sells using the Lee and Ready (1991) algorithm. The following regression test
proposition 1 and 4 in Keim and Madhavan (1996).
Panel A: |
τ(Q)| = β
0
+
β
1
* Q +
β
2
* Q
2
+
β
3
* I +
ε ; for each stock
where |
τ(Q)| = Absolute value of temporary price effect (after correcting for market drift)
Panel B: |P(Q)| =
β
0
+
β
1
* Q +
β
2
* Q
2
+
β
3
* I +
ε ; for each stock
where |P(Q)| = Absolute value of permanent price effect (after correcting for market drift)
and Q = Trade Size/(NBS*100), I = 1 for a block buy, and I = 0 for a block sell
Reported is the p-value of the mean and the p-value of the rank statistic under the null hypothesis that the population median coefficient is zero.
Also reported is the median adjusted R
2
for the regression models.
N = 132 FIRMS
Intercept
Size/NBS
(Size/NBS)
2
Dummy
Median Adj R
2
Panel A: Temporary Price Effects and Trade Size
Mean
0.221
5.842
-22.566
-0.342
0.014
p-value
(0.000)
(0.010)
(0.184)
(0.000)
Median
0.256
1.379
-0.241
-0.221
p-value (sign test)
(0.000)
(0.029)
(0.258)
(0.002)
Panel B: Permanent Price Effect and Trade Size
Mean
0.177
-1.198
-16.56
0.416
0.02
p-value
(0.136)
(0.768)
(0.582)
(0.013)
Median
0.167
-1.269
0.649
0.453
p-value (sign test)
(0.045)
(0.139)
(0.258)
(0.018)

40
Table 6: Regression Analysis of Price Effects in the Upstairs Market and Firm Characteristics
Reported are coefficients from a regression of temporary and leakage price effect measures in the upstairs market on firm characteristics such as
stock volatility and liquidity. Trades are classified into quintiles based on their trade size (in FF), and regression coefficients are reported for each
quintile. All price effects are adjusted for market movements in the SBF120 index. The adjustment is made by subtracting the relevant market
index return from the stock's return. The price effects are stated in percentage basis points. For each firm, daily volatility is the variance of returns
using the closing quote midpoints, while liquidity is proxied by the NBS of the firm (divided by 1,000,000). The dummy coefficient equals 1 for a
buy order, and 0 otherwise. Trades are classified into buys and sells using the Lee and Ready (1991) algorithm. The p-values are reported in
parenthesis.
Panel A: Temporary Price Impact and Firm Characteristics
Panel B: Leakage Price Impact and Firm Characteristics
Trade Size
Intercept
Daily
Liquidity
Buy Order Adj R
2
Intercept
Daily
Liquidity
Buy Order
Adj R
2
Quintiles
Volatility (Price * NBS) Dummy
Volatility (Price * NBS) Dummy
Large Trades
0.3852
2.1494
-0.0276
-0.1392
0.0073
0.0643
37.9554
-0.0061
0.1132
0.0012
(0.00)
(0.90)
(0.00)
(0.00)
(0.40)
(0.15)
(0.53)
(0.00)
Quintile 4
0.3186
5.1197
-0.0196
-0.0401
0.0006
0.1632
38.158
-0.0147
0.1282
0.0015
(0.00)
(0.76)
(0.05)
(0.15)
(0.04)
(0.15)
(0.35)
(0.00)
Quintile 3
0.2967
13.3174
-0.0411
-0.0265
0.0006
0.1761
34.6636
0.0159
0.1456
0.0017
(0.00)
(0.50)
(0.03)
(0.35)
(0.05)
(0.25)
(0.59)
(0.00)
Quintile 2
0.1946
-8.8544
-0.034
-0.065
0.0005
0.5463
28.5205
-0.1581
0.1793
0.0031
(0.00)
(0.56)
(0.40)
(0.04)
(0.00)
(0.23)
(0.01)
(0.00)
Small Trades
0.1704
-4.588
-0.0018
-0.2176
0.0075
0.3826
-0.6777
-0.0687
0.0556
-0.0003
(0.04)
(0.87)
(0.98)
(0.00)
(0.00)
(0.98)
(0.57)
(0.28)

41
Table 7: Liquidity Effects of a Random Trade After Controlling for Selection Bias
Panel A presents the results of the probit model estimating the likelihood of executing an order in the upstairs market. The dependent variable is a
dummy variable that equals 1 for an upstairs trade, and 0 otherwise. The explanatory variables are liquidity characteristics such as bid-ask spread
and order imbalance at the time of order execution and order characteristics such as size of the order and whether it is a buyer or seller-initiated.
The trades are classified into market buys and sells using the Lee and Ready (1991) algorithm. Panel B presents the coefficient estimates of the
endogenous switching regression model of the liquidity effects of block trades. The following models are estimated simultaneously using a
maximum likelihood estimator approach
E [Y
i
u
| U
i
= 1 ] =
β
u
* X
i
+
σ
u
* [
φ (γ*Z
i
) /
Φ (γ*Z
i
) ]; and
E [Y
i
d
| U
i
= 0 ] =
β
d
* X
i
+
σ
d
* [ -
φ (γ*Z
i
) / (1 -
Φ (γ*Z
i
)) ] ;
where X
i,t
= (1, Q
i,t
/NBS
i
, DMKTORD
t
, DMKTORD*Q
i,t
/NBS
i
). Q
t
is order size, NBS
i
is the normal block size of the security, DMKTORD equals
1 for a buyer-initiated trade and 0 otherwise, and
γ*Z
I
denotes the estimated value of the continuous response variable based on the structural
probit estimates. Panel C presents the liquidity effects of a random buyer and seller initiated trade in both markets.
Panel A: Probit Analysis of the Choice of the Trading Venue
-0.743
0.488
a
0.395
a
-0.199
a
0.281
a
-1021.51
a
-24.43
Panel B: Selectivity Adjusted Analysis of Liquidity Effect in Both Markets
Temporary Price Effect
Upstairs Market
34.59
a
-0.07
-1.68
-1.49
-15.28
c
Downstairs Market
0.65
0.84
-25.69
a
-0.09
37.20
b
Upstairs - Downstairs
31.56
a
-2.19
27.28
0.04
-47.84
b
Panel C: Execution Cost of a Random Order (in basis points)
Temporary Price Effect
Upstairs - Downstairs
41.27
b
63.63
a
a signifies: p-value < 0.01; b signifies: 0.01 £ p-value < 0.05; c signifies: 0.05 £ p-value < 0.10
Constant
Bid-ask
Order
Buy Order
Price
spread
Imbalance
NBS
(Hourly) (Inverse)
Order Size/
Volatility
Covariance
(Sigma)
Constant
Order Size/
NBS (Q)
* Q
Buy Order Buy Order
Sell Order
Buy Order
Wyszukiwarka
Podobne podstrony:
Modeling and Control of an Electric Arc Furnace
21 269 287 Effect of Niobium and Vanadium as an Alloying Elements in Tool Steels
A stock exchange
Emergency Survival Safety Preparations Food And Water In An Emergency
Comprehending conventional and novel metaphors An ERP study
Poisonous and Edible Mushrooms An Introduction to Mushrooms in Norway (2012)
butswana stock exchange rules 1996
Chris Travers The Serpent and the Eagle An Introduction to the Runic Tradition
Hamao And Hasbrouck Securities Trading In The Absence Of Dealers Trades, And Quotes On The Tokyo St
London Stock Exchange ppt
London Stock Exchange doc
Magic, Witchcraft and the Otherworld An Anthropology by Susan Greenwood
Exchange Rules For The Frankfurt Stock Exchange
Eleswarapu And Venkataraman The Impact Of Legal And Political Institutions On Equity Trading Costs A
Eleswarapu, Thompson And Venkataraman The Impact Of Regulation Fair Disclosure Trading Costs And Inf
Frino, Mcinish And Toner The Liquidity Of Automated Exchanges New Evidence From German Bund Futures
Global Windpower 2004 America and The World Energy Electricity Challenges 2004
więcej podobnych podstron