Securities Trading in the
Absence of Dealers:
Trades, and Quotes on the
Tokyo Stock Exchange
Yasushi Hamao
Columbia University
Joel Hasbrouck
New York University
This article investigates the behavior of intra-
day trades and quotes for individual stocks on
the Tokyo Stock Exchange (TSE). We examine the
transaction and quote record for three firms for
the first 3 months of 1990. Our findings suggest
that the immediacy available (at least for small
trades) in the market is high, despite the re-
liance on public limit orders to supply liquidity.
When orders that would otherwise walk through
the limit order book are converted into limit or-
ders, execution is delayed; but some orders exe-
cute (at least in part) at more favorable prices.
We thank the Tokyo Stock Exchange for providing the data, Hiroshi Naka-
mura, Masao Takamori, and Hidekazu Tominaga of the Exchange for many
useful conversations regarding the trading system, and Meng Tan for re-
search assistance. We also thank James Angel, Thomas George, Bruce
Lehmann, Francis Longstaff, Ananth Madhavan, Mark Ready, Richard Roll,
William Sharpe, an anonymous referee, and Chester Spatt (the editor) for
helpful discussions and comments. Previous versions of this paper have
been presented at the American Finance Association Meetings in Boston,
Columbia-NYU joint workshop, University of California at Los Angeles,
Dartmouth College, Federal Reserve Bank of Atlanta Financial Markets Con-
ference, Federal Reserve Bank of New York, Hitotsubashi University, Japan
Association for Financial Economics, Korea Securities
McGill University, Ohio State University, Stanford University, Seoul Na-
tional University, State University of New York at Buffalo, University of
Tokyo, University of Western Ontario, University of Wisconsin
and the Western Finance Association Meetings in Whistler. Yasushi Hamao
gratefully acknowledges support from Batterymarch Fellowship and Mit-
subishi Trust and Banking Professorship at Columbia University. Part of
this research was completed while Joel Hasbrouck was a visiting research
economist at the New York Stock Exchange. The comments and opinions
contained in this paper are those of the authors only. In particular, the views
expressed here do not necessarily reflect those of the directors, members,
or officers of the New York Stock Exchange, Inc. Address correspondence
to Joel Hasbrouck, Suite 9-190. Stern School of Business, New York Uni-
versity, 44 West Fourth St., New York, NY 10012.
The Review of Financial Studies Fall 1995 Vol. 8, No. 3, pp. 849-878
© 1995 The Review of Financial Studies 0893-9454/95/$1.50
While the initial surge in empirical analyses of market structure cen-
tered on U.S. markets in general and the New York Stock Exchange
(NYSE) in particular, interest is now shifting toward markets with more
diverse structural features. This article analyzes the behavior of intra-
day trades and quotes on the Tokyo Stock Exchange (TSE). One of
the largest exchanges in the world, the TSE certainly possesses size
sufficient to warrant interest. It is also characterized, however, by a
number of distinctive institutional features.
Most importantly, the trading mechanism at the TSE does not rely
on designated dealers or market makers. All liquidity is supplied by
traders who submit limited price orders. Furthermore, by custom and
convention, members refrain from placing proprietary limit orders on
both sides of the market (although they can represent customers on
both sides of the market). This effectively prevents a group of traders
that would naturally gravitate toward functioning as de facto dealers
from doing so.
1
In most markets, dealers are responsible for maintain-
ing quotes and liquidity. By examining the TSE, this study seeks to
determine the extent to which this function is met by public traders.
The central role of the limit order book also characterizes open limit
order book systems: the Toronto CATS system and the CAC system
used for high-volume stocks on the Paris Bourse. The latter is dis-
cussed by Biais, Hillion, and Spatt (1994).
The TSE is also distinctive in its implementation of market order
procedures and price limits. These may cause a delayed adjustment
of quotes, effectively closing one or both sides of the market for brief
periods, and may also introduce delays for orders that involve price
changes. In contrast with the continuity rules of the NYSE, however,
there is no requirement that actual trades occur at the intermediate
prices to bridge the gap. This study seeks to determine the extent
to which the price continuity rules are binding and characterize the
delays.
A number of articles have dealt with various aspects of the TSE:
Amihud and Mendelson (1989, 1991, 1993), George and Hwang (1994),
Hamao (1992), Kato (1990), Lindsey and Schaede (1992), and Takagi
(1993). Lehmann and Modest (1994) examine, as does the present ar-
ticle, the intraday behavior of trades and quotes. Their study provides
a detailed cross-sectional view of return and liquidity characteristics
based on a comprehensive sample of TSE firms. Our article attempts
l
The prohibition against members acting as dealers is not a formal exchange rule. Instead it
appears to derive from a members' committee directive that restricts members’ proprietary trades
associated with price changes. This directive has generally been interpreted as prohibiting two-
sided market making. In recent years, however, the prohibition has become less effective, as
proprietary trading has become more widespread and monitoring has become more difficult.
850
to achieve a more detailed description of the dynamics of trades and
quotes for a few representative firms.
The rest of the article is organized as. follows. Section 1 summa-
rizes trading procedures on the TSE. Section 2 describes the data and
provides the main results on liquidity. Section 3 discusses preliminary
findings on price limits and liquidity. The dynamic properties of trades
and quotes are discussed in Section 4. Section 5 presents concluding
remarks.
1. Institutional Details
This section summarizes the key institutional features of the TSE and is
based on the published rules of the exchange [TSE (1993a, 1993b)] and
conversations with exchange personnel. The TSE is by far the domi-
nant market in the trading of Japanese equities. Among all Japanese
firms, the vast majority have their primary listing on the TSE. Although
many stocks are cross-listed on regional exchanges (the largest of
which is in Osaka), the TSE accounts for most of the trading. In the
year of our data sample (1990), 84 percent of the share volume in all
Japanese equities was conducted on the TSE [TSE (1993c)].
A stock is listed either in the first section, which contains approxi-
mately 1200 large and actively traded stocks, or in the second section
(approximately 400 smaller, less actively traded stocks).
2
All stocks in
the second section and most in the first section (including all three
stocks in our sample) are “system traded” with the assistance of a com-
puterized matching system called (in English) CORES (Computerized
Order Routing and Execution System).
Procedures for these stocks are substantially, but not entirely, au-
tomated. The remaining stocks in the first section (150 actively traded
issues) are “floor traded.” Trading in these issues is conducted with a
higher degree of human involvement. For both schemes, however, the
trading rules are essentially identical: the only difference is whether
these rules are implemented with more automation (system traded)
or less (floor traded).
All trading takes place under the supervision of a saitori exchange
member. The saitori is neither a broker nor a dealer: he neither rep
resents customer orders nor does he trade for his own account. The
saitori governs the trading process in floor-traded stocks and also
(although with lesser involvement) in system-traded stocks. For the
latter, the saitori plays an active discretionary role in certain situations
described in detail below. Tick sizes are summarized in Table 1. They
2
See Hamao (1991, 1992) for details on the distinction between the first and second sections.
851
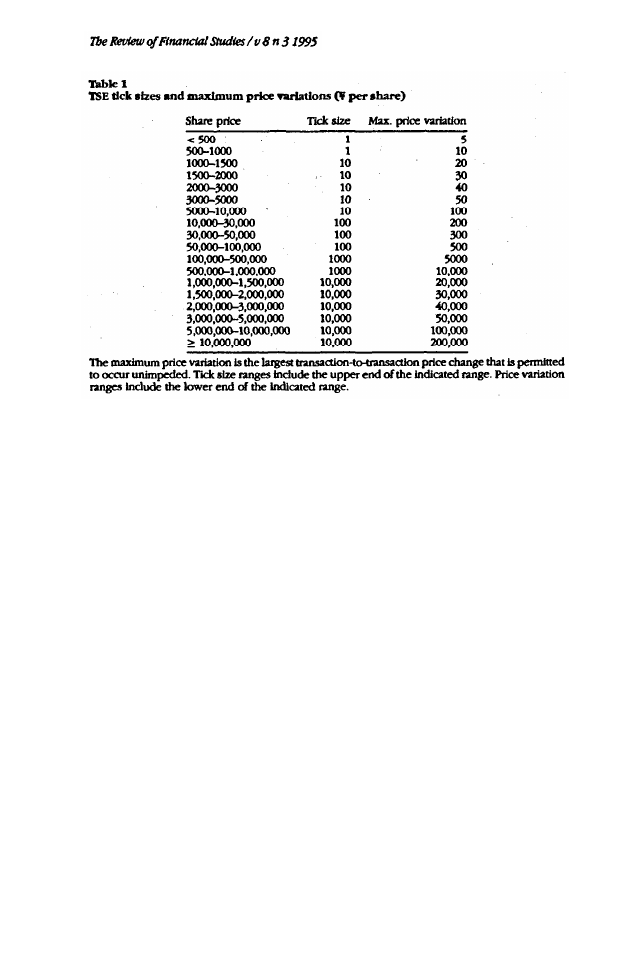
depend on the stock price and are generally between 0.1% and 1% of
the stock price.
The trading day on the TSE is divided into morning (9:00
AM
to
11:00
AM
) and afternoon (1:00
PM
to 3:00
PM
in our sample, 12:30
PM
to
3:00
PM
since April 1991) sessions. A trading session on the TSE opens
with a call mechanism (itayose), then functions as a continuous double
auction (zaraba) until the session closes. In principle, the session may
close with a call if there are both buy and sell market-on-close orders,
or if the market-on-close orders on one side of the market exceed
the (nearest-priced) limit orders on the-other side, but this seldom
occurs.
The itayose mechanism is straightforward. Buyers and sellers sub-
mit market or limited price orders that are cumulated into supply and
demand schedules. The intersection determines the equilibrium (see
Hamao (1992)). After the itayose clears, the best unexecuted buy and
sell orders establish the bid and ask price for the start of the zaraba.
Within the zaraba, traders may submit limit orders or market orders.
The regular quotes (ippan kehai) disseminated by the exchange rep
resent the best bid and ask in the limit order book, and most incoming
market orders execute by hitting the book. The size of the reported
trade is determined by the size of the incoming order. A 1000-share
buy order that executes at one price against limit sell orders of 600
and 400 shares, for example, is reported as a 1000-share trade,
The principal complication in this framework is the procedure that
slows the execution of large market orders. These, for present pur-
852

poses, are market orders that cannot be fully executed at the current
quote, i.e., orders that would otherwise “walk” through the limit or-
der book. When such an order arrives, it partially executes up to the
size of the current quote. Then the remaining portion is converted
into a limit order at the current quote. This is briefly displayed as an
indicative quote, an invitation for competing liquidity suppliers to hit
the quote. If no such orders arrive, the original order is allowed to
proceed to the next price in the book.
Table 2 describes an extended example. For a share price just above
¥1500, the tick size is ¥10. Suppose that the opening itayose price (or
previously executed price in zaraba) is ¥1540 (time 0). The subse-
quent limit order book is that shown at time 1. The highest bid and
lowest offer are displayed as regular quotes. Transaction price limits
are most often hit when large incoming orders walk up or down the
book. Suppose that a 10,000-share market buy order arrives at time 2.
The first portion of this order, 9000 shares, is traded immediately at
the prevailing offer (time 3).
The remaining 1000 shares is not, however, immediately executed
at the next higher price (¥1560). Instead, the order is represented
as a warning bid (kai chui kehai) at ¥1550. The warning quote is
generally issued automatically, but the saitori may instruct the system
to suppress this generation. The duration of the warning quote is also
at the discretion of the saitori, but for an order in this situation it
would typically be less than 1 minute. If this waiting period elapses
without the arrival of a sell order priced at the market, ¥1550 or lower,
the remainder of the market order is allowed to hit the ¥1560 offer on
the book (time 4).
This process can be repeated at each step of the price, moving one
tick at a time. The unexecuted portion of a market order is effectively
converted to a limit order, in a fashion similar to that employed in
the French CAC system [see Biais et al. (1994)]. However, unlike the
CAC system where a market order in excess of the best quote on
the opposite side is converted to a limit order, the market order is
eventually permitted to hit the next higher price on the TSE. The
handling of a TSE market order therefore lies between that of a CAC
market order and a CAC marketable limit order (which is allowed to
walk through the book without delay).
Transaction prices on the TSE are also subject to maximum varia-
tion limits. Hamao (1992) describes the daily price limits, which are
relatively broad. As it happened, none of our stocks hit a daily price
limit, despite the high activity and volatility in the sample. Table 1
reports the intraday price variation limits. These depend on the stock
price and are generally between 1 percent and 2 percent of the stock
price (alternatively, between 2 and 10 ticks).
853
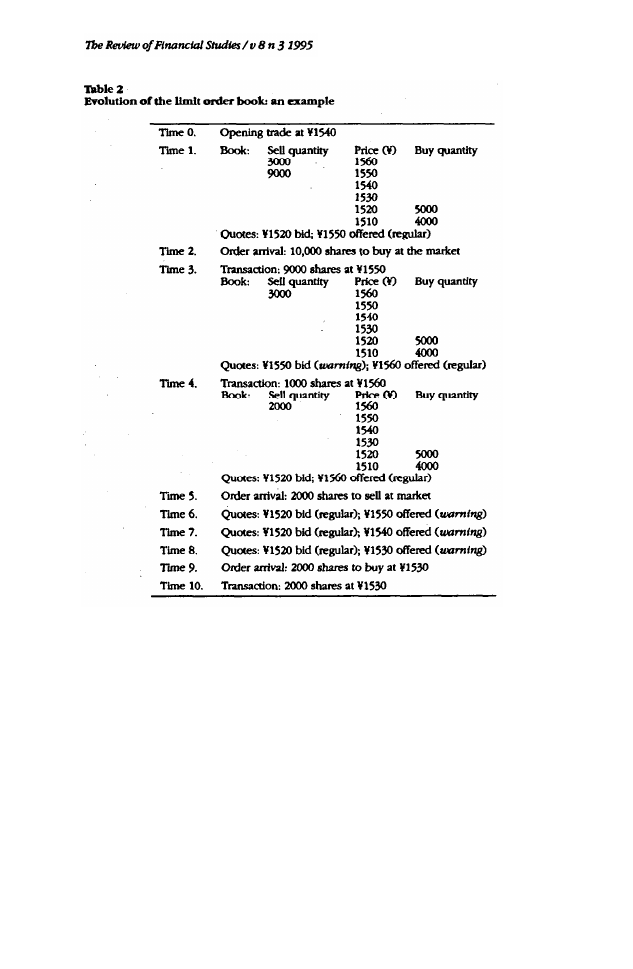
The intraday price limits are often triggered within the day by the
arrival of orders of opposite sign. For a stock in the price range of
the example the maximum price variation is 430 (cf. Table 1). Sup
pose that a 2000-share market sell order arrives at time 5. If this were
permitted to hit the bid (¥1520), the resulting change from the previ-
ous price (¥1560) would exceed permitted variation (¥30). A warning
quote is also used in this situation; an offer at ¥1550 (time 6). At this
point, an execution can only result from the arrival of a market buy
order (which would execute at ¥1550) or a limit buy order priced at
¥1530 or better (which would execute at the limit price). If neither or-
der arrives, the warning quote may remain at ¥1550 possibly for the
remainder of the trading session). Alternatively, the saitori may suc-
cessively revise the warning offer down to the price consistent with
the maximum permitted variation (¥1530). The saitori exercises con-
854
siderable judgment in this situation as there are no formal exchange
rules governing warning quotes. In the example, the arrival of a buy
order priced at ¥1530 at time 9 triggers an execution (reported at time
10). In the absence of any order arrivals, the warning quote would
not be lowered below ¥1530.
Saitori discretion in the use of warning quotes extends to the ex-
posure duration. A warning quote is sometimes allowed to persist
for several minutes. When an incoming market order is progressing
through the limit order book, on the other hand, the warning quote
is often exposed only momentarily. This does not allow the trader
who entered the exposed limit order a broad opportunity to revise or
cancel the order.
The warning quote mechanism effectively imposes on TSE traders
a particular strategy. Biais et al. (1994) note that when the spread
on the Paris Bourse is relatively high, incoming orders are less likely
to demand liquidity (seek immediate execution) and are more likely
to compete by successively improving on the prevailing quote (and
narrowing the spread). The warning quote process mimics this quote
improvement process. It removes, however, the trader’s discretion in
the duration of the quotes and (implicitly) the aggressiveness of the
order. Also, although a warning quote may stop trading for an inde-
terminate time, the order underlying the quote is not “stopped” in the
sense of the term on the NYSE. A broker stopping an order on the
NYSE guarantees execution at a particular price and seeks to improve
upon that price. There is no such guarantee on the TSE, as it is con-
ceivable that the opposing quote could deteriorate while the warning
quote was pending.
Warning quotes are an informal indication of buying or selling in-
terest. A more formal indication is the “special quote” (tokubetsu ke-
hai). A special quote arises in situations similar to those that trigger
a warning quote, but with multiple orders on the active side. In the
example, had another seller arrived at time 6, a special offer quote
of ¥1550 would have been disseminated. Whereas warning quotes
are bound by the maximum permitted price variation, a special quote
effectively resets the base price. The hypothetical special quote of
¥1550 at time 6 would be consistent with a subsequent execution
price down to ¥1520 (¥1550 - ¥30). The saitori must allow a special
quote to persist for at least 5 minutes (or until it is hit). If it is not hit,
the special quote may be revised up to maximum variation (¥30), i.e.,
the new special quote is ¥1520. After five more minutes have passed
without the arrival of an opposing order, the quote may be revised
again, and so on up to the daily price limit.
When a special quote is posted, the opposing quote is removed
from display (actually it is posted as zero). In the example, if a special
offer quote of ¥1550 had been posted at time 6, the ¥1520 bid would
have been removed from the display, and a ‘00’ null quote (our termi-
nology) would have been shown. It is in this instance impossible for
a seller to determine if the ¥1520 bid has been canceled. In discussing
this procedure, TSE personnel note that when an order imbalance of
this sort exists, the bid quote tends to be a small size. The TSE there-
fore views the bid (the size of which is not widely disseminated) as a
misleading indicator of the price a seller might receive and elects not
to display it at all. As a formal matter, this removal effectively converts
a double-sided open auction to an auction that is sealed bid on one
side. These null quotes are also used when the underlying order is
far out of range.
The gradual and progressive revision of quotes on the TSE is man-
dated with a view toward smoothing the price transition path and
reducing the impact of transient liquidity shocks. On the NYSE, this
purpose is served primarily by price continuity rules, and it is illumi-
nating to compare the two approaches. The contrasting features may
be summarized as follows. Suppose that the market is hit by a large
public information shock that necessitates a price adjustment. On the
TSE, the quotes will exhibit a smooth transition path, but there need
not be any transactions along this path. Successive transaction prices
may be widely separated., On the NYSE, the specialist (designated
market maker) is partially evaluated on the extent to which he main-
tains transaction price continuity, i.e., limits successive price changes
to one tick. In providing this continuity, the specialist may engage in
trades that are disadvantageous relative to the current available infor-
mation. A further distinction between the two exchanges lies in the
time needed to complete the transition. On the TSE, adjustment of the
quotes may necessitate intervals of waiting at the intermediate price
levels. On the NYSE, there are no restrictions on the adjustment speed
(in natural time): the transactions establishing the adjustment may be
executed within seconds of each other.
3
Although most transactions result from the interaction of two anony-
mous orders, the TSE does permit a broker to effect a cross. Rules for
large block trading were streamlined in 1967, and off-exchange block
trading was prohibited in most circumstances. (There are, however,
some rarely encountered situations in which it is permissible.) Block
trades crossed on the exchange must clear the limit order book and
are fully subject to all TSE rules. The regional exchanges (Osaka, in
particular) play a role in block trading that is similar to that of the
856
regional exchanges in the United States. Because there is less trading
activity, it is easier for a broker to cross a block away from the primary
exchange: spreads are generally wider and there are fewer limit orders
to be “cleaned up.” Off-TSE block trading is highly seasonal. A March
peak arises from a fiscal year end trading practice in which a single
institutional stockholder may be on both sides of the trade, thereby
resetting the value of the holdings (for financial reporting purposes)
to current market value.
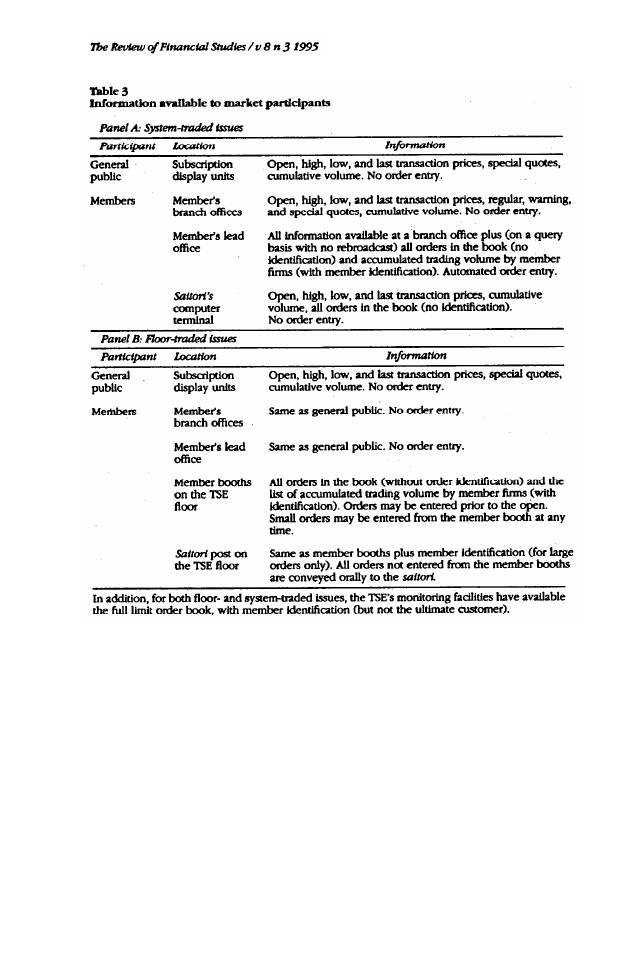
The TSE is also distinctive in the level of information permitted
to the various classes of participants. Table 3 summarizes market
participants and their access to information and order entry facili-
ties. Of particular note is the relatively narrow dissemination given
to quotes. Away from the exchange floor, quote sixes are available
only for system-traded stocks and only at the member firm’s lead of-
fice. Participants without this information cannot know the depth of
the market. The practice of converting a partially executed order to a
warning quote can be viewed as a way of compensating for this lack
of transparency. Off-exchange, warning quotes are available only at
lead or branch offices of member firms, and electronic collection or
rebroadcast of any data is strictly prohibited.
A member may install in the trading room at his lead office video
display terminals that show for system-traded stocks the shape of the
order book (prices and quantities, but not identities) both prior to the
itayose (opening call) and during the zaraba (continuous trading).
These terminals also report the largest cumulative traders (identified
by member firm). The number of terminals is limited, and the infor-
mation is supplied only on demand in response to a request entered
on a keyboard: it is not continuously updated This information is also
available for floor-traded issues, but only by inspection of a screen on
the exchange floor. The information may not be electronically copied
or rebroadcast. The only-on-demand feature and the electronic cap-
ture prohibition effectively nullify the usefulness of these data as in-
puts to a real-time automated trading system.
It is especially noteworthy that the information available at the
member’s lead office includes the total size of the orders underlying
a warning or special quote. In principle a trader deciding whether
or not to hit a warning or special quote can condition on the total
size of the order. While this is a distinct possibility, there are some
practical limitations. Since the progression of the warning or special
quotes may be rapid and the information is available only on demand,
a trader may not always have sufficient time to react. If the response
would involve modifying a customer order, additional delay would
be introduced by the need to confer with the customer.
For floor-traded issues, customer orders are relayed by telephone
857
to a member on the exchange floor. Except for small and preopening
orders (see Table 3), the member orally communicates the order to
the saitori who then enters it in the floor-trading computer system.
For system-traded issues, all customer orders must be routed through
the member’s lead office. The order is entered at a terminal in the
member firm’s lead office, which electronically transmits the order to
CORES.
The links between the TSE and the regional exchanges are not as
formalized as those governing the U.S. Intermarket Trading System.
Trade reporting is consolidated (as in the United States), but there is
no consolidated quote reporting. It is the broker’s responsibility to
survey the quotes and determine how to route an order. Exchange
officials claim that while trade-throughs (execution at a price inferior
858

to another exchange’s posted bid or offer) are possible, they rarely
occur. For a stock that trades principally on the TSE, the price limit
mechanism is applied to TSE trading without formally taking into ac-
count transactions occurring at other exchanges. The other exchanges,
however; are responsible for ensuring that their trades do not violate
the TSE price limits. The roles are reversed for a stock that trades
primarily on a regional exchange.
2. Data and Preliminary Analysis
The data sample underlying this study consists of the ordered se-
quence of transactions and quotes for three securities in the period
January 4, 1990, through March 31, 1990, time-stamped to the last
minute. The quotes (regular, warning, and special) show only prices,
not quantities. We do not observe the orders directly, and the data do
not contain limit orders away from the best quotes. As noted above,
the regular quotes are the best (narrowest) quotes that have not been
executed at a given time. Our database essentially reflects the infor-
mation available at a member firm’s branch office (see Table 3), and
our analysis will implicitly take this as the relevant public information
set. Traders at the member firm’s lead office may also have access (by
request) to data describing the shape of the limit order book and the
identity of the initiators of large executed transactions. This roughly
corresponds to the information available to a member on the floor of
the NYSE.
The data were provided by the exchange in the form of photostat
computer printouts (roughly 5000 pages), converted into machine-
readable form using an optical scanner, checked, and edited. The
securities, randomly chosen from system-traded issues in the first sec-
tion, are Mitsui Construction, Nikon, and Japan Airlines (JAL). There
were 59 trading days in this period. January 4, 1990, was the first trad-
ing day of the year, and the market was open only in the morning.
Due to mishaps in the collection of the data, we are missing 1 day
for each stock (February 27 for Nikon and JAL, and March 2 for Mit-
sui Construction). This leaves 58 morning sessions and 57 afternoon
sessions.
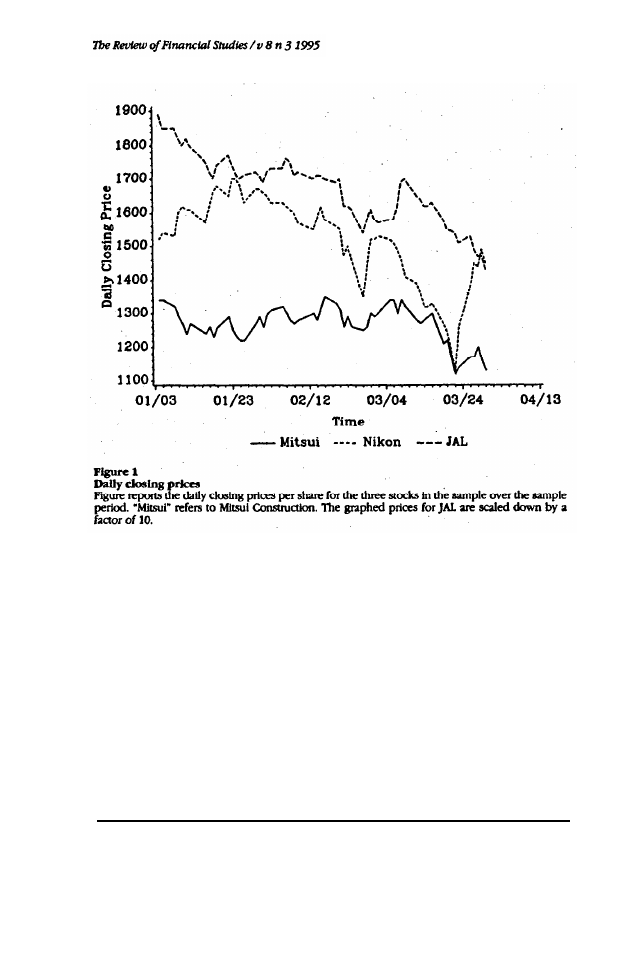
Figure 1 depicts the daily closing prices over the observation pe-
riod. All three stocks in our sample declined in value. (The Tokyo
market experienced a downward movement; the closing value of
the value-weighted Tokyo Stock Price Index (TOPIX) declined from
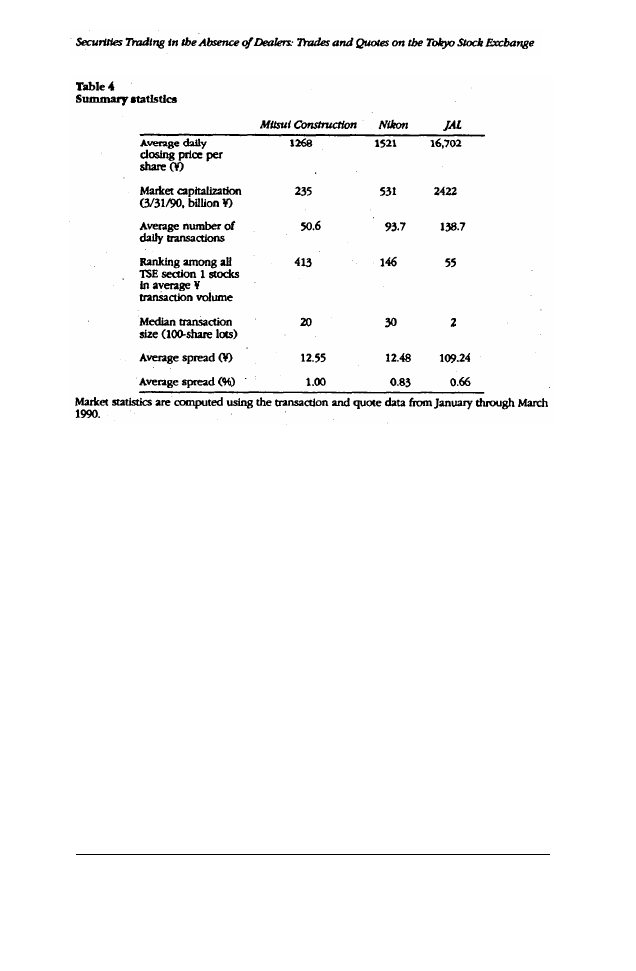
2867.70 on January 4 to 2227.48 on March 30.) Table 4 reports various
summary statistics. At then-current exchange rates, the median trans-
action sixes roughly correspond to dollar values of $21,000 (Mitsui
Construction), $36,000 (Nikon), and $26,000 (JAL). Average spreads
859
are very close to their respective minimum tick size and are 1 per-
cent or less. For each stock, the tick size remained constant over the
sample period.
Nikon and JAL are also traded on the regional exchanges; Mitsui
Construction trades only on the TSE. While we do not possess mar-
ket share data covering our sample period, we have examined off-
TSE trading activity for the first quarter of the following year (1991).
The TSE’s share of trading volume for the quarter was 82 percent for
Nikon and 95 percent for JAL. These stocks further exhibited the sea-
sonal pattern mentioned in Section 1. The monthly shares for January,
February, and March were 98 percent, 83 percent, and 76 percent for
Nikon, and 98 percent, 94 percent, and 94 percent for JAL.
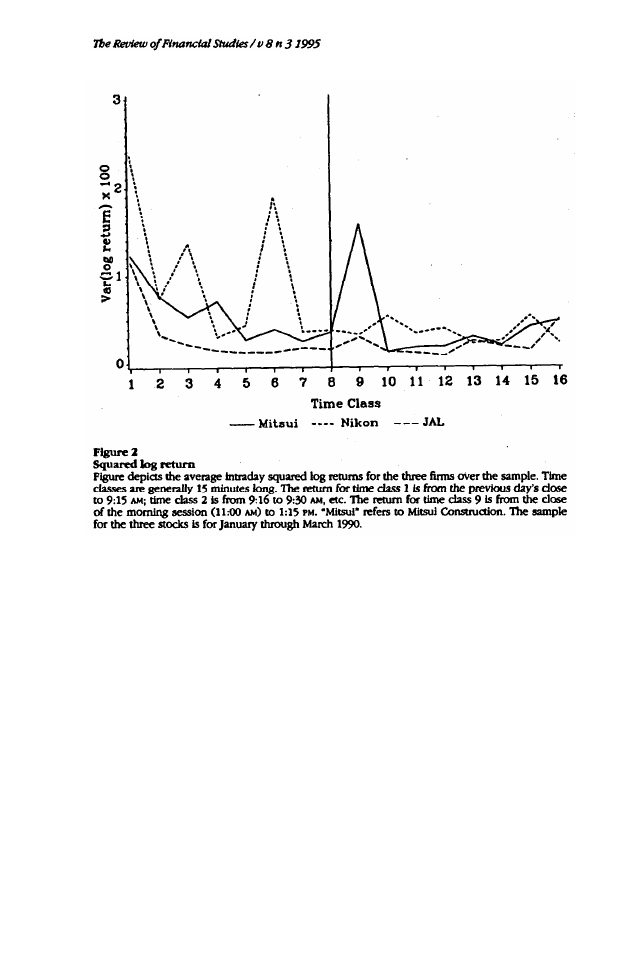
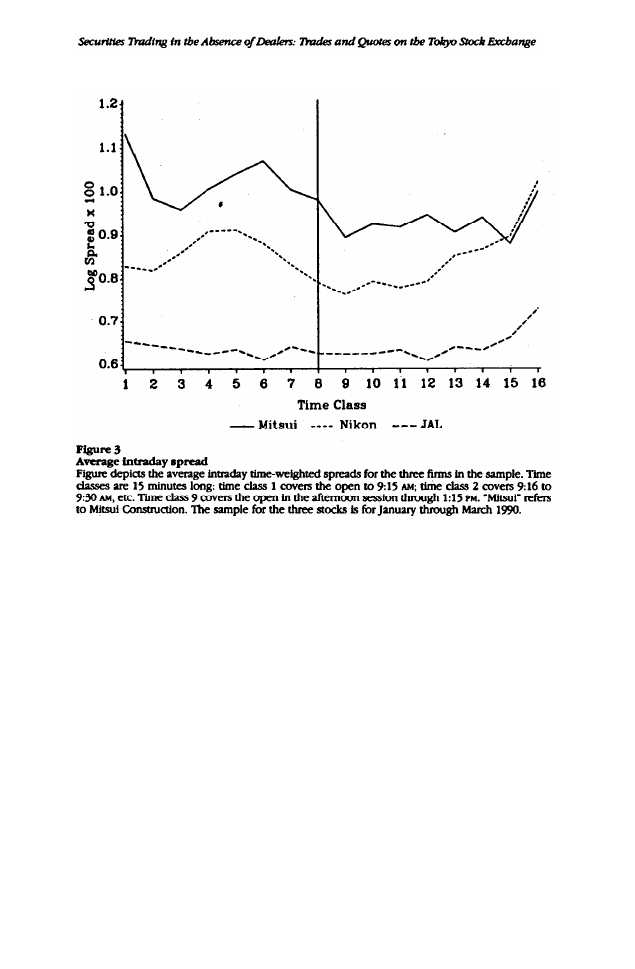
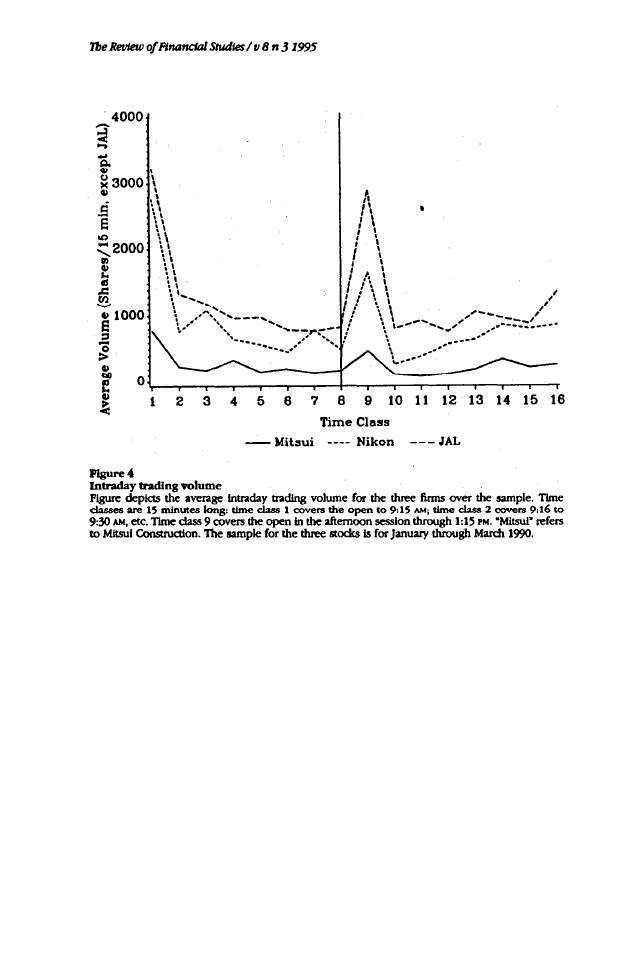
As in the U.S. data, most market statistics exhibit a marked in-
tradaily pattern.
4
Figures 2, 3, and 4 present plots of average squared
4
Intraday patterns in U.S. data are discussed by Admati and Pfleiderer (1988), Foster and
Viswanathan (1990,1993), Harris (1986, 1989), Jain and Joh (1988), McInish and Wood (1992),
Mulherin and Gerety (1989), and Wood, McInish, and Ord (1985). Lehmann and Modest (1994)
also document intraday pattern in Japanese equity transactions data.
860
return, average proportional spread, and average trading volume for
15-minute intervals throughout the trading day. The mean squared
return and spread tend to be elevated at the beginning and end of the
trading day. The volume tends to be elevated at the beginning and
end of the trading sessions.
5
3. The Availability of Immediacy
A trader enjoys immediacy in a market when an order can be instanta-
neously executed. Speed of execution may be important for reasons of
hedging, implementation of dynamic trading strategies, minimization
of ongoing market monitoring costs, or simply an investor’s desire
for closure on an allocation decision. When an exchange’s proce-
dures require a market maker to post quotes at all times, immediacy
is available at some price whenever the market is open. In the ab-
sence of such a dealer (as on the TSE), immediacy will be unavailable
whenever there is no public limit offer to buy or sell. In addition,
the TSE’s procedures for handling large market orders and the intra-
day price limits may also impair immediacy. This section examines
the evidence bearing on the availability of immediacy and also the
execution delays introduced by the order procedures.
5
The delivery and settlement occurs on the third business day after the transaction (T + 3).
861
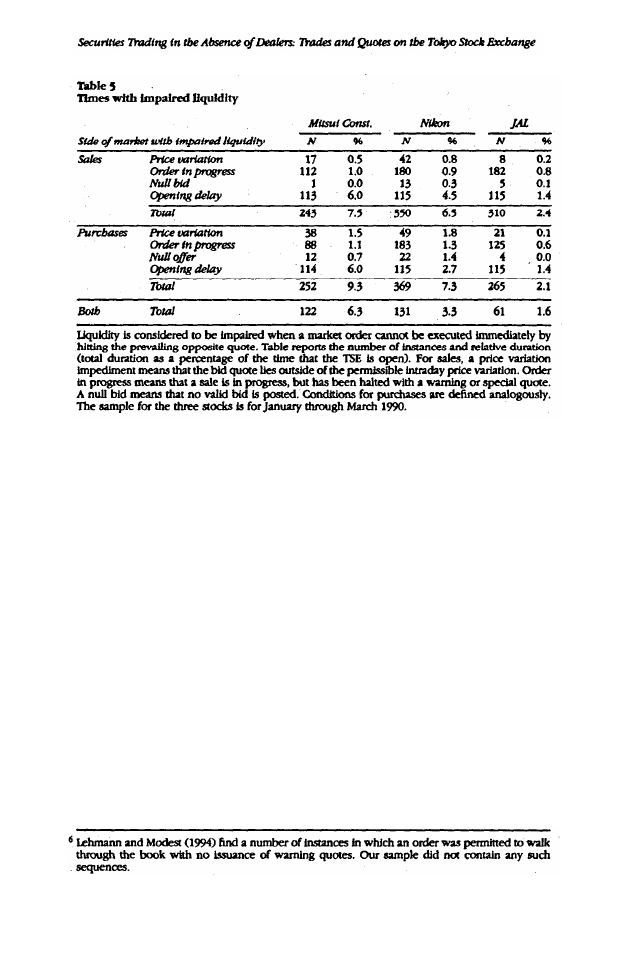
By way of preliminaries, Table 5 summarizes the number and rela-
tive durations of times when immediacy is unavailable on one or both
sides of the market. Relative duration is the total time that immediacy
was impaired as a percentage of the time that the TSE was in principle
open over our sample period. The greatest impairment of liquidity is
associated with opening delays: the highest relative duration in our
sample of firms is 7.5 percent (of the total time the exchange was
open). These stem from a relatively small number of instances when
the opening delay was on the order of 1 hour. It is not possible to
ascertain when no bid or offer exists in the system. The “null” quote
category (a relative duration of at most 1.4 percent in our sample)
includes this possibility, but null quotes are also posted when the op-
posing quote is a special bid or offer. Price variation events are those
in which a quote is posted, but hitting such a quote would violate the
maximum permitted intraday price variation (a relative duration of at
most 1.8 percent in our sample). Finally, times in which an order is in
progress on the same side of the market (as indicated by a warning
862
or special quote) account for a relative duration of up to 1.3 percent
in our sample. Although these relative durations may appear small,
they do not take into account the demand for liquidity. The market
may be effectively unavailable exactly when the demand for liquidity
is high.
While it would obviously be desirable to track the performance
of all incoming orders, these are not contained in our data. Partial
inference is possible, however, from the transaction and quote record.
To this end we define an order sequence as the consecutive sequence
of trade and quote events that spans the smallest time for which we
can be certain that the order that initiated the sequence has been fully
processed. The simplest sequence arises when a normal bid and offer
are present, a transaction takes place at either, and then the normal
quotes are reaffirmed. This may confidently be presumed to have
arisen from an incoming market order. If the order could not have
been fully executed at one price, however, the sequence would have
involved warning quotes and multiple transactions.
863
More formally, the start of an order sequence in the buy direction is
indicated by a transaction above the current bid quote or a quote that
improves on the current bid. Continuation of the order sequence is
inferred from warning or special quote conditions. The ending point
of an order sequence is fixed by the posting of a regular quote or
by the end of the trading session. First transactions of both morning
and afternoon sessions are excluded since they employ a call auction
(itayose). Limit orders at or away from the current quote (“passive
orders”) cannot be discerned in our data. Furthermore, the inferred
sequence may actually span multiple incoming orders: if another order
arrives on the same side of the market during a warning or special
quote sequence, it will not be possible to infer from the reported
transactions when the execution of the first order is completed and
that of the second order has begun.
In examining the outcomes of orders and order sequences, we are
implicitly ignoring the endogeneity of order submission strategies.
Traders can and do condition their orders on current market condi-
864
tions. In principle, for example, a trader with access to the display at
a member's lead office can obtain the shape of the limit order book
(data we do not possess), and can so forecast the progress of trades
and warning quotes that would result from an order of a given size.
Knowledge that the book is thin may lead the trader to trim the size
of the order. This conditioning is ignored in our analysis.
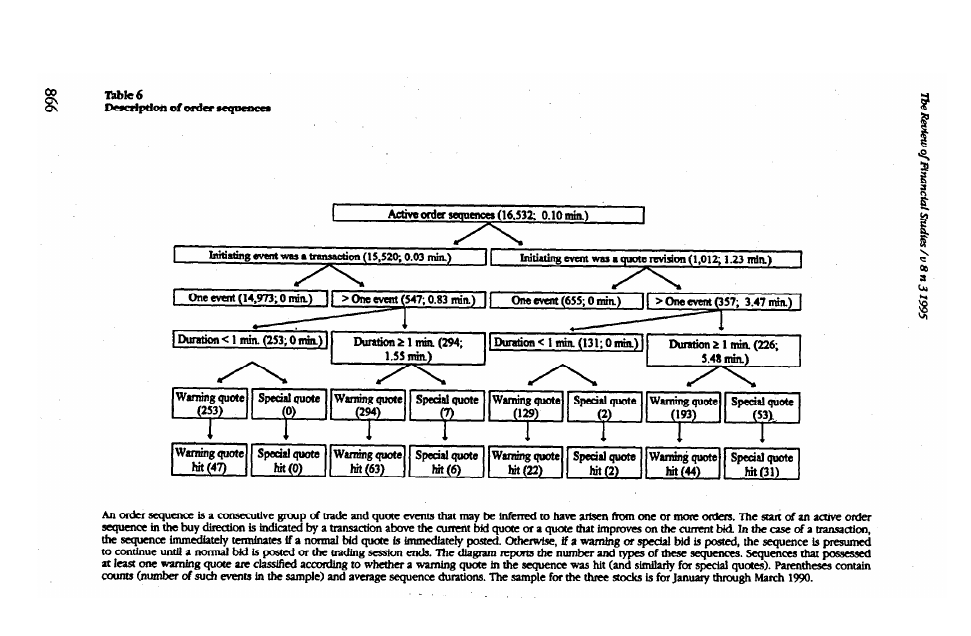
Table 6 describes the order sequences in the sample. The vast ma-
jority result from market orders that are completed in a single transac-
tion. Quote improvements constitute a smaller number of instances.
It is useful to categorize sequences of longer than one event accord-
ing to whether the duration of the sequence is longer than 1 minute
(the time resolution of the data). Of the multiple-event sequences
that start with a trade, roughly half of these (253/547 = 46 percent)
are completed in the same minute. Many of these sequences involve
orders that walked through the book without interference.
6
The corre-
sponding figure for multipleevent sequences that started with a quote
revision is 131/357 = 37 percent. All of the multiple-event sequences
involved warning or special quotes, with the former being more com-
mon. In many of these sequences, a special or warning quote was hit
by an incoming opposing order.
865

A one-event sequence that began with a quote revision reflects a
regular bid or offer that improved on the prevailing bid or offer, and it
is reasonable to assume that this was the intent of the trader submitting
the order. This assumption cannot be made for longer sequences. For
example, if the offer quote lies beyond the maximum price variation, a
market buy order will appear as a sequence of warning quotes (some
of which may be hit by incoming sell orders). A sequence of warning
quotes might also arise from a limit order that improves upon the
current bid by more than one tick.
Since the warning and special quotes constitute a particularly dis-
tinctive feature of the TSE mechanism, it is useful to examine the out-
comes of these quotes in greater detail. A warning or special quote
can lead to another revised warning or special quote, a regular quote,
or a null quote (if the order is withdrawn and the next-best order is
out of range). The outcome may also be a transaction. The special or
warning quote may itself be hit by an opposing order. Alternatively,
the order behind the special or warning quote may be allowed to
hit the prevailing counter-party quote. Finally, the trading session may
close with the quote left hanging.
Table 7 reports the frequency of occurrence of these outcomes and
also the mean durations. The average durations of the warning quotes
are brief, under 3 minutes. These averages include, however, many
instances where the warning quote was exposed for under 1 minute.
It is likely that most of the 755 cases where a warning quote was
followed by a trade correspond to instances where an order is walking
through the book. Nevertheless, 19 percent of the warning quotes
(199/1052) were hit by Incoming orders, with a mean duration of 0.66
minutes. This suggests that these orders may encourage competing
providers of liquidity to come forth. The incidence of special quotes
is roughly 7 percent (77/1052) of that of warning quotes. Since these
cannot be revised until 5 minutes have elapsed, the durations are
longer than those of warning quotes. Nevertheless, in 51 percent of
the occurrences (39/77), the special quote was hit by an incoming
order.
Our sample exhibited no instance of a warning quote in which
the opposing quote was withdrawn or moved away from the order.
The absence of such behavior may reflect the irrelevance of opposing
warning quotes in limit order strategy, or it may simply arise from
the practical difficulties of detecting and reacting to these quotes. The
extent of quote revisions in the face of special quotes could not be
ascertained because no opposing quotes are displayed.
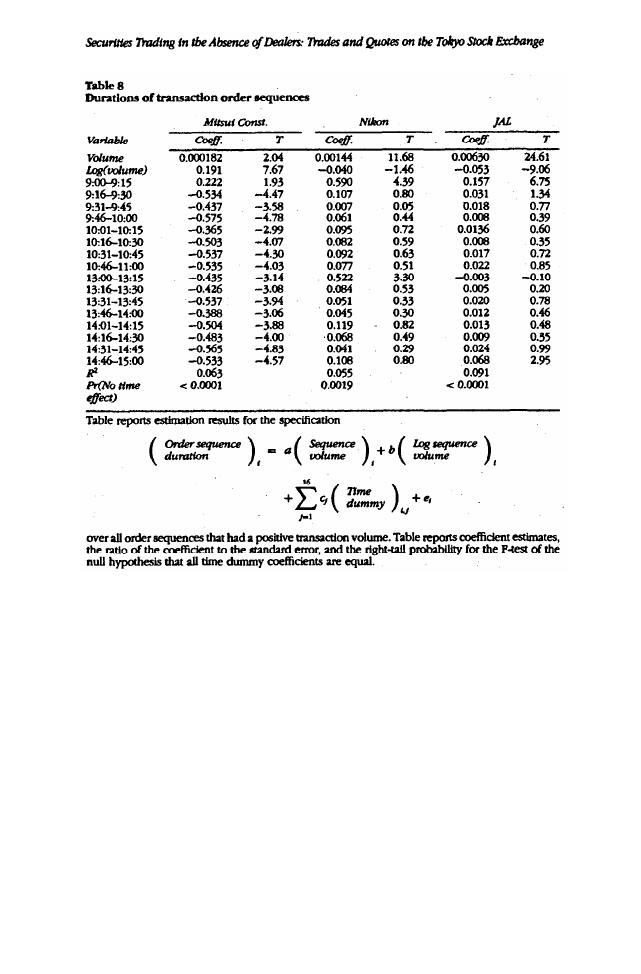
Taking the volume of an order sequence and the submission time
as predetermined, the impact of these variables on the duration of the
867
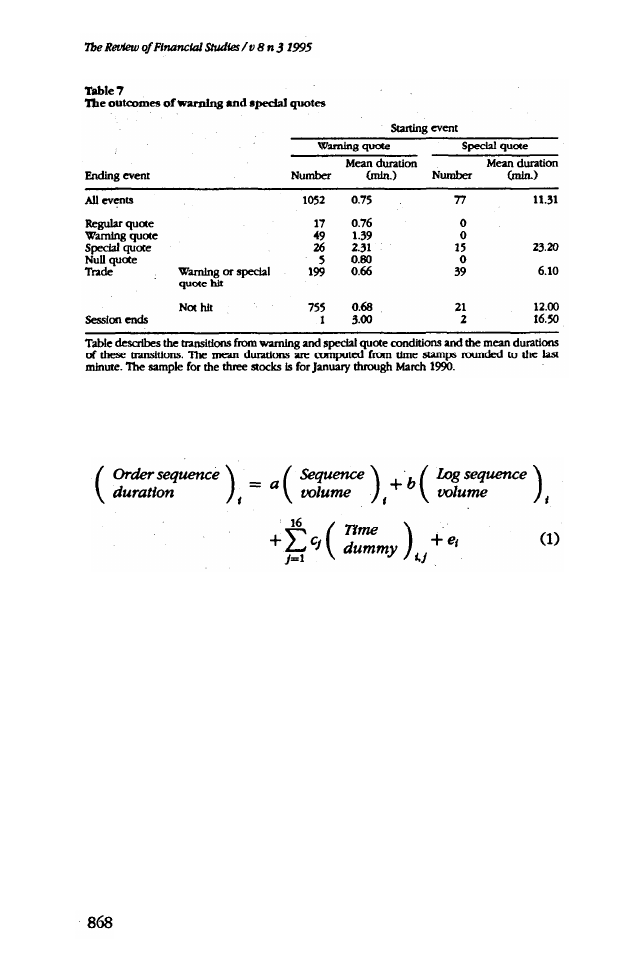
sequence may be estimated from the regression specification:
where i indexes the order sequences in the sample and the time
dummy variables define the sixteen 15-minute intervals comprising
the trading day (interval 1 is 9:00 to 9:15, etc.) and refer to the time
of order submission. Table 8 presents estimations of this specification
for the three firms. The overall explanatory power of the regressions
is not large: the R
2
are all below 10%. This suggests that there are sig-
nificant determinants of liquidity that are not captured. The volume
coefficients generally define a positive relation between volume and
duration. The time dummies are jointly statistically significant. They
suggest that liquidity is lower at the beginning of the day. The prin-
cipal caveat in this regression is the exogeneity assumption. Order
submission strategy is endogenous to market conditions. The sub-
mitted orders depend on the expected market depth, and our weak
correlations may simply reflect a tendency of traders to submit larger
orders when the market is more capable of accommodating them.
4. The Dynamic Behavior of Trades and Quotes
This section explores the relations between trades and quotes on the
TSE. This behavior is of interest because it provides clues about the
information contained in trades and how this information is incor-
porated into prices. We employ two approaches. The first involves a
vector autoregression model in which trades are characterized solely
by their signed volume and the price variable of interest is taken to
be the quote midpoint. This analysis is well-suited to investigating
the adjustment process of the quote midpoint, and in particular, how
the TSE's price limit mechanism affects this adjustment. The second
analysis focuses on the behavior of quotes relative to the transaction
price, with the purpose of characterizing the information contained
in the trades.
869
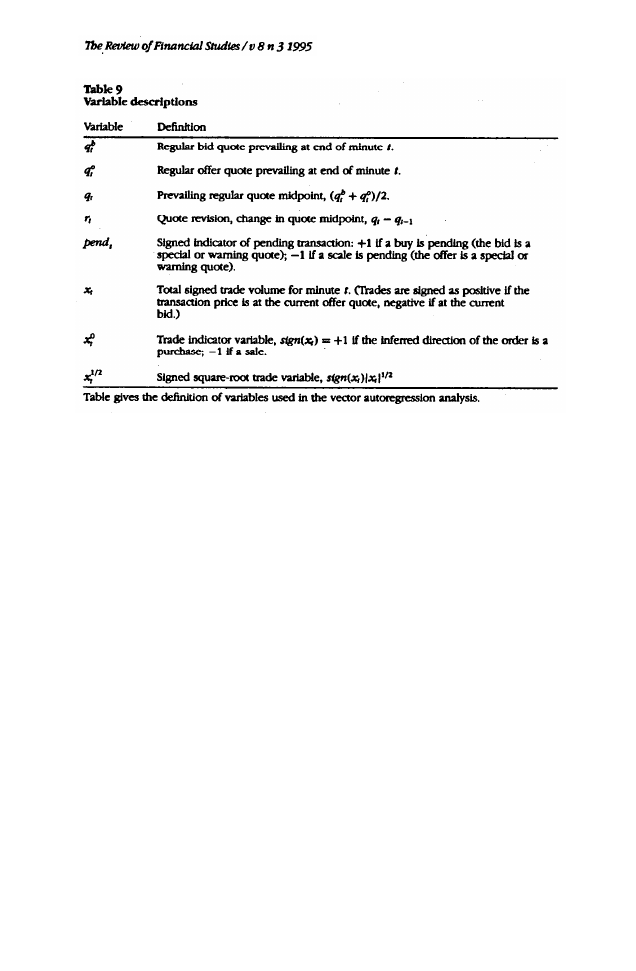
Trades and quotes: a vector autoregressive model
Applications of vector autoregressions (VARs) in microstructure anal-
ysis are described in Hasbrouck (1991a, 1991b, 1993). A VAR jointly
models the dynamic interactions of all variables. The key variables
here are the revision in the quote midpoint (r
t
) and the signed trade
size (x
t
). These variables and the associated transformations are sum-
marized in Table 9 and are essentially identical to those employed by
Hasbrouck (1991a) for the NYSE data. The most significant departure
from the earlier paper involves the time subscript. Here, t refers to
minutes and not transactions. The motivation for this change stems
from the central role played in the TSE’s price limit mechanism by
standard clock time.
The trade variables (x
t
and its transformations) attempt to reflect
the incoming order flow, signed positively for buyer-initiated trades
and negatively for seller-initiated trades. We follow the conventional
practice of imputing this sign by reference to the prevailing quotes.
Because all trades except crosses involve the limit order book, the
vast majority of the TSE trades can be signed in this fashion.
To capture the state of the market when a price limit is in effect, we
construct a signed trade-pending variable, pend
t
. This is an indicator
variable set to +1 if the pending bid quote at the end of minute
t is a warning or special quote. This indicates that a buy order is
either walking up the book or is being held to satisfy the continuity
870
requirements. Similarly, pend
t
is set to -1 if the pending offer quote
at the end of minute t is a warning or special quote.
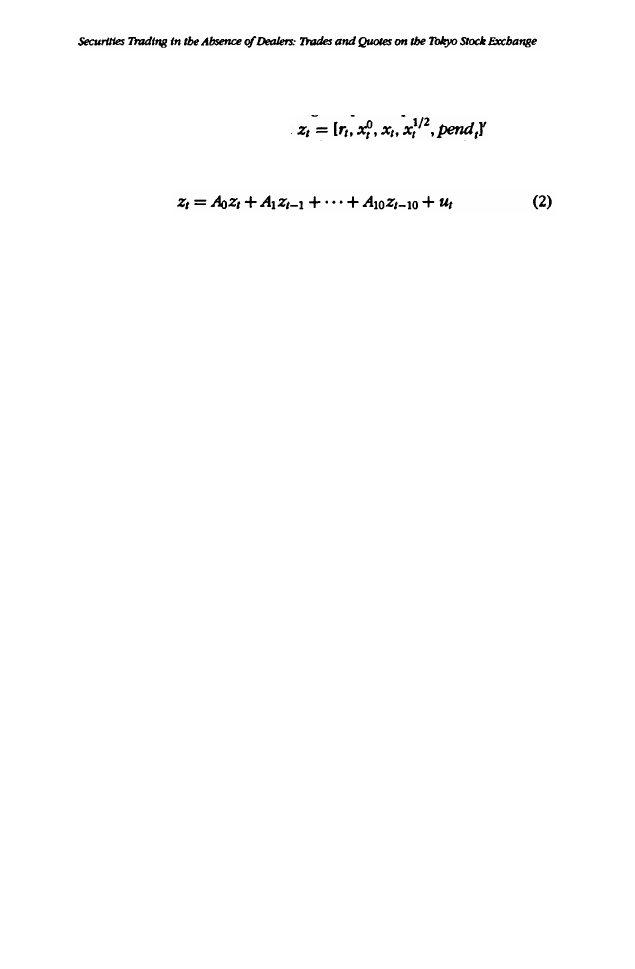
The VAR for the variable set
was esti-
mated with all variables included through a M-minute lag using the
specification
where the A
t
are conformable coefficient matrices and u
t
is a distur-
bance vector. The inclusion of the A
0
Z
t
term on the r.h.s. of Equa-
tion (2) reflects a partial recursive structure imposed on the specifica-
tion: the current quote revision is allowed to depend on the current
trade variables. The coefficient estimates are not reported, as it is more
illuminating for present purposes to examine the impulse response
functions. The impulse response functions characterize the dynamic
behavior of the system subsequent to an initial shock (assumed value
of u
l
at time t = 0). Table 10 reports summary estimates of these
functions.
For each firm, we study three initial shocks. The first shock cor-
responds to a buy order with size equal to the ninetieth percentile
transaction size for the firm (200 shares for Mitsui Construction, 510
shares for Nikon, and 50 shares for JAL). The order-pending variable
is set to zero (indicating that the order is fully executed as a single
transaction). For all three firms the statistically significant positive im-
plied cumulative price impact of the trade captures the information
effect of the trade. Furthermore, for two of the three firms (Nikon and
JAL), the initial order leads to significant additional order flow.
Positive autocorrelation in the order flow has been found for the
NYSE by Hasbrouck and Ho (1987) and for the Paris Bourse by Biais
et al. (1994). As possible economic factors, Biais et al. note the possi-
bilities of strategic order splitting, imitation (momentum trading), and
the sequential arrival of orders representing individual trading deci-
sions in response to common information. Institutional features may
also play a role: price discreteness and (at the NYSE) transaction price
continuity requirements and fragmentation in the reporting process.
The TSE has no reporting fragmentation and neither the TSE nor Paris
has continuity requirements. Therefore the positive trade autocorre-
lation cannot primarily arise from these considerations.
The second initial impulse for each firm is identical to the first,
except that the order-pending variable is set “on.” This corresponds to
an execution that is followed by a special or warning quote, indicating
that a portion of the original order is pending. Not surprisingly, this
results in a large increase in the total cumulative order flow. For Mitsui
Construction, for example, the initial 200 share purchase order gives
871
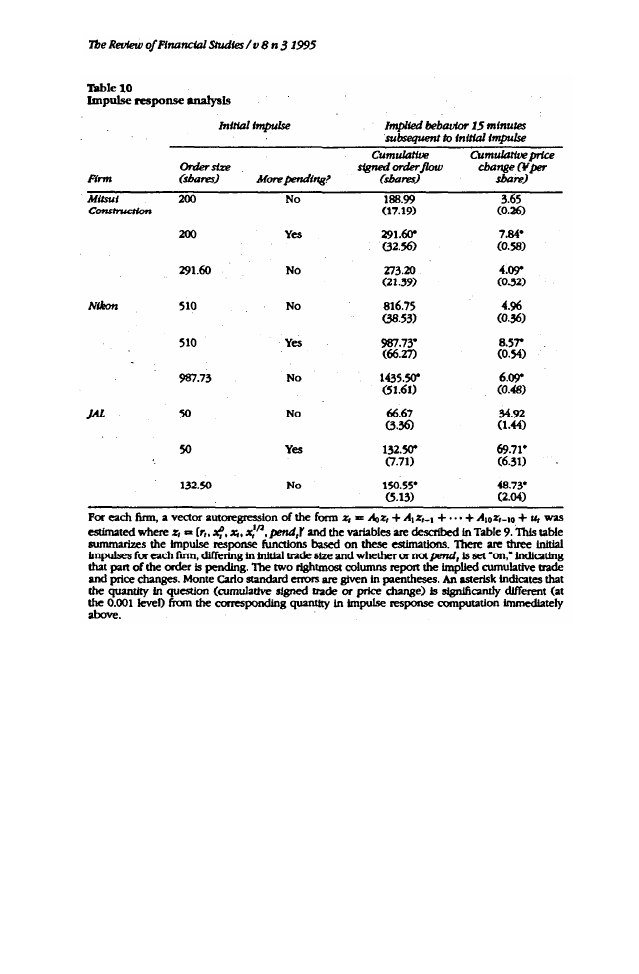
rise (in expectation) to an additional 91.60 shares. The larger order
flow is also associated with a larger quote impact.
It is of some interest to investigate whether the impact of an order
on a quote depends on whether it is processed as a single trade or
as a sequence that involves warning quotes. The first two impulse
response functions are not directly comparable for this purpose be-
cause they presumably involve different order sizes. That is, if a trade
of 200 shares is followed by a warning quote that indicates more is
pending, it must be the case that the original order size was for more
than 200 shares. To make the comparison more meaningful, a third
impulse response function was computed using an initial impulse cor-
responding to the total order flow (including that induced) from the
872

second impulse calculation, but with the order-pending variable set
to zero. This roughly corresponds to an order of the same total size
as in the second impulse calculation, but processed as a single trade.
For all three firms, the implied quote impact of this order was smaller
than the impact when the order was spread out over multiple execu-
tions (second impulse calculation). In all three cases, this difference
was statistically significant. It is also worth emphasizing that the lower
quote impact in this (third) case is also accompanied by higher cu-
mulative signed order flow.
Special and warning quotes are used when liquidity is relatively
low. Liquidity might be low because of random order arrival character-
istics. In this case, price limits can time-average the arrival of liquidity
suppliers and demanders., Alternatively, low liquidity may also signal
that incoming orders possess an especially large information content,
in which case the price limits merely retard the incorporation of infor-
mation into the security price. Since warning and special quotes are
often hit, they do appear to smooth price movements resulting from
transient illiquidity. However, since the cumulative quote impact of
an order appears to be higher if the order is handled as a sequence
of trades, it appears that the warning and special quotes also impede
informationally based price adjustments.
Two key findings concerning warning and special quotes may be
summarized as follows: First, the dynamic analysis suggests that orders
for which these quotes are activated have a higher information con-
tent. Second, the analysis of outcomes noted that special and warning
quotes are often hit by traders who are effectively bettering the pre-
vailing quote, a response which is rational if the order is judged to
have a lower information content. These two findings can be recon-
ciled if there is conditioning information available to participants not
captured in the present analysis.
One hypothesis involves the size of the order. It was noted in the
discussion of the institutional features of the TSE that the display termi-
nal at a member’s lead, office shows the size of the orders underlying
a warning or special quote. Thus, a trader who was part of the offer
side of the limit order book and was trying to decide whether or not
to hit a special bid could condition on the size of the special bid,
subject to the time limits imposed by the saitori. Economic consider-
ations suggest that the special bid would be more likely to be hit if it
were for a relatively small quantity. We do not observe the order sixes
and so cannot test this mechanism directly. We did, however, exam-
ine the total trade volumes of order sequences, classified according
to whether or not a special or warning quote was hit. The results did
not strongly support the conjecture that sequences with trades at the
special or warning quotes had relatively small sixes. The exact na-
873
ture of the conditioning information therefore remains an open ques-
tion.
Trades and quotes: the limit order book after a trade
In many markets, it is possible for the quote setter to condition the
bid and offer on the full size of the incoming trade. This is trivially
the case when trade size is restricted to a single magnitude, but also
obtains when a single market maker quotes a price schedule. Many
theoretical models, including Glosten and Milgrom (1985) and Easley
and O’Hara (1987) conform to this structure. There are also, on the
other hand, many markets in which the quote setter or limit-order
trader does not know the full size of the trade that triggers the order.
When the quotes derive from a limit order book with many traders, a
limit order may be executed in the process of filling an order of much
greater size. Rock (1994) and Glosten (1994) model markets of this
latter sort.
In these models when competitive quote setters know the full size
of the incoming trade, the equality of marginal revenue and marginal
cost holds for each trade size. The marginal revenue associated with
a dealer sale, for example, is equal to the marginal cost (the expected
terminal value of the security conditional on the trade), and there is
no ex post regret. When the quote setter cannot condition on trade
size, however, the equality of marginal cost and revenue holds only in
expectation across all trade sizes. The equality between the marginal
revenue (the price received for the last share in the dealer sale) and
the revised expectation of the security value is broken. In principle,
this may lead to revisions in the order book subsequent to a trade
that better or worsen the quote. In the Paris CAC system, in particular,
Biais et al. (1994) find limit order cancellations subsequent to large
trades. On the TSE, however, while the quote setter cannot generally
condition on the total size of the trade, this may be possible when the
trade is represented as a warning or special quote.
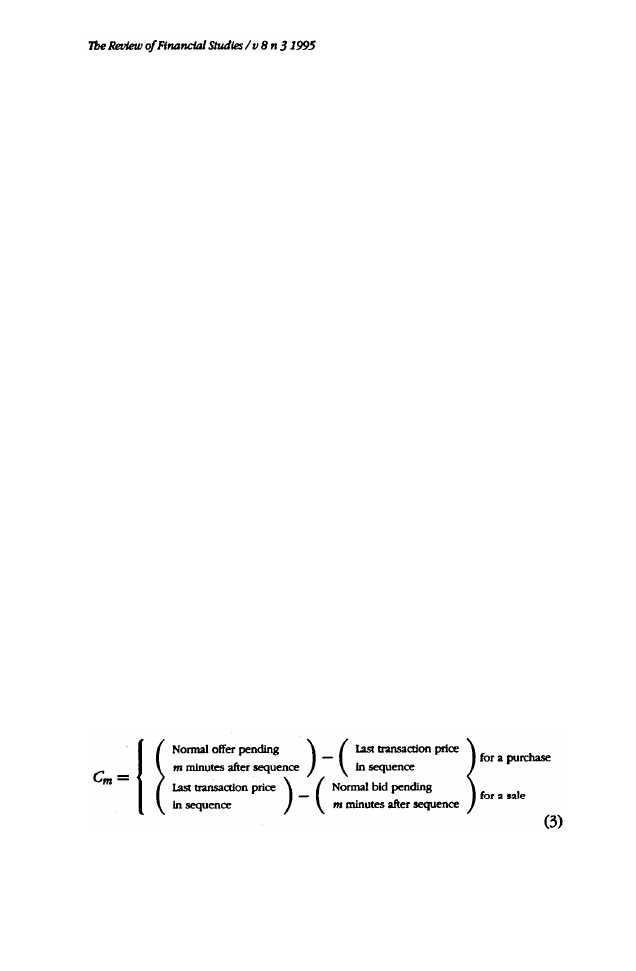
To investigate posttrade quote revisions, we define the price quote
continuation after m minutes for a buyer-initiated order sequence as
Signed in this fashion, C is positive for a purchase if the revised
offer is higher than the last transaction price, and negative if there is a
874
quote reversal. The definition is symmetric for a seller-initiated order
sequence. We compute variants of C where the bid and offer quotes
employed are those prevailing 1, 5, and 10 minutes after the trade.
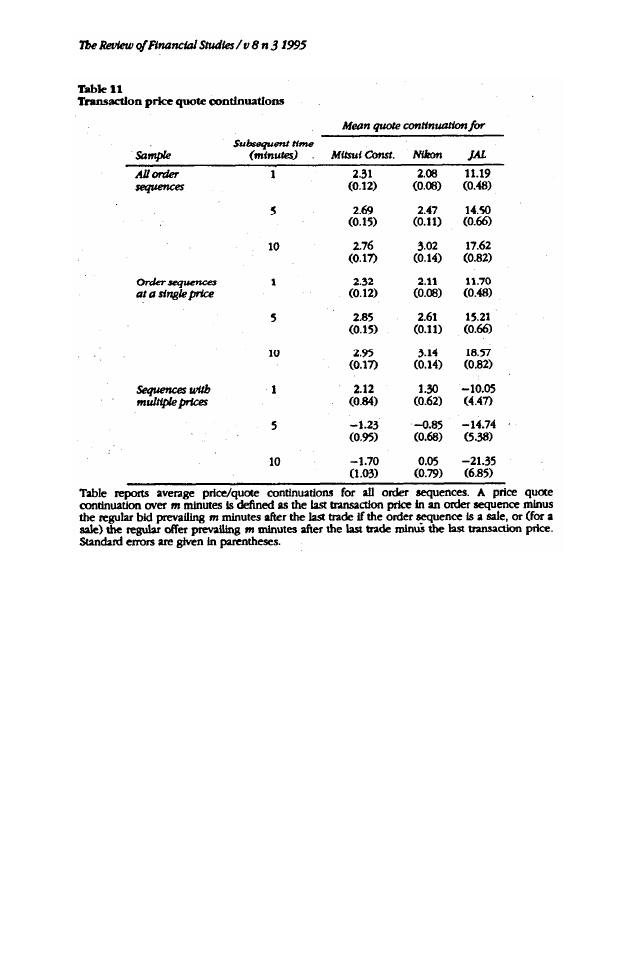
Table 11 presents means and mean standard errors for the con-
tinuations for all order sequences. For each firm, continuations are
positive and statistically significantly. This suggests that quotes de-
teriorate with the passage of time subsequent to a trade. This is in
part due to cancellation of limit orders that establish the best quote.
Immediately after a transaction, the stock is automatically requoted.
We examined quote revisions that occurred pursuant to these. In 134
instances a quote revision was the first event (ignoring the automatic
requoting) after an order sequence that involved a trade. In 106 of
these cases the quote deteriorated, presumably as a result of cancel-
lations. That quote deterioration is sometimes observed subsequent
to the completion, of such order sequences, but never in the face of
warning quotes issued while the sequence is in progress, suggests
that cancellation may be difficult in the latter case. Overall, quote re-
visions in the absence of intervening trades are relatively infrequent.
The continuations in Table 11 are also likely to result from the afore-
mentioned positive autocorrelation in the order flow. A trade in one
direction is likely to be followed by another that will cause additional
movement in the quote.
We also categorized the quote continuations according to whether
or not the transaction(s) in the sequence took place at a single price.
The sequences that are executed at multiple prices are precisely those
that stem from orders working through the book. The results here are
more ambiguous. Orders filled at a single price exhibit continuations.
Those filled at multiple prices tend to exhibit reversals (statistically
significant only in the case of JAL). This suggests that liquidity may
be restored subsequent to large trades.
5. Conclusions
This article investigates the properties of intraday trades and quotes
on the TSE. In comparison with most of the worlds other principal
equity markets, the TSE is distinctive in the absence of dealers. In
addition, the TSE employs price limits and order handling procedures
that delay adjustment in quotes and invite liquidity suppliers.
We examine three stocks with average trading volume in the top
third of TSE first section issues for the first 3 months of 1990, a rela-
tively volatile period. For these firms, the supply of public liquidity is
good. Ignoring opening delays, hypothetical small buy or sell orders
would be prevented from immediately executing (due to the absence
of an acceptable opposing quote) less than 5 percent. of the time that
875
the TSE is nominally open. Under TSE procedures, transactions that
would otherwise walk through the limit order book at a succession
of deteriorating prices are held, and indicative (‘special” or “warn-
ing”) quotes are issued. Roughly one-fifth of the time, these indicative
quotes are hit by competing providers of liquidity, obtaining some
price improvement for the original order.
A dynamic VAR analysis of trades and quote revisions suggests that,
holding order size constant, an order that is held with an indicative
quote has a larger cumulative price impact than one that is imme-
diately executed in full. This suggests that the price limits do not
merely smooth transient liquidity effects, but are also associated with
changes in the market depth. Finally, after a market order is executed,
the quote hit by the market order generally tends to continue to move
in the same direction. This is due in part to order autocorrelation and
in part to the cancellation of limit orders; This last effect is consistent
with the behavior of traders on the Paris CAC system described by
876

Biais et al. (1994) and suggests asymmetric information effects within
the limit order book.
References
Admati, A. R., and P. Pfleiderer, 1988, “A Theory of Intraday Patterns: Volume and Price Variability.”
Review of Financial Studies, 1, 3-40.
Amihud, Y., and H. Mendelson, 1989, “Market Microstructure and Price Discovery on the Tokyo
Stock Exchange,” Japan and the World Economy, 1, 341-370.
Amihud, Y., and H. Mendelson, 1991, “Volatility, Efficiency and Trading: Evidence from the
Japanese Stock Market,” Journal of Finance, 46, 1765-1789.
Amihud Y., and H. Mendelson, 1993, “Liquidity, Trading Costs and Asset Prices: Implications for
Japan,” in I. Walter and T. Hiraki (eds.), Restructuring Japan's Financial Markets, Business One
Irwin, Homewood, Ill.
Biais, B., P. Hillion, and C. Spatt, 1994, “An Empirical Analysis of the Limit Order Book and the
Order Flow in the Paris Bourse,” forthcoming in Journal of Finance.
Easley, D., and M. O’Hara, 1987. “Price, Trade Size, and Information in Securities Markets,” Journal
of Financial Economics, 19, 69-90.
Foster, F. D., and S. Viswanathan, 1990, “A Theory of the Interday Variations in Volumes, Variances
and Trading Costs in Securities Markets,” Review of Financial Studies, 3, 593-624.
Foster, F. D., and S. Viswanathan, 1993, “Variations in Trading Volume, Return Volatility and
Trading Costs: Evidence on Recent Price Formation Models,” Journal of Finance, 48, 187-211.
George, T. J., and C.-Y. Hwang, 1994, “Transitory Price Changes and Price-Limit Rules: Evidence
from Tokyo Stock Exchange,” working paper, Ohio State University.
Glosten, L R., 1994, “Is the Electric Open Limit Order Book Inevitable?,” Journal of Finance,
49, 1127-1161.
Glosten, L R., and P. R. Milgrom, 1985, “Bid, Ask and Transaction Prices in a Specialist Market
with Heterogeneously Informed Traders,” Journal of Financial Economics, 14, 71-100.
Hamao, Y., 1991, “A Standard Data Base for the Analysis of Japanese Security Markets,” Journal
of Business, 64, 87-102.
Hamao, Y., 1992, “Tokyo Stock Exchange,” in P. Newman, M. Milgate, and J. Eatwell (eds.), The
New Palgrave Dictionary of Money and Finance, Macmillan Press, London.
Harris, L. E., 1986, “A Transactions Data Study of Weekly and Intradaily Patterns in Stock Returns,”
Journal of Financial Economics, 16, 99-117.
Harris, L. E., 1989, “A Day-End Transaction Price Anomaly,” Journal of Financial and Quantitative
Analysis, 24, 29-45.
Hasbrouck, J., 1991a, ”Measuring the Information Content of Stock Trades,” Journal of Finance,
46, 179-207.
Hasbrouck, J., 1991b, “The Summary Informativeness of Stock Trades: An Econometric Analysis,”
Review of Financial Studies, 4, 571-595.
Hasbrouck, J., 1993, “Assessing the Quality of a Security Market: A New Approach to Transaction
Cost Measurement,” Review of Financial Studies, 6, 191-212.
877
Hasbrouck, J., and T. S. Y. Ho, 1987, “Order Arrival, Quote Behavior and the Return Generating
Process,” Journal of Finance, 42, 1035-1048.
Jain, P., and G. Joh, 1988, ”The Dependence Between Hourly Prices and Trading Volume,” Journal
of Financial and Quantitative Analysis 23, 269-283.
Japan Securities Research Institute, 1992, Securities Market in Japan
Kato, Kiyoshi, 1990, “Weekly Patterns in Japanese Stock Returns,” Management Science, 36, 1031-
1043.
Lehmann, B. N., and D. M. Modest, 1994, “Trading and Liquidity on the Tokyo Stock Exchange:
A Bird’s Rye View,” Journal of Finance, 44, 951-984.
Lindsey, R. R, and U. Schaede, 1992, “Specialist vs Saitori: Market Making in New York and
Tokyo,” Financial Analysis Journal, 48, 48-57.
McInish, T. H., and R. A. Wood, 1992, “An Analysis of Intraday Patterns in Bid/Ask Spreads for
NYSE Stocks,” Journal of Finance, 47, 753-764.
Mulherin, J. H., and M. S. Gerety, 1989, “Intraday Trading Behavior in Securities Markets: Hourly
NYSE Volume and Returns, 1933-1988,” working paper, U.S. Securities and Exchange Commission.
Rock, K., 1994, “The Specialist's Order Book and Price Anomalies,” forthcoming in Review of
Takagi, S., 1593, “The Organization and Microstructure of the Secondary Stock Market in Japan,
in S. Takagi (ed.), Japanese Capital Markets, Basil Blackwell, Cambridge, Mass.
Tokyo Stock Exchange, 1993a, Teikan-tou Shokisoku Shu (Constitution and Rules) (in Japanese).
Tokyo Stock Exchange, 1993b, Shokisoku Naiki Shu (Rules and Internal Regulations) (in Japanese).
Tokyo Stock Exchange, 1993c, TSE Fact Book
Wood, R. A., T. H. McInish, and J. K. Ord, 1985, “An Investigation of Transactions Data for NYSE
Stocks,” Journal of Finance. 40, 723-739.
878
Wyszukiwarka
Podobne podstrony:
2012 vol 07 Geopolitics and energy security in the Caspian region
Fishea And Robeb The Impact Of Illegal Insider Trading In Dealer And Specialist Markets Evidence Fr
Mettern S P Rome and the Enemy Imperial Strategy in the Principate
Applications and opportunities for ultrasound assisted extraction in the food industry — A review
Aftershock Protect Yourself and Profit in the Next Global Financial Meltdown
A Guide to the Law and Courts in the Empire
Functional improvements desired by patients before and in the first year after total hip arthroplast
D Stuart Ritual and History in the Stucco Inscription from Temple XIX at Palenque
Greenshit go home Greenpeace, Greenland and green colonialism in the Arctic
Civil Society and Political Theory in the Work of Luhmann
The?lance in the World and Man
Catcher in the Rye, The Book Analysis and Summary
Spanish Influence in the New World and the Institutions it I
Gender and Racial Ethnic Differences in the Affirmative Action Attitudes of U S College(1)
Kundalini Is it Metal in the Meridians and Body by TM Molian (2011)
Mutations in the CgPDR1 and CgERG11 genes in azole resistant C glabrata
keohane nye Power and Interdependence in the Information Age
54 767 780 Numerical Models and Their Validity in the Prediction of Heat Checking in Die
więcej podobnych podstron