
R E S E A R C H
Open Access
Inflammation-associated enterotypes, host
genotype, cage and inter-individual effects
drive gut microbiota variation in common
laboratory mice
Falk Hildebrand
1,2
†
, Thi Loan Anh Nguyen
1,2,3,4
†
, Brigitta Brinkman
5,6
, Roberto Garcia Yunta
1,2
, Benedicte Cauwe
3,4
,
Peter Vandenabeele
5,6
, Adrian Liston
3,4
†
and Jeroen Raes
1,2*
†
Abstract
Background: Murine models are a crucial component of gut microbiome research. Unfortunately, a multitude of
genetic backgrounds and experimental setups, together with inter-individual variation, complicates cross-study
comparisons and a global understanding of the mouse microbiota landscape. Here, we investigate the variability of
the healthy mouse microbiota of five common lab mouse strains using 16S rDNA pyrosequencing.
Results: We find initial evidence for richness-driven, strain-independent murine enterotypes that show a striking
resemblance to those in human, and which associate with calprotectin levels, a marker for intestinal inflammation.
After enterotype stratification, we find that genetic, caging and inter-individual variation contribute on average
19%, 31.7% and 45.5%, respectively, to the variance in the murine gut microbiota composition. Genetic distance
correlates positively to microbiota distance, so that genetically similar strains have more similar microbiota than
genetically distant ones. Specific mouse strains are enriched for specific operational taxonomic units and
taxonomic groups, while the
‘cage effect’ can occur across mouse strain boundaries and is mainly driven by
Helicobacter infections.
Conclusions: The detection of enterotypes suggests a common ecological cause, possibly low-grade inflammation
that might drive differences among gut microbiota composition in mammals. Furthermore, the observed
environmental and genetic effects have important consequences for experimental design in mouse microbiome
research.
Background
An accumulating body of evidence supports the central
role of the intestinal microbiota in maintaining its host
’s
health. Dysbiosis of the gut microbiota is linked to
many chronic disorders [1], such as inflammatory bowel
disease [2-4], obesity [5-7], rheumatoid arthritis [8],
autoimmune encephalomyelitis [9,10], type 1 [11,12] and
type 2 diabetes [13], and allergic diseases [14].
The gut flora composition is known to vary among
healthy individuals [15-18], along the intestinal tract
[19-21], and over time [22,23]. Although the factors
influencing the species composition and functionality of
the healthy gut flora are still being revealed, food
[24-26], drug uptake [14,27], inoculation at birth [28,29],
host genetics [6] and as yet unknown environmental fac-
tors all seem to play a role [30]. Concomitantly, the
intestinal microbiota plays an important role in shaping
the host
’s immune system [8,31,32] and physiology
Due to limitations of human research, the details behind
many of these processes are still unknown. Therefore,
murine models have become crucial in gut microbiota
research for gaining mechanistic insights into gut flora
establishment and upkeep. Such models can be used to
investigate the effects of food and drug uptake or the
interplay between host and microbiota, demonstrating
* Correspondence: jeroen.raes@vib-vub.be
† Contributed equally
1
Department of Structural Biology, VIB, Pleinlaan 2, 1050 Brussels, Belgium
Full list of author information is available at the end of the article
Hildebrand et al. Genome Biology 2013, 14:R4
http://genomebiology.com/2013/14/1/R4
© 2013 Hildebrand et al.; licensee BioMed Central Ltd. This is an open access article distributed under the terms of the Creative
Commons Attribution License (http://creativecommons.org/licenses/by/2.0), which permits unrestricted use, distribution, and
reproduction in any medium, provided the original work is properly cited.

causality in disease and therefore the relevance of these
model systems [34-37]. Knock-out and transgenic models
have shown that host genes can influence the microbiota
composition [38-41], have given insights into signaling
cascades that mediate microbiome-host interactions
[31,32,42,43] and enabled the study of the interplay
between host physiology and microbiota composition
[44-46].
However, various confounding factors can hamper the
interpretation and comparison of community shifts in
rodent model research. Among these are cage effects
[47,48], inter-individual variation [22,49], genetic back-
ground [50-52] and maternal effects [50,52,53]. Here, we
present data regarding the relative contribution of cage
effects, genetic background and inter-individual variation
to the murine microbiota in laboratory mice in a mixed
co-housing design. Using 16S rDNA pyrosequencing-
based profiling, we determined the baseline species com-
position of five different strains, investigated enterotype
stratification and quantified the relative contribution of
genetic and environmental effects to the overall variation
of the murine gut microbiota. Finally, we discuss the con-
sequences of our findings for the experimental design of
microbiota studies in murine disease models.
Results
Experimental set up
To study inter-individual variation and the influence of
genetic and environmental components on gut micro-
biota composition, we investigated the flora of five
mouse strains commonly used in biomedical research:
four inbred (Balbc, B6, FVB and non-obese diabetic
(NOD)) and one out-bred strain (Swiss). Five female
mice (one from each strain) were co-housed together for
3 weeks after weaning, and this setup was replicated ten
times. The 3-week period of co-housing aimed at mini-
mizing the effects of parent cages from which the mice
came from. Furthermore, we investigated the impact of
sex by a weekly transfer of used bedding from each cage
of female mice to a corresponding cage housing a male
B6 (one per cage; ten replicates) to replicate the environ-
mental conditions without direct physical contact. After
the co-housing period, mice were sacrificed and DNA
was extracted from the cecal content. The V3-V5 variable
region of 16Sr RNA genes was amplified by PCR [54-56]
(see Materials and methods) and the amplicons were
sequenced using 454 pyrosequencing.
Bimodal distribution in mouse microbiome composition:
evidence for two enterotypes with significantly different
species richness across investigated mouse strains
For the majority of the samples, Firmicutes (58.64 ±
23.53%) and Bacteroidetes (35.21 ± 19.0%) were the two
main phyla that dominated the gut community (Additional
file 1). Other phyla such as Verrucomicobia, Proteobac-
teria and Tenericutes together comprised, on average, less
than 5% of total community composition, in line with pre-
vious reports [5,57]. Our initial sample clustering showed
a strong sample separation into two separate clusters
(Figure 1a; Additional file 2), with multiple genotypes
occurring in each cluster. Both male and female mice were
found in each cluster and the male/female ratio was not
significantly different between the smaller (0.2) and the
larger cluster (0.16) (P = 1, Fisher
’s exact test). No signifi-
cant association between clusters and cages was found
(P = 0.701, permuted Fisher
’s exact test; Additional file 3).
Not all mouse strains were represented in the smaller clus-
ter: NOD and FVB did not have any individuals in the sec-
ond cluster. Given our sample size, however, it could not
be determined if this absence was a true biological trend
or was due to random chance.
Given the similarity to the enterotypes found in the
human population [16], we tested whether the two clus-
ters fitted the criteria used in the original study. The
optimal cluster number was found to be two by both
the Calinski-Harabasz (CH) index as well as silhouette
score, independent of distance metric used (Additional
file 4); the silhouette score (ranging from 0.6 to 0.825 at
all levels except the operational taxonomic unit (OTU))
indicates strong evidence for independent clusters [58]
and the density of individual mice along the first non-
metric multidimensional scaling (NMDS) axis shows a
bimodal distribution (Figure 1b), with possibly 3 of 60
samples being intermediate. This was further confirmed
using two additional optimal cluster score algorithms:
Baker and Hubert Gamma and Davies-Bouldin
’s index
(Additional file 5). Additionally, we tested several differ-
ent clustering algorithms, including k-means clustering,
as well as average, single, ward and complete hierarchi-
cal clustering, all pointing to two optimal clusters (Addi-
tional file 5). To further assess the robustness of these
clusters, we randomly (i) jackknifed the samples and (ii)
resampled the taxonomic assignments 500 times, and
could recover in 100% of cases two clusters using the
Silhouette index under all tested conditions. The only
exception to this was that the CH index showed a weak
possibility for three clusters using the Bray-Curtis dis-
tance (weighted Unifrac and Jensen-Shannon distance
gave two as the optimal number of clusters (CH index) in
> 98% of cases; Additional file 6). Taxonomic resampling
showed that the three intermediate points (Figure 1b)
can switch their cluster identity, possibly also explaining
the (weak) support for three clusters in some settings.
One of the two clusters showed a significantly lower
richness and diversity compared to samples in the other
cluster (Figure 1c), reminiscent of recent reports of
diversity differences between enterotype-like subpopula-
tions in a human cohort [59]. In addition, we found that
Hildebrand et al. Genome Biology 2013, 14:R4
http://genomebiology.com/2013/14/1/R4
Page 2 of 15
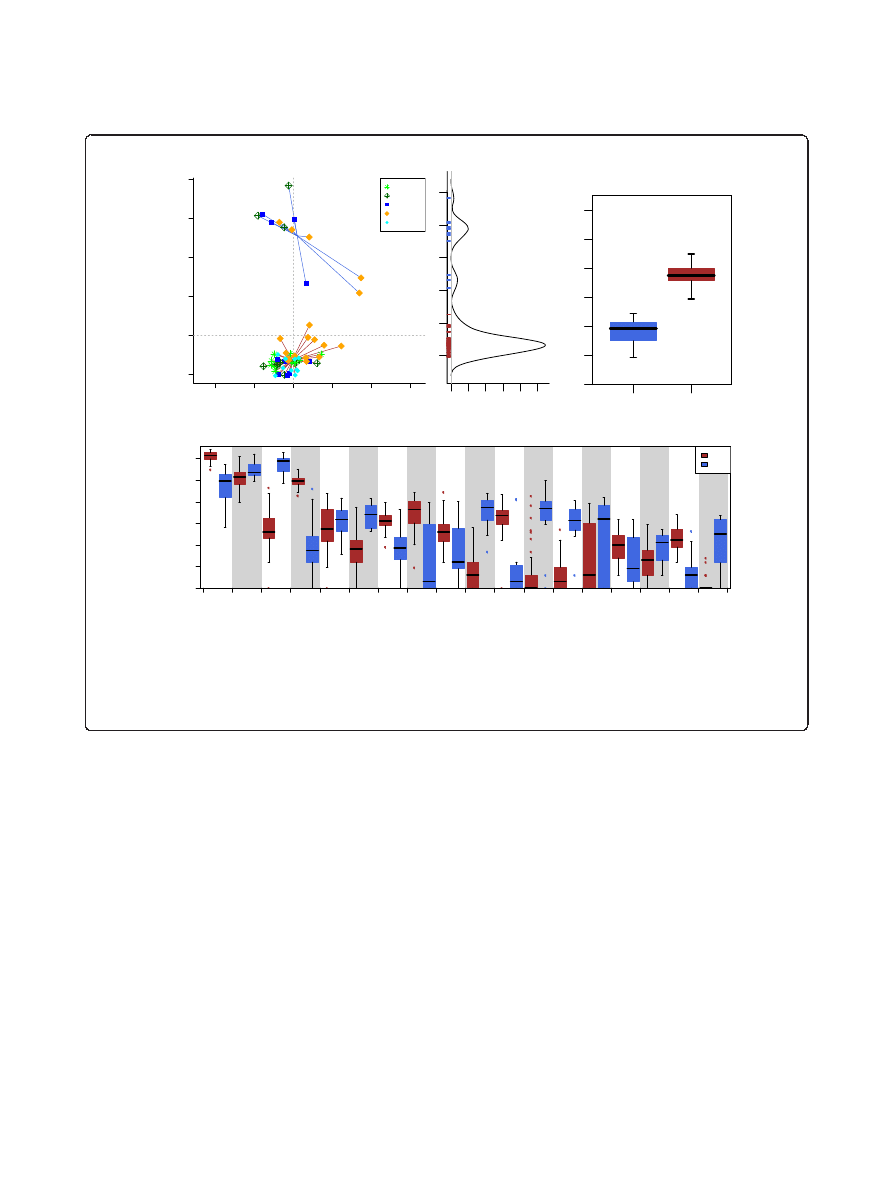
in the smaller low-richness cluster, the proportion of
Firmicutes was largely reduced (from an average of 68.9%
to 17.5%) while Bacteroidetes (27.4% to 65.6%) and Pro-
teobacteria (1.6% to 12.5%) were highly increased. All
these changes were strongly significant (Additional file 7).
The most affected families from the decrease in Firmicutes
were Lachnospiraceae and Ruminococcaceae (Figure 1d),
which contributed 43.8% and 11.4%, respectively, of the
total composition. By contrast, in the low richness sam-
ples, multiple families of Proteobacteria were significantly
increased in their abundance (P < 0.05 and q < 0.1),
including Enterobacteriaceae. The other two families also
found to be strongly enriched were Porphyromonadaceae
and Bacteroidaceae, both of which are generally dominant
members of the murine gut microbiota (on average 20.3%
and 8.4% of the overall community, respectively). These
compositional and community structure properties of the
two detected clusters, enterotype 1 (ET1) and enterotype 2
(ET2), are strikingly similar to those of the Ruminococcus
and Bacteroides enterotype found in human populations,
respectively [16].
Enterotypes associate with low-grade inflammation
To further investigate the biological reasons behind this
clustering, we assessed the level of intestinal inflammation
using calprotectin levels in their cecal content [60,61].
Mice in the low richness group had significantly increased
fecal calprotectin levels (P = 4.9 × 10
-5
, Wilcox rank sum
test) compared to the high richness samples (Figure 2).
Calprotectin levels were significantly negatively correlated
to Lachnospiraceae, Rikenellaceae, Ruminococcaceae as
well as Prevotellaceae, while the positive correlation to Bac-
teroidaceae, Verrucomicrobiaceae, Enterobacteriaceae and
Burkholderiales was significant (Additional file 8). The low
richness mice showed no obvious signs of inflammation or
disease, suggesting a low grade inflammatory condition.
8
8
8
88
8
8
8
8
8
8
8
88
8
8
8
8
8
8
8
8
8
8
8
8
888
8
8
(+
(+
!
!
"
#
$"
%
"
$
&
!"
"
'"
#
$"
("
)))
))
)))
)))
)))
)))
)))
))
)))
)))
)))
)))
)
))
)))
)))
#
*+,(
(+
(+
-.
-
.
-
.
/
01##23.45
01##2/645
7&
9
:;
0*#
# 01##
Figure 1 Enterotype clusters detected in the data. (a) Nonmetric multidimensional scaling (NMDS) at the genus level shows two clusters in the
dataset. (b) The density of the first NMDS axis that explains most of the variation (92.5%) and shows a bimodal distribution with only few intermediate
samples. (c) The operational taxonomic unit (OTU) richness estimate (chao1) between these two clusters differs substantially and (d) the two clusters
are dominated by different taxa, with enterotype 2 being dominated by Bacteroidetes and Enterobacteriaceae and enterotype 1 being driven by
Runinococcus and Lachnospiraceae. Significances are shown by asterisks: *q < 0.1 and P < 0.05; ** q < 0.05; ***q < 0.01.
Hildebrand et al. Genome Biology 2013, 14:R4
http://genomebiology.com/2013/14/1/R4
Page 3 of 15
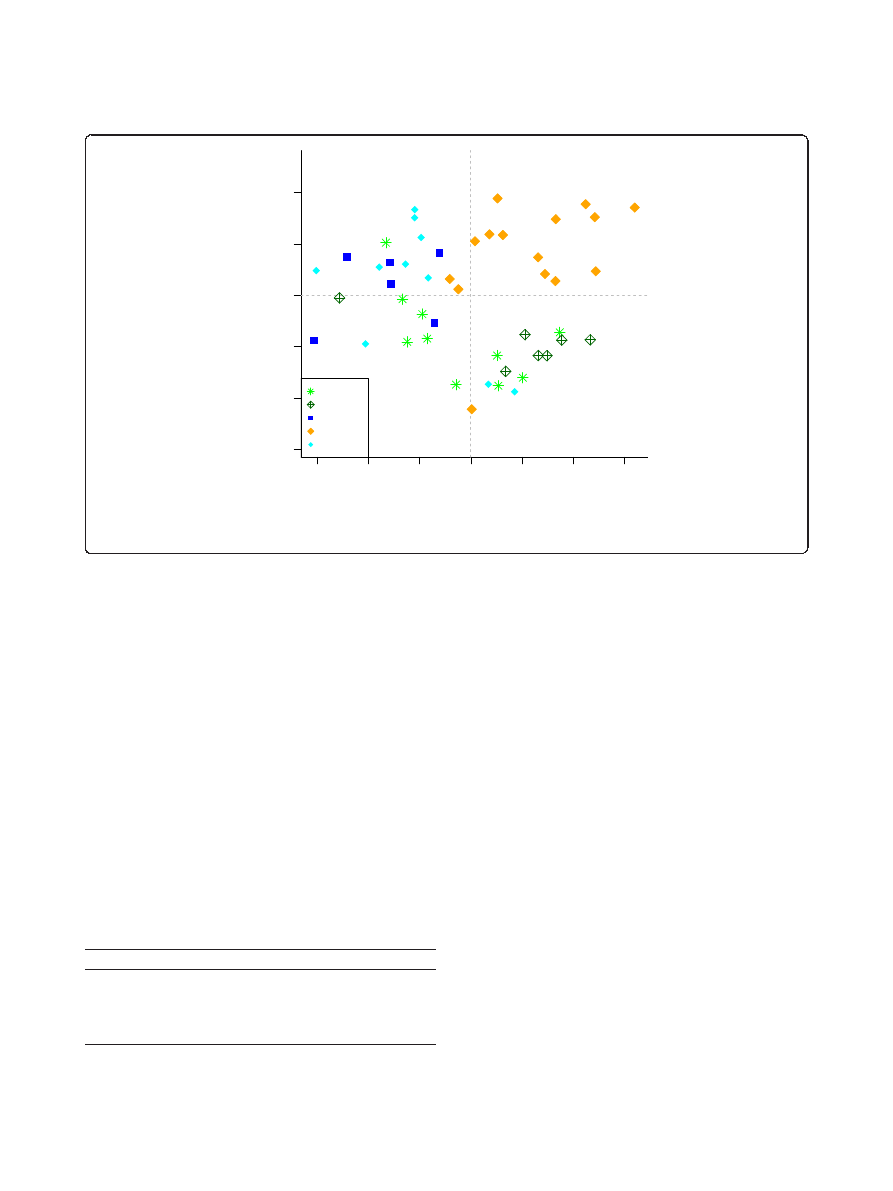
After enterotype stratification, genetic, cage and inter-
individual variation effects contribute on, average, 19%,
31.7% and 45.5% to the variance in the murine gut
microbiota composition, respectively
To further investigate the effect of the host
’s genetic and
environmental properties on microbiota composition, we
stratified our population according to the two enterotypes
described above and focused on the largest group (ET1).
The overall community composition was significantly asso-
ciated with both genetic and cage effects, as tested by PER-
MANOVA (P = 2 × 10
-7
and P = 2 × 10
-7
, respectively, on
the OTU level; Table 1). A NMDS ordination was used to
visualize these effects. At the phylum level the mice formed
approximate clustering according to their genotype, as
shown in Figure 3. Visually inspecting ordinations on dif-
ferent taxonomic levels revealed that the strength of geno-
type-associated clustering decreased with more fine-
grained taxonomic levels, while the significance of the cage
effect increased concomitantly (Table 1; Additional file 9).
These trends were further confirmed using distance-based
redundancy analysis (dbRDA, Additional file 10). Compar-
ing the gut microbiota of male and female B6 mice
revealed that there was no significant sex effect observed in
our bedding-exchange design (P = 0.12; Table 1).
Next, we determined the percentage of variance that
can be explained by both genetic background and cage
effects at different taxonomic levels using variation parti-
tioning (see Materials and methods; Table 2). Also here,
a decreasing fraction of the variance could be explained
by genotype when going from phylum (26.55%) to OTU
(15.65%) level. Conversely, cage effects showed an oppo-
site trend, with higher variation explained at low levels
such as OTU, genus, family and class (above 31%) and
the smallest effect at the phylum level (22.6%). Overall,
Figure 2 Calprotectin concentration (ng/ml) in enterotype 1 (ET1) and enterotype 2 (ET2). An elevated concentration of calprotectin was
found in Bacteroidetes dominant enterotype (ET2) (P = 4.9 × 10
-5
, Wilcox rank sum test).
Table 1 PERMANOVA test for significance of factors
contributing to overall differences in microbiota
composition
Phylum
Class
Family
Genus
OTU
Genotype
2.00E-07
2.00E-07
2.00E-07
2.00E-07
2.00E-07
Cage
0.0238
5.08E-05
7.26E-05
6.20E-06
2.00E-07
Sex
0.44
0.2972
0.3003
0.3926
0.2456
Sex_block
0.374
0.09805
0.1091
0.2072
0.05531
Genotype and cage were significantly associated with differences in
microbiota composition whereas sex did not have an effect. Note that only B6
mice were used to test for sex effects as we only had females and males from
B6. We repeated the PERMANOVA test for the complete dataset, using
genotype in a blocked design to test for sex effects (sex_block). We used 5 ×
10
7
permutations to calculate the significances.
Hildebrand et al. Genome Biology 2013, 14:R4
http://genomebiology.com/2013/14/1/R4
Page 4 of 15
these results show that both host genetic and cage effects
have a strong influence on microbiota composition,
explaining, on average, 19% (genotype) and 31.34% (cage)
of the variation. The shared variation explained by geno-
type and cage effects was small (from 1.35% to 7%
explained variance) compared to the influence of genotype
or cage effects alone, suggesting independent effects on the
microbiota composition. Stochastic and inter-individual
effects still contributed the largest part to the variation that
drives differences between the murine microbiome,
explaining from 42.1% to 51.13% of the variation when
stratifying for enterotypes. If the variation explained
between cage, genotype as well as enterotype is calculated,
enterotype explains the largest part of the variation (25 to
27%) on most taxonomic levels (Additional file 11).
In addition, we tested if the within-strain variability dif-
fered between strains. However, there was no significant
difference on any taxonomic level (Additional file 12).
Thus, it appears that within-strain variation is compar-
able irrespective of the genotype.
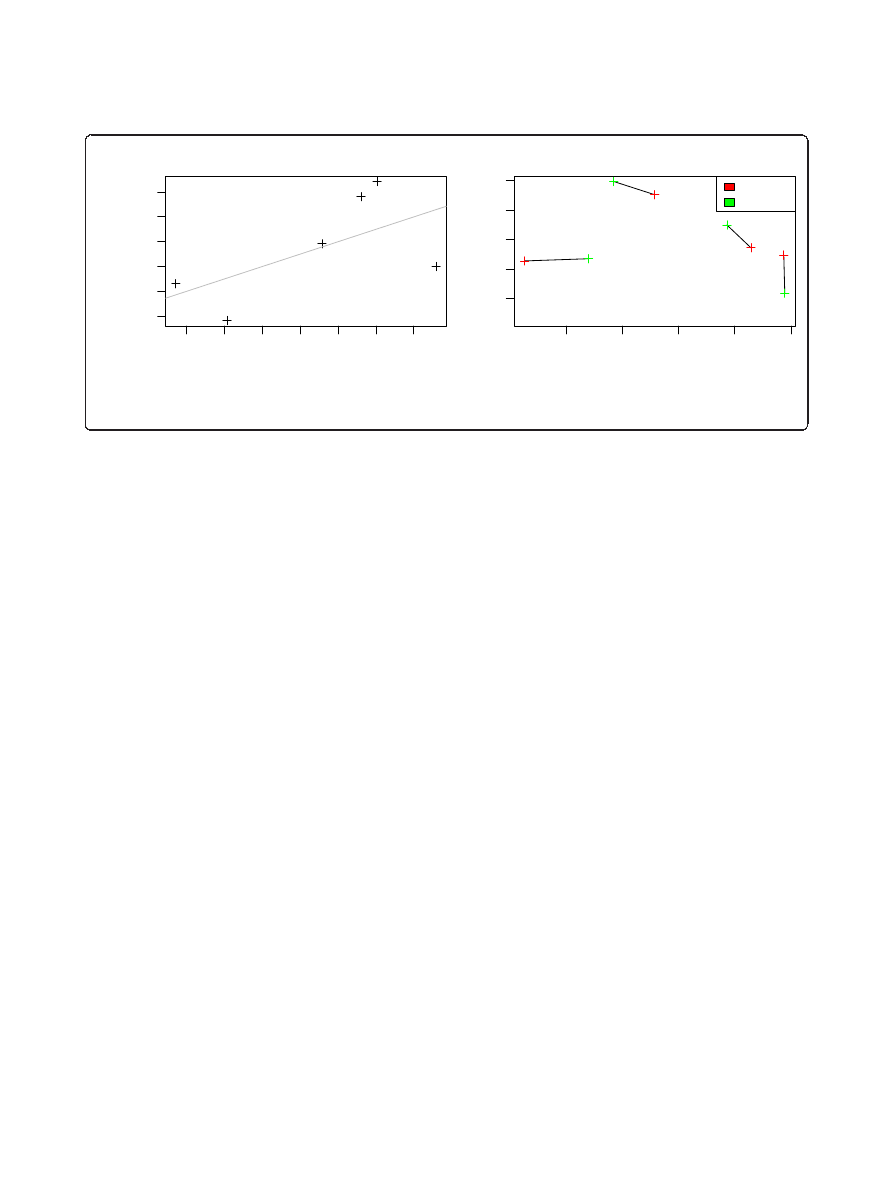
Positive association between genetic distance and
microbiota profile
We further investigated genotype-microbiota association
by correlating genetic distance to microbiome composition
of investigated mouse strains. A recent genetic analysis of
a broad range of laboratory mouse strains [62] included
four out of five strains used in this study (B6, Balbc, FVB
and NOD). Based on these data, we found a significant
positive association between genetic distance and the aver-
age microbiota distance at the phylum level (rho = 0.606,
P
= 0.037; Figure 4) and genus level (rho = 0.65, P =
0.042), which confirms the presence of a genetic effect on
gut microbiota composition.
The pattern of different levels of similarity between
the individual strains was further investigated using a
PERMANOVA post hoc test. Generally speaking, most
strains were significantly different at all phylogenetic
levels, except for Swiss and NOD (all levels), FVB and
Balbc (only significant at the OTU level) and Swiss and
FVB (only significant at the phylum and OTU levels;
Additional file 13). This result reflects the phylogenetic
relationship of mice found in [62], in which FVB and
Balbc were very similar to each other whereas other
groups were more distant (for example, FVB versus B6).
When investigating alpha diversity patterns, we
observed significant OTU richness differences between
!
Figure 3 NMDS plot of enteroype 1 stratified sample set at the phylum level. Samples are colored by mouse genotypes and the percent
of variation explained by each axis is indicated in parentheses.
Table 2 The percentage of variation explained by factors
influencing microbiota composition
Phylum
Class
Family
Genus
OTU
Genotype
26.55
18.62
18
16.64
15.65
Genotype and cage
7.01
4.61
3.73
3
1.35
Cage
22.6
34.68
32.39
35.17
31.87
Other
43.84
42.1
45.88
45.18
51.13
’Genotype and cage’ denotes variation explained by both factors. ‘Other’
implies all variations that could not be unaccounted for. These data were
stratified for the larger enterotype. Genotype and cage effects were significant
at all phylogenetic levels.
Hildebrand et al. Genome Biology 2013, 14:R4
http://genomebiology.com/2013/14/1/R4
Page 5 of 15
the genotypes (P = 0.0263), but no significant differ-
ences between cages could be detected (P = 0.269). FVB
showed the lowest OTU richness while NOD had the
highest richness of all strains. In line with this, Chao1
richness estimates were significantly different between
genotypes (P = 0.011), but not between cages (Addi-
tional file 14). In a post hoc test the differences between
FVB and Swiss, NOD and Balbc were significant after
multiple testing (P < 0.01, q < 0.04). However, estimates
of diversity (which also takes into account community
structure) showed no significant differences between
either genotypes or cages.
Bacterial genera driving differences between genotypes
and cages: identification of
Helicobacter as an important
driver of cage effects
To further understand the genetic and environmental
effects on microbiota composition, we studied the phylo-
genetic profiles of the different strains and cages in more
detail. Figure 5 shows the groups that were significantly
different between genotypes (P < 0.05, q < 0.1; Additional
file 15). Akkermansia (0.56% of total composition versus
0.025 on average in other strains), Lactobacillus (2.6% ver-
sus 1.67%) and Mucispirillum (0.59% versus 0.34%) were
enriched in B6 mice, whereas only Mucispirillum (0.65%
versus 0.33%) was overrepresented in Balbc mice. Desulfo-
vibrio
was significantly increased in FVB and Swiss mice
(0.10% and 0.11% versus 0.03%). On the other hand, Swiss
mice showed higher levels of Anaeroplasma (1.30%),
Lactobacillus
(2.84%) and Desulfovibrio (0.11%) but
showed a significant reduction in Mucispirillum (0.14%)
compared to B6, Balbc and FVB (average of 0.18%, 1.25%,
0.5% and 0.51%, respectively; Additional file 16). One
notion from this comparison was that NOD and Swiss
mice were similar throughout these comparisons, and this
corresponds to the results of the multivariate analysis
showing no strong differences between NOD and Swiss
mice. Interestingly, Akkermansia, a well-known mucin
degrader [63], could not be detected in NOD and Swiss
mice but was very abundant in B6 (Figure 5a). Finally,
although NOD mice are known to develop spontaneous
diabetes and were expected to have different microbiota
composition, we did not see very striking NOD-specific
microbiota shifts in this study.
Additional file 17 lists taxonomic groups that were
significantly different among cages. Several Bacteroidetes
subgroups (Sphingomonas, unclassified Parabacteroides,
unclassified Prevotellaceace, unclassified Porphyromona-
daceae and Sporobacter) as well as an unclassified Pro-
teobacteria group seemed to be linked to the cage effect
but did not withstand multiple testing correction (P <
0.05, q > 0.1). The only significantly different genus
between cages was Helicobacter (Kruskal-Wallis test P =
0.00021 and q = 0.0097), a well-known and fast spread-
ing species in mouse facilities [64] that was overrepre-
sented in five out of ten cages studied (Figure 5b).
Helicobacter
levels varied on average by 0.011% to 2.15%
among cages. The abundance of Helicobacter was not
significantly different between genotypes (P = 0.56) nor
was it different among the two enterotypes described
above (P = 0.053). At the OTU level, five OTUs were
significantly different between cages; three belonged to
Porphyromonadaceae
; Helicobacter and Sphingomonas
had one representative each (Figure 5b).
To determine the contribution of Helicobacter to the
total cage effect, we artificially removed all Helicobacter
OTUs from the data. From this we could derive that
Helicobacter
contributed approximately 6% to the total
variation between cages at the genus level. However, at
higher taxonomic levels (family and class) the percen-
tage of variance solely explained by Helicobacter
increased to 10% and 13%, respectively. PERMANOVA
!
!
"
Figure 4 The genetic distance between mouse strains is significantly correlated to phylum level microbiota distances. A Procrustes
superimposition of the NMDS of both data types shows a clear association between mouse genotypes and microbiota composition. The P-value
is calculated separately with a Mantel test.
Hildebrand et al. Genome Biology 2013, 14:R4
http://genomebiology.com/2013/14/1/R4
Page 6 of 15
results confirmed that the cage effect was only signifi-
cant at the genus and OTU levels (Additional file 18) if
Helicobacter
was removed from the data. The removal
of Helicobacter OTUs had no effect on the significance
of the genotype effect.
Performing the univariate tests on 60 samples in a
blocked Kruskal-Wallis test using enterotype as a con-
founder instead of pre-stratifying gave largely the same
results (Additional file 19).
Discussion
In this study we compare the healthy mouse microbiome
of different common laboratory strains. We identified
two distinct enterotype-like subpopulations in our study
group, separated by richness and independent of strain
and cage. Stratifying for these two populations, we show
the impact of genetic versus environmental factors on
the murine gut microbiota.
The strongest signal separating our dataset is the pre-
sence of two enterotype clusters, different in species com-
position and diversity, which were strongly supported
using multiple metrics and evaluation criteria. The phylo-
genetic composition is highly similar to two of the recently
described human enterotypes: the low richness cluster is
dominated by Bacteroidetes, while the high richness clus-
ter is dominated by Ruminococcaceae and several other
genera, which suggests that the two clusters found here
might overlap with the first and third human enterotype
and may possibly be influenced by the same ecological dri-
vers. Furthermore, these results agree with the observed
difference in diversity between Firmicutes- or Bacteroides-
dominated subgroups found in a human cohort [59].
(
(
(
&
$
)
'
*
+
,
-
(
(
(
(
((
(
(
(
((
(
(
(
(
&
&&.
'/&
01$
2,
!
"!
#"
!
"
$
%
&
Figure 5 Taxa differences between genotypes and cages. (a) Several genera are significantly different in abundance between genotypes,
with a cutoff of P < 0.05 and q < 0.1. (b) The significantly different OTUs between cages. On the y-axis log10 scaled rarefied 16S reads per
sample are shown. OTU identifiers refer to the following taxonomic assignments: 106 = Helicobacter; 596, 216, 133 = Porphyromonadaceae;
241 = Sphingomonas.
Hildebrand et al. Genome Biology 2013, 14:R4
http://genomebiology.com/2013/14/1/R4
Page 7 of 15

All these observations suggest that enteroype-like commu-
nity structures exist in laboratory mice and that their ecol-
ogy might be similar to that of the human microbiota,
despite the known gut microbial compositional differences
between human and mouse, suggesting that enterotypes
are possibly a universal feature across mammals.
As low species richness was observed in obese people
[6] and inflammatory bowel disease patients [65,66], in
which it was associated with inflammation signs in the
host, we suspected that the low richness observed here
might be linked to (low-grade) inflammation as other
confounding factors, such as diet [26], were accounted
for in this setup. Another indication came from a very
significant increase in Enterobactericeae in the low rich-
ness cluster, a group that has been associated with
induction of low grade inflammation through lipopoly-
saccharide [67]. Indeed, calprotectin levels were
increased in the low richness enterotype samples, con-
firming our hypothesis. Likewise, a recent study employ-
ing a colitis susceptible model showed that inflamed
mice had a lowered gut microbiota richness as well as
increased Enterobacteriaceae abundance [68]. The
observation that low-grade inflammation can occur in
young, healthy specific-pathogen-free (SPF) mice pro-
vides a first hypothesis of the occurrence of the second
enterotype. Whether inflammation, low richness or the
specific bacterial composition of the low richness enter-
otype (including inflammation-inducing genera) is causal
to the other is unclear from our data - also, a combina-
tion of cause and consequence (for example, inflamma-
tion contributing to a more inflammatory microbiota) is
possible. Further studies using larger quantities of mice
for each strain, in conjunction with detailed immunolo-
gical profiling, possibly with a time-series design, will be
needed to fully disentangle the ecology behind the
observed groups. Such studies will also be able to deter-
mine whether the enterotypes are discrete entities or
reflect ecological gradients [69], as the enterotype con-
cept does not exclude gradient behavior [16]. In this
regard, the three intermediate samples in Figure 1a that
are unstable in cluster identity upon resampling are of
particular interest. They could (i) represent a stable
state existing between the two main enterotypes deter-
mining a third cluster, (ii) stably lie on a less populated
ecological gradient between ET1 and 2, or (iii) represent
a temporarily unstable state between the two entero-
types (that is, be
‘underway’ from ET1 to ET2).
The second, Prevotella-associated enterotype, as
described in human [16,26], was not detected in our
data. This absence might be due to the fact that the Pre-
votella
enterotype has been the least prevalent entero-
type [16] and our sample size might not be big enough
to capture it. In addition, the abundance of this genus
has been shown to be sensitive to food intake in both
humans [26,70,71] as well as in mice [72] - the uniform
nutrition within our experimental setup might have
hampered the observation of this third type. This said,
there is no a priori need to observe three enterotypes in
mouse and the Prevotella type might be human-specific.
Future experiments with larger sample size that include
diet variation should be able to resolve this issue.
We find that genetic effects influence the composition
of gut microbiota in five mouse strains that are com-
monly used in biomedical research. Although microbiota
differences between strains have been observed before
[50,51], this is the first study that takes into account the
interaction between genetic background and micro-
environment as well as other stochastic effects that
shape gut microbiome composition. Furthermore, the
depth of resolution provided by 16S rDNA pyrosequen-
cing enabled us to quantify its contribution to the over-
all variation and identify multiple lineages associated
with each mouse strain. We found that the genetic
effect is strongest at the phylum level (26.55%) and
comprises up to 15.65 to 18.62% of the explained varia-
tion in the microbiome at lower phylogenetic levels.
Thus, it appears that host genetics is influencing the gut
metagenome mostly at higher phylogenetic levels. From
an evolutionary point of view this strategy is more plau-
sible as broad-spectrum control based on conserved fea-
tures would be more efficient. Furthermore, these
observations are in line with the recent report of higher
phylogenetic level control of gut microbiota composition
by variable, strain-specific
a-defensin expression [73,74].
Likewise, bile acid secretion was shown to affect gut
microbiota composition mostly at phylum level [75],
and its secretion rate as well as pool size varies between
genotypes [76,77]. These observations provide first
mechanistic hypotheses why host genetic control would
mainly act at higher levels.
Not only is the microbiota composition significantly
different between mouse strains, but we find evidence
that genetic similarity is correlated to microbiome simi-
larity. This implies that polygenetic markers actively
influence gut microbiota composition, and with higher
divergence between strains, these as yet unidentified loci
are subjected to divergence. However, this distinction
was only possible on the phylum and genus levels, as
our work was limited by the number of strains available
for comparison and a greater number of strains would
be required to establish the exact nature of the genetic-
microbiota distance relationship.
In addition, we show that the cage effect accounts for
a large fraction (up to 30%) of the observed variance in
microbiome studies, which has important consequences
for experimental design. Our results suggest that the gut
microbiota of mice within each cage synchronize to a
limited degree and thus influence study outcomes.
Hildebrand et al. Genome Biology 2013, 14:R4
http://genomebiology.com/2013/14/1/R4
Page 8 of 15

Indeed, two recent studies [48,78] demonstrated that
microbiota-related phenotypes can be transferred
between co-housed mice after several weeks of sharing a
cage. Here, we observed that this can even happen
across different strains, showing the strength of this
effect. Gastrointestinal tract synchronization is likely
achieved through coprophagy [47]; however, this has not
been proven so far. This means that in a typical cross-
sectional experimental design, the groups of interest
should be kept in a mixed microenvironment, that is, in
the same cages, or be separated individually. Otherwise,
seeming differences between groups could be solely due
to microbiota synchronization within the to-be-com-
pared groups within the same cage. Although a mixed
set-up might cause the non-detection of weaker signals
because of synchronization between the case and control
groups, it does give more weight to signals that are
detected against this counteracting force. As reported in
this study, the cage effect has the strongest influence on
lower taxonomic levels. Thus, studies focusing on
microbial differences at the strain level need to take spe-
cial care to account for within-cage synchronization. In
our dataset we identified Helicobacter as one of the
main drivers of the cage effect, a genus found in other
studies to be a sensitive component of the environment
[64]. Helicobacter is inherently able to overcome the
acid gut barrier and thus a steady influx of Helicobacter
through coprophagy might help this genus to establish
in co-caged, unaffected individuals.
Next to an important contribution by (stochastic)
individual variation, we show that both genetic and cage
(environmental) effects influence the gut microbiota,
with the cage effect explaining a slightly bigger fraction
of the variance. While the cage effect becomes more
important at lower phylogenetic levels, the genetic effect
is more important at the higher phylogenetic levels;
thus, it appears that the strength of these effects varies
in opposite directions along the gradient of taxonomical
resolution.
Conclusions
We show first evidence for the existence of enterotypes in
mice as found in humans, suggesting that bacterial gut
communities converge into a limited set of stable states,
possibly driven by or even contributing to inflammation.
Furthermore, our results also show the influence of
genetic background and environment on laboratory
mouse microbiota composition, stressing the importance
of careful experimental design and population stratifica-
tion before or during analysis. This work underscores the
great complexity of host-environment-microbiota interac-
tions, but also brings us one step closer to untangling this
fascinating interplay.
Materials and methods
Mice
The mouse strains (genotypes) Balbc (BalbCAnNCrl), B6
(C57Bl/6 JCRL), Swiss Webster and FVB (originally
from Taconic) were provided by the mouse house of the
KU Leuven (KUL). In-bred mice were purchased from
vendors and being maintained in the KUL
’s mouse
house by sibling breeding. The NOD mice were origin-
ally purchased from the Jackson Lab in 2009 and have
been maintained by sibling breeding. Of the five strains
used, only Swiss Webster was out-bred whereas the
others were in-bred strains. At the beginning of the
experiment, mice were age-matched at the age of
4 weeks except for NOD mice, which ranged from
4 weeks old (2 mice), and 6.5 weeks old (3 mice) to
9 weeks old (5 mice). As we did not observe significant
differences in microbiota composition between age
groups (data not shown), in accordance with previous
studies [40], we considered this group as homogeneous
and suitable for the study at hand.
Females from each strain were housed together in one
cage for 3 weeks. A corresponding male cage containing
one B6 male received the bedding from a corresponding
female cage every week. Ten replicates from each group
were performed. The mice were housed in specific-
pathogen-free (SPF) conditions with a 12 hour light/
dark cycle. All mice were sacrificed the same day at the
age of 8 to 12 weeks. Of the ten NOD mice used, only
one developed diabetes at the age of 12 weeks. The
experiment followed ethics protocols approved by the
University of Leuven Animal Ethics Committee.
Cecal DNA extraction
Cecal content was collected, resuspended in 1.5 ml Qia-
gen (Venlo, The Netherlands) stool kit ASL buffer and
immediately frozen at -80°C until further analysis. DNA
from the samples was extracted using the QIAamp
DNA Stool Mini Kit (Qiagen) with adaptations [79].
PCR amplification of 16S rDNA genes
16S amplification was described previously [41]. Briefly,
the V3-V5 region of 16S rDNA genes of the bacteria
population were amplified using two primer sets designed
for 454 sequencing [56]. The reverse primer of the set
contained the 454 adaptor sequence, allowing coupling of
the DNA to sequencing beads, a four nucleotide key
sequence (TCAG), unique Molecular Identifier (MID)
sequences to label each sample (Additional file 20) and the
926 reverse primer sequence (5
’CCGTCAATTCMTT-
TRAGT 3
’). The forward primer included the alternative
454 adaptor, a four nucleotide key sequence (TCAG) and
the 357 forward primer sequence (5
’CCTACGGGAGG-
CAGCAG 3
’). Two 454 adaptor sequences were used, A
Hildebrand et al. Genome Biology 2013, 14:R4
http://genomebiology.com/2013/14/1/R4
Page 9 of 15

(5
’-CGTATCGCCTCCCTCGCGCCA) and B (5’CTATG
CGCCTTGCCAGCCCGC). Combinations of these adap-
tors with forward and reverse primers allowed the usage
of a complete Roche amplification kit (Roche Diagnostics
Nederland BV, Almere, The Netherlands) for unidirec-
tional sequencing. The PCR amplicons were then checked
by electrophoresis on 2% agarose gel and purified using
the QIAquick PCR Purification Kit (Qiagen). DNA con-
centrations were determined using the Quant-iT
™ Pico-
Green
®
dsDNA Assay Kit (Invitrogen, Gent, Belgium) and
the amplicons were pooled together at an equal molar
ratio. Thus, all amplicons from each primer set ended up
in one multiplexed sample. The samples were pyrose-
quenced using a Roche 454 Life Sciences Genome Sequen-
cer FLX machine at the VIB MicroArray Facility, KU
Leuven. The GS FLX Titanium SV emPCR kit (Lib-A)
(Roche Diagnostics Nederland BV, Almere, The Nether-
lands) was used for titrations, and the GS FLX Titanium
MV emPCR kit (Lib-A) (Roche Diagnostics Nederland BV,
Almere, The Netherlands) was used for amplification of
DNA libraries. For pyrosequencing, the GS FLX Titanium
Sequencing kit was used (Roche Diagnostics Nederland
BV, Almere, The Netherlands).
Calprotectin elisa assay
Cecal content of the mice was collected and kept at -80°C
until used for this assay. Calprotectin elisa was performed
using S100A8/S100A9 Elisa kit (ref K6936) from Immu-
nodiagnostik (Immunodiagnostik, Bensheim, Germany)
following the protocol suggested by the producer. The
concentration of calprotectin was calculated from mea-
sured OD 450 nm values by the Gene5 program (Biotek,
Winooski, VT, USA).
Sequence analysis
Sequences were analyzed with the QIIME pipeline, version
1.4 [80]. After multiplexed sequencing of the 16S PCR
products, sequences were assigned to samples based on
their Molecular Identifier (MID) tag, allowing for one base
error. Only 454 reads with a length > 200 bp and < 1,000
bp, an average quality score above 25, fewer than two
ambiguous bases, and fewer than two primer mismatches
were retained for further analysis. To remove sequencing
errors, chimeric reads were identified and removed using
ChimeraSlayer [56] with default settings. Chimera-cleaned
reads were denoised using the QIIME integrated Denoiser
and OTUs were subsequently clustered from denoised
reads at a 97% identity threshold using uclust [81] with
QIIME default settings. We retained 297,597 high quality
reads for further analysis, with an average of 4,960 reads
per sample, which were clustered into 593 OTUs. For
each OTU, the most abundant sequence was selected as
the representative read and classified using RDP classifier
[82], only accepting annotations with at least 80%
confidence. This way we could assign 99.5%, 98.8%, 97.5%,
93.9% and 37.7% of reads to phylum, order, class, family
and genus levels, respectively. From OTU abundance and
their respective taxonomic classifications, feature abun-
dance matrices were calculated at different taxonomic
levels, representing OTU and taxa abundance per sample.
OTU counts per sample, OTU taxonomical assignments
and metadata are available in Additional file 21.
Statistical analyses
To compare the different sequence samples selected by
the QIIME pipeline, sample counts were rarefied to
2,258 reads per sample for the initial two-cluster analy-
sis and 3,700 for all other analysis steps. The rarefaction
depth was chosen based on the 90% of the lowest
sequencing depth over all included samples. For visuali-
zation of taxa abundances, taxa abundance was con-
verted to a log10 scale by adding 1 to each taxa prior to
transformation, avoiding infinite values for absent taxa.
Statistical analysis was conducted on the rarefied feature
abundance matrices using R 2.12.2.
For the initial sample stratifications we used Partioning
around Medoids (pam) [58] to cluster samples based on
four distance metrics: Jensen-Shannon [83], Bray-Curtis
[84], Euclidean distance and weighted Unifrac [85]. Addi-
tionally, several other clustering algorithms were used to
test for stable clustering, including k-means clustering (as
implemented in the R package
‘flexclust’), average, single,
ward and complete hierarchical clustering (via the func-
tion
‘hclust’ in R). The distances were calculated from
genus level normalized abundances, with the exception of
Unifrac distances, which were calculated from OTU level
by the Qiime pipeline. Optimal cluster number was calcu-
lated using either the Calinski-Harabasz pseudo F-statistic
(using medoids as centers), Silhouette internal cluster
optimality criterion, Baker and Hubert Gamma or the
Davies-Bouldin
’s index, as implemented in the R package
clusterSim. The density of samples along the NMDS axis
was calculated using a Gaussian Kernel from the R
‘den-
sity
’ function with default parameters. To test the stability
of the clustering further, we used a resampled clustering
of samples, leaving 10% of samples randomly out of clus-
tering during each of the 500 repetitions. A second boot-
strap test was used to randomly reassign the taxonomy of
10% of the OTUs and recalculate the genus abundance
matrix from this set, which was also repeated 500 times.
Samples that were in 97.5% of cases associated with the
same cluster were considered to be stable. All ordinations
(NMDS, dbRDA) and subsequent statistical analysis were
calculated using the R-package vegan with Bray-Curtis dis-
tance on the rarefied and log-transformed taxa abundance
and visualized with custom R scripts. Community differ-
ences were calculated using a permutation test on the
respective NMDS reduced feature space, as implemented
Hildebrand et al. Genome Biology 2013, 14:R4
http://genomebiology.com/2013/14/1/R4
Page 10 of 15

in vegan. Furthermore, we calculated intergroup differ-
ences for the microbiota using PERMANOVA [86] as
implemented in vegan. This test compares the intragroup
distances to the intergroup distances in a permutation
scheme and thus calculates a P-value. For all PERMA-
NOVA tests we used 5,000,000 randomizations. PERMA-
NOVA post hoc P-values were corrected for multiple
testing using the Benjamini-Hochberg false discovery rate
(q-value) [87]. The variation explained by the genotype
and cage effect factors was calculated using variation parti-
tioning analysis [88] as implemented in the vegan R pack-
age, but modified to our specific setup (the original code
does not support calculation of an unadjusted coefficient
of determination (R
2
) for factors, which would in our case
lead to each individual cage and genotype being treated as
a separate regression to be adjusted for; this was solved by
using unadjusted R squared values in agreement with the
original developer of this package (Pierre Legendre, perso-
nal communication; code available upon request)). To cal-
culate the variation explained by one group (that is,
Helicobacter
) within our dataset, we calculated variation
explained on the complete community matrix and com-
pared this to a matrix from which all Helicobacter OTUs
had been removed. The differences between these two var-
iation-partitionings was taken as the variation explained by
Helicobacter
, in the context of, for example, the cage
effect.
To test for intragroup dispersion, inter-sample distances
were calculated as described above and tested for equal
intragroup dispersions using betadisper [89] as implemen-
ted in vegan; the significance was calculated using anova.
Univariate testing for differential abundances of each taxo-
nomic unit between two or more groups was tested using
a Kruskal-Wallis test (P-value), corrected for multiple test-
ing using the Benjamini-Hochberg false discovery rate (q-
value) [87]. Taxa with less than ten reads over all samples
were excluded from this analysis to avoid artifacts. Post
hoc
statistical testing for significant differences between all
combinations of two groups was conducted only for taxa
with a significance of P < 0.2. Wilcoxon rank-sum tests
were calculated for all possible group combinations and
corrected for multiple testing using Benjamini-Hochberg
false discovery rate (q-value). Calprotectin correlations to
taxa were tested using a spearman correlation test;
P
-values were corrected using Benjamini-Hochberg false
discovery rate. For testing the influence of age, a blocked
Spearman test as implemented in COIN [90] was used,
where genotype was used as blocking factor. To delineate
enterotype influence from cage/genotype effect, we used a
blocked independence test as implemented in COIN [90].
Taxonomic richness was calculated by rarefying the
respective non-normalized feature abundance matrices
until 3,800 (90% of minimum read number) or in the
case of the enterotype calculations rarefactions to 2,300
(several samples in the minor enterotype were below
3,800 reads) reads per sample. The number of different
taxa was calculated for each rarefied sample. This was
repeated five times per sample, and the average is the
reported richness. Analogous to this, Chao1 [91] rich-
ness estimates and Shannon diversity [92] estimates
were calculated from the rarefied OTU matrix. We
tested for significant differences in observed richness,
richness estimates or Shannon diversity using a Kruskal-
Wallis test.
SNP genomic distances between mouse strains were
obtained from [62]. The Bray-Curits microbiome dis-
tance between the strains for which genetic distances
were available was calculated from the rarefied and
transformed abundance matrix. Between strain distances
were calculated from the median distance between all
samples from the respective strains. The microbiome
and genomic distance matrix were tested for correlation
using Mantel
’s test [93]. Subsequently, a separate NMDS
was calculated for each genomic and metagenomic dis-
tance, and a Procrustes transformation was used to
visualize the similarities between these two ordinations.
Data accession
Sequences have been deposited in the NCBI Short Read
Archive [SRA054360].
Additional material
Additional file 1: Figure S1 - overview of gut microbiome
composition of investigated samples at the phylum level. Mouse
strains are abreviated by the first letters and correspond in color to
Figure 1a: N, NOD; F, FVB; BA, Balbc; S, Swiss; B, B6.
Additional file 2: Figure S2 - density plotting of samples on NMDS
revealed two enterotypes at the phylum level. The same result, that
is, two optimal clusters, was observed when using three different
distance matrices: (a) genus level Bray-Curtis, (b) genus level Jensen-
Shannon and (c) OTU level weighted Unifrac.
Additional file 3: Table S1 - distribution of enterotypes among
genotypes and cages. Distribution of enterotypes among (a) genotypes
and (b) cages. Enterotype 1 and 2 are labeled as ET1 and ET2, respectively.
Additional file 4: Table S2 - optimal clustering numbers of the total
dataset. (a) The optimal number of clusters obtained by Silhouette
index/Calinski-Harabasz (CH) score. (b) The actual observed CH score. (c)
The observed maximum Silhouette index. This is repeated at five
taxonomic levels using four different distance methods. Note that Unifrac
distance can only be measured at the OTU level.
Additional file 5: Table S3 - comparison of optimal cluster number
under differing clustering methods as well as optimal cluster
number scores. All data are calculated at the genus level, using Jensen-
Shannon distance. Abbrevations: CH, Calinski-Harabasz pseudo F-statistic;
SIL, Silhouette internal cluster optimality criterion; BHG, Baker and Hubert
Gamma; DB, Davies-Bouldin
’s index.
Additional file 6: Table S4 - 10% of the taxonomy was either
resampled or the samples were jackniffed to 54 samples. This was
repeated 500 times under 5 clustering conditions using pam clustering
and the taxonomic level as indicated. The optimal cluster number in
these 500 resamplings is shown in the tables. Abbrevations: CH, Calinski-
Harabasz pseudo F-statistic; SIL, Silhouette internal cluster.
Hildebrand et al. Genome Biology 2013, 14:R4
http://genomebiology.com/2013/14/1/R4
Page 11 of 15

Additional file 7: Table S5 - taxa that showed significant differences
between enterotype 1 (ET1) and enterotype 2 (ET2). Cut-off values (P
< 0.05 and q < 0.1) were applied. The OTUs were identified at the genus
level if applicable. In case no genus or family could be identified, we
took the lowest identified taxonomy.
Additional file 8: Table S6 - univariate test showing correlations
between amount of calprotectin in cecal matter and gut bacteria.
Marked groups are those negatively linked to calprotectin amount (Rho
< 0). Cut-off values are P < 0.05 and q < 0.1.
P-values of genetic and cage effect
calculated from NMDS analysis at all taxonomic levels. The
randomized test was limited to 10
4
permutations.
Additional file 10: Figure S3 - visualization of genetic and cage effects
using distance-based redundancy analysis. Genetic as well as cage
effects show a strong correlation to the mice microbiome, as visualized in
the dbRDA at the (a) phylum and (b) genus levels. Samples are colored by
genotype; cages are visualized by connecting lines between samples.
Additional file 11: Table S8 - variation partitioning taking into
account genotype, cage, and enterotype as well as shared
information between these and unexplained variation. Percentage of
variation in microbiota composition explained by solely genotype, cage
and enterotype or by shared effects of those variables.
Additional file 12: Figure S4 - intra-strain dispersion of investigated
mouse genotypes. Intra-strain dispersion was not significantly different
between investigated genotypes, as shown here for genus level.
Additional file 13: Table S9 - PERMANOVA
post hoc testing for
significant differences of gut microbiota compositions between the
five strains used. PERMANOVA post hoc testing for significant
differences of gut microbiota compositions between the five strains
used. The marked values are significant (P < 0.05, q < 0.1).
Additional file 14: Figure S5 - richness estimates at the OTU level
over study factors. OTU richness estimated with a Chao1 estimator. (a)
For genotypes significant differences in richness were observed. (b) Cage
effect did not show any significant differences.
Additional file 15: Table S10 - list of taxa showing significant
differences between genotypes. List of taxa showing significant
differences between genotypes (stratified for ET1). Cut-off values of P <
0.05 and q < 0.1 were applied. The direction column sorts genotypes by
their median abundance, from largest to smallest. A post hoc test was
applied to direct neighbors in this list, where
‘ > ‘ is q-value of the test <
0.1,
‘ > > ‘ is q < 0.05 and ‘ > > > ‘ is q < 0.01.
Additional file 16: Table S11 - average abundance of bacterial groups
showing significant differences between mouse genotypes. Values in
brackets are standard deviations within the corresponding groups.
Additional file 17: Table S12 - bacterial groups showing significant
differences between cages. Summary of bacterial groups showing
significant differences between cages (P < 0.05 and q < 0.1). Male mice
were excluded from this test. The direction column sorts genotypes by
their median abundance from largest to smallest. A post hoc test was
applied to direct neighbors in this list, where
‘=’ is q-value > 0.1.
Additional file 18: Table S13 - PERMANOVA tests for community
differences between genotypes and cages after removal of all
Helicobacter OTUs.
Additional file 19: Table S14 - blocked Kruskal-Wallis test on all
samples. (a) Blocked Kruskal-Wallis test on all (60) samples with
enterotype as confounding factor yielded similar results, that is, bacterial
groups showing significant difference between a) genotypes and b)
cages as if enterotype had been pre-stratified.
Additional file 20: Figure S6 - schematic presentation of primer
design used in the amplification of the V3-V5 region of 16SrDNA in
this study.
Additional file 21: Table S15 - metadata of all mice used in the
study, the OTU abundance of all samples and the OTU taxonomical
assignments.
Abbreviations
bp: base pair; CH: Calinski-Harabasz; dbRDA: distance-based redundancy
analysis; ET: enterotype; NMDS: nonmetric multidimensional scaling; NOD:
non-obese diabetic; OTU: operational taxonomic unit; PCR: polymerase chain
reaction; SNP: single-nucleotide polymorphism.
Authors
’ contributions
AN and BB performed the experiments. FH, AN and RG analyzed the data.
FH, BB, PV, AL and JR designed and conceived the experiments. AN, FH, AL
and JR wrote the paper. All authors read and approved the final manuscript.
Competing interests
The spouse of AL is an employee of UCB.
Acknowledgements
We thank Fernando de Villena for kindly supporting us with between mouse
strains genomic distances, Pierre Legendre for help with the variation
partitioning algorithm, Sara Vieira-Silva, Maureen Koslowski as well as various
Raes lab members for helpful discussions; Susann Schönefeldt for technical
assistance and two anonymous reviewers for their constructive comments
on this work. This work was supported by the Fund for Scientific Research -
Flanders (FWO) and the VIB tech watch fund.
Author details
1
Department of Structural Biology, VIB, Pleinlaan 2, 1050 Brussels, Belgium.
2
Department of Bioscience Engineering, Vrije Universiteit Brussel, Pleinlaan 2,
1050 Brussels, Belgium.
3
Autoimmune Genetics Laboratory, VIB, Herestraat 49,
3000 Leuven, Belgium.
4
Katholieke Universiteit Leuven, Herestraat 49, 3000
Leuven, Belgium.
5
Department for Molecular Biomedical Research, VIB,
Technologiepark Zwijnaarde 927, 9052 Ghent, Belgium.
6
Department for
Molecular Biomedical Research, GhentUniversity, Technologiepark Zwijnaarde
927, 9052 Ghent, Belgium.
Received: 4 July 2012 Revised: 8 January 2013
Accepted: 24 January 2013 Published: 24 January 2013
References
1.
Khachatryan ZA, Ktsoyan ZA, Manukyan GP, Kelly D, Ghazaryan KA,
Aminov RI: Predominant role of host genetics in controlling the
composition of gut microbiota. PLoS One 2008, 3:e3064.
2.
Frank DN, Robertson CE, Hamm CM, Kpadeh Z, Zhang T, Chen H, Zhu W,
Sartor RB, Boedeker EC, Harpaz N, Pace NR, Li E: Disease phenotype and
genotype are associated with shifts in intestinal-associated
microbiota in inflammatory bowel diseases. Inflamm Bowel Dis 2010,
17:179-184.
3.
Peterson DA, Frank DN, Pace NR, Gordon JI: Metagenomic approaches for
defining the pathogenesis of inflammatory bowel diseases. Cell Host
Microbe 2008, 3:417-427.
4.
Nagalingam NA, Kao JY, Young VB: Microbial ecology of the murine gut
associated with the development of dextran sodium sulfate-induced
colitis. Inflamm Bowel Dis 2011, 17:917-26.
5.
Turnbaugh PJ, Ley RE, Mahowald MA, Magrini V, Mardis ER, Gordon JI: An
obesity-associated gut microbiome with increased capacity for energy
harvest. Nature 2006, 444:1027-1031.
6.
Turnbaugh PJ, Hamady M, Yatsunenko T, Cantarel BL, Duncan A, Ley RE,
Sogin ML, Jones WJ, Roe BA, Affourtit JP, Egholm M, Henrissat B, Heath AC,
Knight R, Gordon JI: A core gut microbiome in obese and lean twins.
Nature 2009, 457:480-484.
7.
Zhang H, DiBaise JK, Zuccolo A, Kudrna D, Braidotti M, Yu Y,
Parameswaran P, Crowell MD, Wing R, Rittmann BE, Krajmalnik-Brown R:
Human gut microbiota in obesity and after gastric bypass. Proc Natl Acad
Sci USA 2009, 106:2365-2370.
8.
Wu H-J, Ivanov II, Darce J, Hattori K, Shima T, Umesaki Y, Littman DR,
Benoist C, Mathis D: Gut-residing segmented filamentous bacteria drive
autoimmune arthritis via T helper 17 cells. Immunity 2010, 32:815-827.
9.
Ochoa-Repáraz J, Mielcarz DW, Ditrio LE, Burroughs AR, Foureau DM,
Haque-Begum S, Kasper LH: Role of gut commensal microflora in the
development of experimental autoimmune encephalomyelitis. J Immunol
2009, 183:6041-6050.
Hildebrand et al. Genome Biology 2013, 14:R4
http://genomebiology.com/2013/14/1/R4
Page 12 of 15

10.
Yokote H, Miyake S, Croxford JL, Oki S, Mizusawa H, Yamamura T: NKT cell-
dependent amelioration of a mouse model of multiple sclerosis by
altering gut flora. Am J Pathol 2008, 173:1714-1723.
11.
Giongo A, Gano KA, Crabb DB, Mukherjee N, Novelo LL, Casella G, Drew JC,
Ilonen J, Knip M, Hyöty H, Veijola R, Simell T, Simell O, Neu J, Wasserfall CH,
Schatz D, Atkinson MA, Triplett EW: Toward defining the autoimmune
microbiome for type 1 diabetes. ISME J 2011, 5:82-91.
12.
Brown CT, Davis-Richardson AG, Giongo A, Gano KA, Crabb DB,
Mukherjee N, Casella G, Drew JC, Ilonen J, Knip M, Hyöty H, Veijola R,
Simell T, Simell O, Neu J, Wasserfall CH, Schatz D, Atkinson MA, Triplett EW:
Gut microbiome metagenomics analysis suggests a functional model for
the development of autoimmunity for type 1 diabetes. PloS One 2011, 6:
e25792.
13.
Qin J, Li Y, Cai Z, Li S, Zhu J, Zhang F, Liang S, Zhang W, Guan Y, Shen D,
Peng Y, Zhang D, Jie Z, Wu W, Qin Y, Xue W, Li J, Han L, Lu D, Wu P, Dai Y,
Sun X, Li Z, Tang A, Zhong S, Li X, Chen W, Xu R, Wang M, Feng Q, et al: A
metagenome-wide association study of gut microbiota in type 2
diabetes. Nature 2012, 490:55-60.
14.
Russell SL, Gold MJ, Hartmann M, Willing BP, Thorson L, Wlodarska M, Gill N,
Blanchet M-R, Mohn WW, McNagny KM, Finlay BB: Early life antibiotic-
driven changes in microbiota enhance susceptibility to allergic asthma.
EMBO Rep 2012, 13:440-447.
15.
Qin J, Li R, Raes J, Arumugam M, Burgdorf KS, Manichanh C, Nielsen T,
Pons N, Levenez F, Yamada T, Mende DR, Li J, Xu J, Li S, Li D, Cao J,
Wang B, Liang H, Zheng H, Xie Y, Tap J, Lepage P, Bertalan M, Batto J-M,
Hansen T, Le Paslier D, Linneberg A, Nielsen HB, Pelletier E, Renault P, et al:
A human gut microbial gene catalogue established by metagenomic
sequencing. Nature 2010, 464:59-65.
16.
Arumugam M, Raes J, Pelletier E, Le Paslier D, Yamada T, Mende DR,
Fernandes GR, Tap J, Bruls T, Batto J-M, Bertalan M, Borruel N, Casellas F,
Fernandez L, Gautier L, Hansen T, Hattori M, Hayashi T, Kleerebezem M,
Kurokawa K, Leclerc M, Levenez F, Manichanh C, Nielsen HB, Nielsen T,
Pons N, Poulain J, Qin J, Sicheritz-Ponten T, Tims S, et al: Enterotypes of
the human gut microbiome. Nature 2011, 473:174-180.
17.
Kurokawa K, Itoh T, Kuwahara T, Oshima K, Toh H, Toyoda A, Takami H,
Morita H, Sharma VK, Srivastava TP, Taylor TD, Noguchi H, Mori H, Ogura Y,
Ehrlich DS, Itoh K, Takagi T, Sakaki Y, Hayashi T, Hattori M: Comparative
metagenomics revealed commonly enriched gene sets in human gut
microbiomes. DNA Res 2007, 14:169-181.
18.
Curtis H, Gevers D, Knight R, Abubucker S, Badger JH, Chinwalla AT,
Creasy HH, Earl AM, FitzGerald MG, Fulton RS, Giglio MG, Hallsworth-
Pepin K, Lobos EA, Madupu R, Magrini V, Martin JC, Mitreva M: Structure,
function and diversity of the human microbiome in an adult reference
population. Nature 2012, 486:207-214.
19.
Zoetendal EG, Von Wright A, Vilpponen-Salmela T, Ben-Amor K,
Akkermans ADL, De Vos WM: Mucosa-associated bacteria in the human
gastrointestinal tract are uniformly distributed along the colon and
differ from the community recovered from feces. Appl Environ Microbiol
2002, 68:3401-3407.
20.
Booijink CCGM, El-Aidy S, Rajili
ć-Stojanović M, Heilig HGHJ, Troost FJ,
Smidt H, Kleerebezem M, De Vos WM, Zoetendal EG: High temporal and
inter-individual variation detected in the human ileal microbiota. Environ
Microbiol 2010, 12:3213-3227.
21.
Aguirre de Cárcer D, Cuív PO, Wang T, Kang S, Worthley D, Whitehall V,
Gordon I, McSweeney C, Leggett B, Morrison M: Numerical ecology
validates a biogeographical distribution and gender-based effect on
mucosa-associated bacteria along the human colon. ISME J 2011,
5:801-809.
22.
Dethlefsen L, Relman DA: Incomplete recovery and individualized
responses of the human distal gut microbiota to repeated antibiotic
perturbation. Proc Natl Acad Sci USA 2011, 108(Suppl):4554-4561.
23.
Costello EK, Lauber CL, Hamady M, Fierer N, Gordon JI, Knight R: Bacterial
community variation in human body habitats across space and time.
Science 2009, 326:1694-1697.
24.
Hildebrandt MA, Hoffmann C, Sherrill-Mix SA, Keilbaugh SA, Hamady M,
Chen YY, Knight R, Ahima RS, Bushman F, Wu GD: High-fat diet
determines the composition of the murine gut microbiome
independently of obesity. Gastroenterology 2009, 137:1712-1716.
25.
Tilg H: Obesity, metabolic syndrome, and microbiota: multiple
interactions. J Clin Gastroenterol 2010, 44(Suppl 1):S16-18.
26.
Wu GD, Chen J, Hoffmann C, Bittinger K, Chen Y-Y, Keilbaugh SA, Bewtra M,
Knights D, Walters WA, Knight R, Sinha R, Gilroy E, Gupta K, Baldassano R,
Nessel L, Li H, Bushman FD, Lewis JD: Linking long-term dietary patterns
with gut microbial enterotypes. Science 2011, 334:105-108.
27.
Antunes LCM, Finlay BB: A comparative analysis of the effect of antibiotic
treatment and enteric infection on intestinal homeostasis. Gut Microbes
2011, 2:105-108.
28.
Biasucci G, Rubini M, Riboni S, Morelli L, Bessi E, Retetangos C: Mode of
delivery affects the bacterial community in the newborn gut. Early Hum
Dev 2010, 86:13-15.
29.
Dominguez-Bello MG, Costello EK, Contreras M, Magris M, Hidalgo G,
Fierer N, Knight R: Delivery mode shapes the acquisition and structure of
the initial microbiota across multiple body habitats in newborns. Proc
Natl Acad Sci USA 2010, 107:11971-11975.
30.
Adlerberth I: Factors influencing the establishment of the intestinal
microbiota in infancy. Nestle Nutr Workshop Ser Pediatr Program 2008,
62:13-29, discussion 29-33.
31.
Falk PG, Hooper LV, Midtvedt T, Gordon JI: Creating and maintaining the
gastrointestinal ecosystem: what we know and need to know from
gnotobiology. Microbiol Mol Biol Rev 1998, 62:1157-1170.
32.
Macpherson AJ, Harris NL: Interactions between commensal intestinal
bacteria and the immune system. Nat Rev Immunol 2004, 4:478-485.
33.
Wen L, Ley RE, Volchkov PY, Stranges PB, Avanesyan L, Stonebraker AC,
Hu C, Wong FS, Szot GL, Bluestone JA, Gordon JI, Chervonsky AV: Innate
immunity and intestinal microbiota in the development of Type 1
diabetes. Nature 2008, 455:1109-1113.
34.
Faith JJ, McNulty NP, Rey FE, Gordon JI: Predicting a human gut
microbiota
’s response to diet in gnotobiotic mice. Science 2011,
333:101-104.
35.
Faith JJ, Rey FE, O
’Donnell D, Karlsson M, McNulty NP, Kallstrom G,
Goodman AL, Gordon JI: Creating and characterizing communities of
human gut microbes in gnotobiotic mice. ISME J 2010, 4:1094-1098.
36.
Goodman AL, Kallstrom G, Faith JJ, Reyes A, Moore A, Dantas G, Gordon JI:
Extensive personal human gut microbiota culture collections
characterized and manipulated in gnotobiotic mice. Proc Natl Acad Sci
USA 2011, 108:6252-6257.
37.
Turnbaugh PJ, Ridaura VK, Faith JJ, Rey FE, Knight R, Gordon JI: The effect
of diet on the human gut microbiome: a metagenomic analysis in
humanized gnotobiotic mice. Sci Transl Med 2009, 1:6ra14.
38.
Albert EJ, Sommerfeld K, Gophna S, Marshall JS, Gophna U: The gut
microbiota of toll-like receptor 2-deficient mice exhibits lineage-specific
modifications. Environ Microbiol Rep 2009, 1:65-70.
39.
Xue X, Feng T, Yao S, Wolf KJ, Liu C-G, Liu X, Elson CO, Cong Y: Microbiota
downregulates dendritic cell expression of miR-10a, which targets IL-12/
IL-23p40. J Immunol 2011, 187:5879-5886.
40.
Mondot S, Barreau F, Al Nabhani Z, Dussaillant M, Le Roux K, Doré J,
Leclerc M, Hugot J-P, Lepage P: Altered gut microbiota composition in
immune-impaired Nod2(-/-) mice. Gut 2012, 61:634-635.
41.
Brinkman BM, Hildebrand F, Kubica M, Goosens D, Del Favero J,
Declercq W, Raes J, Vandenabeele P: Caspase deficiency alters the murine
gut microbiome. Cell Death Dis 2011, 2:e220.
42.
Bruno MEC, Rogier EW, Frantz AL, Stefka AT, Thompson SN, Kaetzel CS:
Regulation of the polymeric immunoglobulin receptor in intestinal
epithelial cells by Enterobacteriaceae: implications for mucosal
homeostasis. Immunol Invest 2010, 39:356-382.
43.
Wells JM, Rossi O, Meijerink M, Van Baarlen P: Epithelial crosstalk at the
microbiota-mucosal interface. Proc Natl Acad Sci USA 2011,
108(Suppl):4607-4614.
44.
Wang Y, Devkota S, Musch MW, Jabri B, Nagler C, Antonopoulos DA,
Chervonsky A, Chang EB: Regional mucosa-associated microbiota
determine physiological expression of TLR2 and TLR4 in murine colon.
PloS One 2010, 5:e13607.
45.
Kellermayer R, Dowd SE, Harris RA, Balasa A, Schaible TD, Wolcott RD,
Tatevian N, Szigeti R, Li Z, Versalovic J, Smith CW: Colonic mucosal DNA
methylation, immune response, and microbiome patterns in Toll-like
receptor 2-knockout mice. FASEB J 2011, 25:1449-1460.
46.
Zhang C, Zhang M, Wang S, Han R, Cao Y, Hua W, Mao Y, Zhang X, Pang X,
Wei C, Zhao G, Chen Y, Zhao L: Interactions between gut microbiota,
host genetics and diet relevant to development of metabolic syndromes
in mice. ISME J 2010, 4:232-241.
Hildebrand et al. Genome Biology 2013, 14:R4
http://genomebiology.com/2013/14/1/R4
Page 13 of 15

47.
Deloris Alexander A, Orcutt RP, Henry JC, Baker J, Bissahoyo AC,
Threadgill DW: Quantitative PCR assays for mouse enteric flora reveal
strain-dependent differences in composition that are influenced by the
microenvironment. Mamm Genome 2006, 17:1093-1104.
48.
Elinav E, Strowig T, Kau AL, Henao-Mejia J, Thaiss CA, Booth CJ, Peaper DR,
Bertin J, Eisenbarth SC, Gordon JI, Flavell RA: NLRP6 inflammasome
regulates colonic microbial ecology and risk for colitis. Cell 2011,
145:745-757.
49.
Saric J, Wang Y, Li J, Coen M, Utzinger J, Marchesi JR, Keiser J, Veselkov K,
Lindon JC, Nicholson JK, Holmes E: Species variation in the fecal
metabolome gives insight into differential gastrointestinal function. J
Proteome Res 2008, 7:352-360.
50.
Friswell MK, Gika H, Stratford IJ, Theodoridis G, Telfer B, Wilson ID,
McBain AJ: Site and strain-specific variation in gut microbiota profiles
and metabolism in experimental mice. PloS One 2010, 5:e8584.
51.
Kovacs A, Ben-Jacob N, Tayem H, Halperin E, Iraqi F, Gophna U: Genotype
is a stronger determinant than sex of the mouse gut microbiota.
Microbial Ecol 2011, 61:423-428.
52.
Benson AK, Kelly S, Legge R, Ma F, Low SJ, Kim J, Zhang M, Oh PL,
Nehrenberg D, Hua K, Kachman SD, Moriyama EN, Walter J, Peterson D,
Pomp D: Individuality in gut microbiota composition is a complex
polygenic trait shaped by multiple environmental and host genetic
factors. Proc Natl Acad Sci USA 2010, 107:18933-18938.
53.
Grönlund M-M, Grze
śkowiak Ł, Isolauri E, Salminen S: Influence of mother’s
intestinal microbiota on gut colonization in the infant. Gut microbes 2011,
2:227-233.
54.
Liu Z, Lozupone C, Hamady M, Bushman FD, Knight R: Short
pyrosequencing reads suffice for accurate microbial community analysis.
Nucleic Acids Res 2007, 35:e120.
55.
Liu Z, DeSantis TZ, Andersen GL, Knight R: Accurate taxonomy
assignments from 16S rRNA sequences produced by highly parallel
pyrosequencers. Nucleic Acids Res 2008, 36:e120.
56.
Haas BJ, Gevers D, Earl AM, Feldgarden M, Ward DV, Giannoukos G, Ciulla D,
Tabbaa D, Highlander SK, Sodergren E, Methé B, DeSantis TZ, Petrosino JF,
Knight R, Birren BW: Chimeric 16S rRNA sequence formation and
detection in Sanger and 454-pyrosequenced PCR amplicons. Genome Res
2011, 21:494-504.
57.
Ley RE, Backhed F, Turnbaugh P, Lozupone CA, Knight RD, Gordon JI:
Obesity alters gut microbial ecology. Proc Natl Acad Sci USA 2005,
102:11070-11075.
58.
Kaufman L, Rousseeuw PJ: Finding Groups in Data: An Introduction to Cluster
Analysis Wiley-Interscience; 1990.
59.
Zupancic ML, Cantarel BL, Liu Z, Drabek EF, Ryan K, Cirimotich S, Jones C,
Knight R, Walters W, Knights D, Mongodin EF, Horenstein RB, Mitchell BD,
Steinle N, Snitker S, Shuldiner AR, Fraser CM: Analysis of the gut
microbiota in the Old Order Amish and its relation to the metabolic
syndrome. PLoS ONE 2012, 7:e43052.
60.
D
’Haens G, Ferrante M, Vermeire S, Baert F, Noman M, Moortgat L, Geens P,
Iwens D, Aerden I, Van Assche G, Van Olmen G, Rutgeerts P: Fecal
calprotectin is a surrogate marker for endoscopic lesions in
inflammatory bowel disease. Inflamm Bowel Dis 2012, 18:2218-2224.
61.
Shulman RJ, Eakin MN, Czyzewski DI, Jarrett M, Ou C-N: Increased
gastrointestinal permeability and gut inflammation in children with
functional abdominal pain and irritable bowel syndrome. J Pediatr 2008,
153:646-650.
62.
Yang H, Wang JR, Didion JP, Buus RJ, Bell TA, Welsh CE, Bonhomme F,
Yu AH-T, Nachman MW, Pialek J, Tucker P, Boursot P, McMillan L,
Churchill GA, De Villena FP-M: Subspecific origin and haplotype diversity
in the laboratory mouse. Nat Genet 2011, 43:648-655.
63.
Van Passel MWJ, Kant R, Zoetendal EG, Plugge CM, Derrien M, Malfatti SA,
Chain PSG, Woyke T, Palva A, De Vos WM, Smidt H: The genome of
Akkermansia muciniphila, a dedicated intestinal mucin degrader, and its
use in exploring intestinal metagenomes. PloS One 2011, 6:e16876.
64.
Taylor NS, Xu S, Nambiar P, Dewhirst FE, Fox JG: Enterohepatic
Helicobacter species are prevalent in mice from commercial and
academic institutions in Asia, Europe, and North America. J Clin Microbiol
2007, 45:2166-2172.
65.
Rehman A, Lepage P, Nolte A, Hellmig S, Schreiber S, Ott SJ:
Transcriptional activity of the dominant gut mucosal microbiota in
chronic inflammatory bowel disease patients. J Med Microbiol 2010,
59:1114-1122.
66.
Willing BP, Dicksved J, Halfvarson J, Andersson AF, Lucio M, Zheng Z,
Järnerot G, Tysk C, Jansson JK, Engstrand L: A pyrosequencing study in
twins shows that gastrointestinal microbial profiles vary with
inflammatory bowel disease phenotypes. Gastroenterology 2010,
139:1844-1854, e1.
67.
Maes M, Mihaylova I, Leunis J-C: Increased serum IgA and IgM against LPS
of enterobacteria in chronic fatigue syndrome (CFS): indication for the
involvement of gram-negative enterobacteria in the etiology of CFS and
for the presence of an increased gut-intestinal permeability. J Affect
Disord 2007, 99:237-240.
68.
Arthur JC, Perez-Chanona E, Mühlbauer M, Tomkovich S, Uronis JM, Fan T-J,
Campbell BJ, Abujamel T, Dogan B, Rogers AB, Rhodes JM, Stintzi A,
Simpson KW, Hansen JJ, Keku TO, Fodor AA, Jobin C: Intestinal
inflammation targets cancer-inducing activity of the microbiota. Science
2012, 117:1175-1183.
69.
Lozupone C, Stombaugh JI, Gordon JI, Jansson JK, Knight R: Diversity,
stability and resilience of the human gut microbiota. Nature 2012,
489:220-230.
70.
Fernandez-Raudales D, Hoeflinger J, Bringe NA, Cox SB, Dowd SE, Miller MJ,
Gonzalez de Mejia E: Consumption of different soymilk formulations
differentially affects the gut microbiomes of overweight and obese men.
Gut Microbes 2012, 3:490-500.
71.
Yatsunenko T, Rey FE, Manary MJ, Trehan I, Dominguez-Bello MG,
Contreras M, Magris M, Hidalgo G, Baldassano RN, Anokhin AP, Heath AC,
Warner B, Reeder J, Kuczynski J, Caporaso JG, Lozupone C, Lauber C,
Clemente JC, Knights D, Knight R, Gordon JI: Human gut microbiome
viewed across age and geography. Nature 2012, 486:222-227.
72.
Neyrinck AM, Possemiers S, Druart C, Van de Wiele T, De Backer F, Cani PD,
Larondelle Y, Delzenne NM: Prebiotic effects of wheat arabinoxylan
related to the increase in bifidobacteria, Roseburia and Bacteroides/
Prevotella in diet-induced obese mice. PloS One 2011, 6:e20944.
73.
Salzman NH, Hung K, Haribhai D, Chu H, Karlsson-Sjöberg J, Amir E,
Teggatz P, Barman M, Hayward M, Eastwood D, Stoel M, Zhou Y,
Sodergren E, Weinstock GM, Bevins CL, Williams CB, Bos N: Enteric
defensins are essential regulators of intestinal microbial ecology. Nat
Immunol 2010, 11:76-83.
74.
Shanahan MT, Tanabe H, Ouellette AJ: Strain-specific polymorphisms in
Paneth cell
α-defensins of C57BL/6 mice and evidence of vestigial
α-defensin pseudogenes. Infect Immun 2011, 79:459-473.
75.
Islam KBMS, Fukiya S, Hagio M, Fujii N, Ishizuka S, Ooka T, Ogura Y,
Hayashi T, Yokota A: Bile acid is a host factor that regulates the
composition of the cecal microbiota in rats. Gastroenterology 2011,
141:1773-1781.
76.
Wang DQ, Paigen B, Carey MC: Genetic factors at the enterocyte level
account for variations in intestinal cholesterol absorption efficiency
among inbred strains of mice. J Lipid Res 2001, 42:1820-1830.
77.
Wang DQ-H, Lammert F, Paigen B, Carey MC: Phenotypic characterization
of Lith genes that determine susceptibility to cholesterol cholelithiasis in
inbred mice: pathophysiology of biliary lipid secretion. J Lipid Res 1999,
40:2066-2079.
78.
Stecher B, Chaffron S, Käppeli R, Hapfelmeier S, Freedrich S, Weber TC,
Kirundi J, Suar M, McCoy KD, Von Mering C, Macpherson AJ, Hardt W-D:
Like will to like: abundances of closely related species can predict
susceptibility to intestinal colonization by pathogenic and commensal
bacteria. PLoS Pathog 2010, 6:e1000711.
79.
Zoetendal EG, Heilig HG, Klaassens ES, Booijink CC, Kleerebezem M,
Smidt H, De Vos WM: Isolation of DNA from bacterial samples of the
human gastrointestinal tract. Nat Protoc 2006, 1:870-873.
80.
Caporaso JG, Kuczynski J, Stombaugh J, Bittinger K, Bushman FD,
Costello EK, Fierer N, Peña AG, Goodrich JK, Gordon JI, Huttley GA,
Kelley ST, Knights D, Koenig JE, Ley RE, Lozupone CA, McDonald D,
Muegge BD, Pirrung M, Reeder J, Sevinsky JR, Turnbaugh PJ, Walters WA,
Widmann J, Yatsunenko T, Zaneveld J, Knight R: QIIME allows analysis of
high-throughput community sequencing data. Nat Methods 2010,
7:335-336.
81.
Edgar RC: Search and clustering orders of magnitude faster than BLAST.
Bioinformatics 2010, 26:2460-2461.
82.
Wang Q, Garrity GM, Tiedje JM, Cole JR: Naive Bayesian classifier for rapid
assignment of rRNA sequences into the new bacterial taxonomy. Appl
Environ Microbiol 2007, 73:5261-5267.
Hildebrand et al. Genome Biology 2013, 14:R4
http://genomebiology.com/2013/14/1/R4
Page 14 of 15

83.
Endres D, Schindelin J: A new metric for probability distributions. IEEE
Trans Information Theory 2003, 49:1858-1860.
84.
Bray JR, Curtis JT: An ordination of the upland forest communities of
Southern Wisconsin. Ecol Monographs 1957, 27:325.
85.
Lozupone C, Hamady M, Knight R: UniFrac
microbial community diversity in a phylogenetic context. BMC
Bioinformatics 2006, 7:371.
86.
Anderson M: A new method for non-parametric multivariate analysis of
variance. Austral Ecol 2001, 32-46.
87.
Benjamini Y, Hochberg Y: Controlling the false discovery rate: a practical
and powerful approach to multiple testing. J R Stat Soc B 1995, 289-300.
88.
Borcard D, Legendre P, Drapeau P: Partialling out the spatial component
of ecological variation. Ecology 1992, 73:1045.
89.
Anderson MJ: Distance-based tests for homogeneity of multivariate
dispersions. Biometrics 2006, 62:245-253.
90.
Hothorn T, Hornik K, Van de Wiel MA, Zeileis A: A Lego system for
conditional inference. Am Stat 2006, 60:257-263.
91.
Chao A: Nonparametric-estimation of the number of classes in a
population. Scand J Stat 1984, 11:265-270.
92.
Shannon CE: A mathematical theory of communication. Bell System Tech J
1948, 27:379-423.
93.
Mantel N: The detection of disease clustering and a generalized
regression approach. Cancer Res 1967, 27:209-220.
doi:10.1186/gb-2013-14-1-r4
Cite this article as: Hildebrand et al.: Inflammation-associated
enterotypes, host genotype, cage and inter-individual effects drive gut
microbiota variation in common laboratory mice. Genome Biology 2013 14:
R4.
Submit your next manuscript to BioMed Central
and take full advantage of:
•
Convenient online submission
•
Thorough peer review
•
No space constraints or color figure charges
•
Immediate publication on acceptance
•
Inclusion in PubMed, CAS, Scopus and Google Scholar
•
Research which is freely available for redistribution
Submit your manuscript at
www.biomedcentral.com/submit
Hildebrand et al. Genome Biology 2013, 14:R4
http://genomebiology.com/2013/14/1/R4
Page 15 of 15
Document Outline
- Abstract
- Background
- Results
- Experimental set up
- Bimodal distribution in mouse microbiome composition: evidence for two enterotypes with significantly different species richness across investigated mouse strains
- Enterotypes associate with low-grade inflammation
- After enterotype stratification, genetic, cage and inter-individual variation effects contribute on, average, 19%, 31.7% and 45.5% to the variance in the murine gut microbiota composition, respectively
- Positive association between genetic distance and microbiota profile
- Bacterial genera driving differences between genotypes and cages: identification of Helicobacter as an important driver of cage effects
- Discussion
- Conclusions
- Materials and methods
- Abbreviations
- Authors’ contributions
- Competing interests
- Acknowledgements
- Author details
- References
Wyszukiwarka
Podobne podstrony:
Association between cancer screening behavior and family history among japanese women
Shigella s ways of manipulating the host intestinal innate and adaptive immune system
intermediality and (inter)media reflexivity in contemporary cinema – petr szczepanik
Carrol Noel Cage and philosophy
Antioxidant, anticancer, and apoptosis inducing effects in HELA cells
Michele Micheletti Political Virtue and Shopping, Individuals, Consumerism, and Collective Action (
Notch and Mean Stress Effect in Fatigue as Phenomena of Elasto Plastic Inherent Multiaxiality
Phonetics and Phonology 11 12 13, Gimson Chapter 5 Sounds in Language
[12]Aging sensitizes towards ROS formation and lipid peroxidation in PS1M146L transgenic mice
Variations in Risk and Treatment Factors Among Adolescents Engaging in Different Types of Deliberate
Rapid and efficient purification and refolding of a (His) tagged recombinant protein produced in E c
Kruczkowska, Joanna Who Gets Translated and Why Anthologies of Twentieth Century Greek Poetry in Po
Barbara Stallings, Wilson Peres Growth, Employment, and Equity; The Impact of the Economic Reforms
Beowulf, Byrhtnoth, and the Judgment of God Trial by Combat in Anglo Saxon England
Emissions and Economic Analysis of Ground Source Heat Pumps in Wisconsin
Bearden Tech papers Engines and Templates Correcting Effects Confused as Causes (www cheniere org
eCourse Wine and Beer Are Good for Us Yes! (Second in a Series)
więcej podobnych podstron