
Dynamic Linux Kernel Instrumentation with
SystemTap
William Cohen, Performance Tools Engineer
Red Hat, Inc.

2
Abstract
Understanding the behavior of the operating systems internals can yield valuable
insights into performance issues, methods of improving performance, and making
the system more robust. However, it is often difficult to predict the behavior of the
operating system in particular environments. Instrumentation of the operating
system is often required to test hypotheses and collect metrics to gauge the
performance of code changes.
SystemTap is a dynamic instrumentation system for the Linux kernel that allows one
to quickly instrument a running kernel. The dynamic instrumentation technique
allows developers and researchers to quickly instrument kernels without having to
recompile or reboot the machine. It also allows one to instrument prebuilt kernels in
Linux distributions such as Fedora.
SystemTap provide a scripting language to describe the locations in the kernel to
instrument and the data reduction to avoid transferring large amounts of data out of
the kernel. Examples instrumentation scripts will be provided to show how the
scripting language can instrument interesting points in the kernel and perform data
reduction to describe the operation of the kernel.

3
Outline
SystemTap Target Audience
Previous Linux Monitoring Tools
SystemTap Introduction
SystemTap Implementation
Examples
Current State
Future Work

4
SystemTap Target Audience
Kernel Developer: I wish I could add a debug statement
easily without going through the compile/build cycle.
Technical Support: How can I get this additional data that is
already available in the kernel easily and safely?
Application Developer: How can I improve the performance
of my application on Linux?
System Admin: Occasionally jobs take significantly longer
than usual to complete, or do not complete. Why?
Researcher: How would a proposed OS/hardware change
affect system performance?

5
Previous Linux Monitoring Tools
Examples: ps, netstat, vmstat, iostat, sar, strace, top, ltrace,
oprofile, /proc, LTT, etc.
Drawbacks:
●
Narrow focus, hence not suitable for system scope
●
Not flexible and configurable
●
Many different tools and data sources but no easy way to
integrate the information

6
SystemTap
A tool to enable a deeper look into a running system:
●
Provides a highlevel script language to instrument unmodified
running kernels
●
Exposes live system activity and data
●
Provides performance and safety by careful translation to C
●
Includes growing library of reusable instrumentation scripts
Started January 2005
Free/Open Source Software (GPL)
Active contributions from Red Hat, Intel, IBM, Hitachi and others

7
Probe Scripting Language
awklike scripting language
Limited number of types:
●
64bit numbers, strings, associative arrays, statistics
Full control structures (conditionals, loops, functions)
Safety features:
●
Full static type checking, automatic type inference
●
No dynamic memory allocation
●
Bounded execution space and time
●
No assembly or arbitrary C code (except in guru mode)
●
Protected access to “$target” values in kernel space

8
SystemTap Safety Goals
For use in production environment – aiming to be crash
proof
Uses existing compiler tool chain, kernel
Safe mode: Restricted functionality for production
Guru mode: Full feature set for development, debugging
Static analyzer:
●
Protection against translator bugs and user errors
●
Detects illegal instructions and external references

9
Kprobes
C API to allow dynamic kernel instrumentation
Probe Point: An instruction address in the kernel
Probe Handler: An instrumentation routine, as function pointer
Replace the instruction at the probe points with a breakpoint
instruction
When the breakpoint is hit, call the probe handler
Execute the original instruction, then resume

10
Kprobes Limitations
C API
No checking that probe point is at instruction boundary
Kprobesbased code is hard to maintain and port due to hard
coding of addresses
No library of probes for common tasks
No convenient access to local variables
Requires significant kernel knowledge
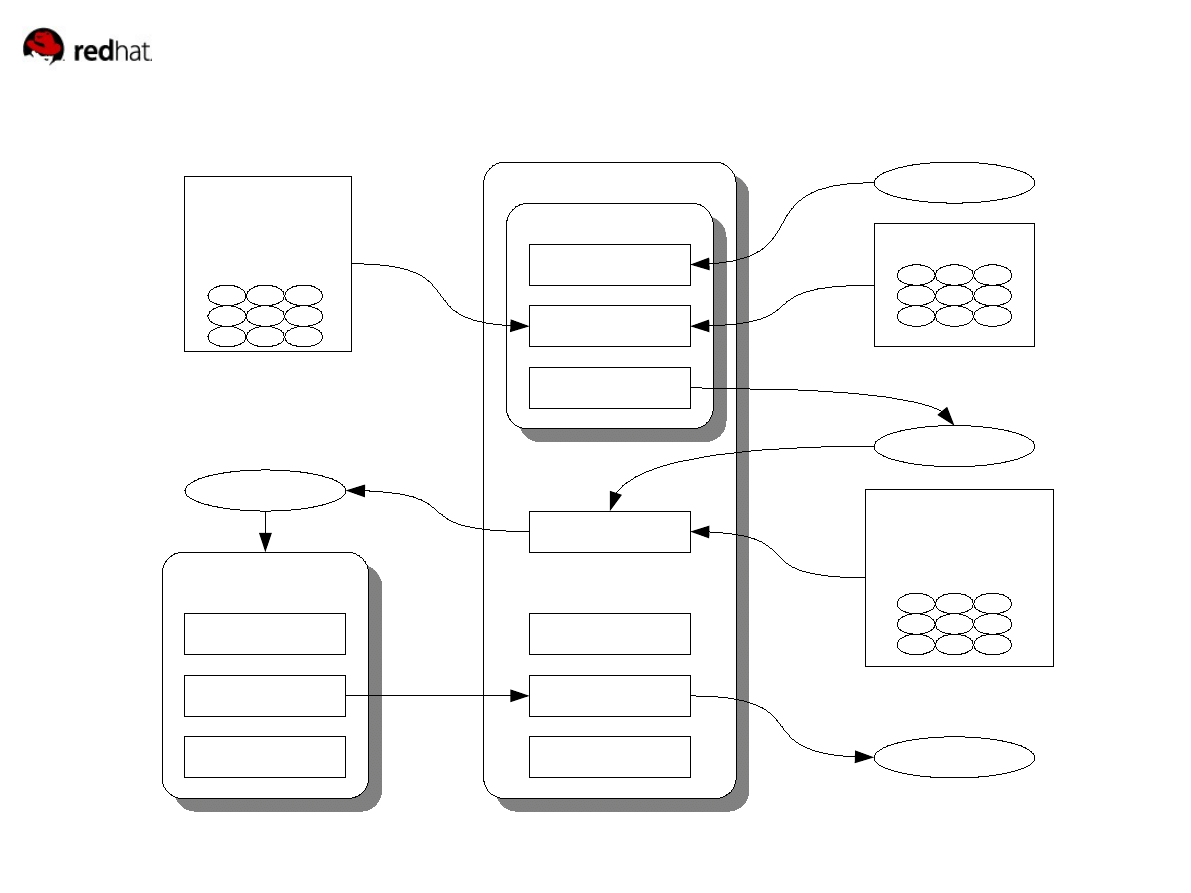
11
SystemTap Overall Diagram
systemtap
translator
parse
elaborate
translate
build
load/run
stop/unload
store output
probe.stp
script library
runtime,
C tapsets
probe.ko
probe.out
probe.c
kernel
kprobes
relayfs
profiling
debuginfo
ELF objects

12
Elaboration Phase
Takes a user probe script and:
●
Searches script libraries
●
Resolves references, types
Uses DWARF debugging information to find:
●
Function probe addresses
●
Source location: line number / file name
●
Global and local variables types and locations

13
Tapsets
A tapset defines:
●
Probe points / aliases: symbolic names for useful
instrumentation points
●
Useful data values that are available at each probe point
Written in script and C by developers knowledgeable in the
given area
Tested and packaged with SystemTap

14
Translation/build Phase
Each script subroutine expanded to block of C
Generates calls into runtime library where needed
Includes runtime error checks, diagnostics:
●
Bounded loops, recursion
●
Division by zero
Includes code to insert and remove instrumentation
Calls the kbuild system to make a probe module “.ko”

15
Runtime Library
Implements some utilities:
●
Associative arrays, statistics, counters
●
Stack trace, register dump, symbol lookup
●
Safe copy from userspace
●
Output formatting and transport
Could also be used by C programmers to simplify writing raw
kprobesbased instrumentation

16
Execution Phase
Data Collection – Kernel Space
●
During kernel execution, probes get activated
●
Data gets filtered, aggregated
●
Data collection stops when user interrupts or script selfterminates
Data Transfer – Kernel to User Space
●
Relayfs: Efficient and low overhead mechanism for data transfer with
per cpu buffering.
●
Or Procfs: Simple and portable mechanism, still high performance

17
iostat2.stp, part 1: gather data
probe begin { log("starting probe") }
probe timer.ms(10000) {
log ("stopping probe after 10 seconds")
exit ()
}
global names, opens, reads, writes
probe kernel.function("sys_open") {
e=execname(); names[e]=1
opens[e] ++ # plain integer
}
probe kernel.function("sys_read") {
e=execname(); names[e]=1
reads[e] <<< $count # statistics
}
# same for sys_write accumulating into
# writes[]

18
iostat2.stp, part 2: print data
probe end {
foreach(name+ in names) { # sort by names
printf (“process: %s\n”, name)
if (opens[name]) printf (“opens n=%d\n”, opens[name])
if (@count(reads[name]))
printf (“reads n=%d, sum=%d, avg=%d\n”,
@count(reads[name]), # extracting stat results
@sum(reads[name]),
@avg(reads[name]))
# ... same for writes[]
printf (“\n”)
}
}

19
iostat2.stp output
# stap iostat2.stp
starting probe
stopping probe after 10 seconds
process: echo
writes n=1, sum=75, avg=75
[...]
process: soffice
opens n=10
reads n=30, sum=52729, avg=1757
writes n=3, sum=75, avg=25
[...]
process: soffice.bin
opens n=2379
reads n=2583, sum=5966927, avg=2310
writes n=614, sum=193407, avg=314
[...]

20
scf2.stp: smp_call_function usage
global traces
probe kernel.function("smp_call_function") {
traces[pid(), pexecname(), backtrace()] ++
}
probe timer.ms(1000) { exit () }
probe end {
foreach ([pid+, name, stack] in traces) { # sort by pid
printf ("traces[%d,%s,\n", pid, name)
print_stack (stack)
printf (“] = %d\n", traces[pid, name, stack])
}
}

21
scf2.stp output
# stap scf2.stp
[...]
traces[2216,hald,
0xc0114d77 : smp_call_function+0x10/0xfa
0xc016a73f : invalidate_bh_lrus+0x1b/0x22
0xc016985a : invalidate_bdev+0x8/0x17
0xc016f345 : kill_bdev+0xd/0x20
0xc01701bc : blkdev_put+0x14f/0x164
0xc0168e6d : __fput+0xb1/0x18f
0xc01676e2 : filp_close+0x3e/0x62
0xc01039d1 : syscall_call+0x7/0xb
] = 2
[...]

22
Contributions
Red Hat: translator, runtime
IBM: x86+ppc kprobes, relayfs, tapsets
Intel: ia64 kprobes, safety analysis, tapsets
Hitachi: djprobes, tapsets

23
SystemTap Status
Incorporated into RHEL4 since U2 (2005) and Fedora
(rawhide and FC5) as “technology preview”, development
ongoing
Kprobes: patches in mainline kernel (ia32, ia64, ppc64,
x86_64)
Relayfs: patches in mainline kernel
Standard instrumentation tapsets to look at specific kernel
areas: system calls, time keeping functions, virtual filesystem
layer, etc.

24
Future Work
Benchmarking and performance tuning of scripting system
Documentation and tutorials
Userspace probes
Static instrumentation support (both kernel and user space)
Crossinstrumentation
Nonroot use of the tools and precompiled scripts
Boot time probing
Visualization tools
Continuous tracing or flight recording
Selfmonitoring for performance degradation

25
Further Information
●
http://sources.redhat.com/systemtap
●
Mailing list:
●
IRC channel: #systemtap on irc.freenode.net
Wyszukiwarka
Podobne podstrony:
2006 04 28 zajecia 9
Linux Kernel Podróż do wnętrza systemu cz 1
Linux Kernel podroz do wnetrza systemu
Embedded Linux Kernel And Drivers
Instrukcja?archiwizacji dla Systemu InsERT GT w Windows XP
O&O Services Single Sign On on Linux using LDAP with Active Directory (2002)
We wszystkich toyotach inspekcję robisz z zegarów, Instrukcja Obsługi Toyota Yaris 2006 1.4D4D
linux kernel AJ7VQIUN3QHIJRBKF5Y2BNPU34P4TIWRKSO3U3Q
gpw systemy it 2006 Q34BNOLRC4U Nieznany
[Instrukcja obsługi] System nawigacji satelitarnej Naviexpert
instrukcja wykonania sprawozdania laboratoryjnego 2006(1), WAT, SEMESTR I, Fizyka
2006 04 System pomiarowy audio, część 2
Linux Kernel Przewodnik programisty lkerpp
LINUX Kernel Module Programming Guide 1 1 0 2 KLMCO3CKGP4OYRGENP7SIWZTCBVMR6FP5GKAPGI
systemy podatkowe w4 4 04 2006 Y34OFF636N43SNAFYBXLSOPQZBMYP4IZL4455UI
wymiana mikrowylacznika hands free, INSTRUKCJE, naprawa systemu Hands free
Instrukcje uaktualniania systemu BIOS
więcej podobnych podstron