
Business Process
Management

In an increasingly competitive world, we believe it’s
quality of thinking that will give you the edge – an idea
that opens new doors, a technique that solves a problem, or
an insight that simply makes sense of it all. The more you
know, the smarter and faster you can go.
That’s why we work with the best minds in business
and finance to bring cutting-edge thinking and best
learning practice to a global market.
Under a range of leading imprints, including
Financial Times Prentice Hall, we create world-class
print publications and electronic products bringing our
readers knowledge, skills and understanding which can
be applied whether studying or at work.
To find out more about our business publications, or tell
us about the books you’d like to find, you can visit us at
www.business-minds.com
For other Pearson Education publications, visit
www.pearsoned-ema.com
Prentice Hall
FINANCIAL TIMES

Business Process
Management
Integration in a web-enabled
environment
MARGARET MAY
An imprint of Pearson Education
London
■
New York
■
Toronto
■
Sydney
■
Tokyo
■
Singapore
■
Hong Kong
■
Cape Town
New Delhi
■
Madrid
■
Paris
■
Amsterdam
■
Munich
■
Milan
■
Stockholm
Prentice Hall
FINANCIAL TIMES

PEARSON EDUCATION LIMITED
Head Office:
Edinburgh Gate
Harlow CM20 2JE
Tel: +44 (0)1279 623623
Fax: +44 (0)1279 431059
London Office:
128 Long Acre
London WC2E 9AN
Tel: +44 (0)20 7447 2000
Fax: +44 (0)20 7447 2170
Website: www.briefingzone.com
First published in Great Britain in 2003
© Pearson Education Limited 2003
The right of Margaret May to be identified as author
of this work has been asserted by her in accordance
with the Copyright, Designs and Patents Act 1988.
ISBN 0 273 66108 6
British Library Cataloguing in Publication Data
A CIP catalogue record for this book can be obtained from the British Library.
All rights reserved; no part of this publication may be reproduced, stored
in a retrieval system, or transmitted in any form or by any means, electronic,
mechanical, photocopying, recording, or otherwise without either the prior
written permission of the Publishers or a licence permitting restricted copying
in the United Kingdom issued by the Copyright Licensing Agency Ltd,
90 Tottenham Court Road, London W1P 0LP. This book may not be lent,
resold, hired out or otherwise disposed of by way of trade in any form
of binding or cover other than that in which it is published, without the
prior consent of the Publishers.
10 9 8 7 6 5 4 3 2 1
Typeset by Monolith – www.monolith.uk.com
Printed and bound in Great Britain by Ashford Colour Press Ltd, Gosport, Hants.
The Publishers’ policy is to use paper manufactured from sustainable forests.

v
About the author
Margaret May FCMA is a director of a firm of consulting CIMA members, MAP
(www.m-a-p.co.uk). MAP specializes in advanced management techniques
designed to prepare organizations to change the present and manage the future.
Following a career in finance and administration in both the private and public
sectors, working for, among others, British Steel, North West Securities (Bank of
Scotland), Cheshire Police, Southern Electricity and Bowthorpe Holdings, she moved
into general management, running the Thermoplastic Sheet Division of Doeflex plc.
She entered consultancy, forming MAP with other CIMA practising members, in the
early 1990s and has specialized in the development of process/activity-based
techniques, performance management, performance improvement, information
management and change management, concentrating particularly on the practical
aspects of implementation.
In addition to her consultancy work, Margaret is a regular seminar and conference
presenter, visiting university lecturer and a member of CIMA Council since 1994.
She currently sits on the CIMA International and Technical Committees. Her recent
publications include articles in Management Accounting/Financial Management,
Real Finance and Finance Today; a chapter in the Gee/CIMA Handbook of
Management Accounting; and IFAC-published research entitled Preparing
Organisations to Manage the Future. This book is supplemented by a second book
by the same author, entitled Transforming the Finance Function: Adding company
wide value in a technology-driven environment (2002), also published by Pearson
as part of their Financial Times Prentice Hall Executive Briefing series.
The author runs seminars through MAP – both public and tailored in-house –
on the subject matter of these books and can be contacted directly at:
mmay@m-a-p.co.uk
Mobile 07973 500539
MAP office 01538 385364.


vii
Contents
List of figures
xii
List of abbreviations
xiv
List of case studies
xviii
Acknowledgements
xxi
Introduction
xxiii
PART ONE: THE STRATEGIC BENEFITS OF
COLLABORATIVE, WEB-ENABLED BUSINESS
PROCESS MANAGEMENT
The strategic benefits of business community
integration
3
The beginnings of collaborative commerce
5
The virtual organization
6
Partnerships
7
End-to-end business process management
8
E-business strategy
13
The web-enabled organization
15
The public sector
17
Measurement of value and return on investment
18
Outsourcing and application service providers
22
PART TWO: TECHNOLOGICAL, FINANCIAL, LEGAL AND
RISK MANAGEMENT CONSIDERATIONS
Web-enabling technology
29
The Internet and the Web
31
Intranets and extranets
32
Internet standards and protocols
32
1
2
3

viii
Contents
Web services
34
Enterprise application integration
36
Data storage
38
Mobile and wireless technology
41
Introduction
43
Broadband (high-speed packet-based wireless)
44
Voice over packet networks
44
General packet radio service
45
Wireless application protocol
46
Messaging
46
Electronic invoicing and payments
49
Introduction
51
Electronic data interchange
51
Electronic invoice presentment and payment
51
E-treasury
53
Electronic bill presentment and payment
54
Statutory and risk management considerations
57
Introduction
59
Dynamic security policy
59
Physical and technical security tools
62
Industry standards
63
Statutory considerations
64
PART THREE: END-TO-END BUSINESS PROCESSES
Enterprise resource planning
71
Introduction
73
ERP has facilitated process management
73
Drivers for implementing ERP
74
Advantages of ERP
74
Problems encountered with ERP
75
ERP in the twenty-first century
75
5
6
7
4

Contents
Service process optimization
77
Electronic document management
79
Business to employee
83
Human resource management
85
E-recruitment
87
E-learning
88
Information management delivering business intelligence
89
Data quality and compatibility
90
Content management systems
92
Enterprise portals
93
Supply/demand chain management
99
Introduction
101
Supply/demand chain strategy
103
E-manufacturing
105
Front-end systems
106
Logistics
107
E-tailing
107
Consumer marketplaces
108
E-procurement
111
Introduction
113
Procurement models
115
E-marketplaces
116
Open standards
121
Customer relationship management and
e-marketing
131
Introduction
133
Customer relationship management
133
CRM automation
136
Key benefits of CRM
139
Pointers to CRM success
140
E-marketing
141
ix
8
9
10
11

x
Contents
PART FOUR: HOW TO ANALYSE, RE-ENGINEER AND
MANAGE BUSINESS PROCESSES
Business process analysis
147
Introduction
149
Activity/process analysis methodology
150
Collection of activity/process information
153
Steps in building a process model
156
Activity/process-based costing
163
Introduction
165
Research
165
Signs of the need to review the costing system
166
How ABC differs from traditional costing
166
Choice of drivers
167
ABC example
169
Customer profitability
172
Process-based modelling
173
Business process performance improvement
175
Introduction
177
Activity classification
177
Activity-based cost management
178
Removal of constraints
179
Business process re-engineering
180
Change management
189
Introduction
191
Achieving successful change
191
How not to do it
193
Qualities of a change agent
195
Business process performance management
199
Introduction
201
Process-based budgeting
201
Objectives and responsibilities
203
Balanced performance measures and targets
204
12
13
14
15
16

Contents
Evaluation of alternative service levels
206
Priority-based budgeting
206
Process/activity-based monitoring and reporting
210
Process-based accounting incorporating
Six Sigma
217
Introduction
219
Forward-looking characteristics of processes
219
Ten bottom-line management guidelines for PBA
219
Steps for implementing PBA
220
Steps for operating PBA
220
A process-based performance measurement framework
221
The Six Sigma way
222
Knowledge transfer systems
222
Notes and references
225
Executive summary
235
Index
247
xi
17

xii
Figures
1.1
The virtualization continuum
6
1.2
Business process web-enabled shared services
8
1.3
The development of technology-driven finance
9
2.1
The web-enabled organization
15
2.2
Integrated performance management
20
2.3
Value-added outsourcing
23
8.1
Web-enabled information management process
89
9.1
Supply/demand chain networks
101
9.2
Characteristics of supply/demand chains
102
10.1
E-procurement
113
10.2
The e-marketplace
117
10.3
Unilever – regional roll-out
123
10.4
Unilever – one global installation
124
10.5
Unilever – supply chain benefits
125
10.6
Unilever – Ariba CSN benefits
125
10.7
Unilever – applicability for e-procurement implementation
126
10.8
Unilever – sample use of catalogue types
126
10.9
Unilever – e-payments overview of benefits
127
10.10 Unilever – e-payments process flow
127
10.11 Unilever – catalogue items with e-payment flow chart
128
10.12 Unilever – commitment buy with ERP reconciliation
128
11.1
CRM – a platform for successful marketing
137
11.2
ProXchange’s seven-level waterfall
144
12.1
Organization structure hierarchy
150
12.2
Process/activity hierarchy
151
12.3
CAM-I cross
152
12.4
Systems design and delivery sub-process
152
12.5
Waiting list sub-process
153
12.6
Data collection form
155
12.7
AWS – user network
157
12.8
AWS – billing and collection process (micro)
157
12.9
AWS – billing and collection process (macro)
158

Figures
12.10 AWS – ARTS 2000
159
12.11 AWS – process view
159
12.12 AWS – system flows
160
12.13 AWS – efficiency analysis
161
13.1
ABB: changes in cost composition
165
13.2
How ABC differs from traditional costing
167
13.3
ABC drivers
168
13.4
ABC – help-desk
169
13.5
Customer profitability
172
13.6
Helpdesk pricing
173
14.1
Value chain
179
14.2
The procurement process
181
14.3
Cause and effect analysis
181
14.4
Process improvement lifecycle
182
14.5
ABB – ABC working team structure
185
14.6
ABB – linking the plans
186
15.1
The impact of change
192
15.2
The boat race
194
16.1
Activity budgeting
202
16.2
Process hierarchy
203
16.3
Balanced performance measures
205
16.4
Alternative service levels
207
16.5
Priority-based budgeting rating scale
207
16.6
Priority-based budget – Security
208
16.7
Ranked priority budget
208
16.8
Earned value activity analysis
211
16.9
Actual activity analysis
211
16.10 MHT – RRP activity costs
212
16.11 MHT – RRP regional activity costs per order
213
16.12 MHT – average costs for repairs and maintenance administration
213
16.13 MHT – RRP cost drivers
214
16.14 MHT – repairs and maintenance budget: traditional versus ABC
216
The author and publisher have made every effort to seek permission for the figures
used in this book.
xiii

xiv
3G
third generation wireless technology
ABB
activity-based budgeting
ABC
activity-based costing
ABCM
activity-based cost management
API
application program interface
ASP
application service provider
ATM
asynchronous transfer mode
AVS
address verification service
B2B
business to business
B2C
business to customer
B2E
business to employee
B2M
business to mobile
BASDA Business and Accounting Software Developers’ Association
BCI
business community integration
BPM
business process management
BPMI
Business Process Management Initiative
BPR
business process re-engineering
BSC
balanced scorecard
BU
business unit
C2C
customer to customer
CBI
Confederation of British Industry
CEO
chief executive officer
CFO
chief finance officer
CIMA
Chartered Institute of Management Accountants
CIO
chief information officer
CNP
cardholder not present
COD
capacity on demand
COO
chief operations officer
CPFR
collaborative planning, forecasting and replenishment
CRM
customer relationship management
CTI
computer and telephone integration
Abbreviations

Abbreviations
CTX
consortium trading exchange
DAS
direct attached storage
DCM
demand chain management
DOS
denial of service
DSS
decision support system
DTI
Department of Trade and Industry
E2E
end-to-end [processes]
EAI
enterprise application integration
EBPP
electronic bill presentment and payment
ECCMA Electronic Commerce Code Management Association
EDI
electronic data interchange
EFT
electronic funds transfer
EI
enterprise integration
EIAC
Electronic International Attribute Code
EIP
enterprise information portal
EIPP
electronic invoice presentment and payment
EIS
enterprise information system
EMS
enhanced messaging service
ERP
enterprise resource planning
ESA
enterprise service automation
FAQ
frequently asked questions
GPRS
general packet radio service
GPS
global positioning system
GSM
global system for mobile communications
HR
human resources
HSCSD high speed circuit switched data
HTML
hypertext mark-up language
HTTP
hypertext transfer protocol
IHX
independent horizontal exchange
IM
instant messaging
IP
Internet protocol
IPR
intellectual property rights
IS
information system
iSCSI
small computer system interface (electronic)
ISDN
Integrated Services Digital Network
xv

xvi
Abbreviations
ISP
Internet service provider
IT
information technology
IVX
independent vertical exchange
KIS
keep it simple
KPI
key performance indicator
LAN
local area network
LCV
lifetime customer valuation
MD
managing director
MMS
multimedia messaging service
MRO
maintenance, repairs and operations
NAS
network attached storage
NPI
non-production item
NPV
net present value
OLAP
Online analytical processing
OPA
Online Privacy Alliance
OSI
open systems interconnection
OTD
order to delivery
P&G
Procter & Gamble
P/ABT
process/activity-based techniques
P2P
peer to peer
PBA
Process-based accounting
PBB
priority-based budgeting
PBM
process-based management
PBT
process-based techniques
PDA
personal digital assistant
PIN
personal identification number
PKI
public key infrastructure
PLM
product lifecycle management
POS
point of sale
PR
public relations
PSA
professional services automation
PSP
payment service provider
PTX
private trading exchange
RF
radio frequency
RIP Act Regulation of Investigatory Powers Act 2000

Abbreviations
ROI
return on investment
S/DCM
supply/demand chain management
SAN
storage area network
SBU
strategic business unit
SCM
supply chain management
SLA
service level agreement
SME
small or medium-sized enterprise
SMS
short message service
SOAP
simple object access protocol
SPO
service process optimization
SRM
services relationship management
SSC
shared service centre
SSL
Secure Socket Layer
STP
straight through processing
SWOT
strengths, weaknesses, opportunities, threats
TCO
total cost of ownership
TCP/IP
transmission control protocol/Internet protocol
UDDI
Universal Description Discovery and Integration project
UM
unified messaging
UMTS
Universal Mobile Telephone System
UNSPSC Universal Standard Product and Services Classification
VAN
value added network
VBM
value-based management
VoIP
voice over Internet protocol
VPN
virtual private network
W3C
World Wide Web Consortium
WAN
wide area network
WAP
wireless application protocol
WLAN
wireless local area network
XBML
extensible business mark-up language
XBRL
extensible business reporting language
XML
extensible mark-up language
XMS
extended message service
Y2K
year 2000
xvii

Case studies
xviii
1.1
Procter and Gamble
5
1.2
Intel
10
1.3
Cisco Systems
11
2.1
Dell
16
2.2
Liverpool City Council
17
2.3
Delta Air Lines
21
2.4
National City
21
2.5
Cabot
21
2.6
Con-Way Transportation Services
21
2.7
Thames Water
22
2.8
BP Amoco
24
2.9
Nissan North America
25
2.10
Rolls Royce
25
3.1
CGU Life
35
3.2
Royal Dutch Shell
36
3.3
Storebrand
36
3.4
Jefferson County
37
3.5
Telia
38
3.6
Coats
38
4.1
Masterbit
47
4.2
Bayer
47
4.3
Reitan Narvasen
47
4.4
Volkswagen
47
5.1
Flymo
51
5.2
Philips
53
5.3
Atriax
54
5.4
Sara Lee DE
54
6.1
PacifiCare Health Systems
60
6.2
Synstar and SchlumbergerSema
60
6.3
Sainsbury
60
6.4
Deutsche Bank
62

Case studies
7.1
Aggresso
77
7.2
Steinbeis Temming
80
7.3
RNLI
80–2
8.1
STI Knowledge
87
8.2
Lafarge Group
87
8.3
National Health Service
87
8.4
BP Amoco
87
8.5
Motorola
88
8.6
Safeway
88
8.7
IBM
88
8.8
Wal-Mart
90
8.9
Us Telecom
91
8.10
KeyBank
91
8.11
Cincinnati Bell
91
8.12
Hewlett Packard
94
8.13
Ford Motor Company
95
8.14
Herman Miller
95
8.15
Royal & Sun Alliance
95
8.16
BOC Group
96
8.17
The Inland Revenue
96
8.18
Orient Express
96
9.1
Premier Paper
104
9.2
General Motors
104
9.3
Clarks Shoes
104
9.4
British American Tobacco
106
9.5
IMI Norgren
106
9.6
The Stralfors Group
106
9.7
Ford
107
9.8
Tesco
108
9.9
eBay
108
10.1
Credit Suisse First Boston
114
10.2
Astra Zeneca
115
10.3
Rolls Royce
115
10.4
The Halifax
116
10.5
Hewlett-Packard
117
xix

xx
Case studies
10.6
Cisco Systems
118
10.7
General Electric
118
10.8
Unilever
121–9
11.1
More Th>n
137
11.2
Consignia
138
11.3
Sky Services
138
11.4
The AA
139
11.5
Commerzbank
139
11.6
Lloyds TSB
143
11.7
Convergys
143
11.8
ProXchange
144
12.1
Anglian Water Services
156–7
13.1
Defence Logistics Organisation
174
14.1
Asea Brown Boveri
183–7
15.1
GE
197
16.1
Metropolitan Housing Trust
212–16
17.1
GE Six Sigma
223–4

xxi
Acknowledgements
The author would like to thank the following for their help, advice and contributions
in the form of case studies, all of which she gratefully acknowledges:
■
MAP, who have kindly consented to the use of seminar material being used
extensively in this publication.
■
Judith Saint, Deputy Finance Director of RNLI (Royal National Lifeboat
Institution), for the case study on their successful SAP implementation in
Chapter 7.
■
Tim Cooper-Jones, senior manager with responsibility for implementing
e-procurement in Europe, for the Unilever case study in Chapter 10.
■
Abhai Rajguru for giving permission for the use of the Anglian Water MAP
client case study on process-based business intelligence in Chapter 12.
■
Andy Daniels for writing the case study on company-wide ABC and BPR at
Asea Brown Boveri (ABB) in Chapter 14.
■
George McMorron for allowing use of the Metropolitan Housing Trust MAP
client case study of process/activity-based techniques on its reactive repair
process in Chapter 16.
■
The editorial and production team at Pearson for their assistance in finalizing
the book for publication.
Errors and omissions excepted. Any mistakes or shortcomings are the author’s
responsibility.


xxiii
Introduction
With the current downturn, margins are being squeezed in most industries,
resulting in an urgent need for higher efficiency and greater effectiveness,
including the putting in place of better-value ways of working. A true e-business
of the twenty-first century is one which thinks and acts in a way that allows it to
collaborate, integrate and empower by:
■
internal and external business processes working together seamlessly, enabling
collaboration with suppliers, partners, employees and customers across traditional
enterprise boundaries;
■
ensuring that employees have at their fingertips the information, applications
and services they need to do their jobs.
It is the Web and the applications, standards, tools and services that have been
developed around it that have removed the traditional barriers to building
collaborative relationships and now made it an economically attractive option.
The benefits from the transformation of business processes are derived from
eliminating intermediaries like wholesalers and retailers from the value chain,
removing manual operations, improving productivity and speed of operation,
increasing efficiency and enhancing customer and supplier relationships.
According to industry analysts IDC Research,
1
companies are on the brink of
another growth cycle in IT spending, with application integration, mobile wireless
and security the chief factors driving companies to invest in technology. A joint
survey released in May 2002 by KPMG
2
and the CBI reveals that 90 per cent of
companies believe e-business will reduce costs by at least 10 per cent but only 15
per cent are currently reaping the rewards. Improving business processes alongside
new technology could boost the profits of UK companies by £4.3 billion a year
according to the Gartner Group,
3
who quote Easyjet and Tesco as two examples of
organizations that have maximized their agility. By re-engineering the distribution
chain and pushing sales online Easyjet cut out the costs of sales intermediaries and
then further reduced costs by issuing e-tickets. Improvements with customer
information at Tesco has reduced lost sales on promotions by 33 per cent and
reduced promotion overhead and waste by 30 per cent, while wireless technologies
have also increased the productivity of warehouse staff and improved the accuracy
of warehouse-to-store deliveries.
In this briefing we take a look at this subject with a non-technical and pragmatic
approach by dividing it into four parts.

xxiv
Introduction
THE STRATEGIC BENEFITS OF COLLABORATIVE
WEB-ENABLED BUSINESS PROCESS MANAGEMENT
Collaborative commerce had its beginnings in the 1980s with both electronic data
interchange (EDI) and Procter & Gamble and Wal-Mart’s ‘collaborative
replenishment’ project. Today, with the move towards greater collaboration and
increased outsourcing of both core and non-core activities, companies are becoming
virtual organizations – a combination of organizations working together in close
partnership, with shared risk and reward, to deliver end value to customers.
The value comes from the business initiatives involved in moving to web-
enabled, collaborative end-to-end (E2E) processes. IT, although often the most
expensive component of these projects, is an enabler, not an end in itself. It should
be the business driving the technology not the technology driving the business.
Research has shown that there is no automatic correlation between the amount of
money spent on IT per employee and company profitability, although if done well
spectacular results can be achieved. Companies must insist on quick payback
times, thorough business plans and careful, regular pre- and post-implementation
analyses of all major technology projects. According to Strassmann:
Companies are finally fed up with the escalating costs of IT through
incompetent implementations. IT must be put into the hands of people who
are competent to deliver and it has to be taken for granted. It must be
available when you need it, how you need it, cheaply, reliably and securely.
Companies need to worry about how to use it, not how to manage it. From
now on just watch the economics and the risk, not the technology.
4
THE TECHNOLOGICAL, FINANCIAL, LEGAL AND RISK
MANAGEMENT CONSIDERATIONS
A typical large company has 30–50 separate applications which are not integrated.
The need to connect to customer and supplier systems has exacerbated this problem
and left companies with a large number of incompatible systems. With wholesale
replacement of systems not often a viable solution, Web standards and services and
enterprise application integration (EAI) middleware are providing an automated,
cheap alternative to labour-intensive point-to-point integration. To facilitate this
integration underlying systems do not have to be changed but business logic needs

Introduction
to be separated from data and the presentation layer has to be split off. This is
because it is no longer possible to predict the nature of the device that may be used
to contact the company, e.g. PC, handheld computer or mobile.
Equally, there is a need for a sound, dynamic security policy, which is embedded
in the corporate culture combined with an ongoing risk assessment and mitigation
process, including business continuity, in addition to the more obvious physical and
technical tools such as firewalls. The challenge is to achieve maximum functionality
within an entirely secure environment by including security in the design.
END-TO-END (E2E) BUSINESS PROCESSES
Just as companies are recognizing the benefits of selling directly to consumers over
the Web, companies are now applying disintermediation to their own corporate
structures. An increasing number of companies are seeing the benefits of
employing a self-service approach to HR and employee information, leading to a
growth in enterprise portals. According to Wal-Mart’s CIO, in the last ten years
the driver of change has made the transition from technology to information.
5
What is really strategic is the use of the information and how it is exploited and
maximized. Wal-Mart is in a business that competes at the speed of information,
so it must be presented in such a way that it drives execution and improvements
in the business. Martin Butler believes that two-thirds of the value of large
companies is made up of information and knowledge and to overlook this issue is
to devalue the business.
6
Successful customer relationship management (CRM) is about giving the customer
a better experience, hence enhancing the company’s chances of retaining the lifetime
value of that customer and acquiring new customers. The goal of CRM is to
understand who the most profitable customers are – essential for both online and
offline business. The Web is the ideal tool internally to tie together the disparate,
product-based systems that contain customer data, and externally it can provide all
customers with a similar and consistent experience, whatever products they buy.
Integration of CRM with enterprise resource planning (ERP) and supply/demand
chain management (S/DCM) are critical to success, especially supporting systems like
order fulfilment, logistics, inventory management and electronic bill presentment and
payment. The aim is to give the customer a seamless experience.
The supply chain in many organizations can consume well over 50 per cent of a
company’s operating expenses. It is therefore an obvious area to explore and
exploit in the search for business systems improvement. When Microsoft adopted
e-procurement the average transaction cost was reported to drop from £145 to £5.
xxv

xxvi
Introduction
HOW TO ANALYSE, RE-ENGINEER AND MANAGE
BUSINESS PROCESSES
The use of process-based management as the basis for managing the business was
accelerated in the 1990s by the large number of ERP implementations within
organizations and their use of a process-based philosophy. Over the last ten years,
process-based techniques (PBT) have evolved from being used as just one-off tools
applied for a particular purpose within the organization, such as costing or
business improvement, and have become an all-embracing advanced planning,
monitoring and control system which encompasses quality management
philosophies – business process management (BPM). The quality initiative Six
Sigma is sweeping the US, with business leaders in a quest for operations
performance improvement. For peak performance, companies should assign
process owners and position Six Sigma as one tool in the context of a holistic and
strategic business process management approach.
Whether designing products and services, measuring performance, improving
efficiency and customer satisfaction – or even running the business – Six
Sigma positions the process as the key vehicle of success. Research has
shown that the costs of poor quality (rework, mistakes, abandoned projects
etc) in service-based businesses and processes typically run as high as 50%
of total budget.
7
In 1995, 62 per cent of UK managers were affected by some sort of organizational
change programme: in manufacturing and financial services it was running at 75
per cent, in utilities it reached 90 per cent.
8
In the twenty-first century change is a
constant. For organizations which manage change skilfully, it can become the
driving force that perpetuates success and growth, with every change presenting a
new opportunity to increase efficiency or to build the business. But all too often
change fails as companies do not rise to the challenges it brings.

Part one
The Strategic Benefits of
Collaborative, Web-enabled
Business Process Management
1
The strategic benefits of business community
integration
3
2
E-business strategy
13
■
■
1


1
The strategic benefits of
business community integration
The beginnings of collaborative commerce
5
The virtual organization
6
Partnerships
7
End-to-end business process management
8
■
■
■
■
3


The strategic benefits of business community integration
THE BEGINNINGS OF COLLABORATIVE
COMMERCE (c-commerce)
The roots of automated business trading links can be found more than 20 years
ago with electronic data interchange (EDI), which has enabled larger organizations
to carry out automatic transaction and information transfers.
Case study 1.1
Procter and Gamble
The move towards closer collaborative trading relationships began in 1980 when Duane
Weeks, a Procter & Gamble brand manager, led a team that prototyped ‘continuous
replenishment’, automatically shipping Pampers to the warehouses of Schnucks, without the
grocer needing to place orders.
1
The prototype was broadened by P&G vice president of
customer services, Ralph Drayer, who, not deterred by K-Mart’s rejection of the idea,
approached Wal-Mart’s Sam Walton and sold him the concept in 1988. Today, P&G software
and process design is the industry standard. Drayer explains the road to P&G’s success in
establishing jointly managed processes between supplier and customer as follows:
■
The importance of a trusting business relationship with your counterpart. It was a case
of moving from an adversarial win/lose trading relationship that was frustrating, time-
consuming and expensive, to one where both parties could demonstrate that they were
interested in the well-being and success of the other. The ‘continuous replenishment’
project built trust and demonstrated the value of sharing information and focusing on the
ultimate consumer. The benefits of improved service and reduced inventory were reaped
by both sides and built the foundation for a greater collaborative trading relationship.
■
The necessity of having senior management support. The chairman gave support to the
early project and Inform software was purchased from IBM. The support continued
throughout and his leadership stopped internal politics stifling the initiative.
■
The challenge of changing the customer’s culture as well as your own. It was necessary
to persuade Wal-Mart that P&G could manage its inventory better than they could
themselves. For example, they had to learn to receive trucks immediately they arrived,
when it had been not unusual to see hundreds waiting to be unloaded. In effect, the
mechanics of scheduling had to be rethought.
■
The move from continuous replenishment to collaborative planning, forecasting and
replenishment (CPFR). It became apparent that it was necessary to go beyond the
customer’s warehouse and start using actual point-of-sale (POS) data. The linking of
demand planning to supply planning results in a process that resembles a pipeline that
is continually flowing rather than a static warehouse – joint business planning, promotion
planning, sales forecasting, order forecasting and promotion evaluation.
5

6
Part One: The Strategic Benefits of Process Management
THE VIRTUAL ORGANIZATION
Twenty years later, with the move towards greater collaboration and increased
outsourcing of both core and non-core activities, companies are becoming virtual
organizations. This is an organization that uses information and communications
technology to allow it to operate without defined physical boundaries between
different parts of the organization and its partners and suppliers. The result should
be a more responsive and flexible company with greater market orientation.
Kraut et al.
2
suggest that the features of a virtual organization are as follows:
■
processes transcend the boundaries of a single form and are not controlled by
a single organizational hierarchy;
■
production processes are flexible with different parties involved at different times;
■
parties involved in the production of a single product are often geographically
dispersed;
■
given this dispersion, coordination is heavily dependent on telecommunications
and data networks.
Figure 1.1, the virtualization continuum, shows that the choices can be viewed as a
continuum. This continuum starts with the traditional vertical organization where
control remains totally within the organization, and through a stage of vertical
disintegration often termed supply chain disaggregation where the company moves
to outsource some, generally non-core, activities and to build up a network of
suppliers, focusing on its core activities and the automation of its processes. This
virtualization process eventually results in strategic alliances being formed with
suppliers and partners and a reliance on third parties to deliver the product.
Fig. 1.1
The virtualization continuum
Vertical
organization
■
Control remains
within
company
■
Traditional
relationships
with
suppliers
and
customers
■
In-house
manufacture
Vertical
disintegration
■
Outsource some,
mainly
non-core,
activities
■
Start to build up
a network of
suppliers
■
Automation of
processes
Vertical
integration
■
Outsourcing of
core and non-core
activities
■
Strategic alliances
formed
with
suppliers
and
customers
■
Shared risk and
reward

The strategic benefits of business community integration
Branded goods suppliers, notably in the telecommunications and hi-tech sectors,
are reinventing themselves as marketing operations, requiring an emphasis on
collaborative product design and configurable products tailored to markets and
individuals. In addition customer analytics provide price and revenue optimization
techniques that look at elasticity and each customer’s unique willingness to pay,
delivering increased profitability.
In 1978 the book value of financial and physical assets on average equalled some
95 per cent of the market value of an organization. In 2001 it is nearer 20 per cent.
The other 80 per cent is derived from intangible assets/intellectual capital, such as,
knowledge, brands, research and development, intellectual property, reputation and
relationships with employees, customers, suppliers and business partners.
3
Tangible
assets like property can be leased and manufacturing outsourced. Companies like
Nike, Benetton and Cisco can be argued to have more value as virtual companies
than if they owned their own production facilities.
PARTNERSHIPS
As businesses move towards virtualization, the forming of partnerships is of the
utmost importance. Examination of supply/demand chain strategy should not just
focus on automating and integrating existing supply chains but instead on
fundamentally questioning the basis of relationships with suppliers and
distributors. According to Stuart and McCutcheon cost is the main driver for
partnership management but the traditional approach of disintermediation is no
longer sufficient.
4
The traditional approach suggests:
■
a focus on core competencies;
■
a reduction in the numbers of suppliers;
■
the development of strong partnership relationships built on shared information
and trust with the remaining suppliers.
When reviewing partnerships, companies need to decide the options for the extent
and control of the supply chain process. The decision will depend on the objective
to be achieved:
■
If the objective is cost benefit, then a relationship with competitive tension is
required like competitive tendering, short-term contracts or spot market and
auctions, e.g e-marketplaces.
■
If value-added benefits such as improved delivery speed, additional design features
and customization are required then the arm’s length approach is not appropriate.
Strategic alliances, investment stakes or cooperative partnerships like profit-
sharing partnerships, long-term contracts and preferred suppliers are the possible
7
8
Part One: The Strategic Benefits of Process Management
options. An example of such a strategic alliance would be the new c-business
solution from Cable & Wireless, Compaq and Microsoft called a-Services.
Losing control of the process does not preclude an ability to exert strong control
over the outputs of the process. As the depth of the relationship between partners
increases then so does the requirement for exchange of information.
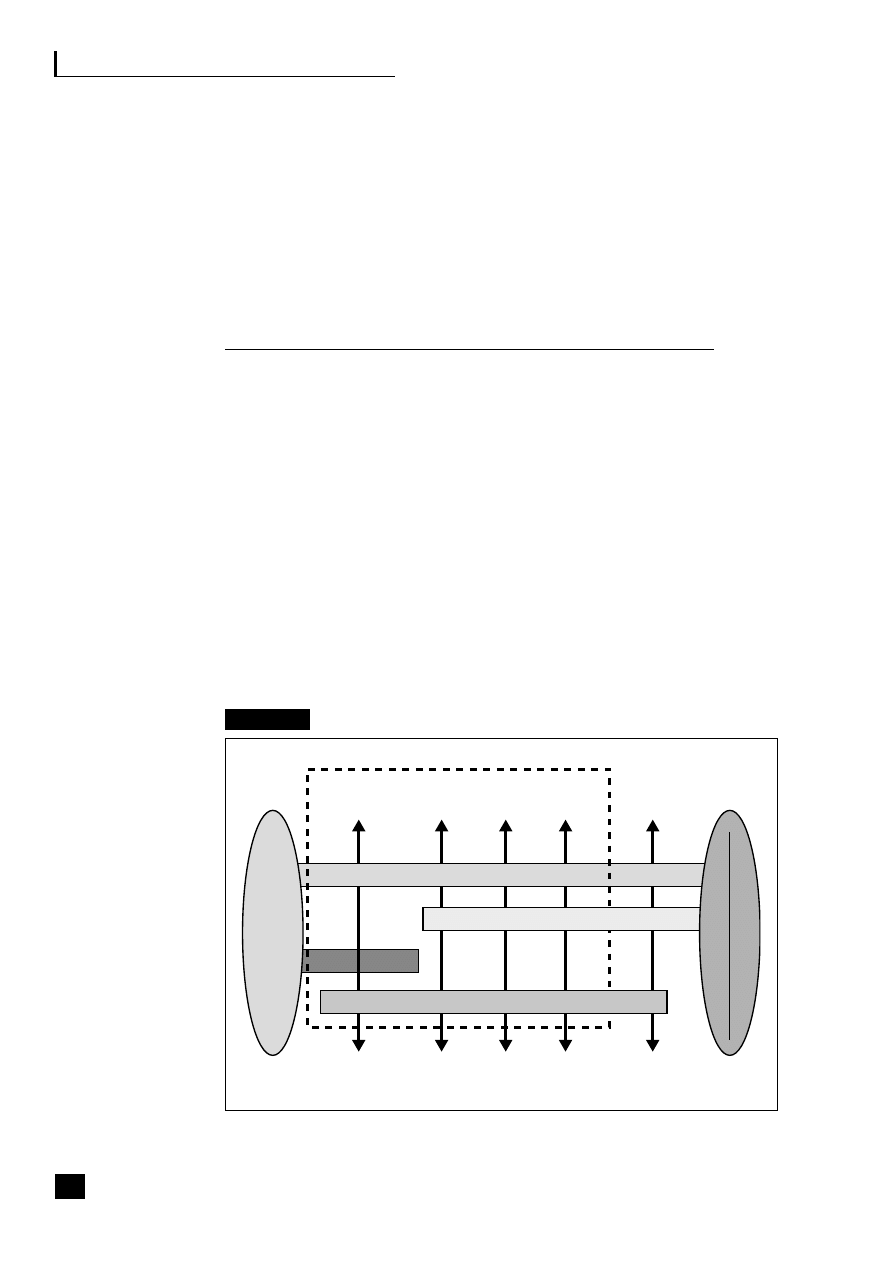
END-TO-END BUSINESS PROCESS MANAGEMENT
An E2E BPM strategy demands much more than software and web technology to
succeed, as we learnt from Procter & Gamble. Equally important to this
revolution is the complete change in culture needed to form successful
collaborative relationships between functions within the enterprise and with
customers and suppliers and the need to re-engineer business processes. This new
process-based structure and culture within organizations has been evolving over
the past decade, resulting in departmental boundaries between support functions
being broken down. The structure at the start of the twenty-first century looks
very different, with operational departments set up as strategic business units
(SBU) and back-office functions often incorporated into a shared service centre
(SSC). The SSC might well be located in, say, India or another economically
advantageous geographical location, with all other non-core processes, headed up
by a chief operations officer (COO) (see Figure 1.2).
5
Fig. 1.2
Business process web-enabled shared services
CRM
Sales/customer
service
Transaction processing
Shared-services centre
Finance/
admin.
HR
Purchasing/
MRP
Manufacturing/
assembly
Supply/demand chain
C
U
S
T
O
M
E
R
S
Business to employee
E-procurement
S
U
P
P
L
I
E
R
S
P
A
R
T
N
E
R
S
The strategic benefits of business community integration
This shows how the business typically interacts with the three main end-to-end
(E2E) processes as they become web-enabled:
■
the supply/demand chain (B2B2C) incorporating e-procurement (B2B);
■
the customer relationship process (B2C);
■
the employee process (B2E).
These E2E processes are revolutionizing business practices (see Part Three, pp.
69–139).
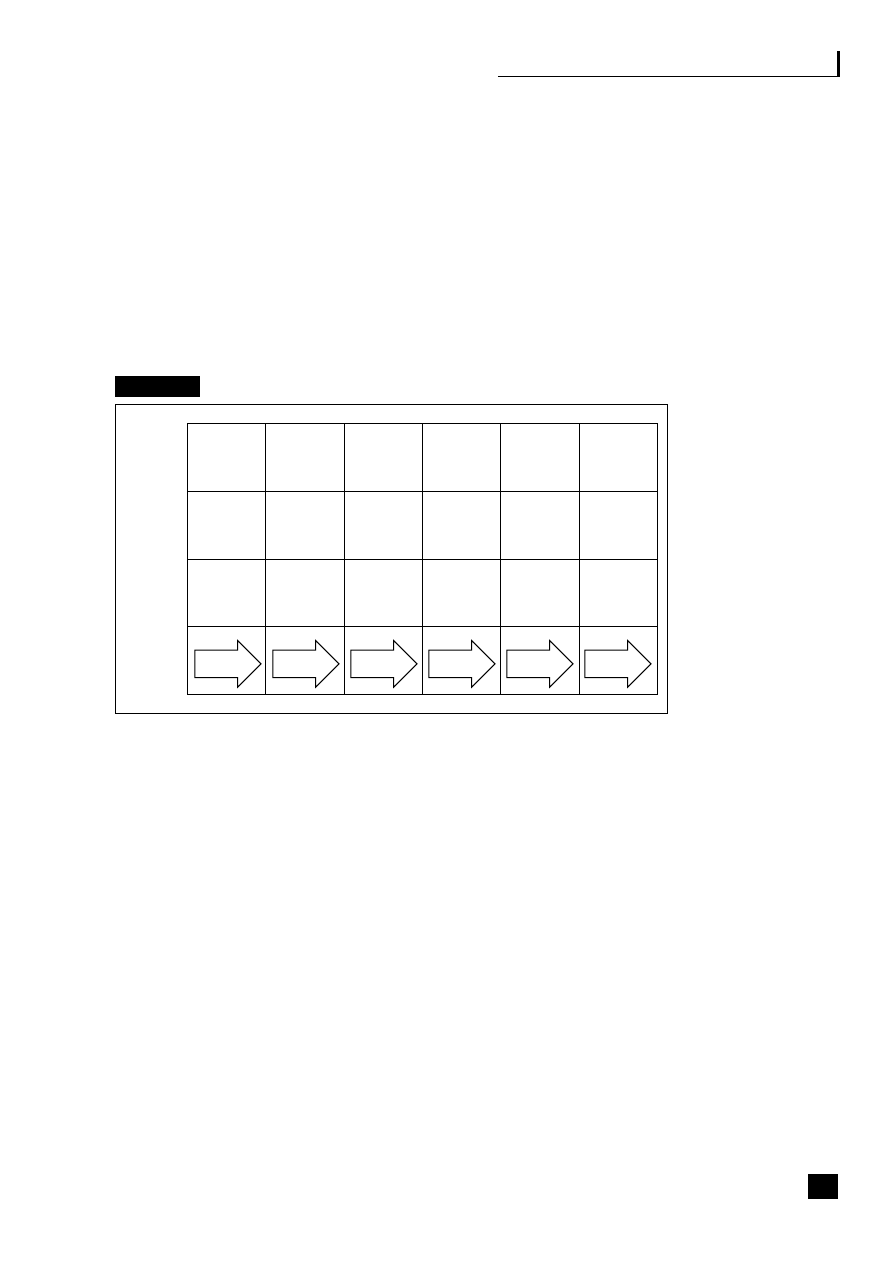
Fig. 1.3
The development of technology-driven finance
Figure 1.3 shows how technology has evolved from department-specific systems
through enterprise-wide to lights-out E2E processing, and with it the evolution of
information to decision-support and then to business intelligence. This evolution
is predicted to be complete by 2010 when the need to house an SSC as a separate
processing unit will become unnecessary. Automated auditing processes, known
as ‘auditbots’ are now being embedded into ERP software to audit all routine
transactions. With the fully automated and integrated model, the only manual
intervention that will be needed to operate the processes in the non-core functions
will be web and application systems maintenance and audit and exceptions
management when a problem occurs.
BPM software is now being developed to address the ever-growing pressures that
face business users today – allowing data to be passed between disparate operating
systems, converting data into business intelligence, managing application-to-
application integration and application-to-human interactions. The Butler Group
reports that regulatory bodies, such as the Business Process Management Initiative
(BPMI), are encouraging the use of standards to support the technology.
6
The key
issues for BPM are:
9
Organization
Technology
Reporting
Manual
based
finance
Centralized
finance
Devolved
finance
Shared
service
centres
Web-
enabled
shared
services
Virtual
organization
Manual
financial
and cost
ledgers
Big-box
computers
Local
servers,
PCs
Global
enterprise-wide
ERP
Fully
integrated
end-to-end
processes
Lights-out
processing
Typed
reports
Standard
printout
Spreadsheet
reporting
packs
Electronic
reporting
Decision
support
systems
Business
intelligence
systems
Pre
1970s
1970s
1980s
1990s
2000s
2010s

10
Part One: The Strategic Benefits of Process Management
■
to provide the ability to respond to change whenever and wherever it occurs;
■
to provide business users with application-agnostic solutions where the process-
centric approach to development overrides the restrictions, imposed by back-
office and legacy systems;
■
increasing profitability, reducing error and cycle times;
■
the automation wherever possible of manual processes.
Business process analysis requires an understanding of the activities involved in
the overall processes and the drivers of cost within those activities, e.g. the cost of
ensuring that the systems on which the business depends are kept running 24
hours a day, seven days a week. Once in place the effective management of those
processes is needed to ensure that they are delivering to optimum performance
(see Part Four, pp. 145–222, including Chapter 15 on change management, which
is the key to successful re-engineering).
Case study 1.2
INTEL
Intel,
7
the $26 billion US chip giant, had already started to improve the effectiveness of its
Accounts Payable department, which handles 60 per cent of the firm’s transactions (about
1 million a year) and 75 per cent of the value of payments for Intel, by implementing the
latest EDI and imaging technology. Richard Taylor, corporate controller, wanted further
improvements and put forward a plan to move the whole operation to a single low-cost
centre such as India. He gave his team three months to come up with a better alternative.
Jeff Lupinacci, head of the BPR project, decided that this was not radical enough as a
solution and proposed ‘lights-out’ accounting. The process could be reduced to confirmation
of a purchase order and confirmation of receipt – the invoice was superfluous and could be
eliminated. The aim was to automate those two mechanisms by using web-enabled IT
solutions. Under the new system, when Intel staff want to buy something, they access their
firm’s web portal – which contains catalogues from authorized suppliers that list prices,
availability and contract terms – and place their order online. Once goods are received, they
enter a confirmation onto the system, which automatically triggers a payment. The average
cost per transaction was reduced from $8 in 1999 to $1 in 2001.
There are four main types of payment – direct materials, manufacturing support products,
services and consultants/temporary staff. Fortunately, the team was able to ‘piggy-back’ on
existing projects like e-procurement and EDI. Internal controls were built in for controlling
access to accounts payable data and ensuring that security was robust enough to guarantee
that payments were made only when goods were received. Hard copies of invoices are kept
for use in countries where it is obligatory.

The strategic benefits of business community integration
Case study 1.3
Cisco Systems
Cisco
8
employ 40,000 people worldwide with revenues in 2000 of $18 billion. Cisco’s
technology – and more importantly its management ethos – allows it to close its books in
24 hours – a virtual close. It was management’s determination to get better information
faster to give the company competitive advantage that forced the changes. It helps that 90
per cent of Cisco’s orders are received electronically and filtered through an Amsterdam
office that acts like a European SSC for revenue purposes, and that it sells indirectly through
a few hundred partners.
For example, when an order is received for a ‘lower end router’, it will go electronically into
the master scheduler in the database in San Jose. It then goes onto the production line at
an outsourced company in Scotland and is shipped to the customer – it never physically
goes near Cisco. Cisco owns only two of its 40 manufacturing operations – the rest are run
by partners, who participate in Cisco’s supply chain. Less than a quarter of all orders actually
touch Cisco – most are fulfilled directly by partners. Cisco owns the designs and software
that control its products, while the rest is in the hands of its manufacturing partners and
resellers. This makes Cisco as near as you get to a virtual corporation, yet it is the third most
valuable company in the world today.
Cisco has an EIS that operates like corporate telemetry. Key data is available on Cisco’s
intranet the next day and accessible for managers throughout the company to drill down,
and the sales people forecast on a weekly basis. Part of the sales team’s remuneration is
based on minimal divergence from linearity, which discourages tail-end bunching and all the
advantages that having evenly spread orders brings – process stability.
11


2
E-business strategy
The web-enabled organization
15
The public sector
17
Measurement of value and return on investment
18
Outsourcing and application service providers
22
■
■
■
■
13


E-business strategy
THE WEB-ENABLED ORGANIZATION
The emergence of the Internet has opened up new possibilities and opportunities
for organizations in the way in which they interact with their customers,
suppliers, partners and employees. E-business can be defined as taking existing
business processes, and applying web technology to make them more efficient
through business collaboration and communication. E-commerce is causing
organizations to fundamentally review how their businesses operate to satisfy
customers at the lowest cost, resulting in the so-called ‘clicks and mortar’
approach by many traditional businesses, who are offering an Internet channel in
addition to their traditional channels. Lessons learned from early adopters of
e-commerce show that new skills are needed but these do not need to be separated
from the rest of the business. Ford’s ConsumerConnect and e-GM have both now
been integrated into the mainstream businesses. There needs to be cohesion
between business processes and new technology. There is no doubt that
organizations involved in B2C marketing must have the ability to know that the
item being ordered is in stock and can be delivered in a short timescale. Even for
those organizations without the pressures brought by selling over the Web, this
ability is very attractive, particularly when it brings with it massive processing
cost reductions, improved productivity and satisfied customers.
In an e-business, typically, orders can be placed directly by customers on the Web,
then electronically processed via workflow techniques and passed via web-enabled
links to suppliers to execute. Payment is then made electronically. The support
functions are involved only where exceptions occur. The benefits of achieving seamless
integration between the organization’s systems and those of its employees, suppliers,
customers and other partners wherever they are geographically located is undoubtedly
a challenge but well worth the work involved in making it happen (see Figure 2.1).
Fig. 2.1
The web-enabled organization
Source: Margaret May (2002)
15
Web-
enabled
ERP, SCM,
CRM, etc.
Web applications
Tools and services
Public
Government
agencies
Banks/financial
institutions
Management
Partners
Employees
Suppliers
Outsourcers
Customers
Mobile devices

16
Part One: The Strategic Benefits of Process Management
There is a need to have robust, internally integrated, business process-oriented
systems as a prerequisite to connecting to the wider business community. The
installation of enterprise resource planning (ERP) software (see Chapter 7, pp.
69–80), that was undertaken in the late 1990s by many larger organizations to
automate the back-office, facilitates this requirement. These newly integrated ERP
systems can now be web-enabled allowing E2E processes to extend outside the
organization. This transfers the generation of source transactions to partners,
suppliers, customers and employees, removing the need to input orders or invoices
within the company at all. ERP and middleware integrated systems are now being
linked to front-office customer relationship management (CRM) and supply/demand
chain management (SCM/DCM) packages, which have automated these processes
and produced even more strategic and operational efficiency and information for
decision-making purposes.
Case study 2.1
Dell
Dell
1
is one of the companies that has led the way in e-business. Dell’s direct business
model is at the heart of the company and it has three central elements:
■
one-to-one relationships with customers;
■
products that are built-to-order for each customer;
■
the lowest cost structure of any of their major competitors.
Dell’s cost advantage is driven by:
■
a lack of mark-ups from the reseller channel;
■
their close relationship with suppliers;
■
inventory management;
■
operational efficiency.
The virtual integration of their suppliers and customer orders helped inventory drop from 33
days in 1994 to 5 days in 2001. The Internet has enabled suppliers and their suppliers to
have the most accurate, up-to-the-minute information about their products which Dell is
selling; they have unique insight into volumes, quality issues and customer satisfaction in
real-time via ‘valuechain.del.com’.
Dell first started using the Internet to serve customers in the late 1980s, allowing the
downloading of technical support drivers and information. It started selling systems over the
Web, which accounts for 50 per cent of orders worth over $10 million a day, in 1995 and
now spans 27 European countries in 18 languages and includes:

E-business strategy
■
real-time online order status tracking;
■
online ordering allowing 30,000 order configurations;
■
technical support information with troubleshooting guides.
Dell’s 60,000 corporate and public sector business customers are provided with
‘PremierDell.com’, which is unique to each customer containing all aspects of the relationship
including pricing, catalogue and reports. Dell is working with these customers to further
integrate this into their ERP or e-procurement systems; for example, Aegon Group and Litton
PRC have cut their time and cost of generating purchase orders with Dell by about 80 per cent.
Dell also uses its intranet to interact with employees.
THE PUBLIC SECTOR
In the public sector e-business activity is driven by the government, which has decreed
that by 2005, 100 per cent of delivery of services will be by electronic means. This
will be achieved in different ways – from adding a web front-end to introducing fully
automated E2E processes involving back-end integration. The solution must improve
the service to the citizen and reduce costs. In 2002 the Chancellor earmarked an
additional £1 billion investment for government information technology in addition
to the £1 billion for NHS IT already announced.
Case study 2.2
Liverpool City Council
Liverpool City Council’s Chief Executive, David Henshaw, explained that there are huge
possibilities for cost reduction through e-government and that incremental improvement is
no longer acceptable, citing Liverpool’s overhauling of its services using technology to bring
cash savings, improve the council’s performance and reduce council tax for citizens.
2
In the
past three years LCC has risen from third bottom in the Best Value performance league table
to eighth, has cut £105 million a year off its cost base and reduced council tax by 3 per
cent. One of the projects that contributed was the integration of nine human resources
departments and eight payroll systems. The departments have been centralized and use an
integrated Oracle HR and payroll system and call centre and a frequently-asked-questions
(FAQ) page on the council’s intranet. It gives one version of the truth instead of nine and is
taking £2.5 million annualized cost out of this service. An e-procurement system has also
cut the number of suppliers from 17,000 to 5,000 leading to annual savings of £5 million.
LCC and BT signed a partnership in 2001, which establishes a joint venture – Liverpool
Direct – to operate the council’s customer call centre, the largest in the country.
17

18
Part One: The Strategic Benefits of Process Management
MEASUREMENT OF VALUE AND RETURN
ON INVESTMENT
Research
AMS conducted research into enterprise integration (EI),
3
which it defines as the
effective integration of business processes, applications and organizations and the
implementation of technical solutions to support integration. The findings indicate
that there are major problems in the way that some of the 155 European companies
surveyed are approaching EI. If they remain unchecked, they will inhibit companies
from realizing top- and bottom-line business benefits or a return on very significant
investment. AMS found that the majority of companies are approaching EI on an
ad hoc basis and they estimate that 30 per cent of integration budgets are being
wasted as a result of inefficient practices. The survey revealed that 34 per cent of
organizations embark on projects without quantifiable objectives and 40 per cent
cannot specify when EI projects will pay back. While fewer than 40 per cent of
companies surveyed have a corporate team in place to coordinate implementation
of an enterprise integration strategy, organizations will only see real benefits if they
develop such a programme, mapping out clear links and dependencies between
projects. AMS would encourage companies to:
■
develop an enterprise-level vision for EI, endorsed at the highest level;
■
define a robust, high-level strategy that will reduce the risk of failure or
derailment while providing flexibility as business needs change;
■
develop a watertight business case for each project;
■
justify costs at the programme and project level and regularly review each
against its business case;
■
prioritize projects according to business needs to secure early returns in line
with the strategy;
■
leverage legacy systems and only fix what is broken;
■
address the skills gap by choosing an integration partner with care;
■
demand a robust methodology – the antidote to complexity;
■
look for programme management and business consulting skills, as well as
technical capabilities and legacy systems expertise.
The value comes from the business initiatives involved in moving to web-enabled,
collaborative E2E processes. IT, although the most expensive component of these
projects, is an enabler, not an end in itself. It should be the business driving the
technology not the technology driving the business. Research has shown that there
is no automatic correlation between the amount of money spent on IT per

E-business strategy
employee and company profitability, although if done well spectacular results can
be achieved. According to Strassmann:
Companies are finally fed up with the escalating costs of IT through
incompetent implementations. IT must be put into the hands of people who
are competent to deliver (outsourcers) and it has to be taken for granted. It
must be available when you need it, how you need it, cheaply, reliably and
securely. Companies need to worry about how to use it, not how to manage
it. From now on just watch the economics and the risk, not the technology.
4
Companies must insist on quick payback times, thorough business plans and
careful, regular pre- and post-implementation analyses of all major technology
projects. According to CFO Europe,
5
companies aiming to bring value to technology
investments need:
■
centralization to provide greater control and a helicopter view of an entire suite
of IT investments;
■
a consistent methodology to increase objectivity and measurability during the
appraisal process;
■
realistic assumptions to offer credible analysis covering a precise timeframe;
■
risk-adjusted calculations to quantify how costs and benefits will affect return
on investment (ROI);
■
accountability to identify who is responsible for which benefit and cost in every
IT investment;
■
benchmarks and metrics to assess a project from the perspective of both the IT
department and the end user;
■
a CFO–CIO partnership to increase the alignment of technology spending with
business strategies.
The balanced scorecard
The value generated from these projects must be explained in terms of the business
benefits, which will eventually result in savings or contributions to the bottom line.
The key is to have the IT agenda articulated in a way that the business can
understand. Benefits management recognizes that there is an adoption curve for new
systems and practices, starting with users learning the new system, a crossover period
and then a period when financial benefits start to accrue. At these transitional stages
uptake, penetration and proper usage can be measured against targets.
Tools like the balanced scorecard (BSC) can be applied equally to measuring
these benefits and this will help show up harder to quantify measures such as, for
19

20
Part One: The Strategic Benefits of Process Management
example, shortening business cycles, reduced rework and innovation rates. The
BSC developed by Kaplan and Norton is used today to translate strategy, by means
of strategy maps, into a cause and effect led implementation plan that can be
measured at each stage in terms of all business perspectives. These should include
‘innovation and learning’, e.g. employee preparedness, ‘internal business’, e.g.
speed of fulfilment process, level of inventory held and the ‘customer perspective’,
e.g. customer satisfaction, as well as the resultant ‘financial’ outcomes. The
philosophy demands that the whole business involve itself in this process, taking
responsibility for defining the benefits and cost justification of the overall project
including the large element of IT involved.
The balanced scorecard approach can be applied in a matter of days, providing
the company is clear on the knowledge level and understanding of the project is
sound. If it takes longer then it is because the company is unable to clearly define
issues regarding project scope, business strategy, market climate or departmental
alignment. Extra time spent in these circumstances is not wasted but invaluable in
saving the company from moving forward with a plan that is not fully thought
through. Responsibility for managing the project to timescales and agreed budgets
is a separate, but equally quantifiable, responsibility.
Fig. 2.2
Integrated performance management
This subject, illustrated in Figure 2.2, is covered in detail in Transforming the
Finance Function
6
along with other integrated performance measurement tools and
techniques: benchmarking, value-based management, shareholder value analysis
techniques like EVA™, risk management and valuation of intangible assets.
Business
intelligence,
planning
and outcomes
KPIs, targets
and rolling forecasts
Financial and non-financial,
BPM, benchmarks, Six Sigma
Added-
value
strategy
Management visibility of:
■
implementation of changes
■
effectiveness and
continuous
improvement
Rapid response to:
■
external changes
■
internal decisions
Planning –
top down
Control –
bottom up
Balanced
scorecard
Detailed
information

E-business strategy
Case study 2.3
Delta Air Lines
Delta Air Lines
7
prioritizes its Internet projects based on NPV and strategic value representing
customer service – both are weighted to arrive at a total value score. This is then plotted
against risk, which equals the size of the initial investment in the project, the resources
required to develop and implement it and an assessment of possible technological hurdles,
such as the rate at which the system becomes obsolete. The introduction of wireless Internet
services that give customers quick access to a wide array of flight information went live in
2000. Delta assesses ROI in terms of both productivity and cost savings. The productivity
metric helps in calculating NPV and strategic value, e.g. it estimates how many more
revenue-producing calls (bookings) will be handled by customer agents as a result of wireless
self-service and how many calls will be saved on check-in and seat allocation details.
Case study 2.4
National City
National City
8
undertook an integration project to develop an EAI architecture to replace
point-to-point connections between legacy applications. The IS payback was lower
development and maintenance costs and faster deployment of new features. The enterprise
payback was faster to market with new products, a reduced risk of failure during system
upgrades and changes, and customers receiving consistent data in all channels.
Case study 2.5
Cabot
Cabot
9
revamped front- and back-office business processes worldwide, supported by
standardized and integrated enterprise software systems. The IS payback was getting better
deals from vendors and savings on development and maintenance. The enterprise payback
was global sharing and reporting of information, better service to global customers and e-
business enablement.
Case study 2.6
Con-Way Transportation Services
Con-Way Transportation Services
10
installed a data warehouse, CRM system, enterprise
portal and web services connectivity to suppliers. The IS payback was that users can
generate their own reports without relying on IS and that applications are easier to maintain
and support. The enterprise payback was a single view of customer activity across the
company’s multiple business units improving service.
21

22
Part One: The Strategic Benefits of Process Management
OUTSOURCING AND APPLICATION SERVICE PROVIDERS
Outsourcing
In the second half of the 1990s, outsourcing deals moved into a second generation.
No longer is the emphasis on highly prescriptive contracts, but instead on risk
sharing, partnerships and joint ventures. CSC is quoted as saying:
In the past, companies would ask how much of a contract would be value-
added services, but never made any buying decisions on that. Now they are
making decisions on the basis of what added value can be provided.
11
These arrangements recognize the shortcomings of earlier outsourcing contracts
and, through various different innovative collaborative partnerships, have tried to
overcome them. In particular, the inevitable conflict of interests and lack of incentive
to save money and add value inherent in the old-style deals have been addressed.
Case study 2.7
Thames Water
Thames Water, in 1997, formed a joint collaboration with Accenture creating Connect 2020
to run Thames Water’s supply chain. Wholly owned by Thames Water, the operation is run
under contract by the consulting firm. The brief runs from negotiating the purchase of £300
million in goods and services a year to managing their fleet of lorries. A seven-year
extendable contract includes Accenture getting a share of any improvements in working
capital savings. Thirty payment and purchasing staff and 130 other employees were
transferred. Savings have been substantial with £22 million shaved from the costs in the
first two years. Quarterly reviews with a balanced scorecard are undertaken.
Application service providers (ASP)
ASP rent out hosted applications over the Web. Hosting, at its simplest, involves
a service provider hosting data on servers in a location outside the end-user
organization’s own facilities. The service provider manages the servers, network
connection and other equipment required in a dedicated and secure Internet data
centre. Hosting is increasingly including a complex array of e-business functions
and value-added services. Gartner Group predict that outsourcing will become the
preferred choice for hosting.
12
ASP enable a business to have access to applications
that would otherwise be too costly to implement and run on an affordable rental
basis. It is attractive to be able to keep up to date with the latest technology
without having to undergo the pain of installing, maintaining and updating the

E-business strategy
system. Many companies now provide Web hosting particularly aimed at the SME
marketplace. The advent of e-business means that smaller organizations can
compete more easily with larger companies and by using a web-hosting company
they save the expense of buying equipment as well as ensuring that the server stays
running all the time (see Figure 2.3).
Fig. 2.3
Value-added outsourcing
Costs
There are four ASP payment methods:
■
per transaction;
■
fixed contract, variable applications – a flat fee per person for multiple
applications;
■
fixed contract, standard applications – e.g. ERP, with cost per user;
■
pay-per-use – based on total time users spend on the system.
Gartner estimate that companies can save 20–40 per cent on application costs
based on estimates of internal systems support charges. The analysts IDC believe
that by 2010 the market will grow to the point where practically all software will
be rented rather than bought.
13
This growth will depend on ASPs providing the
right combination of applications, services and infrastructure, facilitated now
with entry into the market by big players like SAP, Siebel and Oracle. Oracle has
teamed up with BT Ignite to lease its software E-Business Suite Online Any Place
23
Application Service Provision (ASP)
Managed hosting services
IT – management
Hosting
Comms/VoIP
Network

24
Part One: The Strategic Benefits of Process Management
throughout Europe where it will take advantage on BT Ignite’s network of data
centres. Companies wishing to use this service will not have to configure a single
piece of software and could go live within ten days. In the USA this service costs
between £200 and £500 per user per month.
Benefits of outsourcing
14
■
Service level agreements (SLAs) – to maintain control of the company’s
infrastructure.
■
Scaling – a managed service provider will have the expertise, resources and
vendor partnerships to ensure that their customers can anticipate and plan for
the impact of a changing business environment via capacity planning and new
technology testing.
■
Lifecycle support – from the outset to design to upgrade and support
applications and business needs
■
Accelerating time-to-market – speeds up the deployment of new and the
re-tooling and re-scaling of existing applications.
■
Maximizing performance and availability – expertise to deal with transaction
loads and traffic peaks and support that ensures availability 24 hours a day,
seven days a week.
■
Maintaining security – economies of scale allow state-of-the-art safeguards.
■
Providing global reach – national and global connectivity, support and
management.
■
Cost predictability – this focuses on the total cost of ownership (TCO) and
spreads this as an annual fixed cost.
■
Focus on value creation – technical resources are free to concentrate on new
business opportunities, customer relationships and competitive differentiation.
■
Enabling flexibility – the need to constantly change quickly to react to business
needs is facilitated by a service provider.
Case study 2.8
BP Amoco
BP Amoco went to the ASP Asera to implement and manage a new web-based ordering
system for its specialist chemicals customers and benefited from a time-to-market of just
90 days to roll out this new channel.

E-business strategy
Case study 2.9
Nissan North America
Nissan North America has paid eCustomerCentric Solutions to host a sales-led
management system that Nissan uses to distribute leads automatically among 153 car
dealerships. This programme is tied to a CRM application from E.piphany, which is hosted
by ASP users Interrelate. Steven Silver, director of e-business, attests that:
The challenges of integration are present whether you’re integrating your own system
or integrating into systems that other people are hosting. That’s partly why you pay an
ASP – so it’s their headache instead of yours. But the tail shouldn’t wag the dog. First
I’m going to pick my application, then my search for an ASP will be predicated on who
has a proven track record in hosting the application. One good way to find the perfect
host is to talk to the maker of the application.
15
Case study 2.10
Rolls Royce
Rolls Royce, the global aerospace, defence, marine and energy group announced in 2000
that it was extending its relationship with EDS, which originated in 1996, to provide
technology services and solutions, covering e-business and supply chain management – a
deal worth $2.1 billion. The focus of the initial phase will be enabling business integration
and workshare collaboration. This will include e-business solutions, with plans currently for
three portals covering supply chain, design collaboration and corporate information, involving
ASP offerings. EDS is already responsible for Rolls Royce’s IT infrastructure, network, systems
and applications and end-user support.
25


Part two
Technological, Financial, Legal
and Risk Management
Considerations
3
Web-enabling technology
29
4
Mobile and wireless technology
41
5
Electronic invoicing and payments
49
6
Statutory and risk management considerations
57
■
■
■
■
27


3
Web-enabling technology
The Internet and the Web
31
Intranets and extranets
32
Internet standards and protocols
32
Web services
34
Enterprise application integration
36
Data storage
38
■
■
■
■
■
■
29


Web-enabling technology
THE INTERNET AND THE WEB
The Internet is a powerful tool, allowing communication between millions of
computers worldwide. Information is transmitted from client PCs whose users
request services, i.e. effectively it operates as a large client/server system through
local Internet service providers (ISPs). These ISPs are linked to larger ISPs, which
in turn are connected with the backbones, which are national and international
links – the information superhighway. The Internet provides the communications
network and the standard mechanism for exchanging and publishing information
on it is termed the World Wide Web (www or the Web).
The Web is accessed through a web browser which displays web pages of
embedded graphics and standard document formats such as HTML and XML (see
p. 33). All Web interaction is charged at the local rate. Developing Web technology
has facilitated the building of web-based organizations with interconnectivity to
employees, customers, suppliers and partners. Internet technology has enabled the
growth of online business-to-business (B2B), business-to-consumer (B2C) and
business-to-employee (B2E) communication. By being able to communicate in a
common format and integrate back-end systems with new customer-focused
applications, for example, Mondus operates a virtual account, where buyers and
suppliers can view their transaction histories. The architecture allows it to integrate
directly with the buyers’ or suppliers’ back-end systems and covers all stages from
purchase to payment to delivery.
The Web facilitates:
■
the Internet (public), intranet (internal to a company) and extranet (wider
business network);
■
speed and ease of communication, e.g. e-mail, document attachments;
■
access to data on other organizations and learning – web pages;
■
bulletin boards for questions and technical support;
■
the opportunity to promote/sell products via a website – B2C;
■
the ability to rent software applications – ASP;
■
a quick, convenient, reliable method of transmitting data, facilitating business
community integration (BCI), e.g. place/receive orders, software upgrades – B2B;
■
enterprise portals enabling access to information – B2E;
■
links to mobile devices, e.g. WAP – B2M;
■
links to telecommunications, e.g. VoIP, VPN;
■
hyperlinks, which enable links from one place in a document to another, or to
another document or website – surfing;
■
the integration of graphics and animation into pages;
31

32
Part Two: Technological and Legal Considerations
■
interaction through use of HTML forms, e.g. request or search for information
or make comments;
■
a synchronous communications tool allowing text-based chat between different
users logged on at the same time – Internet relay chat.
INTRANETS AND EXTRANETS
An intranet is a secure internal network where access is limited via firewalls to
members or employees of an organization, like a mini Internet. It is a network of
computers set up to be closed to the outside world which:
■
allows access to traditionally ‘difficult-to-access’ information to those within
the company;
■
allows occasional users of packages to access them without the need for
package-specific training;
■
facilitates information and knowledge management;
■
facilitates access and distribution to remote offices worldwide;
■
runs the same application types as the Internet, including e-mail and the Web;
■
can provide animated instructions on how to sell a product or assemble it, price
lists schedules, stock levels, etc.;
■
carries information such as phone directories, organization charts, pictures of staff,
procedures and quality manuals, staff bulletin boards, newsletters, vacancies,
training, etc.
So successful are these systems that companies now have to use strict codes of
conduct and ‘filtering’ systems to ensure that only priority information is received
and read (see e-mail management policy on p. 60 and content management systems
on p. 90).
An extranet is an extension of an intranet and can be described as a secure
network of users that encompasses organizations and people outside the business,
set up to facilitate B2B and B2C activity. Extranets would be used for activities
such as tracking delivery of goods, ordering products from suppliers or customer
assistance from a supplier online. By means of an extranet suppliers can also
receive proposals, submit bids, provide documents and collect payments.
INTERNET STANDARDS AND PROTOCOLS
■
HTTP (hypertext transfer protocol) has become the standard which defines the
way data is transmitted across the Internet between web browsers and servers.

Web-enabling technology
■
HTML (hypertext mark-up language) has become the standard format used to
define the layout and text of web pages for presentational purposes.
■
XML (extensible mark-up language), developed by the World Wide Web
Consortium (W3C), has become the industry standard for transferring structured
data. XML, the specification that labels textual content on the Web, can allow a
business to extract data from back-end systems and put it into a standard format
that other businesses can ingest directly into their own back-end systems. Most
major software companies, including IBM, Microsoft, Sun, SAP and Oracle, are
committed to the support of various XML standards. For example, with an
XML-based accounting system, an XML invoice can be generated and
despatched by e-mail to the customer, who can open it or automatically update
their accounting systems.
■
SOAP (simple object access protocol) is an XML-based protocol that is rapidly
becoming the industry standard for describing the content of an XML message
and how to process it, enabling application-to-application communications
across platforms. It is used in web services – see p. 34.
■
XBML (extensible business mark-up language) and XBRL (extensible business
reporting language) applies XML technology to business reporting, benefiting
the whole business reporting supply chain from those that prepare the data to
those that use it. With XBRL each piece of financial data posted on the Web is
given a digital tag to explain what it is, e.g. revenue figures have one sort of tag,
while profit figures have another, thus enabling search engines to quickly and
easily retrieve relevant data. It is used to publish, distribute, analyse and
exchange financial statements digitally. XBRL relies on existing accounting
standards. Reuters was the first European company to publish its results using
XBRL over the Web in October 2001.
■
eBIS-XML is an initiative from BASDA (the Business and Accounting Software
Developers Association) and operates at the transaction level. Like EDI (see p. 51),
it enables the direct exchange of purchase orders, invoices and other business
documents in computer readable format. The beauty of eBIS-XML is its simplicity.
The information is sent as a standard e-mail attachment and the user’s accounting
system automatically strips out the e-mail and populates the relevant files with the
data it contains. This means that what used to take years on EDI can be done in
days and is accessible to all, including smaller organizations. Participants include
Sage as well as SAP and Oracle.
■
Microsoft’s BizTalk comes in two parts. The first part is the framework, where
developers can upload their schemas, so everyone can see and download them.
The second part is BizTalk Server, which will act as a translation engine
between vendor systems, provided each vendor has developed its own front-end
schema to BizTalk. It will convert messages into XML-based schema as well as
33

34
Part Two: Technological and Legal Considerations
acting as a routing engine and passing the message on. This includes taking EDI
and translating it into XML.
■
TCP/IP, the transmission control protocol, is a transport layer protocol that
moves data between applications. The Internet protocol is a network layer
protocol that moves data between host computers. These are part of a larger
set of standards known as the Open Systems Interconnection (OSI).
WEB SERVICES
Web services is a term applied to both the tools used to build easy-to-integrate
web-based applications and to the underlying technology standards on which they
rely. These services are really an emerging set of protocols and standards that will
allow software programs to describe themselves to each other and integrate with
each other without the handcrafting that has marked most systems integration
efforts to date. Combining lessons learnt over years of project developments by
internal and external IT staff with the openness of the Internet and the result is
the ability to use these already developed ‘solutions’ to put together new
applications in a short space of time. Web services are reusable software
components available over the Internet, e.g. to calculate a price, carry out credit
checking or provide an accounts payable routine. What excites many IT
professionals is how easy it is to build and integrate software using web services,
like snapping together pieces of Lego. Programmers already schooled in object-
oriented design find the transition easy.
While installed applications tend to be robust, inflexible, proprietary and
expensive, web services are much less robust, flexible, open and affordable, with
hosted applications falling somewhere between the two.
1
Web service networks
are designed for corporate users that need high performance secure data and
transactions, recombinant web services sutured together from smaller component
web services, performance monitoring, transaction status reporting and service
management. For example, if a company wanted to let a supplier access inventory
levels in its ERP system, instead of building a new application with a separate
interface and integrating it with the ERP system, the company could wrap the
ERP inventory functionality in XML, expose it quickly as a web service and
deploy it to the supplier over a web service network. Because it is reusable the
same code could be used again for similar services for other suppliers. It permits
the suppliers to securely access the data, authenticates users and improves
performance by carrying out tasks such as XML compression. They are logic

Web-enabling technology
layers that run on the Internet or a customer’s WAN and customers lease the
services. ASPs can host web services over a web service network so they can offer
both web and hosted services.
Web services are likely to result in some companies adopting a ‘virtual IT’
department while others turn in-house IT into a profit centre. Web services are
expected to creep into organizations gradually, incorporated into new applications
or working quietly behind the scenes in software that companies rent from ASPs.
By everyone writing to a web services standard when integrating supply chains,
EDI and other BCI projects this revolution will start to leap forward.
Open standards
■
The Universal Description Discovery and Integration (UDDI) project, supported
by Microsoft, IBM, Ariba and many other IT companies and users including
Ford, Boeing and BT, is a widely supported set of standards. The UDDI business
registry is a series of public databases in which companies record the web services
they offer – this can be interfaced either by people or application programs
looking for such services and integrating them into other applications.
■
SOAP applications built with web services standards will describe themselves
to each other so they can link up automatically (see p. 33).
■
Microsoft’s Hailstorm is a suite of web services that authenticate the identity of
users, establish what rights they have to use particular services and arrange
payment.
■
Microsoft’s .Net 2.0 Web Services platform focuses on integration with Windows
2000. It has open architecture giving customers flexibility and a renewed focus
on application integration and B2B. Applications can display their content
through Microsoft Office and .Net, allowing smaller companies to interact with
large CRM packages like Siebel without a big infrastructure upgrade or software
expense – anything that is XML-based.
Case study 3.1
CGU Life
CGU Life
2
use PlanLab from the ASP Impact Technologies. A software application gathers
financial data about a prospective client, sends that information via the Internet to a
secured website, where a CGU Life analyst can pass it through several applications at once,
creating an estate plan. Working with Microsoft.Net products, Impact developers achieved
a fourfold boost to productivity, without undergoing significant training.
35

36
Part Two: Technological and Legal Considerations
Case study 3.2
Royal Dutch/Shell
Royal Dutch/Shell
2
in conjunction with the UK government and with help from IBM are now
passing volumes of data automatically that was once provided to the government in paper
form, using web services communications protocols.
Case study 3.3
Storebrand
Storebrand,
2
a financial services company in Norway, began building the infrastructure for
its web services using IBM’s WebSphere platform in the late 1990s, spending much of the
time building an application server with the aim of linking web systems to the company’s
database. The work invested over this time has meant that its specifications for web services
were published for their first project in 2001 enabling their customer database to ‘talk’ with
the payroll applications of companies enrolled in its pension plans, using a messaging tool
called Lotus Domino to authenticate identification. With this framework in place creating a
new web service simply entails rewrapping existing programs without reprogramming. As
part of the company’s general ‘good architectural thinking’ the CFO expects web services to
play a large part in helping its application development and management costs to be
reduced by as much as 75 per cent.
ENTERPRISE APPLICATION INTEGRATION
The need to be able to seamlessly integrate many different systems both inside the
organization and outside with partners’, customers’ and suppliers’ systems is
paramount to the success of an e-business strategy. A new generation of
middleware designed for enterprise application integration (EAI) frees developers
from writing routines to handle reliable data transfer and from enforcing
transactional integrity. EAI packaged applications are available to link ERP,
CRM, etc., incorporating logic to link the functionality between the different
systems. This enables those legacy systems, still critical to the success of the
organization, to be linked to the enterprise-wide systems to provide true business
integration. Introduced in the mid 1990s, EAI provides an orderly way for
companies to update, coordinate and consolidate interfaces from a single hub, or
‘bus’ in EAI jargon.
3
Because all the applications feed into the hub, a lot of
integration work is streamlined and automated, dramatically reducing the number
of interfaces. EAI packages have open architecture and graphics and differentiate
themselves by the number, quality, functionality and level of intelligence of their
adapters. Adapters are the software components which provide formatting, data

Web-enabling technology
transmission and validation, e.g. can insert real data in real time into the correct
accounts payable field or invoice line item of a target application.
Research
Over the past four to five years EAI products have moved from just delivering the
services to do the integrating to developing a much more robust product that
automates all the coding. Research by Mercator Software has showed that 26 per
cent of programming time is devoted to the integration of business applications
and unnecessarily antiquated methods like hand coding (known as point-to-point)
are still being widely used. As organizations shift from PCs to handheld mobile
(m-commerce) and wireless devices it will be necessary for 95 per cent of the
business’s data to be accessible over the Web.
VNU polled 240 IT leaders at medium and large organizations in all sectors
across the UK and found a marked lack of preparedness for application
integration.
4
While most IT managers believe integration can cut costs and
improve productivity and flexibility, most struggle to gain business backing – only
15 per cent have a budget for integration, even though experience shows that 30
per cent of IT spend is actually on integration. At Microsoft’s launch of BizTalk
Server 2002, it was argued that companies need to establish centralized, in-house
integration teams. Armed with the right middleware, they can make a huge
impact on corporate performance. An AMS survey in 2002 of 128 companies in
Europe that rely heavily on technology, found that only a third of the respondents
were using high-end EAI tools. Another third were using low-end integration tools
or middleware and the rest still chose point-to-point integration.
One of several reasons for this trend is lack of awareness, with only about 5 per
cent of companies in Germany fully understanding what EAI is and what it is
capable of doing, according to IT experts MetaGroup.
5
Gartner believe that
another reason is that none of the vendors offer a uniform set of features, making
it difficult for companies to assess and compare products. Tibco, SeeBeyond and
IBM are the largest worldwide players, but none have more than 15 per cent of
the market. These are followed by WebMethods, Vitria, Mercator and BEA
systems. Then at the low-end there are tools such as Microsoft’s BizTalk.
Differences in cost vary from
€500,000 for full-blown EAI tools to €50,000 for
the low-end range, which are adequate in smaller, simpler scenarios.
Case study 3.4
Jefferson County
Jefferson County
6
in Denver had an annual IT budget of $4 million, 25 per cent of which
was going towards maintaining 160 applications. New integration software could reduce the
maintenance cost by automating all the point-to-point integration and it would speed up the
37

38
Part Two: Technological and Legal Considerations
development of new online information services. They managed to purchase part only of the
WebLogic Integration. After one year they reduced the cost of integrating their ERP system
with their Oracle database by 65 per cent as well as providing high-quality online information
for residents.
Case study 3.5
Telia
Telia,
7
the Swedish Internet and telecom company, found itself with over 1,000 applications
and customer service was starting to suffer as a result. Since September 2000 they have
been running an ‘Enterprise Nervous System’ with Tibco EAI at the hub, replacing all old
point-to-point interfaces. They claim an ROI of 149 per cent, thanks largely to the reduction
in the number of interfaces that have to be built and maintained, with a payback period of
nine months.
Case study 3.6
Coats
Coats,
8
the thread manufacturers, had a valued customer who wanted to be able to check
inventory and order goods using its own coding system which was different to theirs – and they
wanted this in six weeks. Coats chose a web-based integration product, Verastream Integration
Broker, from WRQ, which provided a non-invasive framework for combining IT systems. The
integration is done at the business process level, leaving the original systems untouched. The
project was finished on time and at a fraction of the cost of traditional methods.
DATA STORAGE
According to IDC, corporate demand for storage services is rising nearly 80 per cent
a year worldwide.
9
With storage costs making up between 30 and 50 per cent of a
company’s IT budget, the good news is that the raw cost of physical storage, i.e. disk
drives, tape systems, etc., is falling by up to 50 per cent a year. The bad news is that
storing and managing data costs almost three times as much as acquiring it. This
means that the traditional solution of buying more direct attached storage (DAS)
has shortcomings when it comes to dealing with e-commerce, which requires faster
and wider access to data. Two new models have emerged to solve the problems of
substituting a one-to-one link between a computer and storage unit with a many-to-
many arrangement:
■
Network attached storage (NAS) consolidates file storage in a single-purpose
‘appliance’, which literally plugs into a company local area network (LAN)

Web-enabling technology
which is intended for file sharing or e-mails. It uses Gigabit Ethernet, a souped-
up version of the local area network (LAN), which transfers data between
storage systems or small computer system interface (iSCSI), which connects
storage devices to computer systems.
■
A storage area network (SAN) brings together bits of data as opposed to files,
allowing multiple servers to share a single pool of storage devices arranged as
a network. It is intended to sit behind applications like sales and finance and
serve up data in response to queries, using a fibre channel as its method of
transferring data between storage units in a SAN at speeds of up to two
gigabytes per second.
The demands of information and e-commerce on the need for storage capacity has
led to a new purchasing arrangement, particularly popular with e-tailers, called
capacity on demand (COD). COD enables companies to buy or lease robust
systems, but pay only for the capacity they use. If an online operator needs
additional storage or processors, the customer is billed. Suppliers include Sun’s
Capacity Assurance Suite and Hewlett-Packard’s iCOD.
39


4
Mobile and wireless technology
Introduction
43
Broadband (high-speed packet-based wireless)
44
Voice over packet networks
44
General packet radio service
45
Wireless application protocol
46
Messaging
46
■
■
■
■
■
■
41


Mobile and wireless technology
INTRODUCTION
Wireless means transmitting signals over invisible radio waves instead of wires. It
is used from something as simple as making a phone call to the complexity
involved in enabling the sales force to access information from an ERP application.
It means new, more convenient ways of staying in touch with suppliers, customers
and employees. Although mobile data is already bringing significant benefits to the
supply chain, many businesses still fail to understand the technology’s potential
impact on profitability. A suite of mobile and wireless technologies exists today
that are stable, available and relevant for use in the supply chain. According to
Deloitte Consulting, organizations deploying the technology have enjoyed payback
periods of under one year and ROI of hundreds of per cent – and this is without
3G (third-generation wireless technology that is packet based and always switched
on).
1
The key to mobile’s impact on the supply chain results from a faster flow of
relevant information. The quicker that staff have access to critical data, wherever
they may be, the faster decisions can be taken. A mobile powered supply chain can
positively impact several key areas including:
■
Cost control – faster and more accurate information and communications
result in smaller, more precise inventories and cashflows.
■
Information accuracy – removal of pen and paper at capture and validation
improves accuracy.
■
Improved customer relationships – improved and faster information is
available on delivery dates and time, e.g. monitoring a delivery vehicle’s
location through GPS, with coordinates being relayed by SMS.
■
Time to market – improved communication results in faster time to market,
reducing stocks and enabling problems to be resolved more quickly. For
example, mobile technology can speed the process where an engineer is informed
by SMS, a diagnosis is made via wireless LAN or Bluetooth access to technical
databases and new parts are specified and ordered via a GSM-enabled PDA.
In a recent book by Mackintosh and Keen
2
three areas where wireless technology
can benefit companies are identified:
■
Knowledge mobilization – encompassing decision-support applications, with
wireless applications bringing information directly to staff wherever they are.
For example, Coda’s global accounting system allows finance executives to
access and update data via WAP.
■
Logistics and supply chain management – for example, Ford Motor Company
uses wireless tags, antennas and location-based software at its manufacturing
facilities around the world. When assembly-line operators need more parts,
they simply press a button on the tag which alerts the replenishment system,
43

44
Part Two: Technological and Legal Considerations
creating an order which results in delivery of the part to the operator. Delivery
firms can give real-time information about the whereabouts of goods.
■
Customer relationship management – with field staff often the first to benefit
from wireless tools. For example, the Swedish National Board of Health and
Welfare is using a combination of so-called ‘global positioning system’
technology and palm PDAs so that the agency’s paramedics can have direct
access to a person’s medical history at the scene of an accident. Similarly, they
can input data about the patient at the roadside.
BROADBAND (HIGH-SPEED PACKET-BASED WIRELESS)
Bandwidth, which indicates the speed at which data is transferred using a
particular network media (measured in bits per second – bps), is the most pressing
problem for full mobile Internet access.
3
Providers are investing in new fibre optics,
wireless equipment, hardware and software to increase their capacity to deliver
broadband. Broadband-fixed wireless solutions will play a key role in situations
such as dedicated point-to-point links where users need guaranteed bandwidth and
fixed quality of service.
All major Swedish airport lounges, conference centres, hotels and other public
places are equipped with local WLANs (wireless local area networks) or WiFi
(802.11b standard) networks creating ‘hotspots’ that enable users to connect to the
Internet with a simple PC-card in their laptop.
4
They offer unlimited access with
data rates up to 200 times faster than initially offered by 3G networks – all at a
competitive flat rate. WiFi technology is also expected to be popular with private
residents and SMEs. WLANs are used primarily for data and make transfers at
speeds up to 11 Mbps.
Uni-X Software OpenInformer is one product capable of following every byte
that flows across a company’s wide area network (WAN) and assigns it to a
particular application, user and business unit.
5
This provides incentive for
managers to manage bandwidth used by individual staff and control it. Lufthansa
is one company that uses this software to charge out all its bandwidth to its users.
Another product is called NetCountant accountability from Apogee Networks.
VOICE OVER PACKET NETWORKS
In order to send voice, the information has to be separated into packets just like
data. Packets are chunks of information broken up into the most efficient size for
routing. They are broken up, sent and then put back together. Two such protocols
are described below.

Mobile and wireless technology
Voice over Internet protocol (VoIP)
New features allowed by broadband include real-time video and audio, VoIP,
video-conferencing and rapid data downloads with no waiting which are resulting
in companies replacing their PBX with a VoIP. Such converged voice over data
networks have benefits, which include being able to save costs by utilizing:
■
corporate WAN data links for voice traffic as well as data, considerably
reducing costs to local call rates;
■
the use of ‘call me back’ buttons on websites;
■
blending with websites and supported by call centre based services – such
services are also available through ASPs;
■
video-conferencing, which, utilizing products like PictureTel, is now a viable
alternative and used by organizations like Royal Bank of Scotland (RBS), with
13 video-conferencing studios supplemented by a further 6 facilities in directors’
offices and another 30 desktop devices. RBS calculate that they save £60,000 a
month in travel costs, primarily on trips between Edinburgh and London.
Asynchronous transfer mode (ATM)
ATM is another voice over packet network protocol, which chops all its packets
into the same size and can perform similar functions to VoIP. It is used in ISDN.
GENERAL PACKET RADIO SERVICE (GPRS)
GPRS is the new standard for mobile communications and, like 3G, it is a packet-
based system for wireless data transfer. GPRS is a bridging technology between
today’s voice-centric GSM networks, which are circuit-switched systems, and the
long-awaited 3G networks (likely availability 2003). It is a bolt-on to the GSM
but has the advantage of allowing users to share timeslots by slicing data into
packets. Users are only charged for the packets used, not for the entire time of
connection. Speeds are somewhere between GSM and 3G.
High speed circuit switched data (HSCSD)
This is a circuit switched technology that combines multiple GSM (global system
for mobile communications) timeslots into a single, high-speed data channel. It
can be preferable to GPRS where dedicated, high speed is required.
45

46
Part Two: Technological and Legal Considerations
Bluetooth
This is best thought of as a near ideal way of transferring data over a short distance
and a gateway technology to GPRS and the coming UMTS (universal mobile
telephone system) networks for longer distances. Bluetooth can exchange data with
another Bluetooth-enabled device. Two characteristics are that it has a small
footprint on the chipset, which makes it suitable for mobile phones, and it has low
power output. Taken together these features mean that it is easy to embed in all kinds
of products from printers to headsets.
WIRELESS APPLICATION PROTOCOL
WAP is a set of protocols used for data delivery to wireless devices. WAP-enabled
devices give users a limited version of the Web designed to work on the small
screens of phones and PDAs (personal digital assistants). It is undoubtedly
beneficial to give staff a single portable device that can roam seamlessly across
mobile networks, fixed wireless networks and fixed wire networks. From a
corporate perspective wireless means better and more efficient use of mobile data.
MESSAGING
■
Short message service (SMS) is a text message sent or received to or from a mobile
phone or the Internet, containing up to 160 characters. It was originally designed
as a business-to-business medium, but it has been taken over by teenagers and is
big business in Europe and Asia. The GSM Association released figures of 19
billion SMS sent during May 2002. It is predicted that SMS’s share of mobile data
transmissions will grow from 53 per cent in 2000 to 63 per cent in 2004.
■
Extended message service (XMS) is the next generation. It is the acronym being
used for both multimedia messaging services (MMS) and enhanced messaging
servicess (EMS). Both will allow users to send ring tones, sounds, pictures, tunes,
animations and text as a single message, with MMS having richer interaction
and the ability to send a snapshot via mobile to server or mobile. XMS can be
used for advertising campaigns and interaction between consumers.
■
Instant messaging (IM) is a service that uses Internet technology to allow people
to send text messages that are delivered in real time. Popular with both personal
and business users, it gives users the ability to block messages from certain
people and to have a conversation with more than one person at a time;
attachments can also be sent. Providers include MSN, AOL and Yahoo!, but
there is presently no interoperability between providers. Business users of IM use

Mobile and wireless technology
it, for example, to ask questions of colleagues who are in a different location.
Business services have privacy and security standards built in.
■
Unified messaging (UM) is one-stop shopping for all voice mail, e-mail and fax
communications. A UM service lets you retrieve all messages with one phone
call or web visit. E-mails and fax headers are translated into voice messages and
they can be prioritized.
■
Peer-to-peer (P2P) computing allows users to communicate directly, computer
to computer, sharing files and data without using the server. It is necessary for
the users to specify which information on their hard drive is to be public. This
is new technology and has the drawbacks in a business environment of taking
away control of information flows from central IT and raises questions about
bandwidth and security.
Case study 4.1
Masterbit
Masterbit’s team of 70 consultants use unified messaging, where employees have a single
in-box for e-mails, voice mails, SMS messages and faxes through a single browser interface,
utilizing personalized web portals.
Case study 4.2
Bayer
Bayer has 1,300 mobile handsets operating on VPN and running on a Vodafone volume
tariff.
Case study 4.3
Reitan Narvesen
Reitan Narvesen,
6
a Norwegian retail group with annual turnover of
€2.7 billion, has its
17,000 staff able to access a Lotus Notes-based intranet via their mobile phones or PDAs.
With 430 outlets in far-flung parts of Scandinavia managers used to struggle to make onsite
visits – now they can be in immediate contact even when snowbound.
Case study 4.4
Volkswagen
Volkswagen uses radio frequency (RF) data tags to locate nearly finished vehicles more
quickly than staff searching on foot. The payback was within one year.
47


5
Electronic invoicing and
payments
Introduction
51
Electronic data interchange
51
Electronic invoice presentment and payment
51
E-treasury
53
Electronic bill presentment and payment
54
■
■
■
■
■
49


Electronic invoicing and payments
INTRODUCTION
Electronic transactions and payments began before the Internet with electronic
data interchange (EDI), which has been in use by large organizations since the
1980s to send bills and payments direct to suppliers in digital format. Interactive
web browser based solutions that require only a web browser and Internet
connection at the customer end are less expensive. The EU directive, which comes
into force on 1 January 2004, permits companies in member states to use digital
invoices rather than paper-based ones for tax and regulatory purposes, but still
allows member states leeway to impose restrictions on use of the Internet to
present and pay invoices. This will enable European companies to finally begin
using Internet software developed for the purpose.
ELECTRONIC DATA INTERCHANGE
Transactional electronic interchange predates e-commerce in the form of EDI,
which is the digital exchange of structured business information, particularly for
purchase orders and invoices, between buyers and sellers. Financial EDI is the
payment mechanism for transferring funds from the bank of the buyer to the seller
electronically. Electronic funds transfer (EFT) is the automated digital transmission
of money between organizations and banks, used by companies like Dell. Prior to
the introduction of the Internet, EDI required the use of expensive proprietary
value added networks (VAN). Internet EDI using XML (see eBIS-XML on p. 33)
compatible standards and lower cost transmission through virtual private
networks (VPN) or the public Internet is predicted by IDC to take 40 per cent of
the EDI market estimated at $2 billion in 2003.
1
With cost savings of about 90 per
cent, EDI is now accessible to smaller organizations.
Case study 5.1
Flymo
Flymo,
2
the largest UK lawnmower manufacturer, used EDI for linking to its largest retailers
but until Internet EDI they could not link to the smaller retailers because of the prohibitive
expense. Their EDI supplier, IBM, created its ‘Internet for dealers network’, which gives
retailers two facilities: CD-ROM for offline ordering and a transmit screen via EDI or access
via the extranet to place or check progress of orders and invoices online.
ELECTRONIC INVOICE PRESENTMENT AND PAYMENT
EIPP software automates all the steps involved in making inter-company payments
via the Web.
3
51

52
Part Two: Technological and Legal Considerations
Benefits for sellers:
■
reduced day sales outstanding
■
enhanced cashflow visibility
■
faster dispute resolution
■
improved information
■
50 per cent reduction in processing costs per invoice.
Benefits for buyers:
■
more efficient invoice delivery
■
improved relationship management
■
better payment terms (possibly)
■
improved information
■
60 per cent reduction in payment costs per invoice.
There are three EIPP models:
■
Seller direct – the seller implements an EIPP application for all buyers to review,
dispute and authorize invoice payments on its website. The seller controls the
process and systems integration and relies on its existing banking relationship.
■
Buyer direct – the buyer directs all of its sellers to submit invoices through its
EIPP application. This model is suited to large buyers receiving high volumes of
invoices. For example, Brittany Ferries uses this model with AxsPoint software.
■
Consolidator – buyers and sellers allow a middleman (usually a bank) to act as
an online hub, providing an interface between many buyers and sellers. A
consolidator collects and aggregates invoices and can provide other financial
services like factoring or payment processing. The middleman is also responsible
for setting up all the functions of bill data translation, data formatting and
storage, website presentation, buyer enrolment and security, buyer training and
support, payment initiation and remittance processing. For example, DHL uses
this model with Citibank.
For each model there are two types of provider:
■
Application vendors like BCE Emergis or iPlanet enable companies to run EIPP
from their own websites or banks to publish clients’ bills on their behalf.
■
Transaction vendors such as Billingzone and EDS act as an ASP, selling EIPP
services via hosted websites.

Electronic invoicing and payments
E-TREASURY
E-banking
Case study 5.2
Philips
Philips
4
had 600 banking partners in 1997 and an unknown number of bank accounts. Now
treasury activities are centralized into one main office in Holland and three satellite centres
– Asia, Latin America and the US. It has just one cash management bank per country, and
through the use of an overlay bank, pools almost all its cash into various currency centres
every day, such as a global euro pool in London. Hommen, the CFO, explained:
We wanted to increase the turnover of cash in our company by reducing the amount of
cash in transit. We now work with a lot less cash than we did before.
One way it has been able to do this is by setting up a payment factory, a single hub which
could handle each of the 2.5 million payments that the company makes worldwide each
year. Business units (BU) still decide who, what and when to pay, but they let the hub make
the payment. In 1999, Philips picked software from Alterna Technologies to run the hub and
Citibank and Bank of America to act as disbursement banks.
The BU approves the payment order, its accounting software sends instruction to the
payments factory, it is processed and, in the case of a third-party payment, routed through
to one of the banking partners; funds are then transferred into the account of the supplier,
who is automatically notified. The accounts payable ledger of the relevant Philips business is
reconciled. In the case of an inter-company payment, no external transaction or fund transfer
occurs; instead the payments are settled using a new in-house bank which Philips developed
as part of its payment factory. Each BU has a ‘virtual’ account held at the group’s treasury
centre, which they can view with a web browser. With all the group’s global cash resources
pooled together, the in-house bank shows how much of that cash belongs to each division.
By handling all the group’s payments centrally, international payments have been turned
into cheaper domestic ones, saving Philips around
€1 million every year. Hundreds of staff
worldwide no longer have to concern themselves with making payments – that is now done
by the payment factory, which is manned by just five people. Savings of about
€5 million
have materialized from the elimination of maintaining more than 400 interfaces between
Philips IT systems and its banks.
Foreign exchange trading
Straight through processing (STP) is the complete streamlining and automation of
an entire foreign-exchange trade cycle, i.e. the removal of all manual intervention.
5
E-forex portals have focused on streamlining the middle and back offices.
53

54
Part Two: Technological and Legal Considerations
Case study 5.3
Atriax
Atriax, part of GE, is fully integrating its dealing engine with Fxpress, its risk management
system.
Case study 5.4
Sara Lee DE
Sara Lee DE, the
€6 billion subsidiary of the consumer goods firm, are running a project
with Currenex to improve the way internal forex trade requests are collected and managed.
It plans to automate the front, middle and back offices by building an interface with the
treasury management system, which will automate the settlement of trades.
ELECTRONIC BILL PRESENTMENT AND PAYMENT
B2C EBPP is a different proposition to that of large company B2B EIPP systems,
with estimates of 190 billion online transactions worldwide in 2000. A recent report
by Logica and Capital Economics argues that it is just a matter of time before
payments systems are transformed with instantaneous money transmission and
settlements and continuous interest accrual in real time.
6
By 2010 it is predicted that
with quick, cheap and secure electronic payments, physical cash will disappear.
EBPP offers a number of different payment mechanisms including:
Debit and credit cards
This is the most popular method of payment, with two main methods for e-tailers
to facilitate this form of payment, though they are not really suitable for micro
payments (see below):
■
Electronic Funds Transfer (EFT). This involves the Internet merchants, i.e.
people and organizations that accept cards as payment for an Internet
transaction, integrating an EFT solution into their websites. This simplifies the
buying process for their customers and provides added reassurance that the
payment has been cleared by a financial institution that processes all card
transactions on behalf of the merchant, i.e. an acquiring bank. The bank submits
the transaction details to the card issuers, recovers the payment from them and
reimburses the merchant, less a commission charge.
■
Payment Service Provider (PSP).
7
This offers an EFT facility to its customers
through a bureau service. This is the preferred choice for start-up companies or
companies processing a low volume of credit card transactions.

Electronic invoicing and payments
Concerns over fraud, for which the merchant takes the responsibility in cardholder-
not-present (CNP) transactions, are being overcome by a number of additional
security measures that include:
■
Smart cards reduce fraud because, unlike their magnetic strip predecessor, the
chip can decide to force an online conversation with the acquiring bank the
next time it is used. Ignoring merchant floor limits the card can check to ensure
it has not been stolen. This encrypted conversation ensures that the card and
card reader are the people they claim to be.
■
PIN numbers will further reduce fraud.
■
A card security code (CV2) is included as the last three or four digits of the
signature stripe and represents a unique card verification method.
■
An Address Verification Service (AVS) has been used in the US since 1991; it is
based on the cardholder’s postcode.
■
3D SET (three domain secure electronic transaction) is a software-based server-
side authentication solution used by Visa and Mastercard. The cardholder’s
details are held in a wallet on the card-issuing institution’s server, which
authenticates the cardholder to the merchant and vice versa.
Micro payments
8
‘Micro payments’ are very small amounts of money, that are not worth the cost of
paying charges relating to credit and debit cards. Early attempts to solve this
problem, including digital currencies like Digicash, have now closed. New methods
are now being launched to handle micro payments including the following:
■
Pre-pay cards are similar to pre-pay phone cards. One example is Splash Plastic,
where users charge their cards using cash in a shop or via standing order or
cheque payment, which is then credited to the card. Merchants receive credit for
transactions made 21 days later and pay a fee for the service. MicroMoney from
Deutsche Telecom is a similar product. However, these are still expensive to run.
■
PayDirect is a joint venture between the Internet portal Yahoo! and HSBC. It
allows users to register their credit card or bank account details with HSBC in
a PayDirect account. Money can then be transferred to buy goods from
participating merchants.
■
Bertelsmann has developed a virtual server-based solution, which could be
loaded with value from an online account held by the customer.
■
Add to Telephone Bill is due to be launched in 2002 in Europe. This method
adds micro payments to the consumer’s telephone bill, either fixed line or
mobile, using authentication through a personal identification linked to the
55

56
Part Two: Technological and Legal Considerations
user’s account. Merchants would receive a corresponding monthly credit to
their phone bill or bank.
BiBit
BiBit is an Internet service provider based in the Netherlands, many of whose clients
sell via a number of channels, including the Internet. BiBit handles the payment side
of transactions on behalf of clients. Once the customer has agreed to make a
purchase on a website, they click through to a payment screen which is run by BiBit
but which can be branded to appear as the merchant’s own, on which the customer
has a choice of up to 50 ways to pay. All links to financial institutions are handled
by BiBit. They support any payment method with a substantial user base.
EasyBis.com
9
EasyBis (Albany software) delivers a service that gives low-cost access to customers
and can be used by utility companies collecting payments for variable monthly
bills. By using EBPP customers can log on to secure sites to pay invoices utilizing a
variety of payment methods including variable direct debit, credit/debit card or
cheque, where they advise the cheque number and estimated date of receipt.
Amazon.com
10
Amazon, which has continuously evolved its online service, is to let customers use an
online credit payment system as an alternative to orthodox credit and debit cards.
The system will work much like a department store card, with customers being sent
a monthly bill. Current methods mean that Amazon pays a fee to payment processing
companies such as Arcot, which act as a hub between merchant, consumer and bank
to ensure that financial transactions are carried out securely. This new scheme will
save money on transaction charges and lower administration costs.

6
Statutory and risk
management considerations
Introduction
59
Dynamic security policy
59
Physical and technical security tools
62
Industry standards
63
Statutory considerations
64
■
■
■
■
■
57


Statutory and risk management considerations
INTRODUCTION
The Turnbull Report (which came into effect early 2000) makes directors responsible
for evaluating risks to IT infrastructure while the Data Protection Act 1998 makes
them responsible for guarding against unauthorized access to client and employee
information. The Obscene Publications Act 1959 makes them liable if their servers
are used to harbour offensive material. Litigation from shareholders, suppliers and
consumers could follow a breakdown in performance due to systems being corrupted
and from third parties when servers are hijacked without their knowledge and used
as staging posts for denial-of-service (DOS) attacks on other sites.
1
So it is not
surprising that companies are becoming attuned to the idea that infrastructure
security is an essential cost of doing business. This combined with the general move
to web-enabled business communities necessitates more stringent Internet and
network infrastructure security, with companies allocating 10–15 per cent of IT
budgets to information security, depending on their corporate risk profile.
There is a need for a sound, dynamic security policy which is embedded in the
corporate culture, combined with an ongoing risk assessment and mitigation
process, including business continuity in addition to the more obvious physical
and technical tools such as firewalls. There is a growing trend to outsource many
aspects of corporate security management to specialists. The challenge is to
achieve maximum functionality within an entirely secure environment by
including security in the design. For example, DuPont, working with their
outsourcer CSC, has achieved this end and finds that customers and staff can
move seamlessly around their system without realizing they are traversing layer
upon layer of security.
An Information Security Breaches Survey carried out in 2000 by the DTI
indicated that 43 per cent of organizations with critical or sensitive information
suffered serious breaches of information security.
2
They estimate that the cost to
business in the UK, if this same rate continues, could be in the region of £12
billion per annum by 2002.
DYNAMIC SECURITY POLICY
Ongoing risk assessment
Ongoing risk management requires a comprehensive approach to network security.
It is necessary to analyse entire infrastructures – firewalls, routers, applications,
operating systems, WLANs, web applications and databases – for weak spots and
to mitigate all threats. It is often found that a successful attack takes advantage of
a service or function inside the server that is never or only rarely used.
59

60
Part Two: Technological and Legal Considerations
Case study 6.1
PacifiCare Health Systems
PacifiCare Health Systems
3
takes every component of the enterprise into account from a risk
perspective and then defines and prioritizes risk mitigation for each component. The
company has a computer incident response team, an internal group whose charter is to
determine how serious a network breach is and how to respond.
Disaster recovery
Disaster recovery must be included in any security strategy, with anti-terrorism
featuring higher in most organizations concerns than ever before. This must
incorporate the impact on the whole business, not just IT, and is termed business
continuity. Money invested here can be saved on insurance premiums.
Case study 6.2
Synstar and SchlumbergerSema
Synstar and SchlumbergerSema
4
in the UK operate off-site recovery centres for businesses.
At SchlumbergerSema’s business recovery centre in Docklands district, the services fall into
three categories – hot, warm and cold. Hot provides a live, parallel-running capability; warm
offers regular back-up and a ready-to-run capability; and cold takes care of long-term
support based on the offline availability of backed-up data. In addition to a number of rented
office units, services offered include advisory, security, network and data management.
Case study 6.3
Sainsbury
Sainsbury’s, which has had a business continuity manager since 1996, now has a
comprehensive strategy covering all its 480 stores and which it has now extended out to its
supply chain.
A dynamic IT corporate policy
This document will help staff in security procedures and product use as part of the
integrated enterprise risk management strategy. Such a policy needs to cover not
only pornography, defamation, harassment, unauthorized access, breach of
copyright, confidential information, impact on productivity, the right to intercept

Statutory and risk management considerations
communications and personal e-mail, but also what devices employees can
connect to the network and how much downloaded company data constitutes
theft. It is necessary for the user community to understand what the company is
trying to achieve with its security policy because individual users are capable of
compromising or bypassing most security measures. Equally important are well-
trained and motivated security staff.
E-mail management policy
This is a policy that defines for the employee what is appropriate and what is
inappropriate and outlines some etiquette for e-mail use. Such a policy will
establish a culture of economical use of e-mail and reduce the risk of legal liability.
It will help to define the line between employee privacy and the enterprise’s
responsibility to its investors to keep systems running efficiently and to prevent
embarrassment or consequences to the enterprise that can stem from inappropriate
actions on the part of the employees. With virus attacks rising exponentially e-mail
users have lost their naivety about security. According to Gartner, the amount of
spam in the networks today is about 16 times what it was two years ago.
5
It
estimates 30–50 per cent of messages coming toward enterprises are spam or
involve malicious content. Serious spam control is needed to optimize the use of
bandwidth, disk space and people time. Concerns about terrorism and industrial
espionage are also very real.
E-commerce insurance
Insurance is a good idea to complement any security policy and it comes in many
options that need to be investigated to ascertain the correct coverage including the
following:
■
Third-party coverage:
– errors and omissions or professional liability;
– Internet liability (additional coverage for losses and lawsuits);
– contractual obligation coverage for those companies delivering over the Web;
– directors and officers.
■
First-party coverage:
– ransom for data extortion;
– public relations;
– business interruption for a digital disaster.
61

62
Part Two: Technological and Legal Considerations
PHYSICAL AND TECHNICAL SECURITY TOOLS
Intranets and extranets
Intranets and extranets make use of a channel that is not available to the public,
like a VAN (value-added network) or VPN (virtual private network). VPNs offer a
viable alternative to expensive leased-line private networks. It sets up an encrypted
secure link over the highly unsecure, public highway of the Internet. It needs to be
noted that VPNs still pass across web servers that are not under the control of the
sender and that it is the encryption or protocol that will secure the data.
Firewalls
These are dedicated hardware and software systems designed to block access to
the internal IT environment by screening information flow between networks.
Intelligent products, like Sanctum, guard against attempts to make unauthorized
changes to web pages. Many firms are hiring outside security firms to test their
firewall security. Called ethical hacking, the process helps pinpoint weaknesses in
networks and gauge response time to an attack.
Public key infrastructure (PKI)
This provides strong authentication and non-repudiation of transactions, including
encryption keys, digital signatures and certification authorities. The Web relies
largely on Secure Socket Layer (SSL) encryption technology to protect innumerable
transactions for e-business and it is necessary for developers to fully understand the
requirements. Oracle’s Virtual Private Database, for example, pushes user
authentication all the way down to individual rows in a database table. Unbreakable
security is about reducing downtime.
Anti-virus product
Anti-virus protection is part of content management and requires frequent and
largely automatic updates.
Case study 6.4
Deutsche Bank
Deutsche Bank, which has 90,000 employees with desktops worldwide, chose Norton
AntiVirus from Symantec.

Statutory and risk management considerations
Intrusion detection devices
Intrusion detection devices are designed to combat hackers. They sit behind the
firewall and look for malevolent activity inside the corporate network. Yahoo!,
Amazon and Microsoft are all examples of companies which have suffered
publicly at the hands of hackers who caused their servers to crash. Other victims
include Powergen, Woolworths and Barclays, where customer credit card details
have been revealed, and even NASA have admitted that the safety of shuttle
astronauts had been compromised by hackers.
INDUSTRY STANDARDS
Internet security
Keith Foggon, in his book Internet Security, says:
Computer audit no longer concerns only checking of password controls,
violation logs and anti-virus measures; auditors now need an understanding
of all network and system vulnerabilities, their weaknesses and how these
will be exploited.
6
BS 7799 or IS 17799
This is a set of security standards formed by a group of European multinationals,
including Shell. Its aim is to improve e-commerce security through common
practices to deal with hacking, accident, sabotage, unauthorized disclosure and IT
systems failure. Part one of the standard provides a code of practice that helps
organizations to tackle IT risk management at an appropriate level and requires
the formation of a security forum that involves senior management.
Microsoft.Net My Services
The initial focus of this product was as a user-centric, single sign-on mechanism,
linking Passport to Windows Active Directory consisting of services like My Wallet,
My Location, My Profile, with the Passport user ID as the unique identifier.
Microsoft intend to open it up so that it can be allocated to groups and even small
businesses, evolving into an authentication system with its own set of management
tools. Microsoft’s Passport V3, which will support the Kerberos encryption
63

64
Part Two: Technological and Legal Considerations
standard, enables any service provider to create their own single sign-on mechanism
and, as a top-level security provider, interact with Passport to allow users to use any
validated credentials to access websites. By using a third-party mechanism, such as
SAS 70, and having a clear standards and certification process, businesses can
handle both consumer and business partner access to their systems.
STATUTORY CONSIDERATIONS
The Regulation of Investigatory Powers (RIP) Act 2000: e-mail
and telephone monitoring
This Act gives new powers to protect the public in areas such as surveillance of
websites. It provides a clear framework for the lawful interception of postal systems,
telecommunications and digital communications. Company practices, policies and
online codes should be revised to reflect the Act. The RIP Act does not give a blanket
licence to employers or their staff to monitor and record communications covertly
or otherwise. It intersects with the Data Protection Act 1998 and the Human Rights
Act 1998 against which any action under the RIP Act must be balanced.
The Data Protection Act 1998
This will have a significant effect on the use of certain Internet information
systems, including the provision of material via the Web.
■
Informed consent needs to be gained before personal data related to readily
identifiable individuals is used on the Web.
■
When organizations use Web pages to collect personal data, such as names and
addresses of individuals who request documentation, the following information
should be provided at the point of collection:
– the purpose for which the data is collected;
– the recipients to whom data may be disclosed;
– the period for which the data will be kept.
Online Personal Privacy Act
In the US this Act requires companies to treat sensitive and non-sensitive personally
identifiable information separately. For organizations wishing to establish a
privacy policy, the Disney website is often quoted as having an exemplary privacy

Statutory and risk management considerations
notice. Guidelines are available from the Online Privacy Alliance (OPA) at
www.privacyalliance.org and the Direct Marketing Association’s website
www.the-dma.org.
Defamation Act 1996
This Act provides that once ISPs are apprised of third-party defamatory content
on their servers, they must take all reasonable steps to remove or deny access to
it. Cybersmearing is used to blacken the good name of a company or its product.
Although most lack the drama and magnitude of a DOS attack the repercussions
of some of these assaults can be devastating, e.g. spreading rumours through
Internet news groups and discussion forums that a fast food chain is serving
tainted food, which in turn could lead to a fall-off in sales. Often the disaffected
set up an attack website devoted to bashing the company, e.g. McDonald’s.
Courts are generally finding in favour of the smeared in these cases using the
principle that ‘there are no rights to free speech to defame’.
Copyright law and intellectual property rights (IPR)
This legislation addresses infringement, largely as a result of sustained pressure
from major copyright holders who are concerned to ensure that their interests are
not undermined by digital copying. This law has two main threads:
■
ISPs will be granted a limited immunity from liability for copyright infringement,
providing they are unaware that it is on their server, do not receive financial
benefit and respond quickly to remove the material.
■
Copyright holders will be granted greater powers over digital copying of their
works.
Several recent legal cases have meant that companies can also be liable for
material held on websites to which they have a link. Linking should be undertaken
with caution.
Obscene Publications Act 1959
This Act, as amended by the Criminal Justice and Public Order Act 1994, states
that if an article is obscene, it is an offence to publish it. The Obscene Publications
Act 1964 makes it an offence to have an obscene article in ownership, possession
or control, which includes obscene material placed on a web server for transfer or
downloading electronically.
65

66
Part Two: Technological and Legal Considerations
Computer Misuse Act 1990
This makes unauthorized hacking an offence even if there is no intention to cause
harm. This only covers unauthorized access to a computer or data held on it and not
mere access by authorized users of computer and data for unauthorized purposes.
The Act also catches, under its conspiracy to commit an offence provisions, the
publishing of material that might be used to breach computer security or facilitate
unauthorized entry into computer systems, e.g. a virus.
A ‘Denial of service’ (DOS) attack is an attempt by attackers to prevent legitimate
users of a service from using that service. Examples include:
■
attempts to flood a network, preventing legitimate traffic – high-profile cases
include Amazon, Ebay and Barclays;
■
attempts to disrupt connections between two machines, preventing access;
■
attempts to prevent an individual from accessing;
■
attempts to disrupt service to a person or system.
A distributed DOS attack is where a hacker may obtain access to large numbers
of computers, often using ‘Trojan Horse’ software, and install software servers
designed to engage in a particular form of DOS attack. The hacker can then
message all the servers and instruct them to send traffic to a target computer.
Trojan Horse software is a piece of code that hides inside another program and
performs a concealed function. Uses include hiding or installing viruses or DOS
software, e.g. Netbus and Back Orifice. The use of Trojan Horse software clearly
falls under the Act, but an attack itself may not.
The provision of adequate security measures by organizations to prevent such
attacks may lead to liability under the Data Protection Act 1998 if personal data
is erased, altered or stolen by a hacker. Equally, companies might find themselves
being sued if their systems are poorly configured or protected and are taken over
by a hacker in a distributed DOS attack against a third party.
Rome II
7
Rome II is a green paper scheduled for adoption by the European Commission in
2001. It covers non-contractual liability, such as product liability, defamation and
unfair competitive practices, and is aimed at smoothing commerce across the many
borders of the EC. Under this paper, the applicable law to non-contractual liability
will be the law of the place where the act has its effect, e.g. if a US-based website can
be accessed in Germany, then the e-tailer would be subject to the non-contractual
liability laws of Germany. This follows common standards set by the EC in 2000 on
jurisdiction and enforcement of judgments in civil and commercial matters. The

Statutory and risk management considerations
regulation states that consumers can sue an e-tailer in their home countries, not
where the e-tailer is based.
Convention on Cybercrime 2001
8
This commits participating countries to define certain activities as cybercrimes and
ensure that they have authority to take investigative and enforcement measures
within their borders, putting themselves at the service of other signatories. This can
lead to problems where laws apply in one country and not in another. For example,
a French court ordered Yahoo! to find a way of preventing web surfers in France
from viewing Nazi memorabilia, which is illegal in France. Yahoo! dealt with it by
banning Nazi memorabilia entirely.
Taxation on electronic commerce
The EU has agreed that from July 2003 non-EU suppliers of digital goods, e.g.
music, computer services and software, which are provided or can be downloaded
over the Internet must charge VAT to their European consumers.
9
The rules apply
to private consumers for an initial three-year period. The aim is to provide a level
playing field for EU businesses. For example, according to Freeserve, AOL saves
itself £40 million a year as a result of not charging VAT. The enforcement of the
rules is by the requirement of affected non-EU businesses to register in a member
state of their choice, but levy VAT at the rate of the consumer’s resident country.
In the US the Internet Tax Freedom Act 1998 placed a three-year moratorium on
taxing Net access charges.
10
The legislation clamped a similar muzzle on any attempt
to subject e-consumers to taxation in multiple states on the same transaction, and on
discriminating taxation. The Act also set up an Advisory Commission on Electronic
Commerce to look at cybertaxes, which has advised that Congress extend the current
ban on discriminatory taxes and eliminate Net access taxes altogether.
67


Part three
End-to-End Business Processes
7
Enterprise resource planning
71
8
Business to employee
83
9
Supply/demand chain management
99
10 E-procurement
111
11 Customer relationship management and
e-marketing
131
■
■
■
■
■
69


7
Enterprise resource planning
Introduction
73
ERP has facilitated process management
73
Drivers for implementing ERP
74
Advantages of ERP
74
Problems encountered with ERP
75
ERP in the twenty-first century
75
Service process optimization
77
Electronic document management
79
■
■
■
■
■
■
■
■
71


Enterprise resource planning
INTRODUCTION
Enterprise resource planning (ERP) is something of a misnomer as it has nothing
to do with either planning or resources but it is to do with enterprise. It attempts
to integrate all functions and departments across the enterprise onto one single
computer system. ERP is software architecture that allows the exchange of
information between all functions, e.g. manufacturing, finance, procurement and
human resources, and manages them as processes not functions. It is based on
client/server technology, where the client (the PC on a user’s desk) handles tasks
such as displaying information, checking validity of data input and formatting
reports and the server (another computer, usually a mainframe or mid-range) is
dedicated to storing information and serving the information required to the client.
In the late 1990s, ERP became the accepted solution for larger organizations, as
they sought to gain corporate advantage from the automation and integration of
the separate parts of their businesses as well as solving their Y2K problems.
Installing ERP is fundamentally about business change, re-engineering and
automatically linking activities across the organization to form E2E processes,
changing working practices and delivering information electronically across the
organization. The impact of these technological developments on the organization
is profound. The new systems are changing not only the method of operation by
adding a few new features and some extra functionality but the whole structure
of the traditional organization.
The major suppliers of ERP systems include SAP, Oracle, BAAN and Peoplesoft
in the large-company marketplace down to Sage in the SMEs and dozens in
between including JD Edwards and Scala.
ERP HAS FACILITATED PROCESS MANAGEMENT
The use of ERP or integrated software has facilitated management by process, e.g.
the procurement process, from order to payment, in a fully automated way
requiring little or no manual intervention. Utilizing workflow systems, which
electronically route orders through the process with payments made by electronic
transfer and document-management technology enables access to all data
electronically from any location.
Another process example would be the order fulfilment process, which involves the
activities of taking an order, delivering, invoicing and collecting the funds. With ERP,
when an order is taken from a customer, all the information necessary to complete
the order (from credit rating, order history, stock levels and delivery schedules) is
available to the customer service operator at the touch of a button on the desktop
computer, with the added ability to drill down to any document needed to complete
73

74
Part Three: End-to-End Business Processes
the transaction. The same information is viewed by everyone in the organization
because it is held on one single database. The order is routed automatically around
the departments to completion – with anyone in the company able to see where it is
at any given point in time. Everyone in all departments involved – finance, sales,
warehouse and transport – are obliged to have done their jobs to ensure the correct
information is available for the customer order to be taken. The old departmental
culture of not being responsible for what goes on outside your department is no
longer applicable under ERP. Everyone must be concerned with the whole enterprise
and accountability, responsibility and communication are the keys to this new
culture. It has resulted in departmental boundaries being broken down so that the
twenty-first century organization structure looks very different, with back-office
functions often incorporated into an SSC (see p. 8).
DRIVERS FOR IMPLEMENTING ERP
■
Integrate data to one single enterprise database, ensuring just one version of the
truth.
■
Standardize systems and processes across the whole organization.
■
Optimize the processes.
■
Save time.
■
Reduce costs.
■
Increase productivity.
■
Reduce headcount.
■
Improve profitability.
■
Improve competitiveness.
■
Facilitate a culture change within the organization.
■
Improve communications throughout the business.
■
Improve the customer relationship by providing a more efficient and effective
service.
■
Improve relationships with suppliers and other partners.
■
Enable e-business and e-commerce.
ADVANTAGES OF ERP
■
Integrated common database management system, giving obvious advantages
for maintenance and end-user training.
■
Reduction of redundant data.

Enterprise resource planning
■
ERP application software has advantages over bespoke software in that it is able
to take advantage of upgrades and a large user base.
■
Increased efficiency through the ability to drill down to source transactions.
■
Facilitation of OLAP and data warehousing.
■
Ability to handle multi-currency requirements.
■
Facilitates E2E process management.
■
Facilitates business process re-engineering (BPR).
PROBLEMS ENCOUNTERED WITH ERP
■
Implementations can sometimes be very time consuming, often measured in years.
■
Implementations can be expensive, with estimates of costs varying from three
to ten times software price, depending on vendor.
■
Estimate overruns are known to occur.
■
There may be a failure to re-engineer processes prior to implementation.
■
The complexity of such systems can require considerable amounts of consultancy.
■
Tweaking and tuning of the standard package can prove expensive.
■
Scope creep may occur, with companies adding functionality during
implementation.
■
Ongoing requirement for support and services.
■
Failure to manage expectations of what it can deliver.
■
Under-resourcing the implementation.
■
High levels of user training required.
ERP IN THE TWENTY-FIRST CENTURY
In the twenty-first century users still want the cross-sector functionality of ERP,
but they also want deeper industry-specific and highly integrated front-office
capabilities like CRM and equally important web integration and business
intelligence tools. Peter Koerting of Deloitte Consulting says:
A lot of clients would like to jump on the e-train but find that their ERP
legacy systems are not in the shape necessary to sell a product over the Web or
do a pan-European supply chain initiative. For example, there are quite a
number of companies out there that say to the market, yes, we are are fully on
Continued
75

76
Part Three: End-to-End Business Processes
SAP, but when you look behind the scenes they have 20 different SAP
instances, incompatible with each other. Different material numbering systems
mean that a product number can differ in the UK and Germany. If this is the
case how can you set up a website and sell your products over the Internet?
1
ERP vendors recognize that they need to offer flexibility and agility and have
redesigned their products into easily integrated components that allow the use of
other components as well. The strength of global ERP products is that they are
needed to provide a firm foundation on which to build on other products to
achieve the desired BCI:
■
Oracle 9i has been aimed at the management of e-business and B2B processes.
The database becomes the centre of an integrated suite of applications currently
available from multiple vendors, with a focus on OLAP, data mining and data
warehousing.
■
Peoplesoft has added CRM, SCM, human resource and financial planning and
budgeting analytical applications to its Enterprise Performance Management
suite.
■
SAP, which earns 60 per cent of its income from mySAP.com, its e-business
software, has entered into a joint Internet portal venture with Yahoo!
■
Scala’s André Israel explained when launching their Net-enabled version i2.1 in
May 2002:
Over the last two years we have been more focused than ever before. We
have concluded a lot of people cannot handle the complexity. We have
gone away and designed an offering, which comprises less complexity in
the core product and more connectivity.
■
JD Edwards calls its post-ERP solution collaborative commerce.
Benefits of latest generation of Internet-enabled
ERP applications
■
They are easier to use, making roll-outs much simpler.
■
They are available on a rented basis through ASPs and operate on thin client
PCs (a computer that is cheap and easy to run because all the data processing
is done on central servers) and a web browser.
■
Future developments can be more quickly designed and rolled out.
■
They are broken down into three main parts:

Enterprise resource planning
– the enterprise applications aimed at employees;
– supplier applications;
– customer applications.
■
Each category is then broken down into:
– backbone functions – the back office;
– collaborative applications, which will encompass all users.
The case study from Royal National Lifeboat Institution (RNLI) (see p. 80)
illustrates how an entire ERP suite can be installed successfully in nine months
and within budget.
SERVICE PROCESS OPTIMIZATION
Service process optimization (SPO) has grown out of the need for services-based
organizations, both internal and external, to fully exploit their capacity to change
and evolve in today’s dynamic business environment. They have more natural
flexibility than manufacturing or supply chain operations and this leads to a very
different set of systems requirements and approach to systems development. First,
there is the need to continually assess the performance of all parts of the
organization, followed by the requirement to rapidly implement business changes
as informed by changing information, and finally the wish to automate and reduce
the costs of internal business processes to facilitate value-adding activity.
SPO software is designed to track and allocate the major resources of service
companies or departments, i.e. people, intellectual capital and time traced to their
outputs, such as proposals, contracts, projects and reports. SPO is also known as
professional services automation (PSA), enterprise service automation (ESA) and
services relationship management (SRM). Gartner Dataquest predict with a 0.7
probability that by 2005 80 per cent of all IT professional organizations with over
100 billable consultants will replace their project management applications with
SPO.
2
Large users include KPMG, Ericsson, NCR and CSC, with the largest
providers including Peoplesoft, Oracle, SAP and Aggresso.
Case study 7.1
Aggresso
Aggresso, a leading provider of enterprise solutions serving service-based organizations in
Europe, has worked hard to distinguish between ERP systems – which the company sees as
‘control’ systems for relatively static operations – and SPO.3 SPO needs a degree of ‘control’
for core operational processes, but must also fuel and facilitate rapid change. Aggresso
offers E2E SPO solutions enabling information to move freely and efficiently from
consultants, clients and other partners throughout the organization, providing executives
with a complete picture of their organization. It is seen as a people-centric solution, with the
77

78
Part Three: End-to-End Business Processes
ability to rapidly manage change as the needs of the business change. The focus is on
information dissemination, not just process automation.
Service processes
SPO integrates into one solution the main processes that take place in service
organizations. These include:
■
Opportunity management which includes qualifying projects and clients, tracking
sales opportunities, forecasting revenues and consolidating opportunities into a
project. Existing solutions include CRM and the sales team.
■
Proposal creation which requires accessing old projects, developing proposals,
pricing and delivery timetabling. Existing solutions include knowledge
management systems and MS Office or similar tools.
■
Resource scheduling where resources are assigned depending on variable
factors including skills, experience, availability, location, internal and external.
Tools commonly used include MS Office, specialist HR scheduling software,
preferred suppliers for external resources.
■
Project management where project plans are drawn up, with milestones and
priorities, which are tracked and reported on and if necessary modified. Tools
commonly used include Project Management software like MS Project.
■
Time and expense capture, accounting and reporting. This information needs
to be integrated into back-office systems such as invoicing and payments and
incorporated in project costing and management activities. Traditionally such
processes were managed by time-sheeting, data capture systems and project
accounting.
■
Reporting operational reports, resource utilization, customer profitability,
organizational profitability, scenario planning. Traditional solutions include
spreadsheets or home designed tools.
The software can incorporate the following modules, features and functionality:
■
opportunity management;
■
resource management;
■
human resources;
■
project management;
■
time and expense capture;
■
project costing and billing;
■
logistics;
■
project accounting;

Enterprise resource planning
■
financials;
■
knowledge management, including document sharing and storage;
■
strategic sourcing, which recognizes the need to use external resources as a
growing trend;
■
portfolio management and analytical processing, providing online information,
virtual invoices and dashboards, for example.
Benefits of SPO
■
better portfolio management;
■
quicker, more informed decision making;
■
improved project management;
■
improved data integrity;
■
shorter delivery time;
■
cost savings and improved profitability in process;
■
greater customer satisfaction;
■
improved use of resources;
■
better strategic sourcing;
■
facilitates change management;
■
necessary to maintain competitive advantage against other (external) suppliers;
■
measurable operations that can be benchmarked;
■
end-to-end process management.
Gartner research into portfolio management within internal IT departments
revealed that out of 60 enterprises surveyed 37 per cent gathered their information
manually and a further 27 per cent do not carry out this vital management activity
at all.
4
Similarly, the same survey revealed that 43 per cent have no process for
tracking the utilization of their employees.
ELECTRONIC DOCUMENT MANAGEMENT
The removal of paper and manual intervention from processes is an essential part
of automation from E2E.
Document management
Document management is a standardized approach to the indexing and management
of documents entering the company in whatever form, e.g. paper, computer systems,
79

80
Part Three: End-to-End Business Processes
Internet, microfiche, fax and e-mail, utilizing such techniques as document imaging.
Having compiled a comprehensive database of information, it can be queried at will
via the desktop, saving considerable time and space and providing a necessary back-
up for paper records. The approach has now moved beyond early document
management systems, the role of which was seen as to capture everything that
entered the company. The aim now is to challenge the amount of documentation
being received and consider how and if it needs to be stored electronically.
Workflow
Workflow systems can be designed to deliver specified data periodically to selected
people. They can remove the need for paper, automatically route electronic documents
and enforce procedures written into a process, used widely for ERP and E2E, e.g.
purchase order-processing systems.
Case study 7.2
Steinbeis Temming
Steinbeis Temming use SERware’s intelligent workflow product, to capture, classify and
analyse data on incoming invoices before workflowing them through to its back-end SAP
system. The time taken to populate the ERP system was reduced from half a day to minutes
with significant accuracy improvements. While an average person can read 200 pages a
day, the SERware can process twice that amount in minutes.
Computer and telephone integration
The use of computer and telephone integration (CTI) technology has revolutionized
systems, with telephones linked directly into ERP and other computer software and
voicemail products, e.g. routing consumer calls into the right part of the company
customer services by means of customers pressing numbers on their digital telephone.
Case study 7.3
RNLI
Background
The Royal National Lifeboat Institution
5
is a registered charity dedicated to saving lives at sea.
It provides, on call, the 24-hour service necessary to cover search and rescue requirements
up to a distance of 50 miles from the coast of the United Kingdom and the Republic of
Ireland. The RNLI has its headquarters at Poole, a production facility on the Isle of Wight, six
divisional bases supporting 224 lifeboat stations and ten regional fundraising offices. The
charity takes responsibility for the design, build and maintenance of its lifeboats, launching
equipment and stations and all crew training is undertaken in-house by the RNLI. The RNLI

Enterprise resource planning
employs 900 full-time staff and 4,500 volunteer crew to carry out this vital work. Its income
in 2000 was £100 million.
ERP decision
In August 1998 a decision was made to purchase ERP software as core systems support
for the RNLI on account of the fact that the existing:
■
software would not in some cases be supported beyond 2000;
■
systems were disparate and many were manual (handwritten books and card files);
■
software and technology were outdated.
In addition it was recognized that the existing information systems were not robust enough
to satisfy the increasing requirements of managers and trustees.
An ERP solution was recommended by a project team, which comprised representatives
from finance, technical, operations, purchasing and IT, and which originally tasked to replace
the financial, purchasing, stores and production software. Following the agreement for an
enterprise-wide solution the team reviewed the options and selected SAP. At that time the
personnel department was looking to replace two in-house HR packages and the RNLI was
about to move to a UNIX database and update its legacy systems accordingly.
Flagship project implementation
A contract was signed with SAP in August 1999 and a team was formed with the name of
‘Flagship’ to implement seven SAP R3 modules and to write two bespoke programs interfacing
with R3 to support the unique features of the lifeboat service. Significant business areas
included were finance, materials management, warehouse management, new construction of
lifeboats, plant maintenance, production planning and personnel administration (including
staff and volunteers). The bespoke software was for rescue records and an incident database
for the RNLI and third-party sea rescue organizations. Following the implementation, most of
the RNLI’s back-office systems are now supported by SAP.
The kick-off meeting was on 1 September 1999 and the implementation was successfully
completed on 5 June 2000 on time and under budget. The ‘go live’ was in two phases with
the financials and some purchasing on 3 April with the remaining modules on 5 June. Some
further core consultancy was affordable within the budget to assist users while the software
bedded down and was retained for three months post-implementation.
Project boundaries defined
The project team was tasked as a priority to meet the deadlines, and second, to keep within
budget and implement core functionality. Frills and ‘nice to haves’ were to be addressed at
a later date. It was also agreed that ‘vanilla’ SAP would be implemented, i.e. with as little
customization as possible, while consistent and best business practice was to be introduced
to the operations of the RNLI with minimum disruption to the business. This was felt to be
the strongest base from which to implement a fully integrated suite of software. While
appreciating the complexities involved the motto was KIS (keep it simple).
The project owes much of its success to this clear statement of boundaries. The fact that
they were adhered to during the implementation prevented the project from being diverted.
Concentration centred on mastering the basics in the belief that this would help the
avoidance of fatal flaws and sidetracking.
81

82
Part Three: End-to-End Business Processes
BPR
There was no business process re-engineering prior to the implementation and little by way
of formal, documented business procedures. Although this increased the time pressure on
the teams any re-engineering was carried out and documentation produced as part of the
project. At all times the team members were committed to producing the best solution for
the RNLI.
Following the implementation the package has been enhanced so that payrolls may be
produced in-house and competence-based training records may be held for volunteer crews.
Tips on successful implementation
ERP solutions are best implemented quickly to maintain momentum and need to meet
agreed timescales to preserve credibility. Key to success is the selection of an able,
committed and determined project manager with good knowledge of and support from
within the organization and from the software supplier. The inclusion of senior managers
within the team is also critical to a successful implementation. These are the people who
should have the greatest knowledge of business areas and the strategic vision to manage
integration issues. Where modules are configured and installed concurrently integration
issues can be addressed and resolved within the original implementation and are unlikely
to require substantial change at a later date. Any scope increases need to be monitored
closely but, where possible, avoided. Communication with management and the user
population needs to be regular, clear and timely to ensure that they are fully aware of the
project’s progress and prepared for the impact that will be felt across the organization when
the system is switched on. Change management and training are fundamental to post-
implementation acceptance of the software and new systems and require special attention
and dedicated resources for the duration of the project.
Problems encountered
Flagship was not without its share of problems. The materials management module was
almost wholly configured and implemented without a champion from the business since he
left and was not replaced during the course of the project. But the real Achilles heel was
the inadequate resources for training and change management, most of which was
undertaken by the team members and resulted in key consulting staff being retained for
three months post project implementation. The impact of this resource shortfall was felt
quite keenly by some of the user community who remained unforgiving for many months.
Conclusion
The defining feature about Flagship was the superb relationship that existed between the two
project managers (RNLI and SAP) which was at all times honest, open, loyal and supportive,
first, to each other and then to the project. Without this strong affinity it is doubtful whether
the project would have survived its first milestone.
Now, some 15 months on, the RNLI has a tightly integrated enterprise-wide information
system that provides a solid foundation on which to build and is well positioned to exploit new
IT opportunities as they arise in furtherance of the charity’s objective to save lives at sea.

8
Business to employee
Human resource management
85
E-recruitment
87
E-learning
88
Information management delivering business
intelligence
89
Data quality and compatibility
90
Content management systems
92
Enterprise portals
93
■
■
■
■
■
■
■
83


Business to employee
HUMAN RESOURCE MANAGEMENT
Self-service
Just as companies are recognizing the benefits of selling directly to consumers over
the Web some companies are now applying disintermediation to their own
corporate structures. An increasing number of companies are seeing the benefits of
employing a self-service approach to HR, i.e. relying on corporate intranets and
web-enabled software to deliver documents, benefits information and company
data directly to workers. Boston Scientific is one convert and Nick Messerschmidt,
VP of HR, says:
My goal for HR is to take the manual transactions out of our hands and let
managers do it themselves. You don’t want managers spending three days
running around looking for numbers.
1
Research
Statistics from the Hunter Group show that cost savings from 50 per cent on a
benefit enquiry to 88 per cent on a change of address can be gained from
switching from manual to self-service, primarily from time savings in processes.
2
Hunter Group research shows that typical self-service HR initiatives pay for
themselves in about 18 months. Traditionally, the average firm employs one HR
worker to every 100 employees. Browser-based systems should improve the ratio
dramatically by either increasing the productivity of existing workers or reducing
overall headcount. Equally importantly, employees seem to prefer self-service HR.
With virtual HR, workers can access real-time benefits information, medical
forms and pay slips, all from their PCs.
IDC is predicting that the European HR services market will continue to
flourish. The research firm points to a growing number of European companies
seeking help from IT and consulting firms to manage HR processes such as
recruiting, staffing, payroll, training and development. IDC’s Mike Friend says:
Complexities of the European market are likely to lead to the evolution of new
HR outsourcing models. For many multinationals, the administration costs of a
pan-European HR policy, with all the complexities of country and EU
reporting regulations, has made the HR outsourcing message a compelling one.
The emergence of the outsourcing model has had a knock-on effect on the
broader HR services market with technology, in particular the web-enabling of
HR processes, forming a key component of HR service provider offerings.
3
85

86
Part Three: End-to-End Business Processes
System capabilities
Collaborative applications could include:
■
e-benefits
■
e-compensation
■
e-development
■
e-pay
■
e-profile
■
e-recruit.
Enterprise applications could include:
■
human resources
■
benefits administration
■
pension administration
■
payroll
■
time recording and expenses.
Recruitment and development include:
■
workforce recruitment
■
competency management
■
training administration
■
career planning
■
succession planning.
Information provided can assist with:
■
position management
■
health and safety
■
global assignments
■
employee relations management
■
absence management
■
company car and property tracking
■
base benefits
■
workforce administration and records management
■
regulatory reporting.

Business to employee
Case study 8.1
STI Knowledge
STI Knowledge,
4
a help-desk and call-centre outsourcer, has outsourced its HR needs to
Employease and pays on a per employee, per month basis for a range of web-based services
that address benefits, payroll and other issues. According to the COO the company’s annual
outlay of around
€36,000 has produced savings of 15 times that amount.
Case study 8.2
Lafarge Group
Lafarge Group, the French construction materials manufacturer, is using Cyborg system
Authoria and other products to make a new HR service centre more efficient and to allow
employees to serve themselves. This frees HR staff to contribute in more substantive ways.
For example, the old decentralized system required nine days simply to tabulate the number
of employees the company has.
Case study 8.3
National Health Service
The National Health Service (NHS) is a good example of this trend, awarding in 2001 the
contract for its HR/Payroll Shared Services to a consortium which includes Oracle software.
Case study 8.4
BP Amoco
BP Amoco announced a $600 million contract in the same year that will effectively hand
over the bulk of the company’s HR function to Exult. While Exult will add 100–200 workers
to handle the job, BP Amoco is likely to cut its 550-man HR department by 40 per cent.
E-RECRUITMENT
5
With the economy on the downturn traffic at nearly all the top job sites has almost
doubled in 2001. Increasingly, corporations are going online to fill management-
level positions. The benefits of online job searches are pretty obvious. The Net
enables employers to trawl through an enormous pool of talent much more quickly
with exponentially more prospects than traditional headhunters can contact. And
because hirers can put jobs up on specialized boards, it is more likely that postings
87

88
Part Three: End-to-End Business Processes
will be seen by qualified and interested candidates. The other major benefit is that
it is considerably cheaper than going through a placement firm.
Case study 8.5
Motorola
Motorola’s Jim Pappas, manager of executive search, explained that every time they use a
virtual job board, it saves them at least $60,000.
Case study 8.6
Safeway
Safeway,
6
which has 91,000 employees in the UK, is to manage its whole recruitment
process online using Peoplesoft 8 eRecruit package. After research into how the HR
function, managers and employees spent their time and following scrutiny of the recruitment
process, Safeway decided that a move to online processes would make recruitment more
efficient and effective. Traditionally, each store handled its own recruitment but under the
new system, all recruitment is handled electronically from a single centre in Warrington, to
bring about standardization and consistency and free up in-store staff for more strategic
activities. Open from 8 am to 8 pm, the centre has a freephone number to handle store
and applicant enquiries. Applications and vacancies are handled by the web-based system.
By March 2002 it was handling over 9,000 applications. Peoplesoft’s HRMS is live in 100
of their 500 stores and other applications, such as employee self-service, are set to follow.
E-LEARNING
Corporate use of the Internet to deliver training via virtual instructors makes
sense. Distance learning cuts the costs of both delivering and attending training,
but it lacks human interaction and is being used by companies to supplement
rather than completely replace traditional learning.
Case study 8.7
IBM
IBM,
7
which spends
€1 billion annually on employee training, has developed a four-tier
strategy for employee education that forms the basis of a 12-month manager training
programme called BasicBlue, which covers five times as much material as the old five-day
workshop at one-third of the cost:
■
Information covers the sharing of knowledge distributed over the Net, e.g. best practices.
■
Understanding involves using the Web to see if employees have mastered the concepts
in tier one. It is highly interactive putting staff in real-life scenarios that have been
simulated on the Web.
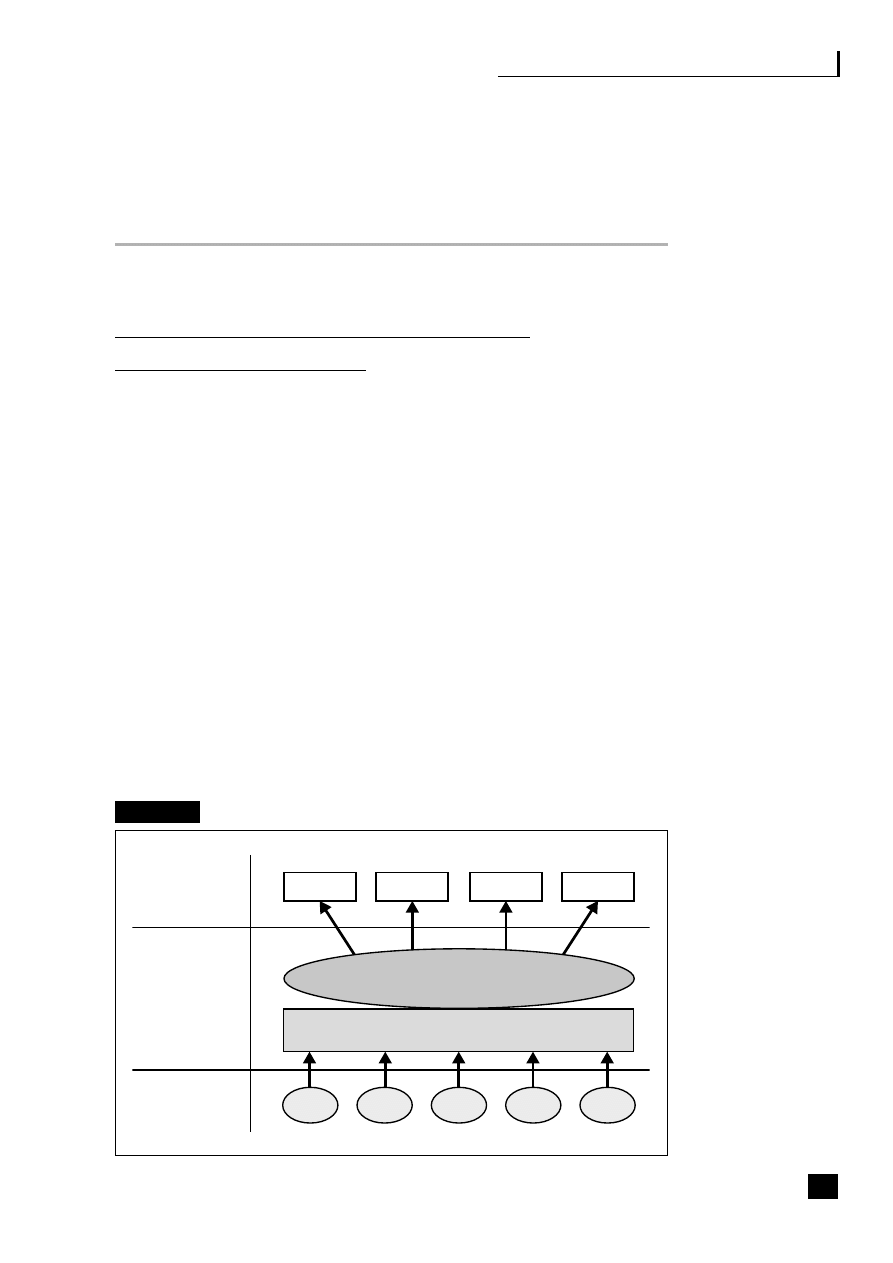
Business to employee
■
Collaborative learning, which is intended to facilitate learning from peers or experts via
online virtual classrooms, is produced using Lotus software.
■
Face-to-face learning, a traditional format, is designed to allow IBM managers to polish
higher-order skills and proficiencies.
INFORMATION MANAGEMENT DELIVERING
BUSINESS INTELLIGENCE
Traditionally, companies have had scores of independent IT systems, often dependent
on, and driven by, individual functions and built up over decades. The 1990s became
the decade when companies came to realize the importance of breaking down their
functional boundaries and viewing their organizations through streamlined
processes. With this realization, there is not just an appreciation of the need for a
process-oriented, enterprise-wide decision-support system, but an urgent demand for
its implementation, to enable companies to maintain their competitive advantage.
Figure 8.1 shows how a modern IT environment would cope with transaction
processing and then pass it to a data warehouse, on top of which sit business
intelligence tools, which in turn analyse the data and disseminate the information
electronically via such tools as EIS, portals, the Internet, intranets and extranets. This
is an extract from Transforming the Finance Function,
8
which covers definition of the
business requirement, technological developments, formulating a companywide
information strategy, knowledge management and decision support, and business
intelligence tools, including data warehousing, OLAP, process-based DSS, portals (also
covered below, pp 91–5) and website and CRM analytics (also covered on p. 142).
Fig. 8.1
Web-enabled information management process
89
Information
dissemination
Internet
ERP
CRM
SCM
Other
internal
External
Portals
Business intelligence tools
Data warehouse
Intranet
EIS
Information
collection
and analysis
Transaction
processing

90
Part Three: End-to-End Business Processes
Case study 8.8
Wal-Mart
Wal-Mart
9
has 4,457 stores, 30,000 suppliers and an annual turnover of $217 billion – and
one information system (IS). According to CIO Kevin Turner, running centralized IS with
home-grown, common-source code gives Wal-Mart a competitive advantage and helps
maintain one of the lowest expense structures in retailing. The company’s philosophy is not
about being the biggest but about being the best company in the world and having
something called the ‘divine discontent’, which says that you will never be satisfied and that
you can always improve. Striving for excellence is one of Wal-Mart’s three core beliefs, the
other two are ‘having respect for the individual’ and ‘practising excellent customer service’.
The three principles of the IS are as follows:
■
It is centralized in Arkansas.
■
Common systems and platforms are in use worldwide.
■
The aim is to be merchants first and technologists second.
They are able to apply common processes and systems anywhere in the world, allowing
people to move freely without significant downtime. The model is one of decentralized
decisions but centralized systems and controls. Systems developers focus on systems that
are easy to use, putting responsibility on the developer to understand the business, which
they do by going into the business and performing the function first.
Wal-Mart has a set of critical success factors that every associate has to live by and in IS
these include excellent customer service, testing and validation before roll-out, balance and
controls, payback and ROI. Wal-Mart has built the company in large part on its efficient supply
chain and inventory management, all of which is driven by, and dependent on, the flow of
information. In the past ten years the driver of change has shifted from technology to
information. The really strategic difference is the use of the information and how it is exploited
and maximized. Wal-Mart is in a business that competes at the speed of information, so it
must be presented in such a way that it drives execution and improvements in the business.
DATA QUALITY AND COMPATIBILITY
There is an increasing need to integrate data from multiple dissimilar sources into,
e.g. an e-marketplace hub, EAI platform or database. The quality of underlying
data in systems, particularly CRM, is one of the major stumbling blocks to
success. The number of different legacy systems making up a typical CRM system
is around 80 and even if the integration of these goes smoothly there are problems
associated with data consistency and quality. To accurately map source fields, it is
important for middleware to completely understand the full semantic meaning of

Business to employee
each data source element and how it behaves over the entire scope of source data.
Semantics-based integration tools are considered a kind of middleware that
thinks, because they utilize a combination of natural language analysis, pattern
recognition, artificial intelligence and other leading-edge cognitive technologies.
10
It is designed to eliminate the need to manually analyse and map each source’s
various meanings and then to re-map those meanings each time a new data format
arrives. Semantics-based integration technology is being pioneered by a variety of
software companies, including Contivo, Modulant Solutions, Network Inference
and Unicorn Solutions.
The World Wide Web Consortium (W3C) is developing a Semantic Web that
aims to unify the unstructured information scattered across the Web. The ultimate
goal is to transform the Web from a display-oriented publishing medium into an
environment where information can be interpreted, exchanged and processed.
Case study 8.9
A US telecom company
A US telecom company
11
found that when it combined its call-centre database and its
marketing database it had 300 million customers – more than the total population of the US.
Case study 8.10
KeyBank
KeyBank
11
wanted to write to its customers to gain their permission to use their personal data,
following the introduction of the 2001 Gramm-Leech-Bliley Act in the US, and, more
importantly, it wanted to write to each customer just once. This meant combining data from
almost 30 data warehouses and individual systems. It had to comb through about 200
systems to make sure the information in those systems was up to date and complete. This
process, which yielded 11 million customers, highlighted so many inconsistencies that
executives decided to accelerate corporation-wide data governance and data quality initiatives.
Case study 8.11
Cincinnati Bell
Cincinnati Bell,
11
part of Broadwing Communications, enables any service order entry for any
product to immediately populate all of the company’s data warehouses, including the
company’s website, which allows customer orders to be processed without human
intervention. This has enabled the call-centre focus to switch from answering customer calls
in the shortest possible time to selling additional products with real-time quality information
readily available.
91

92
Part Three: End-to-End Business Processes
CONTENT MANAGEMENT SYSTEMS
According to the Butler Group:
As the amount of digital content continues to proliferate, unstructured
content such as e-mails, images and documents account for over 80 per cent
of data in a typical business. Some form of content management is becoming
essential for all organizations.
12
There are two main problems with management of e-mail content:
13
■
how to lose what you want to hide;
■
how to find what you need to retrieve.
The former can prove more difficult than simply pressing the ‘delete’ key, as a
number of high-profile prosecutions have shown. One potential solution comes
from software that can ‘expire’ both sent and received e-mails, or restrict a
recipient’s ability to forward or print the material. Products from companies like
Authentica and Tumbleweed Communications let senders encrypt outgoing e-mail
and then provide recipients with conditional access to the decryptor key, which
stays on the sender’s server. This means that everything from personal notes to top
secret documents can be deleted after a specified time. Some allow a recipient’s
viewing privileges to be revoked should a change in relationship occur. It is
suggested that only 10–15 per cent of correspondence would merit encryption.
Recent privacy legislation from Brussels has also prompted companies to take a
look at e-mail management tools.
Equally, trying to find information stored in e-mail archives often can be difficult.
Specialist companies, like Applied Discovery, can now categorize, manage, search
and review electronic data from clients via a secure online ‘reading room’. KVS
sells an e-mail search agent in Europe for Microsoft Exchange.
What the technology industry is offering is better ways to share information in
chunks, remotely, but in a structured way so that we neither kill forests sending
out reports nor waste our wisdom in random e-mailing binges. Sitting on top of
existing technologies such as ERP, workflow, document management, content and
knowledge management and intranets we now find the corporate portal – a
simple personalized Web environment offering one view of all data and
information sources. Content management functionality is now being embedded
into portals, like mySAP Enterprise Portal, which converges with knowledge
management in the provision of search and retrieval functionality from both
internal sources and the Internet.
14
Content is an integral part of the business and
is a product of every application and should be managed from a single repository
as part of the infrastructure.

Business to employee
ENTERPRISE PORTALS
Definition
Gartner define a portal as:
Access to and interaction with relevant information, applications and business
processes, by selected target audiences and in a highly personalized manner.
15
Portals allow users to access all the information needed to do their job through a
standard web-browser interface which can be customized to individual preferences.
A portal hides users from the complexity and technology behind the scenes, making
information from in-house software, external systems and the Internet appear like a
single application. Merrill Lynch defined the enterprise information portal (EIP) as:
A single gateway to personalized information needed to make informed
business decisions.
EIP technology utilizes a web-browser interface to give employees access in a single
on-screen environment to various data and information systems they need to do
their jobs more productively. It also makes it simpler for colleagues to interact with
others, whether within a company or without. They are modelled on Internet
portals like, Yahoo!, which enable a search to be carried out to extract the relevant
information. Most portal products will allow search, retrieval, filtering, knowledge
mapping, document management, workflow and personalization. Portals do not
solve the incompatibility problems of proprietary software; they simply avoid them,
by providing a gateway to look at things. By embedding application program
interfaces (API) into the portals, often dubbed pagelets, portlets or gadgets, the need
for complicated back-end integration between programs is eliminated, i.e. data gets
integrated at the portal level. Portal software specialists include: Hummingbird,
Corechange and Plumtree, which claims to have invented the idea and has among
its clients BP, Airbus, the Highways Agency and Cadbury-Schweppes.
Research
The Butler Group has warned that companies using portals must reassess the way
ROI is measured.
16
The research company has seen an increase in the deployment of
corporate portals and predict spend on the enterprise portal market to reach $4
billion by 2005. This is despite reduced spend on IT, as portals are being seen as an
important collaborative tool to support business decisions. Jacque Hale of the Butler
Group has commented:
93

94
Part Three: End-to-End Business Processes
There are no IT profits to be made by corporations – only business profits.
This means that if the full potential of the portal is to be realized, IT managers
must be able to measure ROI in terms of information productivity.
17
Martin Butler of the Butler Group believes that two-thirds of the value of large
companies is made up of information and knowledge, and to overlook this issue
is to devalue the business:
Two-and-a-half to three per cent of revenue is the average amount spent by
companies on IT, but 30 per cent of spend goes on managing information.
So if you can make 10 per cent difference on the information process costs
to your business, you’re talking about something significant. That is where
corporate portals can make a difference.
18
The Butler Group outlines the key benefits of portal deployment as:
■
providing a single point of access to information;
■
supporting better-informed business decisions;
■
enabling collaboration between employees and with trading partners;
■
integrating and personalizing the delivery of IT services.
A survey of organizations published in Computing in November 2001 showed that:
19
8%
–
already have a portal
35%
–
planning to implement in next six months
26%
–
planning to implement in 12 months
5%
–
planning to implement in over 12 months
16%
–
have made no decision
10%
–
do not plan to have a portal.
Case study 8.12
Hewlett-Packard
Hewlett-Packard
20
spent $20 million constructing its employee portal in 2000 providing a
gateway, called @HP, to 90,000 employees in 150 countries to, among other things,
update human resources records, change benefit electives and book business trips. HP
claims that in its first year it has delivered an ROI of $50 million.

Business to employee
Case study 8.13
Ford Motor Company
Ford Motor Company
21
replaced about 1 million documents as potential content on 1,500
intranets, each serving individual business units around the world, with a single portal called
My.Ford.com for the whole organization, using Plumtree. This was selected for its extendibility,
its ability to integrate with other applications including Documentum and eRoom and its strong
content management features. This enables 50,000 staff in any part of the organization to
retrieve information from other parts in addition to removing the need to maintain duplicate
data on local intranets. Ford believes that the ROI for business-to-enterprise portals is driven
by personalization, which can be defined as the delivery of individualized content through web
pages or e-mail. One example of savings made by Ford is the use of its portal to display and
access pay slips, which are estimated at $18 million a year.
Case study 8.14
Herman Miller
Herman Miller,
22
an American office furniture maker, has 300 employees who spend most
of their time in contact with suppliers, using a customized portal by Top Tier Software (now
part of SAP) that gives them fast access to news and information. As such they are able to
deal with business partners more effectively, because they do not have to hunt for or
combine various bits of data. This initial success has led to several portals for internal uses
being rolled out. Mike Brunsting, the firm’s e-commerce team leader, said:
The benefits for collaboration are amazing. For example, employees can decide what
kind of alerts they want to have fed to their screens (supplier X is three days late with
a delivery) and then drill down into data to identify the cause of the problem and
potential ramifications.
On the downside, while the technology is very good at sifting through structured data such
as that contained in databases, at present it has trouble handling unstructured data, such
as correspondence and CAD drawings.
Case study 8.15
Royal & Sun Alliance
Royal & Sun Alliance (R&SA)
23
has been working with Corechange to implement working
pilots to develop global standards and best practice in all of the 130 countries in which it
does business. Ultimately, R&SA’s 55,000 employees will be using portals to access all
95

96
Part Three: End-to-End Business Processes
applications and systems. It also plans to develop a single sign-on to help minimize the
number of ‘forgotten password’ calls to the help-desk. They introduced Corechange’s
Coreport technology and Autonomy’s search facility in September 2001, after a lengthy
evaluation process. R&SA believe that the key to making portals work is ensuring that users
feel comfortable. The CEO was most emphatic in saying they needed something that gave
them the opportunity to maximize their knowledge assets and their business leaders in the
heart of the business are actively using it.
Case study 8.16
BOC Group
BOC Group
24
has started work on BOC2B, an ambitious scheme to provide a common view
of information for more than 1 million customers in the UK and Australia. BOC believes it is
important to look at portals, not as the answer to all business problems but as part of the
solution jigsaw in which to fit other technologies and processes. BOC have found it hard to
justify their CRM without a portal-based front end.
Case study 8.17
The Inland Revenue
The Inland Revenue
25
has completed a huge Web integration project to allow companies to
check their tax liabilities online. The Revenue has been working on the initiative with its
outsourcer EDS and middleware supplier BEA since April 2001. Data from the Revenue’s
mainframe will be accessible via the Internet and it expects 90 per cent of businesses to
use it. The customer front end has been built by the people responsible for ‘Egg’ and ‘If’.
The enterprise architecture layer (middleware) picks up the data from the back end and
puts it into a data cache from which the applications can pull it. Data will be loaded into
the cache overnight and then returned updated to the mainframe. The portal will also
include an e-workspace, a shared repository of agreements between the Revenue and
individual companies.
Case study 8.18
Orient Express
Orient Express
26
has replaced the individual HTML sites of its 30 hotel and train companies
with a Web portal to combine its travel services under one corporate banner, using a Tridion
Web content management package and Broadvision’s personalization software, with Web
design agency, Nucleus, responsible for design, build and training. The portal, costing £1
million, replaces a system that required changes from each site to be faxed to an agency
for updating. The new portal allows each decentralized business to develop their own
microsites, using a web-based interface developed by Web content specialist, Tridion, to

Business to employee
build, update and develop their own presence within the portal. This is particularly important
for localization of foreign websites. Online bookings for Orient Express Trains have already
increased tenfold. E-commerce director, Brian Tickle, explains:
We spent a lot of time planning what was needed, there was a lot of pressure to get
online quickly. But planning was so valuable and sifting what’s important is the key.
97


9
Supply/demand chain
management
Introduction
101
Supply/demand chain strategy
103
E-manufacturing
105
Front-end systems
106
Logistics
107
E-tailing
107
Consumer marketplaces
108
■
■
■
■
■
■
■
99

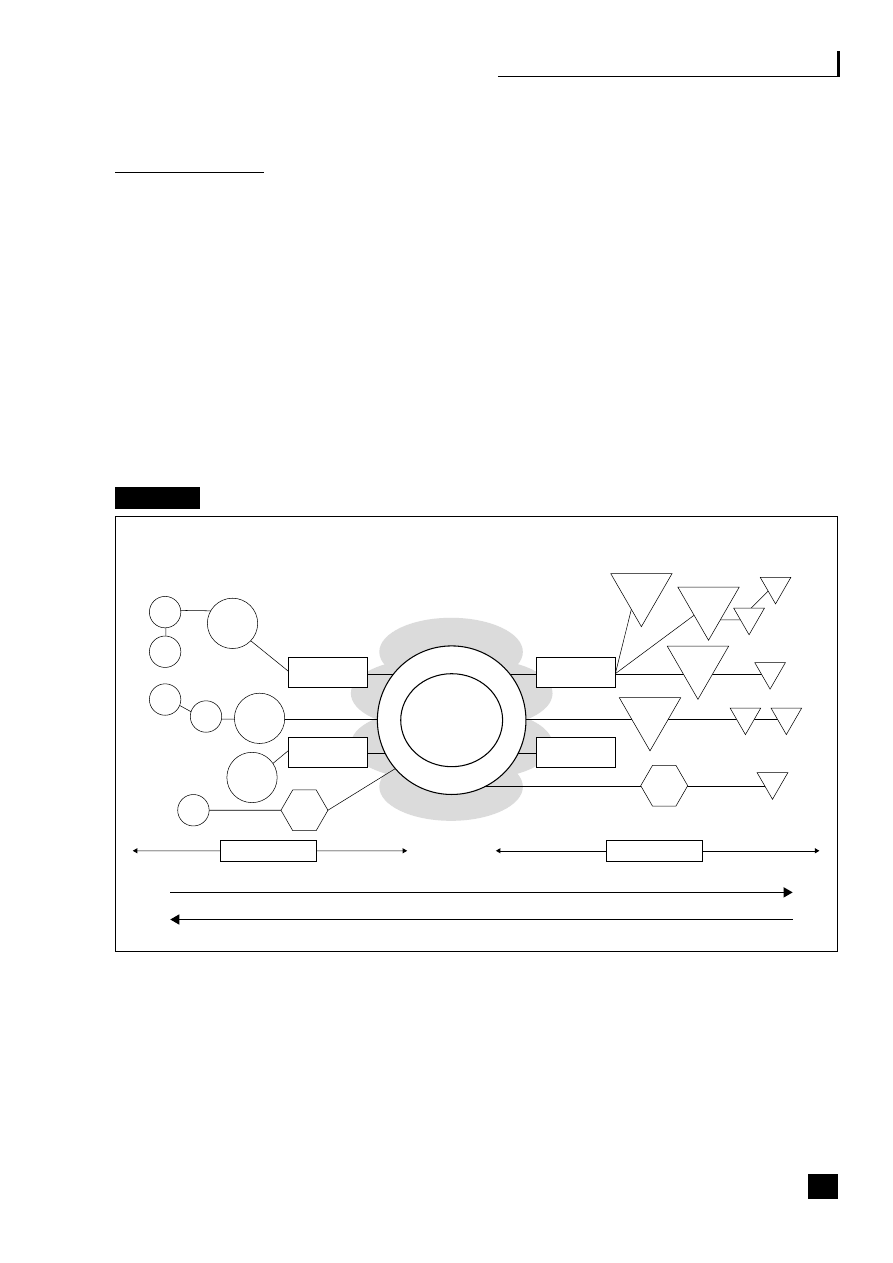
Supply/demand chain management
INTRODUCTION
Supply/demand chain management (S/DCM) involves the coordination of all
supply activities of an organization from its suppliers and delivery of products to
its customers. This supply chain is divided into two parts:
■
upstream supply chain – buy-side e-commerce (see Chapter 10 on e-procurement);
■
downstream supply chain – sell-side e-commerce (this chapter).
Figure 9.1 shows the two parts of the S/DC together with the, often complex, links
to suppliers and partners and their suppliers and customers and partners and their
customers – more accurately termed a supply chain network – now found in
typical twenty-first century organizations, with both sides regularly utilizing buy-
side and sell-side intermediaries such as distributors, agents and B2B exchanges.
Fig. 9.1
Supply/demand chain networks
Figure 9.1 also illustrates that when products are produced and then pushed to
customers it is a supply-led chain; on the other hand, when the customer is involved
in specifying the products to be produced, it is a demand-led chain. The demand chain
(DC) focuses all its resources, including production, R&D, sales and marketing, and
customer services, on consumer demand.
1
It involves a radical change in thinking that
takes the company, its SC partners and its systems into a new business environment.
The demand-driven business model uses technology to focus on the consumer’s actual
101
Partner
2
Partner
1
Customer
1
Customer
2
Customer
3
Customer
4
Distributor/
wholesaler/agent
B2B exchange/
retailer
Distributor/
wholesaler/agent
B2B
exchange
Web-
enabled
ERP, SCM,
CRM, etc.
Web applications
Tools and services
Supplier
C
Supplier
A
Supplier
B
Upstream
Downstream
Push to customer = supply led
Sell-side
intermediaries
Customers’
partners
Buy-side
intermediaries
Suppliers’
partners
Customers’
customers
Suppliers’
suppliers
Pull from customer = demand led

102
Part Three: End-to-End Business Processes
demand behaviours, employing sophisticated forecasting, market research and
business intelligence to drive improvements through the demand chain.
The results are:
■
increases in revenues and profitability (profit is a key performance indicator for
the demand chain);
■
reductions in inventory;
■
improvements in product management;
■
sharper focus on profitable, value-adding customers.
Figure 9.2, looks at the characteristics of S/DC. The SC looks for efficiencies, e.g.
how can we lower manufacturing cost per item? Whereas the DC focuses on
effectiveness, e.g. are we making the right products? Are they what the consumer
wants? Are they profitable? Revenue generation, not cost, is the key driver. The
focus is on longer-term planning rather than short-term control and capacity
constraints. For example, a retailer can use an e-DCM system to simultaneously
manage demand online from, say, multiple high street, Web purchase and
catalogue sources in real-time, analysing consumer demand patterns minute by
minute and balancing inventory across all three.
Fig. 9.2
Characteristics of supply/demand chains
Building an e-commerce S/DC requires integration not only with back-office finance
and payment systems but equally all along the value chain to suppliers and their
suppliers. Many organizations have already gone through the pain of re-engineering
their internal processes to install integrated ERP and for them this extension to link
to other businesses is an easier, if not an essential, first step.
Supply-led
Increased efficiency
Focus on: reducing cost in the
supply chain
Emphasis on: short-term control
and capacity constraints
Results: e-business and
partnerships developed
Demand-led
Greater effectiveness
Focus on: how to generate higher
revenues from customers
Emphasis on: longer-term planning,
market research and business intelligence
Results: improved product management,
reduced inventories
e.g. how can we lower the cost per item?
e.g. are we supplying the right products?

Supply/demand chain management
There are five basic components for S/DCM:
2
■
Plan – this is the development of a strategy for managing the S/DC for greatest
efficiency and effectiveness.
■
Source – this involves selecting the suppliers of goods and services needed in the
S/DC; developing pricing, delivery and payment terms; relationship
management; goods in, storage and payments.
■
Make – this covers demand planning, manufacture, assembly, testing, packing,
delivery to stock.
■
Deliver – this covers receipt of customer orders, warehousing, picking and
delivering, invoicing and payment.
■
Return – this requires the creation of processes for managing goods that are
returned from customers including those that need repair and for monies to be
refunded.
At each stage, monitoring and measurement systems need to be put in place to
provide information for all parties to the chain and to monitor performance,
efficiency and effectiveness.
The Gartner Group predicts that by 2004 supply chain e-markets will become a
commonly accepted alternative for in-house management of supply chain
information.
3
This view is shared by Koulopoulos, who examined 600 of the Fortune
1000 companies and concluded that the use of electronic trading networks has been
growing so fast since the late 1990s that, if the pace continues, nearly all businesses
transactions will take place over some form of electronic exchange by 2005.
4
Major software vendors in this marketplace include Ariba/i2/IBM, SAP/Commerce
One and Oracle. The situation is similar to the advent of fax machines and because
it requires all participants to buy into the technology at the same time, several larger
organizations now make web-enabled services a mandatory part of their tenders.
SUPPLY/DEMAND CHAIN STRATEGY
The S/DC in many organizations can consume well over 50 per cent of a
company’s operating expenses. It is therefore an obvious area to explore and
exploit in the search for business systems improvement. The process of examining
processes to effect improvement, i.e. business process re-engineering (BPR), is
explained in detail in Part Four (see Chapter 14, pp. 173–79). It is unlikely to be
possible to move the entire S/DC to the Internet at one time so it may be necessary
to have a strategy of phased implementation starting with the areas where the
greatest impact and ROI can be achieved.
103

104
Part Three: End-to-End Business Processes
Case study 9.1
Premier Paper
Premier Paper
5
has installed ‘Deliver-e’ to web-enable its existing ERP order processing, so
that customers can view the firm’s inventory levels online and make orders. Most of the
additional work involved producing online catalogues. The company calculates that the
increased business will pay for the project within a year, citing a recent deal won because
they could take orders 24 hours a day and deliver their supplies within three hours.
Case study 9.2
General Motors
General Motors (GM) is undertaking an EAI deal that will allow it to develop a new vehicle
model within months rather than years. A web-based order-to-delivery (OTD) system, using
software from SeeBeyond, makes information available instantaneously from the minute the
customer places an order, which is forwarded to dealers and its logistics operation. It also
intends to make this service available to its Covisint marketplace partners involving the need
to link its 3,000 internal systems with its subsidiaries and 30,000 partners.
Case study 9.3
Clarks Shoes
Clarks Shoes is working with CSC and i2’s Rhythm package to mend weak links in its supply
chain, e.g. enabling it to phase products out of the company’s inventory near the end of
their lifecycle. It also allows comparisons between each factory’s production costs and
schedules, enabling it to find its most effective channel for delivering orders.
Implementation costs
According to Gartner, the real costs of implementing S/DCM can be as much as
five to ten times the licence fee costs and might include the following:
6
■
application licensing and maintenance fees;
■
implementation costs including consultancy fees;
■
integration costs;
■
content aggregation and rationalization costs;
■
maintenance costs;
■
catalogue/search engine fees;
■
transaction costs;
■
supplier enablement costs;

Supply/demand chain management
■
end-user training costs;
■
process re-engineering costs;
■
associated licensing costs – database and integration licences;
■
various administrative costs;
■
marketplace participation costs.
E-MANUFACTURING
Product lifecycle management (PLM)
The PLM market covers everything from now well-established mechanical CAD
software to new web-based tools allowing non-engineers access to ‘lite’ versions
of 3D data.
7
The biggest growth area, increased by 54 per cent, is in collaborative
product commerce and visualization software, which helps companies plan
factories and production digitally. Companies that have been using digital mock-
up software to save time by reducing the need for physical mock-ups or
prototypes can now use the Internet as a communications vehicle, giving all their
suppliers access to the digital data. In the same way, 3D digital data can be made
available to functions such as purchasing or maintenance departments. For
example, United Airlines gives their maintenance staff online access to 3D design
data using Dassault Systems software.
The automotive industry is pioneering PLM to:
■
reduce product development times and costs – using software tools to design in
cyberspace, to remove the need to use clay models or conceptual drawings;
■
run globalized production more efficiently, by supporting their platform
strategies maximizing re-use of parts, designs and production processes;
■
increase build-to-order;
■
push more design responsibility down to first-line suppliers;
■
forge stronger links with customers via e-tailing;
■
achieve bigger participation in the after-market.
Production
E-manufacturing solutions enable the business to see what orders are where, what
problems have occurred and precisely how much capacity remains – essential in a
web-enabled make-to-order environment. It involves a strategy to jointly leverage
Internet technologies, collaboration with partners, electronically-driven workflow
and a company’s own core manufacturing competencies. Outsourcing in
105

106
Part Three: End-to-End Business Processes
manufacturing has really taken off in the electronics sector, with 40 per cent being
outsourced in 2000. Companies, like Cisco, recognize that their assembly operations
are non-core to their businesses, owning only two of its 40 factories.
Case study 9.4
British American Tobacco
British American Tobacco (BAT)
8
has its main manufacturing centre in Southampton, a
complex international supply chain and markets that vary a great deal in terms of volatility
of demand and range of product required. Their old spreadsheet-based planning system had
tended to operate high levels of inventory. BAT chose i2 software because of its Supply
Chain Planner (SCP) software suite, which runs in parallel with SAP R/3 at the Southampton
plant creating efficiencies in the manufacturing supply chain process. It allows BAT to model
changing market characteristics and deal with customer complexity and unforeseen
constraints in addition to improving customer service and reducing inventory levels.
FRONT-END SYSTEMS
9
Case study 9.5
IMI Norgren
IMI Norgren, the pneumatic controls manufacturer, uses a range of ERP systems at its
plants in Europe, the US and the Pacific. It has a turnover of £435 million and handles more
than 200,000 part numbers, with more than half of its shipments assembled to exact
customer specifications. When it decided to start selling over the Internet it committed itself
to integrating all its different back-end systems to one single Web front-end. Entegrity
Solutions developed a software exchange with an API that enabled it to connect to any
back-office system. It allows customers to track orders, account status and parts availability.
Overall cultural issues were the hardest with Marketing driving the project. The first pilot took
place in the UK within 14 weeks of starting work.
Case study 9.6
The Stralfors Group
The Stralfors Group, the Swedish integrator, has cut the cost of fulfilling supply requests by
up to half by implementing the TradeIT order handling system, but the company insists this
is only one of several benefits. It integrates a web front-end with a back-end ERP system.
It was installed in 1999 at its IT supplies division and estimates that it saves 10 per cent
on order handling via the Web compared to phone or fax, with customers making similar
savings. When customers link their e-procurement systems then costs can be slashed by
50 per cent for both parties. It lets customers control their employees’ purchases, improves

Supply/demand chain management
lead times and gives real-time information. Its back-end systems can return real-time order
confirmations to customers, plus details of delivery dates and costs; if goods are not in stock
it issues orders for replenishment. After one year the web-based system accounted for half
their order intake.
LOGISTICS
The challenge for logistics is to deliver the promise made to the customer and
allow customers to track deliveries while in progress, as has become the custom
with couriers such as DHL.
Case study 9.7
Ford
Ford
10
use UPS Logistics Group, who provide a variety of supply-chain management services.
UPS operates by looking at the client’s entire SC, acting as consultants to create a network
design that optimizes performance, and then manages the SC for a minimum of three years.
UPS manage all the finished vehicle delivery for Ford within the US. Along that supply chain
UPS collect the finished vehicles from the manufacturing sites, get information on stocks,
collect information and track the vehicle as it goes through the different modes of transport
to Ford’s 6,000 dealers, utilizing as much as possible real-time information about where each
vehicle is along the supply chain, not by shipment or railcar but by individual vehicle. This
makes rerouting of deliveries during the process possible. After a year of operating under the
new system, Ford announced a 26 per cent reduction in vehicle delivery times, $125 million
savings in annual inventory carrying costs, and $1 billion a year in inventory reductions. Not
surprisingly, Ford has now hired UPS to use the same web-based systems in Europe.
E-TAILING
According to McKinsey research, just 15 per cent of all websites accounted for 85
per cent of all revenues. The best companies’ websites made it easy to buy and
easy and secure to pay, with web pages downloading quickly and 95 per cent of
orders delivered on time. Tesco, Amazon and Wal-Mart are good examples of
companies who have learned how to attract prospects, convert them to customers
and then retain them. With e-commerce, companies only have one chance to win
and keep a customer. Research by PLAUT consultancy, exposed fundamental
flaws in the way in which e-commerce businesses handle the after-sales element of
the sales process, including both wholly inappropriate standard responses to
e-mail queries and incorrect amounts refunded when goods were returned.
11
107

108
Part Three: End-to-End Business Processes
PLAUT suggest that implementing all or some of the following recommendations
should improve the online customer service flaws highlighted in the study:
■
Give one person responsibility for the overall customer buying process and
value chain execution.
■
Ensure cultural and organizational alignment is focused on the customer.
■
Understand your systems and processes and ensure they work as efficiently as
possible.
■
Test and retest your systems extensively.
■
Clearly display cancellations and returns policies and adhere to them.
■
Aim to centralize all customer communication.
■
Communicate quickly.
■
Refund money promptly.
■
Make the cancellation and returns process simple.
■
Aspire to treat customers as individuals.
These points could equally be applied when trading through traditional channels.
Case study 9.8
Tesco
Tesco was the first of the UK supermarkets to offer Internet shopping in 1997. Tesco Direct
has 500,000 signed-up customers, covered half of the UK by 2000 and continues to be
rolled out at the rate of five additional stores a week. Turning over £250 million in 2002, it
has become the world’s leading Internet grocer. Maintaining customer access to the website
is crucial, so Tesco’s web servers operate in a load-balanced cluster and access the Internet
through a broadband link that is linked to sophisticated system monitoring. Unlike Sainsbury’s
who have built dedicated distribution depots and a separate infrastructure for the web
business, Tesco piggy-backs on the retail stores’ business for fulfilment purposes.
CONSUMER MARKETPLACES
Case study 9.9
eBay
eBay,
12
the original C2C auction site that went public in 1998, is expecting to turn over $3
billion by 2005 and has been profitable, unlike other online retailers, from a very early stage.
eBay does not hold inventory, move goods or transfer payments – the 15 million registered
users do most of the legwork, posting and haggling over about 4 million items for sale in

Supply/demand chain management
over 4,000 product categories. As the ultimate middleman and serving as facilitator, it has
successfully skirted the usual e-commerce pitfalls of procurement, merchandising, inventory
risk, order fulfilment and shipping. eBay does not police the transactions but believes in a
sense of community and is convinced that people are basically good and trustworthy.
Instead, buyers who are disgruntled can gripe about it on the Feedback Forum, which buyers
can check out before making a purchase. Interestingly, eBay does not run the typical banner
ads, only allowing advertising that enhances the core selling proposition.
eBay have now moved into B2B auctioneering, dubbed the Business Exchange, operating
a virtual trading floor where businesses can bid for office equipment, for example. They also
conduct fixed-price commodity sales for larger companies, using the site as a distribution
channel, and have formed alliances to create co-branded sites such as eBay Motors working
with AutoTrader.com, and eBay Real Estate with zipRealty.com.
Other organizations, seeing eBay’s success, are moving into B2C online auctions. In
1999 Dell, Microsoft and more than 100 other companies announced they have
linked their websites, along with 46 million users, to a new auction platform run by
FairMarket. In May 2000 Amazon.com reported it had increased the number of
items listed for auction or fixed price bid to 2 million. Even traditional retailers like
JC Penney have set up online operations to feature catalogue overstock merchandise.
They see auctions tying into their three-channel strategy for distribution: stores,
catalogues and the Internet.
109


10
E-procurement
Introduction
113
Procurement models
115
E-marketplaces
116
Open standards
121
■
■
■
■
111

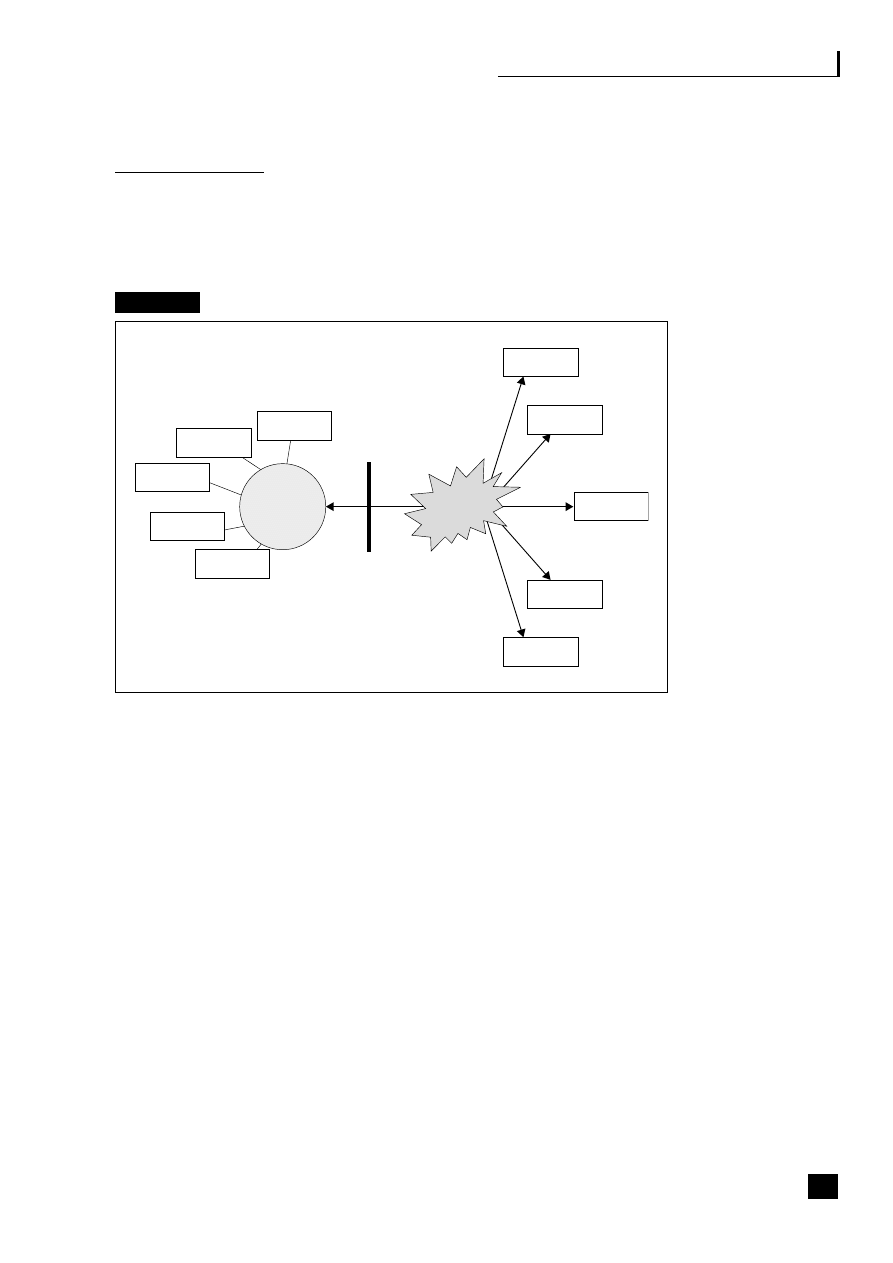
E-procurement
INTRODUCTION
E-procurement is the electronic acquisition of goods and services, which can
include any stage from identifying the needs for goods through to contract
management (see Figure 10.1).
Fig. 10.1
E-procurement
It works upstream in the S/DCM process and covers the five ‘rights’ of purchasing:
■
right price
■
right time
■
right quality
■
right quantity
■
right source.
Some large companies like Cisco, GE and Volkswagen are using advanced
e-procurement models.
1
When Microsoft adopted e-procurement the average
transaction cost was reported to drop from £145 to £5.
The tangible benefits of e-procurement can be assessed in three broad areas of
activity:
■
Transactional efficiency – the average processing time from requisition to dispatch
for indirect goods and services is 14 days. In the UK the average cost of a B2B
purchase is £80 and in the US it is £102. Using e-procurement transaction costs
are reduced by up to 80 per cent and processing time cut from days to hours.
113
Product/price
listing
Firewall
Purchase item
details
ERP
Purchase
order
Buyer
Supplier
Supplier
Supplier
Supplier
Supplier
Internet
Enterprise

114
Part Three: End-to-End Business Processes
■
Supply market management – stocks are managed more effectively,
collaborative planning and execution across the whole value chain is enabled,
quality information is available, there is greater focus on strategic sourcing and
aggregation of small orders is possible.
■
Supply chain restructuring – processes can be streamlined, restructuring of B2B
relationships through consortia and trading communities and alliances.
The business case for e-procurement, according to PwC Consulting,
2
usually includes
savings of up to 15 per cent from contract compliance, with further sums from
supplier leverage, improved S/DC visibility and cutting order processing costs.
The benefits of e-procurement are summarized by Turban et al. as:
3
■
reduced purchasing cycle time and cost;
■
enhanced budgetary control (achieved through rules to limit spending and
improved reporting facilities);
■
elimination of administrative errors (correcting errors is traditionally a major
part of a buyer’s workload);
■
increasing buyer’s productivity (enabling concentration on strategic purchasing);
■
lowering prices through product standardization and consolidation of buys;
■
improving information management (better access to prices from alternative
suppliers and summaries of spending);
■
improving the payment process.
Payback
Case study 10.1
Credit Suisse First Boston
Credit Suisse First Boston (CSFB)
4
went live with the Peoplesoft e-procurement module as
part of an ERP installation in 2001 across 850 business units responsible for a spend of
over £1.9 billion. It has given the company’s 10,000 purchasing users a much clearer
picture of the supply chain, lowered costs and reduced headcount. CSFB are on target to
achieve savings of £23.9 million over the first three years and the bank is likely to exceed
an initial ROI of 277 per cent with cost per transaction dropping from £170 to £34 while
the electronic catalogue has saved around £13.6 million. CSFB said:
Before we couldn’t identify what we had spent our money on and multiple systems and
processes were costly to manage.

E-procurement
Case study 10.2
AstraZeneca
AstraZeneca,
5
the pharmaceutical company, is aiming to cut at least £600 million a year
from its purchasing bill by using electronic procurement. The UK operation is set to be the
first to use it by the end of 2002. The Ariba spend management suite has been selected;
the sourcing module will allow the company to negotiate better contracts with suppliers and
the procurement module will physically do the buying transactions. It will be used for the
purchase of indirect goods, including R&D equipment, which currently account for over £4
billion annual spend. A company senior manager said:
Experience has shown that a conservative view [of savings] looks at 10 per cent and in
the longer term up to 20 per cent would not be unreasonable.
Case study 10.3
Rolls Royce
Rolls Royce,
6
the £63 billion UK aircraft manufacturer, found that 90 per cent of parts
represent only 1 per cent of value and little attention was paid to them. However, neglecting
this area resulted in these parts often being out of stock or in over-supply, causing havoc
for assembly lines and warehouses. The solution was to hand over in 2000 the
management of its entire small parts inventory to supply chain specialist, Umeco, under an
11-year deal, leaving in-house to concentrate on the high-value, low-volume items. Umeco
has hit its service level targets, providing complete availability of all components at every
Rolls-Royce site, a 40 per cent improvement. Other inventory management firms include
Exel and Tibbett & Britten.
PROCUREMENT MODELS
Purchases fall into two broad categories:
■
production-related procurement, including raw materials for production and
maintenance, repairs and operations (MRO) of manufacturing facilities;
■
non-production related procurement such as catering, travel, training, office
supplies and furniture.
There are two main methods of purchase:
■
systematic sourcing – negotiated contracts with regular suppliers;
■
spot sourcing – generally fulfilling an immediate need for commodity items.
115

116
Part Three: End-to-End Business Processes
There are three models of approach to links with suppliers:
■
Buy side. A many-to-one trade transacted via the buyer’s website, who has
responsibility for maintaining data:
– Internal only – where staff buy from the online catalogues of preferred
suppliers. Here internal efficiencies, such as eliminating maverick buying from
unapproved suppliers and reduced paperwork through automated procurement
process, can be realized.
– Shared – where suppliers monitor buyers’ inventories and replenish them as
required. Here automated e-procurement modules or ERP is beneficial.
Partners must have a good partnership relationship and trust one another.
Case study 10.4
The Halifax
The Halifax has an e-procurement website integrated into its core procurement system to
provide E2E ‘req-to-cheque’ functionality that handles invoice matching and payment. In
building relationships with suppliers the Halifax recognizes that the rules and information
requirements are different for each supplier to maximize cost reductions and improved
services. The Halifax is developing a set of collaborative commerce portals to address the
specific procurement requirements of each supplier, with XML documents being transmitted.
■
Sell side. A one-to-many trading relationship carried out via the supplier’s
website, with the supplier having responsibility for maintaining data. It requires
the supplier to operate a different interface for each customer website. This
approach is widely used by B2B auction sites and supplier B2B catalogues or
clearing houses. Here companies like DoveBid and Equipp conduct auctions
online. Other sell-side technologies are providing improved customer service
and cost efficiency.
■
E-market. A many-to-many trading relationship with multiple buyers and sellers
brought together by an online intermediary. Alternative terms are electronic
marketplaces, e-markets, net markets, trading portals and trading hubs (see next
section).
E-MARKETPLACES
Introduction
Digital marketplaces bring buyers and sellers together globally in online marketplaces
that allow companies to exchange information, source products and services and
execute online transactions, through online catalogues, hubs and auctions. Many
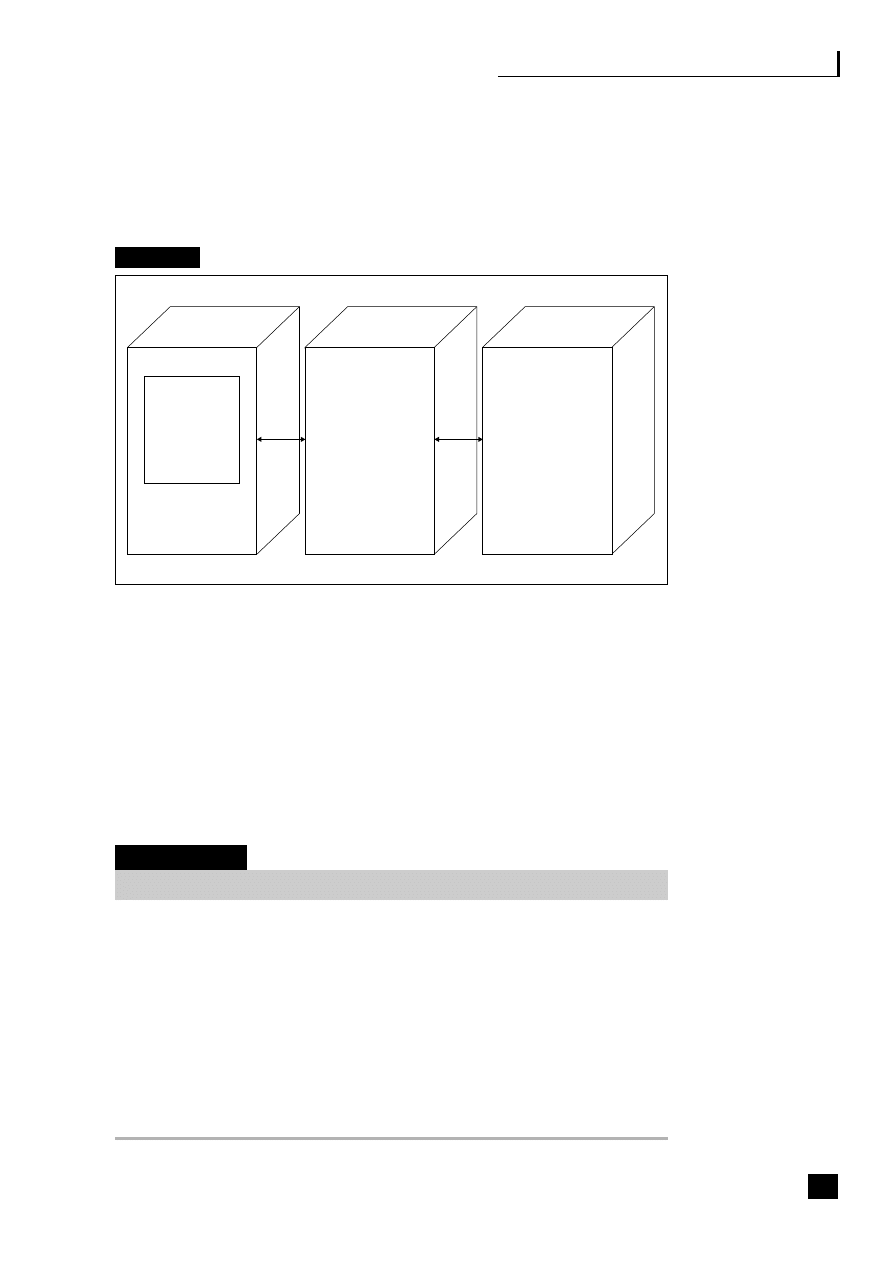
E-procurement
offer additional services and are known as metamediaries. Others use intelligent
software agents that assist in performing tasks, e.g. the Building-Site.com, who use
Exterprise Activemarket to match online buyers to sellers. (see Figure 10.2).
Fig. 10.2
The e-marketplace
There are three main types of B2B exchanges.
Private trading exchanges
Private trading exchanges (PTX) are owned and run by one company to manage its
own trading-partner relationships. Examples include Cisco, Dell and Volkswagen,
who have led the way in S/DCM. These form a one-to-many network, not to be
confused with old-style EDI where the technical barriers for participation made it
only accessible to very large organizations.
Case study 10.5
Hewlett-Packard
Hewlett-Packard (HP)
7
decided in 2000 to increase the efficiency of its direct materials
procurement by moving to a private e-marketplace, utilizing i2 software Supply Chain
Collaboration as the basis for forecasting and inventory collaboration. Its goal was to put 80
per cent of its procurement process on the Internet by 2004 and to measure the benefits
of doing that along the way. HP had 83 product organizations and supply chains and a
culture of real autonomy. Decentralization needed addressing because each development
undertaken by a different division had not been well leveraged from one division to another.
On average in the first year it has made a 10 per cent saving in material sourcing costs and
increased the amount it makes from being able to sell off excess inventory to around 80–90
per cent.
117
Buyers
E-marketplace
Suppliers
Consortium:
■
Founder
members
■
New
members
■
Major suppliers
■
Niche suppliers
■
Others
Others
Standard services:
Joining
fees
Annual
subscriptions
Transaction
fees
Auction
commissions
Added value services:
Advertising
Contract
management
Inventory
management
Logistics
management
Intelligence
Content
management

118
Part Three: End-to-End Business Processes
Case study 10.6
Cisco Systems
Cisco Systems’ e-Hub links 2,000 supply chain partners and includes software tools for
improving planning and event management. Phase II covers planning optimization using
Manugistics software tools, which will provide greater flexibility for managing constraints
within its contract manufacturing base and speed response to supply chain problems. Phase
III will bring design collaboration across the e-Hub in 2002.
Case study 10.7
General Electric
General Electric
8
has extended e-procurement activity to direct purchasing. For this it created
its own global supplier network which links 1,500 corporate buyers to 16,000 suppliers. Over
the first 19 months 20,000 e-auctions worth $16 billion were completed through this route.
The system is used for buying everything from travel, IT and photocopying to direct purchases
like aircraft engine components. GE offer the following tips to achieve benefits:
– Preparation is key.
– Train both suppliers and buyers.
– Use dummy practice events to improve confidence in using the tools.
– Keep auctions simple; limit the number of line items involved.
– Use different auction formats and select the most appropriate for each event.
– Treat your suppliers ethically – e-auctions should be ‘squeaky clean’.
– Manage the auction process during the event.
– Manage post-event activity.
Independent exchanges
Independent exchanges are many-to-many network, which can be either vertical
or horizontal.
Vertical (IVX)
An IVX connects many buyers to many sellers in a vertical market segment, often
offering services for smaller companies as a type of ASP-plus value-added model
and manufacturing input marketplaces for a particular industry sector. Examples:
■
Build-on-line is aimed at the European construction industry. It allows the
buying and selling of materials and services, while supplier catalogues and
project management tools for joint projects can be obtained. Industry news is
available and subscribers are able to chat with others in the industry.

E-procurement
■
Constructeo, in the construction industry, offers project management and
planning tools for very specific customer niches. It already manages 24 projects,
offers four supplier catalogues and runs online auctions.
■
elogistics is an example of the UK freighting services industry.
■
Band-X, launched in 1997, works with telecoms, ISPs and large corporates to
trade bandwidth-telephone capacity. It enables unwanted IP capacity to be
traded in real time.
Horizontal (IHX)
An IHX connects buyers and sellers in any industry. Often MRO and non-production
items (NPI) are sold in this way. Examples:
■
E-Exchange for procuring hi-tech equipment.
■
Infobank for goods, including IT and stationery supplies. It is used by National
Power, for example, which has reduced its average purchasing cost per item on
office supplies from £50 to £10.
Consortium trading exchange
A consortium trading exchange (CTX) brings together major industry players who
are seeking to reduce transaction and product costs and speed up the delivery chain.
Care must be taken that cooperation does not lead to the setting up of a cartel. Most
of the major industry consortiums have now been established. Examples:
■
Transora was launched in 2000 for the food industry, representing 40 per cent
of the global consumer products industry including Unilever, Kraft, Kellogg and
Coca-Cola.
■
Covisint covers the motor industry, including Ford, Daimler Chrysler and General
Motors, where groups and companies bid for materials and services.
■
Metalspectrum, with 20 backers, is one of half a dozen established e-marketplaces
for the metal industry.
■
Chemconnect is one of half a dozen sites in the chemicals industry.
■
Eutilia covers the utilities sector.
■
IdeaMarketplace covers local government.
Hybrids are also developing where companies are using public e-marketplaces for
purposes such as searching for new suppliers, comparing prices and sitting in on
auctions. Some are able to offer a private negotiation room and keep their
communications, negotiations and transactions private. Others are offering added
value services including certification, credit approval, decision support, performance
tracking and acting as financial clearing houses.
119

120
Part Three: End-to-End Business Processes
According to Datamonitor about a third of these large-company, collaborative
exchanges have been consigned to history.
9
Collaboration between competitors in
some industries has proved rather more elusive than first predicted. Instead larger
companies have switched focus to portals and private marketplaces, which can be
more customized and focused on achieving competitive advantage, with some seeing
the benefits of continued links to public marketplaces as well. Public exchanges are
switching some of their focus to providing value-added services, particularly to SMEs.
Some of the reasons for the high failure rate include:
■
the reluctance to collaborate with competitors because of issues such as the
ability to differentiate products;
■
the discovery by participants that collaboration is as much about people and
changing business processes as it is about technology. Change is hard enough
to achieve on a one-to-one level but when you have process realignment by
committee across companies then it can be very difficult;
■
the realization that the culture of the particular industry is an important factor
in success or failure;
■
the recognition that the trading exchange activity cannot exist as a point
solution but has to be integrated with ERP as an extension of the back office;
■
the costs of public marketplaces charged out through membership and
transaction fees passed on to users was seen as too high in some industries;
■
the time taken to establish and the funds needed were greater than originally
estimated.
Marketplace features for buyers include:
■
knowing what the best price is;
■
which supplier has products available for delivery;
■
who else makes the product/service or a suitable substitute;
■
competitive online auctions (reverse auctions) between suppliers which reduces
prices;
■
convenience and transaction timeliness;
■
one-stop-shopping experience;
■
reduced transaction costs, particularly when hubs integrate sourcing,
purchasing and billing;
■
management of capacity utilization, increases in inventory turns and
optimization of cashflow;
■
more control over procurement process;
■
more visibility of the supply chain;
■
ability to monitor performance of different suppliers.

E-procurement
Marketplace features for sellers include:
■
reduction in the cost of acquiring new customers;
■
the need to provide an electronic catalogue;
■
reverse auctions which are useful to sell obsolete stock;
■
convenience and transaction timeliness;
■
aggregation of small orders;
■
management of capacity utilization, increases in inventory turns and optimization
of cashflow;
■
reduced transaction costs when hubs integrate sourcing, purchasing and billing;
■
increases in the accuracy of order taking;
■
use of digital audit trails to profile customers and customize marketing
programmes;
■
allowing smaller players to compete with larger ones;
■
easier comparison of competitors’ products and prices;
■
creation of opportunities to collaborate.
OPEN STANDARDS
Buyers are keen to use open, global standards in the automated e-procurement space,
in order to standardize content and allow freedom of supply. The Electronic
Commerce Code Management Association (ECCMA) launched its attribute table, the
Electronic International Attribute Code (EIAC), which defines the characteristics of a
commodity, enabling users to search the Web to source every supplier who produces
that product providing they are using the common code. To do this ECCMA is
working with Universal Standard Product and Services Classification (UNSPSC), a
global coding system that classifies products and services, supported by major vendors
like SAP, Oracle, Ariba and i2. Open standards increase interoperability between
systems as well as interconnectivity because everyone is exchanging consistent,
standardized content. As a non-profit-making organization it issues everything free
over the Internet, without copyright over the codes or licence fees.
Case study 10.8
Unilever’s NPI Initiative
10
Background
Anglo-Dutch Unilever is one of the world’s largest companies with a turnover of
€47.6 billion.
It is a global consumer goods business created over 70 years ago with many well-known
foods and home and personal care brands purchased by 150 million people each day. In
121

122
Part Three: End-to-End Business Processes
2000 it announced a major growth and brand rationalization programme setting out
ambitious performance targets for the coming years.
Unilever’s supply savings programme is one of the cornerstones of its Path to Growth
Strategy towards the implementation of a world-class supply chain:
Unilever’s ‘Path to Growth Strategy’
■
Reconnect with the consumer – to anticipate the future.
■
Focus the brand portfolio – reflecting consumer appeal and growth potential.
■
Pioneer new channels – to be in the right place at the right time.
■
Develop a world-class supply chain – simplifying sourcing, manufacture, marketing.
■
Simplify the business – reducing complexity.
■
Build an enterprise culture – towards a single-minded passion for winning.
This initiative is expected to contribute substantial savings through effective leverage of size
and scale enhanced by common business processes and simplification of complexity. In a
similar way to the buying of many production items, Unilever has equally recognized the
importance of implementing a global supply management programme focused on reducing
non-production items (NPI).
Strategic sourcing
The NPI organization model being implemented in both Europe and North America (which
will be extended to the rest of the world) is founded on clear cross-business governance and
effective executive buying. Strategic sourcing is being supported by the global roll-out of
e-procurement and participation in some key exchanges, particularly in Transora, where an
equity stake is held. Regional and a few global NPI cluster teams have been formed which
are undertaking a rigorous methodology to deliver the strategic sourcing strategies and
implementation plans required to achieve the targeted savings.
Historically the majority of NPIs have been purchased locally, although there has been an
increased move towards national and, in a few instances, transnational negotiations.
European and to some extent global supply markets are becoming well established, enabled
in many instances through e-procurement. In such areas as IT hardware and software, travel
and accommodation, energy, logistics and fleet management, European and in some cases
global supply markets and suppliers already exist. European markets are also emerging for
office facilities, telecommunications, marketing point-of-sale items and technical supplies.
E-procurement
Unilever meets two of the key corporate strategic thrusts – World-class supply chain and
Simplification – by implementing NPI strategic sourcing and e-procurement enablement.
These are two of the six thrusts for the implementation of world-class supply management:
■
Implement executive buying.
■
Attract, develop and retain world-class buyers.
■
Professionalize NPI sourcing.
■
Enable e-procurement globally.
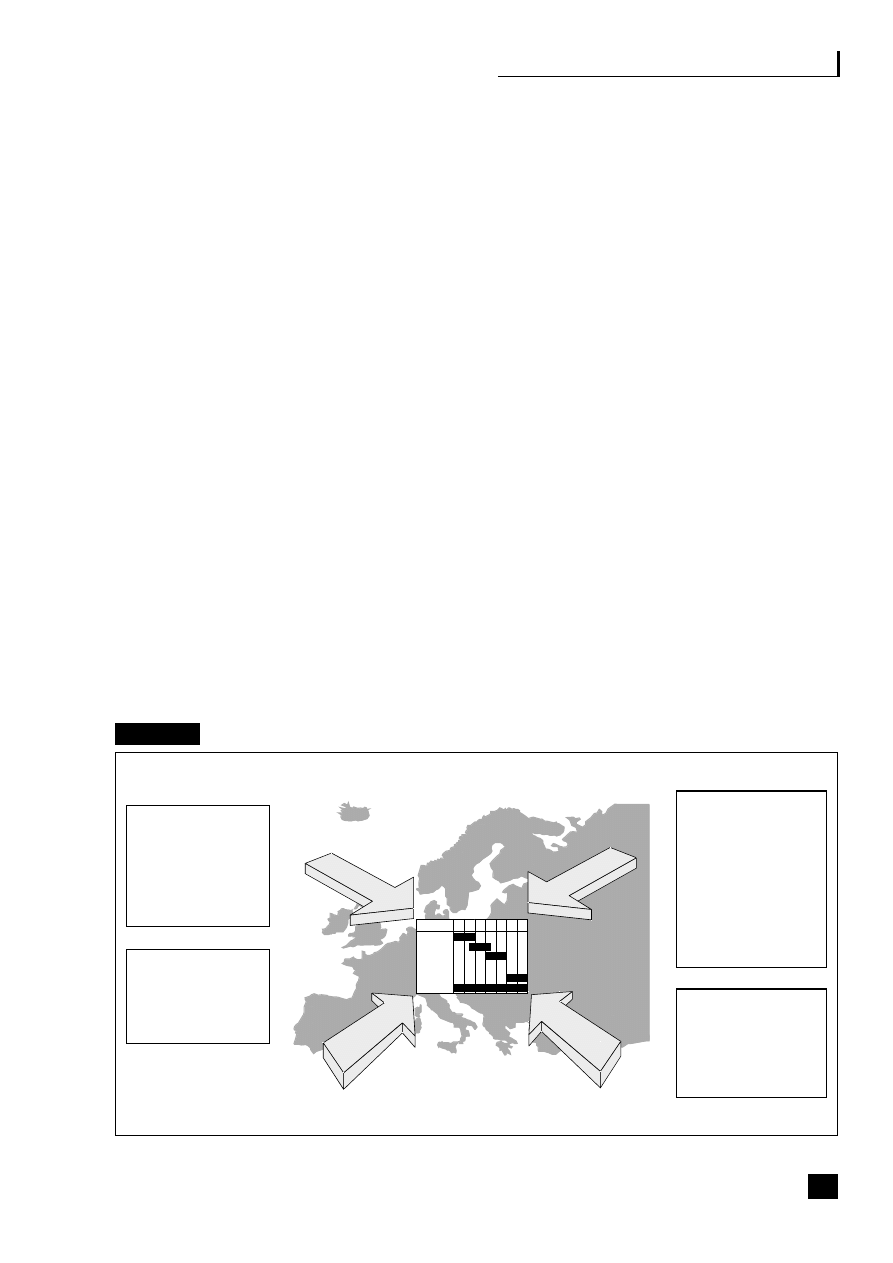
E-procurement
■
Accelerate and leverage simplification.
■
Drive information and measurement.
Aggregation of demand and access to new suppliers through real-time partnership will enable
Unilever to improve efficiencies of the extended supply chain. Workflow automation will help
simplification of the internal processes, which will create scale for Unilever to leverage. For
Unilever e-procurement represents the opportunity to sustain the benefits gained from
strategic sourcing through information, compliance and business process simplification.
There are four ways of defining the benefits of e-procurement:
■
It is a structural enabler for re-engineering the NPI procurement process, enabling further
benefits to be gained through strategic sourcing, business simplification, visibility of total
spend and effective integration routes both internally, e.g. ERP, and externally.
■
It is the means for conducting electronic business upstream using lowest cost links, i.e.
cXML.
■
It is a business model prompting re-evaluation of the mechanisms for connecting
customers, enterprises and suppliers (including exchanges and marketplaces).
■
It is a single front-end interface both externally to suppliers and internally for ERP and
other areas of integration.
Strategic sourcing savings opportunities and perceived e-procurement readiness are among
the key criteria applied for prioritizing and scheduling global roll-outs. The other drivers are
ease of implementation, infrastructure capabilities, the availability of suppliers and their
ability to manage interfaces with the business and, where required, with B2B exchanges
(see Figure 10.3).
Fig. 10.3
Unilever – regional roll-out
123
Wave 0
1 2 3 4 1 2 3
Wave 1
Wave 2
…
Wave n
NPI cluster alignment
to Ariba
■
Cataloguable
■
High volume/low
value
transaction
profile
Regional
Deployment
Plan
Savings opportunities
■
Spend profile
■
Savings targets
■
Process efficiency
Ease of
implementation
■
Process and systems
integration
■
Supplier readiness
■
Business rules, tax
and legal, language
■
Business group/
operating
company
readiness
Ariba solution
■
Ariba feature
functionality
■
Unilever systems
capabilities
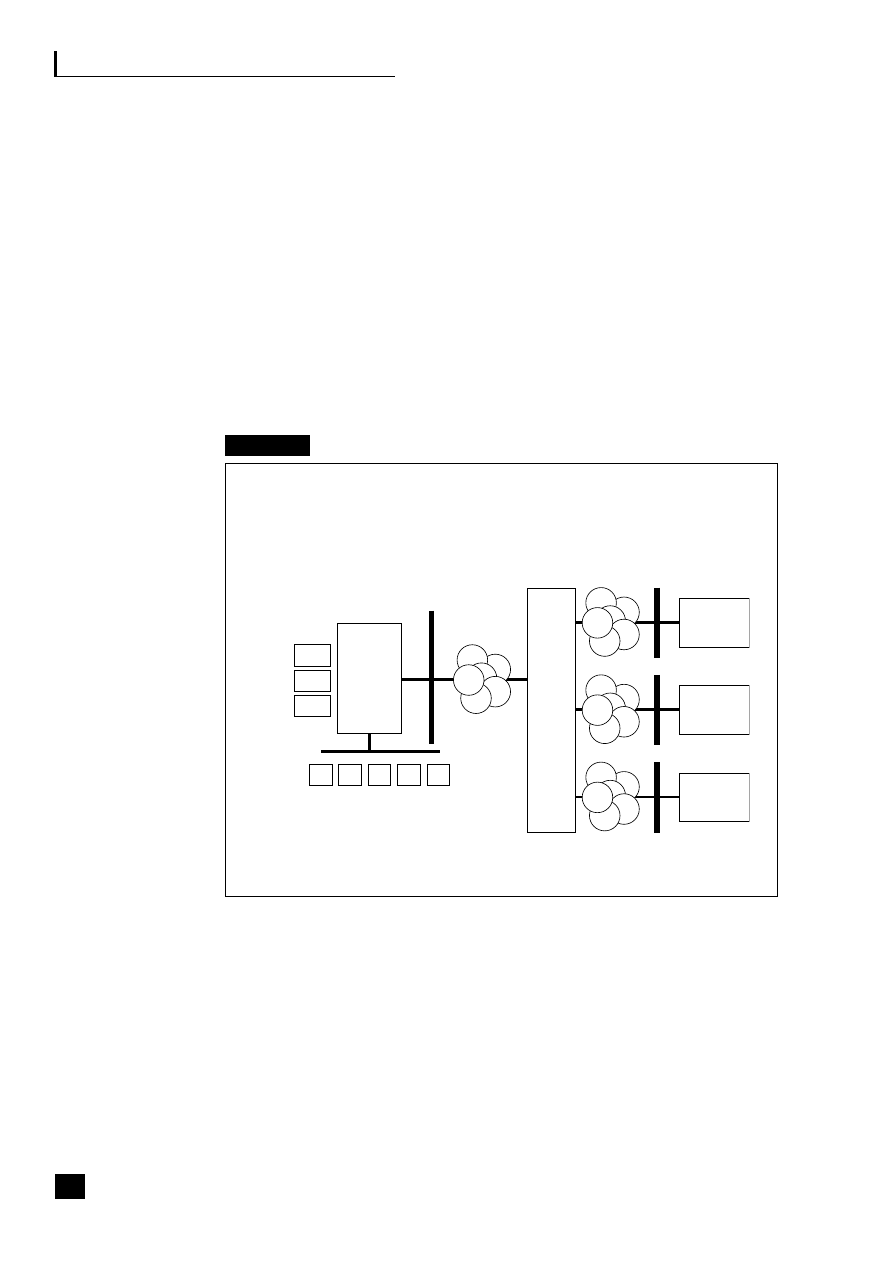
124
Part Three: End-to-End Business Processes
Strategically e-procurement complements Unilever’s overall e-initiatives. Learning from these
and the strategic sourcing expertise gained during implementation will improve business
ability for the future e-procurement of both NPI and direct materials. Workflow automation
and simplification of global sourcing processes will result in increased productivity and
reduction of transaction costs. Data made available can then be applied to harmonize items
purchased, rationalize needs with suppliers, and monitor and reduce usage, thus further
increasing Unilever’s buying opportunities.
Selection and implementation of Ariba software
Unilever selected the Ariba Buyer software for e-procurement following a rigorous selection
process and initial pilot in North America. Through Ariba, Unilever hopes to achieve cost
savings, scalability and integration benefits (see Figure 10.4).
Fig. 10.4
Unilever – one global installation
ERP 1
ERP 2
HRMS
End-user buyers
Ariba
Buyer
7
The Ariba Buyer application is scalable because it runs on one global server and is network
centric. New users and/or suppliers can be added without problems.
Firewall
Firewall
Firewall
Firewall
Internet
Internet
Supplier A
Internet
Supplier B
Internet
Supplier C
A
C
S
N

E-procurement
However, of equal importance is the achievement of benefits to all the key players (see
Figures 10.5 and 10.6).
Fig. 10.5
Unilever – supply chain benefits
Fig.10.6
Unilever – Ariba CSN benefits
125
Value for employees
■
Simplifies order creation/
status
online
■
Reduces resources devoted to
transaction-based
procurement
■
Automates payment
authorization/settlement
■
Facilitates demand management/
supplier quality and performance
management
■
Provides actionable information
on
spending
■
Provides sourcing and
negotiation
assistance
Value for suppliers
■
Provides access to new channel
■
Reduces costs associated with
sales, servicing, order entry
and
marketing
■
May reduce order-to-cash cycle
■
Provides customers with an
easy-to-use purchasing process
■
Potentially creates additional
business
volume
■
Strengthens
existing
relationships
■
Creates image
of market leader
■
Enables lower
cost
procurement
processing
■
Leverages other
electronic
offerings
Value for Unilever
■
Provides access to
new
channel
■
Lowers logistics
servicing
costs
through
electronic
integration
■
Deepens relationships
■
Provides participation
in a full sourcing value
chain
offering
Value for alliance partners
Supplies
Catalogue distribution
Suppliers leverage catalogues by
making them available to a large
pool of buyers. It is a cost-effective
method of providing catalogue
access to a wide audience.
Greater transaction volume
As the single purchasing system,
contracts will be leveraged to a
much greater degree.
Catalogue pre-validation
Ariba Network automatically
validates the format and syntax of
the catalogue files and alerts the
supplier so that errors can be fixed.
Automatic purchase order routing
Ariba Network automatically routes
purchase orders to the supplier’s
preferred ordering method.
Order status tracking
Customers can track order status
on Ariba Network with periodic
updates from the supplier. It provides
real-time status of each order, which
increases confidence.
Business automation
Automating the purchase-order and
change-order receiving process leads
to cost reductions. It eliminates
unnecessary steps and processing of
manual transactions.
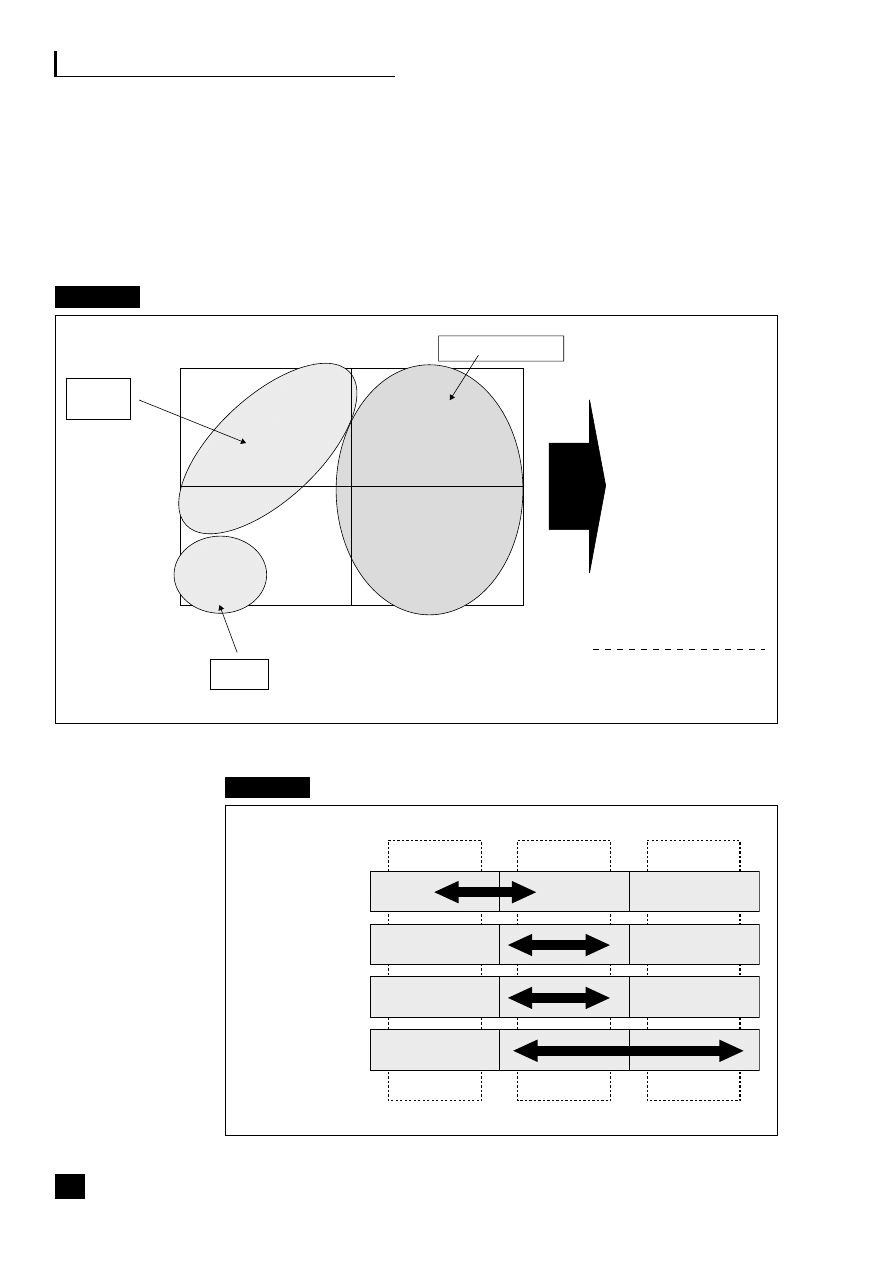
126
Part Three: End-to-End Business Processes
Following the successful pilot, which involved a range of categories and suppliers with
training for around 200 users, Unilever decided in early 2001 to commence the rolling out
of Ariba across its two largest markets, Europe and North America. This is expected to take
at least three years by the end of which at least 30 per cent of total NPI spend should be
via e-procurement (see Figure 10.7 and 10.8).
Fig. 10.8
Unilever – sample use of catalogue types
Fig. 10.7
Unilever – applicability for e-procurement implementation
■
Promotional items
■
Travel
■
Accommodation
■
Temporary staff
■
Couriers
■
Utilities
■
Logistics
■
Furniture
■
Vending machines
■
Mobile phones
■
Systems
and desktop
software
■
Car rental
■
IT hardware
■
Ice cream cabinets
■
Laboratory
supplies
■
Office
supplies
■
MRO
■
Point of sales
Highly cataloguable
Difficult to
catalogue
Potential
commodities
for punch-out
Transaction volume
Commodity standardization
High
Low
High
Low
MRO
Office supplies
Point of sales
Laboratory supplies
Promotional items
Ice cream cabinets
Mobile phones
IT hardware
IT systems software
Vending machines
Furniture
Travel
Accommodation
Temporary staff
Couriers
Car rental
Others
Utilities
Logistics
A
B
C
D
➜
➜
➜
➜
➜
➜
➜
➜
➜
➜
➜
➜
➜
➜
➜
➜
➜
➜
➜
Internal
Small set
of SKUs
Punch-out
Large and
volatile catalogue
Aggregator
or market
Multiple
suppliers
Office supplies
Laboratory supplies
Hardware and software
MRO
Typical application
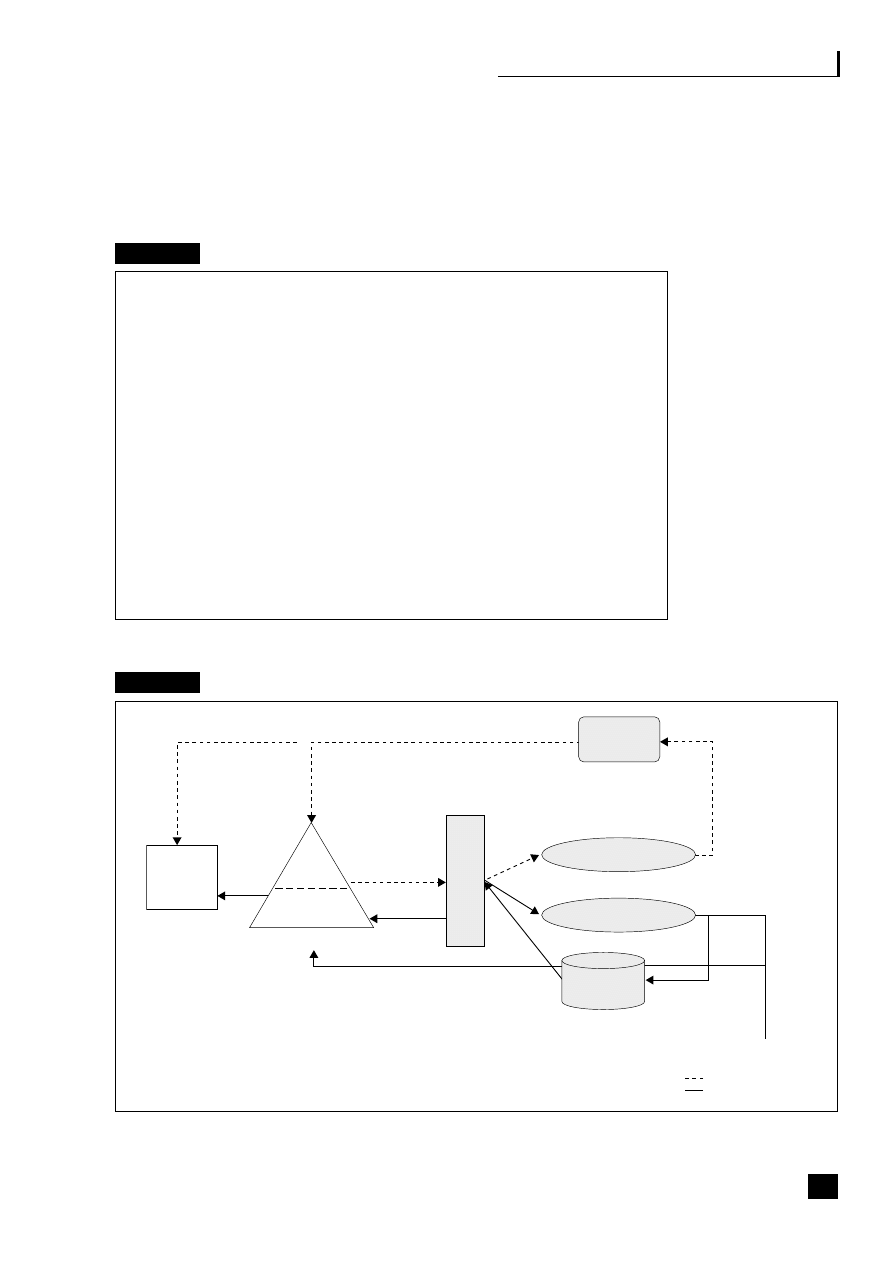
E-procurement
E-invoicing and e-payments
In addition to the procure-to-receipt process, reconciliation will also be undertaken leading
to e-invoicing (see Figures 10.9 and 10.10).
Fig. 10.9
Unilever – e-payments overview of benefits
Fig. 10.10
Unilever – e-payments process flow
127
■
What do we mean by e-payments?
– Use
of
purchasing cards (p-cards) as a means of payment and invoicing
– Use
of
electronic invoicing (e-invoicing), i.e. ‘issuing’ of invoices in any electronic
medium, e.g. e-mail, EDI, cXML
■
What are our objectives?
– Increased process efficiencies and savings due to less manual intervention
– Reduction in the flow of paper around the organization
– Ability to reconcile all purchases, receipts and invoices automatically
– Improved payment capabilities and supplier relations, i.e. ability to leverage
supplier discounts due to prompt payments
– Integration with Ariba e-procurement to provide a complete procure-to-pay
process
Long-term goal
To have a completely electronic and paperless invoicing
and archiving process across Europe (and rest of world)
Direct load to ERP
for payment and
posting
Load into Ariba for
Level 3 to Level 2
conversion process
PO and accounting
details
Level 3 p-card statement
ERP
AP & GL
Ariba buyer
L2
L3
P-card order
cXML invoice
cXML file
Electronic invoice
(cXML, EDIFACT,
Excel)
Key:
P-card
flow
e-invoice
flow
Paper
invoice
P-card supplier
Direct order supplier
Entered via
invoice e-form
L2 – Level 2 reconciliation
L3 – Level 3 reconciliation
ERP
file
Direct order
A
C
S
N
Invoice
translation
tool
P-card bank
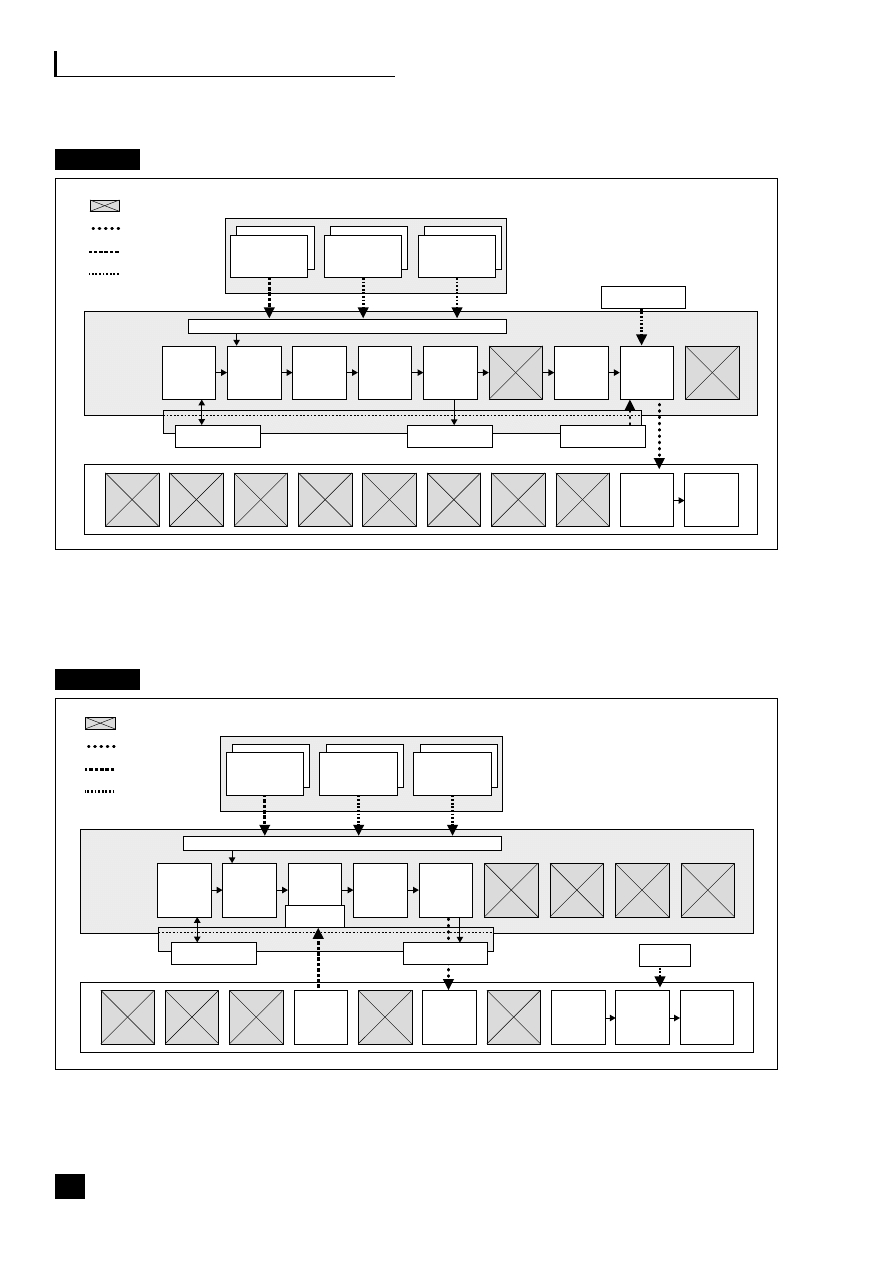
128
Part Three: End-to-End Business Processes
ERP integration will ensure a seamless E2E process for purchasing capital and impress
items as well as the direct input of employee and cost centre information enabling rapid
user uptake (see Figures 10.11 and 10.12).
Fig. 10.11
Unilever – catalogue items with e-payment flow chart
Fig. 10.12
Unilever – commitment buy with ERP reconciliation
MRDR/
SAP
Other
accounting
data
Select
item in
Ariba
Create
requisition
Obtain
approval
Create
PO
Output
Goods
receipt
Payment
Relevant procurement scenarios
■
Office supplies
■
et al.
No
catalogue
selection
Select
item
Create
requisition
Obtain
approval
Create
PO
Output
Order
confir-
mation
Goods
receipt
Accounting
GL
Payment
HR data
Order
confir-
mation
Data tables
Not enabled process
Push feed
Validation/data pull
Manual
Ariba ACSN
ARIBA
ERP
Electronic catalogue
Electronic order
P-card statement
Electronic invoice
Reconcile
Summary
invoice
ghost p-card
MRDR/
SAP
Other
accounting
data
Select
item in
Ariba
Create
requisition
Obtain
approval
Create
PO
Output
Payment
Relevant procurement scenarios
■
IT equipment
■
Equipment/MRO/capital
No
catalogue
selection
Select
item
Create
requisition
Project
budget
commit
Obtain
approval
Create
cc PO
Output
Goods
receipt
Reconcile
and
account
Payment
HR data
Order
confir-
mation
Data tables
Not enabled process
Push feed
Validation/data pull
Manual
Ariba ACSN
ARIBA
ERP
Electronic catalogue
Budget
Invoice
Reconcile
Goods
receipt
Electronic order

E-procurement
In North America a Competence Centre (GACE: Global Ariba Centre of Excellence) has been
set up to deliver consistent implementation through the application of a common toolkit and
methodology. Within Europe an Ariba Academy concept has been introduced to provide
multiple site implementations and the facilitation of training (including web-based training)
and post-implementation support.
Components critical for project success
Although initial success has been achieved Unilever believes that these are still early days
and that the return on investment has still to be proven. While e-procurement is an
inevitability for future supply chain optimization the supply market, particularly in Europe, is
still suffering from underdevelopment. There is an emerging recognition that e-procurement
can affect total supply chain operation rather than just transactional activity. Until recently
few have taken action to implement or sponsor the necessary changes. Encouragingly,
however, Unilever believes that this position is changing and unquestionably e-procurement
provides a catalyst for positive improvement in supply management profile.
Getting started with e-procurement requires five components to be in place that are
critical to project success:
■
The project must be set up for success as a procurement change management project
and not as an exercise in implementing a new software solution.
■
There must be a clearly defined, realistic and compelling business case.
■
High-level sponsorship is required within the organization.
■
The resources and capability to get started and then to sustain the project must be
available.
■
An effective progress monitoring system and agreed, relevant key performance indicators
(KPIs) must be set up.
129


11
Customer relationship
management and e-marketing
Introduction
133
Customer relationship management
133
CRM automation
136
Key benefits of CRM
139
Pointers to CRM success
140
E-marketing
141
■
■
■
■
■
■
131


Customer relationship management and e-marketing
INTRODUCTION
Customer relationship management (CRM) is about transforming an organization
to become customer-centric and customer-facing in all that it does. Front-office
systems are fundamentally different to the disciplined, process-based back office in
terms of how information is tracked and its user base. It is about a change in culture
that switches the emphasis of, for example, fulfilment from looking inwardly at
what suits manufacturing and the supply chain to satisfying the company’s external
promises about service and delivery.
Successful CRM is about giving the customer a better experience, hence
enhancing the company’s chances of retaining the lifetime value of that customer
and acquiring new customers. Internet grocery sales to shoppers, who had been
using their favourite sites for more than three years were 75 per cent higher than
sales to new shoppers. Where CRM is linked to powerful analysis tools it provides
the ability to monitor and understand customer activity to a far greater depth than
previously possible, enabling a quick reaction to changes in markets and a
consistent high standard of customer service.
In theory, the Web is the best friend a CRM manager ever had. Internally, it is the
ideal tool to tie together the disparate, product-based systems that contain customer
data. Externally, it can provide all customers with a similar and consistent
experience, whatever products they buy. Integration of CRM with ERP and SCM is
critical to success, especially supporting systems such as order fulfilment, logistics,
inventory management and EBPP. The aim is to give the customer a seamless
experience. The goal of integrated CRM is to understand who the most profitable
customers are – essential for online and offline business success.
CUSTOMER RELATIONSHIP MANAGEMENT
The growth of spam, i.e. unsolicited mail, banner adverts and other unwanted
messages from retailers known as interruption marketing, has grown to such a level
that the messages have become ineffective from the point of view of successfully
reaching the potential customer. Permission marketing is seen as the answer to this
problem. Permission marketing is about seeking agreement from customers to be
involved in marketing activities. The process of persuading the customer to ‘opt-in’
is usually successful when an incentive is offered, e.g. in B2B it could be a report and
in B2C it may be a screensaver. Payment for viewing advertisements has even been
seen. The process of offering incentives usually continues through the relationship.
It is this concept that has led to the growth in CRM.
The process can be split into three stages as discussed below and involves both
online and offline techniques.
1
133

134
Part Three: End-to-End Business Processes
Customer acquisition
There is a range of techniques to attract people to use e-commerce services, either
as new customers or as converts from more traditional channels. For example,
American Express developed its ‘Go Paperless’ campaign to persuade customers
to receive and review their statements online.
Marketing communications
Online:
■
Search engines and directories – the important factor here is the use of metatags
on the site, which are key words that the search engines look for.
■
Building links – for example, reciprocal, PR content, affiliate networks,
sponsorship.
■
Viral marketing – a method of reaching people in the same way as viruses – by
being passed on by a friend.
■
Banner advertising – appearing on other sites which, when clicked, transport
the potential customer to the advertiser’s site.
■
Cookies – small text files stored on an end-user’s computer to enable websites
to identify them – tagging.
Offline:
■
Print – catalogues, point of sale, direct mail, magazines, newspapers.
■
TV and radio.
■
PR and word of mouth – trade shows, sponsorship.
Customer profile
Once attracted to the site, it is then necessary to build up information about the
customer regarding such details as product interest and demographics to facilitate
segmentation and potential profitability.
Customer retention
Since satisfaction drives loyalty and loyalty drives profitability then once acquired
it is necessary to work on retaining the customer.
Personalization and mass customization
Pesonalization refers to the customizing of information requested by a customer
at an individual level while mass customization is the same process aimed at a
group of customers with the same interests. This is one area where technology

Customer relationship management and e-marketing
enables communications of this type to be targeted and effective. The method and
frequency of delivery are also important even to the opted-in customer.
Localization
2
According to eMarketeer, at the end of 1999, 96 per cent of all e-commerce sites
were written in English, while linguists report that just 6 per cent of the planet’s
inhabitants speak English. According to Forrester Research, eyeball time is doubled
on sites localized for language and culture.
3
Japanese businessmen, for example, are
three times more likely to conduct an online transaction when addressed in
Japanese. By 2003, the majority of web content will be in a language other than
English, mainly Chinese. To maximize global revenues and grow earnings, e-
commerce companies must address target markets in the local language and with
localized content. Forrester’s Eric Schmitt says:
When offered in multiple languages, customer-service features like product
data sheets and FAQs provide differentiation, build brand loyalty, and cut
support costs.
To help generate cross-border revenues, companies are using localization
outsourcers such as Interwoven, Berlitz GlobalNET and Lionbridge Technologies.
As well as translation services these companies assist in providing brand protection,
and offer advice on design and cultural aspects, and legal and regulatory snares, e.g.
in France consumers enjoy a one-week grace period after purchase, in Germany
comparative advertising is banned and in China encrypted websites are regulated by
the government.
Online communities
This is the setting up of C2C communities to enable interaction via e-mail groups
(e-groups), or web-based discussion forums or chat rooms. These can be aimed at:
■
a particular purpose, e.g. looking for a holiday;
■
people’s circumstances, e.g. state of health, age;
■
a particular interest or hobby, e.g. music or sport;
■
a particular profession, e.g. accountancy.
What you do not want to do is to build up empty, silent or critical communities
as they would have a negative effect.
Service quality
Not surprisingly, research shows that quality of service is a key determinant of
customer loyalty. Service quality is judged on:
4
135

136
Part Three: End-to-End Business Processes
■
tangibles – physical appearance and visual appeal;
■
reliability – consistency and accuracy;
■
responsiveness – willingness to help and provision of prompt service;
■
assurance – knowledge and courtesy of employees and ability to convey trust
and confidence;
■
empathy – caring individual attention.
Customer extension
Customer extension is about deepening the customer relationship through increased
interaction and broadening of product transactions. The aim is to increase the
revenues generated by each customer known as lifetime value. Targeted cross-selling
of other company, possibly new, products can be done during a website visit or via
e-mail promotions.
CRM AUTOMATION
The application of technology to achieve CRM is a key element of any e-business.
It was the failure to retain customers and make money from them after having
spent large sums on acquiring them that resulted in the recent dot.com collapses.
CRM applications cover three broad categories: marketing automation, sales
process automation (contact management) and customer service automation. The
solution can be the integration of fragmented individual applications for parts of
the process, which already exist in most organizations. The ideal would be a
comprehensive suite covering the whole spectrum that provides interaction
between employees and customers across multiple channels with all customer
information stored in a single database to provide total visibility (see Figure 11.1).
The main specialist software suppliers include Siebel, Vantive (now linked to
Peoplesoft), Clarify (now linked to SAP) and Sage with Interact in the SME
marketplace.
Marketing automation
Marketing campaign management, customer segmentation, product mix
management, targeted intelligent web content and personalization, e.g. tools like
Broadvision’s One-to-One Enterprise, create a persistent record of someone who
visits the commerce site so that intelligence about an individual’s preferences can
be built up over time.
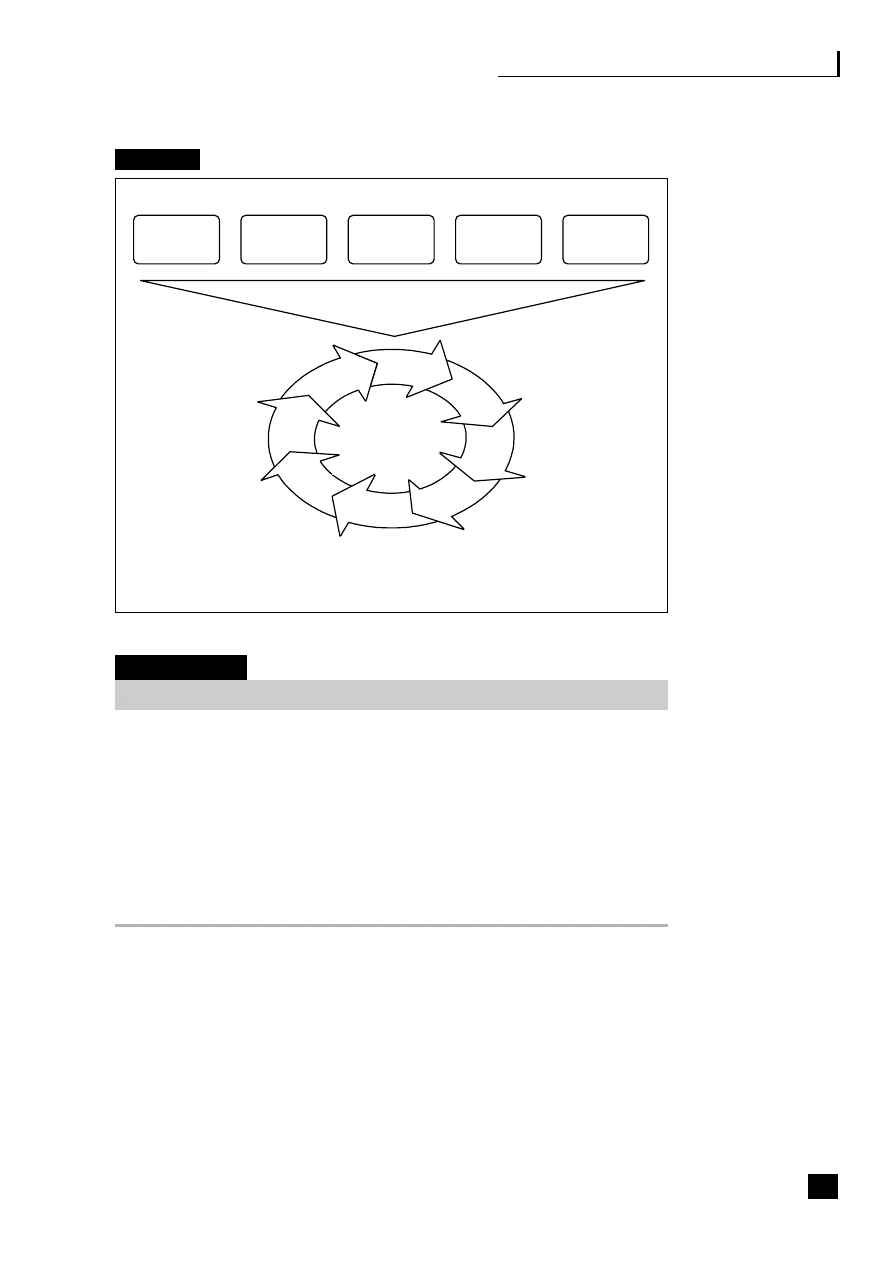
Customer relationship management and e-marketing
Fig. 11.1
CRM – a platform for successful marketing
Case study 11.1
More Th>n
More Th>n
5
was launched by Royal & Sun Alliance after 18 months in planning and an
investment of £20 million in customer and IT systems. As well as acquiring 400,000 new
customers a year it needed to serve R&SA’s 2 million existing customers, through knowledge
provided from existing databases. The main concern focused on the integration of two R&SA
databases – one bespoke operations database held personal details and the other Indentex
marketing database held demographic data and predictive analytics. The new Indentex
marketing database, the London Bridge call-centre software and the ValEx campaign
management tools are interrogated by SAS’s Enterprise Miner heavy-duty analytics tool.
More Th>n believes the key to success is in having commitment from the highest level.
Sales process automation
This includes new business prospecting, direct sales force automation, enquiry
handling, order taking and processing (back-office ERP), after-sales support,
development selling, forecasting and analytics.
137
Call-centres
New customer
segments
Tailored and
personalized offers
Lifetime value of
individual customers
Closed loop of
marketing, sales
and service
A 360
°
view
of customer
Automated
administration
Direct mail
Internet
WWW, kiosks
Sales force,
dealers

138
Part Three: End-to-End Business Processes
Case study 11.2
Consignia
Consignia’s
6
CRM project, termed Spice (Securing the Post Office’s Integrated Commercial
Environment), is part of a £200 million investment in improving services to its 28 million
customers and the 19,000 branches that make it Europe’s largest retailer. It has three phases:
■
redesigning Consignia’s customer-facing processes;
■
introducing a standard software infrastructure to support these processes;
■
deploying them into 14 BUs.
The objective is to give customers the same experience of Consignia through each of its
channels – Web, phone and high street – and through all its brands including Post Office
Counters, Royal Mail and Parcelforce. Previously, their 130 legacy systems were oriented
around its brands. It plans to have 4,000 staff using Siebel’s CRM software by April 2002.
Three tips from Jean Irvine, Spice programme director, are:
■
First choose a flexible software application.
■
Be ready to learn from your experiences and build change management into the project
from the start.
■
Remember that IT is there to support the business, not the other way around.
Customer service automation
This includes call-centres, the Internet, help-desks, CTI and telesales. Good call-
centres are crucial to many modern organizations’ success and well trained and
motivated staff are as important as the latest technology.
Case study 11.3
Sky Services
Sky Services
7
have revamped their call-centre based on Chordiant’s V.2 CRM solution.
BSkyB employs 8,000 people across its sites in Livingston and Dunfermline, with 4,500 in
call-centres. With more than 5 million direct customers, 70,000 new installations and 1
million calls a week, interaction between the call-centres and customers is recognized as
being critical to their success. MD Mike Hughes says:
One of the business challenges we had when I started was it was very difficult to
introduce a new product or service – it took 90 days on average.
The Java-based thin client PCs link into a range of back-office legacy systems, bespoke
applications and Chordiant. A key part of the strategy is ‘object re-use’, which means honing
existing technologies and skills and making the most of rather than replacing them. The plan

Customer relationship management and e-marketing
is to also equip their 2,800 field engineers with handheld devices, which link into the CRM
solution, to give them access to the same desktop information as centre-based agents.
Training is a big part of Hughes’ plans. A mock living room has been created for customer
scenarios and role playing, and for finding other ways to help agents deal with queries more
efficiently. Hughes explained:
With large call centres you’re able to programme people to do things. But if we select
people with the right level of competency, and they have the right tools, then why not
let them inject a bit of personality? This is empowerment with structure. The trick is
getting the pace right in terms of implementing change.
Case study 11.4
The AA
The AA, working in partnership with BT, provides switching technology for virtual call-centres,
with operators working from home still able to direct mobile mechanics to breakdown sites.
Case study 11.5
Commerzbank
Commerzbank
8
is implementing a Siebel CRM system to replace its Goldmine help-desk
package with help from consultants Headstrong. They have replaced a system that covered
just equities with a global system covering all sales desks. It is in two stages: the first links
Siebel’s front-end CRM package to back-end systems, including the bank’s online trading
systems and a Broadvision web-based publishing system. Stage two will add a range of
Siebel analytics tools.
KEY BENEFITS OF CRM
9
CRM:
■
provides a single point of access to information for sales, marketing and
customer service;
■
supports better-informed business decisions by providing a single enterprise-
wide view of the customer;
■
enables real-time interactions between customers, employees, partners and the
enterprise;
■
integrates and personalizes the delivery of customer services;
139

140
Part Three: End-to-End Business Processes
■
improves the customer experience through whatever point of contact is chosen;
■
the influences of the Internet as a self-service delivery channel.
POINTERS TO CRM SUCCESS
Implementing the technology is, in many ways, the easy part. The difficulty comes
in establishing a business strategy and organizational structure that will support
and accommodate this new technology and break down the cultural barriers to
change. Organizations face an uphill struggle to ensure their CRM processes are
as sophisticated and diverse as those of their competitors, often requiring the
adoption of more channels of communication. It is essential to avoid the trap of
trying to do everything at once without effective coordination and neglecting to
take a broad view of how an initiative will affect the entire organization. It is
important that businesses take a far-sighted, strategic approach to CRM, realizing
that the long-term ROI will not be made overnight.
Cambridge Technology Partners offer the following pointers to CRM success:
10
■
Don’t get complacent. Conduct frequent reviews of success, taking both
external changes and internal adoption into account. Exceeding customer
expectations demands continuous improvement.
■
You’re not on your own. Realize that everyone is doing it. Every organization
needs to execute CRM initiatives in different ways and with different goals to
deliver competitive advantage. One size does not fit all.
■
Don’t underestimate the power of the customer. Consider that customers are
more demanding than ever and show no signs of relenting. They expect a
consistent level of service and treatment; ignorance is no excuse. Each channel
must enhance, rather than detract from, the experience the customer receives,
and that means consistent data, service and results.
■
Analyse data. Use data analytical tools to help you focus on high-value
customers and treat them as your most important assets. This in turn must lead
to meaningful customer segmentation.
■
Choose your channels wisely. Perform careful analysis to ensure that effort and
cost is not expended on a channel that will only be infrequently used by your
customer base. The ultimate goal is to tactically drive customers to specific
channels, taking into account which are most cost effective, e.g. Easyjet only
deals over the Web.
■
Be consistent. Ensure that a consistent brand message, look, feel and service are
provided to customers across all channels.

Customer relationship management and e-marketing
■
Avoid silos. At any given point a customer service representative needs to have
a complete historical view of all channels used by the customer.
■
Evaluate. Implement ongoing evaluation to measure results and allow for
continual adoption of necessary changes.
■
Don’t forget the human element. Bring people into the process. Give incentives
to deliver excellence to customers to ensure their buy-in to the process.
E-MARKETING
Marketing is the management process responsible for identifying, anticipating and
satisfying customer requirements profitably. A framework known as SOSTAC™
11
that summarizes the different stages that should be involved in an e-marketing
strategy is described below.
12
Situation analysis
Internal audits
■
Current Internet marketing audit (business, marketing and Internet marketing
effectiveness).
■
Audience composition and characteristics.
■
Reach of website, contribution to sales and profitability.
■
Suitability of resources to deliver online services in face of competition.
External audits
■
Macro-economic environment (social, legal, political, economic and technological
characteristics).
■
Micro environment (new marketplace structures, predicted customer activity).
■
Competition (threats from existing rivals, new services, new companies and
intermediaries).
SWOT analysis
■
Market and product positioning.
■
Methods of creation of digital value and detailed statement of customer value
proposition.
■
Marketplace positioning (buyer, seller and independent marketplaces).
■
Scope of marketing functions.
141

142
Part Three: End-to-End Business Processes
Objectives statement
■
Corporate objectives of online marketing (mission statement).
■
Detailed objectives: tangible and intangible benefits, specific critical success factors.
■
Contribution of online marketing to promotional and sales activities.
■
Online value proposition.
Strategy definition
■
Investment and commitment to online channels (mixture of bricks and clicks).
■
Market and product positioning (aims for increasing reach, new digital products
and new business and revenue models).
■
Target market strategies (statement of prioritized segments, new segments, online
value proposition and differential advantage. Significance of non-customer
audiences?)
■
Change management strategy (which new processes, structures and responsibilities
will be required).
Tactics
■
Product (creating new core and extended value for customers, options for
migrating brand online).
■
Promotion (specify balance of online and offline promotion methods, CRM).
■
Price.
■
Place (marketplaces).
■
People, processes and physical evidence – service delivery.
Action
■
Project plan and implementation.
■
Team organization and responsibilities.
■
Development and maintenance process.
Control
Identify a measurement process and metrics
Financial service organizations, particularly the banks, have been leading the way
in customer analytics to support point or tactical marketing and CRM. It is

Customer relationship management and e-marketing
essential that this analysis becomes strategic. According to Gartner, by 2005, 30
per cent will effectively leverage a holistic understanding of the customer during
customer interactions and, as a result, will outperform competitors in terms of
profitability, share of wallet and retention of key clients.
13
Analytics used include:
■
customer segmentation
–
100%
■
predictive modelling
–
83%
■
customer profitability analysis
–
76%
■
lifetime value
–
47%
■
event monitoring/triggering
–
30%
Case study 11.6
Lloyds TSB
Lloyds TSB
14
used CRM analytics to strengthen customer loyalty and deliver a positive
customer experience consistently and cost effectively in the aftermath of a merger. They
knew that 16 per cent of its 15 million customers generated 80 per cent of their profit and
that a further 30 per cent were new or inactive. The pilot project known as Caribou had the
objective of testing the power and feasibility of leveraging customer information to improve
the quality and value of customer relationships. Specifically, it focused on the effectiveness
of direct marketing-led campaigns as a way of improving cross-selling, up-selling and
retention and reducing the cost of sales. Assisted by AMS, the project showed them how to
engage the business across the organization and how to refocus teams drawn from many
different areas from a purely product-focus towards a customer-centric approach.
Case study 11.7
Convergys
Convergys
15
is a US-based outsourcer of customer service and billing. Convergys is one of
many B2B specialists which are turning to an old standby, lifetime customer valuation (LCV),
to help get a fix on which customers offer the greatest profit potential. The goal of LCV is to
separate truly profitable clients from the barely profitable and allocate resources accordingly.
First used in the 1930s the metric assessed the NPV of a customer’s future spending.
Convergys rolled out an LCV programme a few years ago and in 2001 saw its reported
operating income up 16 per cent – a large percentage coming from winning new business
from old customers. According to the CFO, the lifetime value modelling index is an empirical
validation of Convergys’ own instinctive belief that there is potential to grow existing client
relationships significantly. The LCV rating system used by Convergys factors in non-revenue
items for a more accurate picture of the reliability of customer spending.
143

144
Part Three: End-to-End Business Processes
Their weighted index included:
■
Average revenue score (15%)
– based on current and projected spending
■
Revenue change score (15%)
– based on actual year-to-year spending
■
Profitability score (20%)
– based on customer contribution margin
■
Current relationship (10%)
– based on signed contract length and total
years as client
■
Share of client (10%)
– based on outsource potential
■
Partnership (10%)
– based on level of contact, referenceable and
future value
■
Technology entanglement (20%)
– based on system integration, reporting, e-mail,
Convergys’ web agent assisted service
Technology entanglement, which makes up 20 per cent of the index, measures IT
integration between Convergys and its customers. The more entangled, the more it would
cost to switch to a competitor. It has completely changed the way staff view customers –
one low-volume customer ranked 62nd in sales came 3rd on the LCV index, while another
5th in current spending dropped to 13th on LCV scores.
The subject of measurement process and metrics is covered in detail in Transforming
the Finance Function,
16
which covers the balanced scorecard, website and CRM
analytics and customer valuation.
Case study 11.8
ProXchange
See Figure 11.2 which illustrates ProXchange’s seven-level waterfall, taken from this
companion briefing.
Fig. 11.2
ProXchange’s seven-level waterfall
1. First-time visitor
2. Repeat visitors
3. Registered users
4. Registered users interacting with site
5. Bidders
6. Accepted bidders
7. Commission from trades

Part four
How to Analyse, Re-engineer
and Manage Business Processes
12 Business process analysis
147
13 Activity/process-based costing
163
14 Business process performance improvement
175
15 Change management
189
16 Business process performance management
199
17 Process-based accounting incorporating
Six Sigma
217
■
■
■
■
■
■
145


12
Business process analysis
Introduction
149
Activity/process analysis methodology
150
Collection of activity/process information
153
Steps in building a process model
156
■
■
■
■
147


Business process analysis
INTRODUCTION
All process/activity-based techniques (P/ABT) involve analysing the business to
gain a greater knowledge of what activities it performs and how those activities
relate to one another. A series of activities that flow from one to another constitutes
a process. In other words, this analysis helps us understand how the business
operates. This process-based analysis then forms the central database, which can
be utilized by one or all of the numerous P/ABT that an organization decides to use
to improve and manage its business.
P/ABT fall into three broad categories:
■
Costing/pricing/profitability:
– activity-based costing
– product/service costing
– product/service pricing
– market/channel/sector and customer profitability
– transfer pricing including inter business unit (BU) pricing.
■
Performance improvement:
– process and activity mapping
– cost reduction
– value analysis
– constraint removal
– business process re-engineering (BPR)
– benchmarking
– best value
– integrated E2E processes.
■
Ongoing performance management:
– value-based management
– performance measurement/management
– service-level evaluation
– activity-based budgeting (ABB)
– priority-based budgeting (PBB)
– resource accounting and budgeting (public sector)
– benchmarking
– best value (public sector)
– Six Sigma
– process-based accounting
– integrated E2E processes.
149

150
Part Four: How to Analyse Business Processes
The use of these techniques now transcends every industry sector. The beauty of
P/ABT lies in their simplicity which allows them to be understood by anyone at
any level in the organization, and their universal application to anything that
consumes resources.
A CIMA Research publication, Activity-Based Techniques – Real-Life
Consequences,
1
examined 11 companies that had been using P/ABT for a number
of years and found, among other things, that:
■
although the businesses had typically embarked on the use of one P/ABT
initially, often ABC for product costing or BPR for performance improvement,
they went on to use an average of three techniques, usually including activity-
based budgeting for management and control;
■
implementation of P/ABT made a contribution to changing culture and
improving relations between the functions, particularly finance and operational
departments. Noticeably, this had been assisted by such factors as the common
language of P/ABT to discuss costs and performance with any member of the
organization.
ACTIVITY/PROCESS ANALYSIS METHODOLOGY
When carrying out process/activity analysis for the first time, it is generally easiest
to use the company’s organizational structure, as shown in Figure 12.1. The
starting point is to ask a representative from each budget or cost centre within
your organization’s structure of departments, directorates, functions or business
units to analyse the activities that they perform and, depending on the detail
required for the purpose, the tasks within those activities.
Fig. 12.1
Organization structure hierarchy
Depts (units)
Cost centres (tens)
Activities (hundreds)
Tasks (thousands)

Business process analysis
Then, as can be seen in Figure 12.2, the tasks and activities can be grouped into
activity flows forming sub-processes, which in turn can be related to the core
processes of the business. The core processes are those that define the purpose of
the organization’s existence, the processes that deliver the products or services
that the company is in business to provide. All activities and sub-processes carried
out within the company must contribute towards these core processes in some
way. The analysis carried out makes this relationship clear and provides an
understanding of how the business operates. Obviously, in an actual analysis the
number of levels in the hierarchy varies considerably, depending on the size of
organization and the level of detail required, to achieve the defined objectives.
Fig. 12.2
Process/activity hierarchy
In Figure 12.3 the organizational structure of a housing association can be seen
going down the page and the core processes going across the page, cutting each
other in a cross named after CAM-I, the research organization that first defined
it.
2
This represents how all the departments within the organizational structure
each contribute to the core processes via the sub-processes that they perform.
Processes represent a series of activities, which produce a specified output and
ignore all functional boundaries. The hierarchy, which shows their
interrelationships and the contribution that they make to the end product or
service is represented by the pyramid in Figure 12.2.
151
Core
processes (units)
Sub-processes (tens)
Activities (hundreds)
Tasks (thousands)
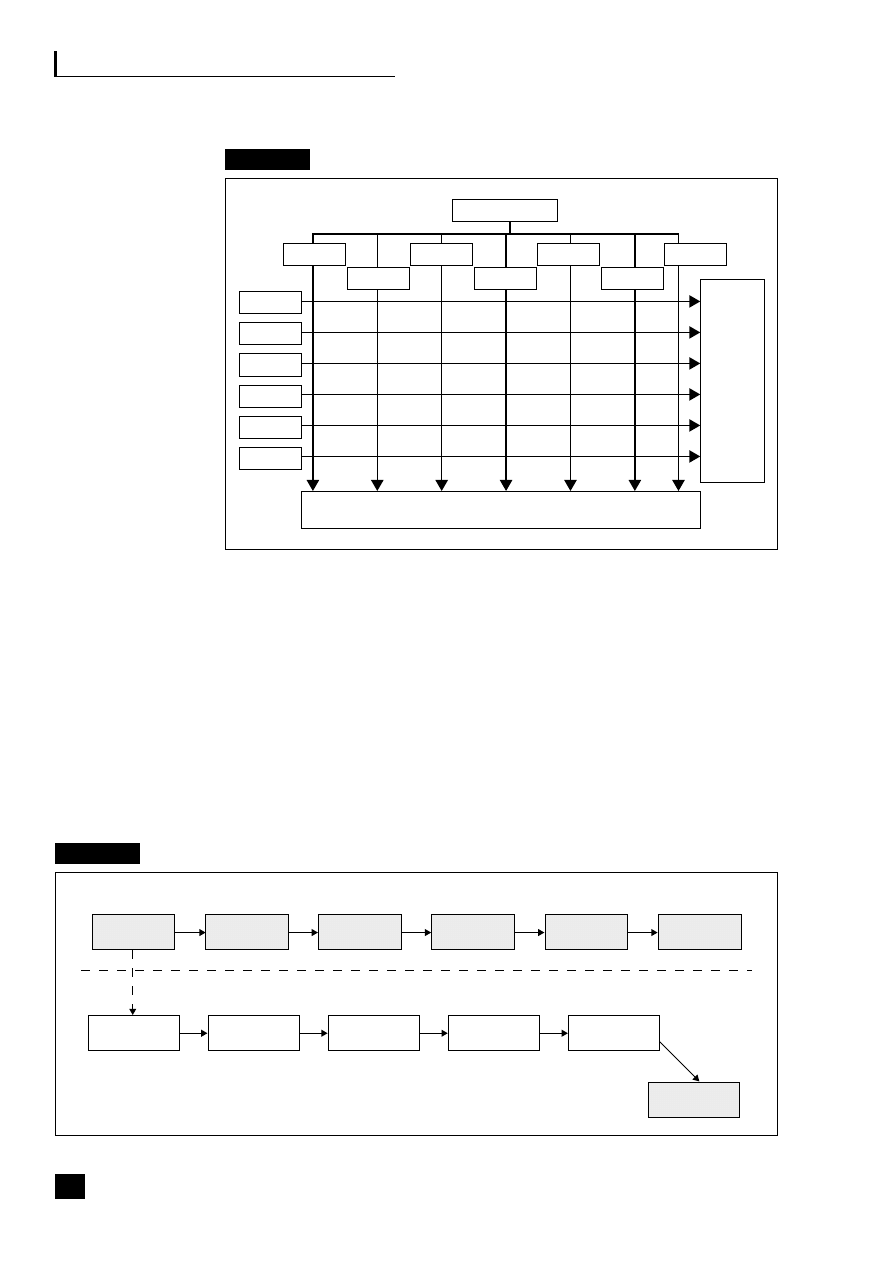
152
Part Four: How to Analyse Business Processes
Fig. 12.3
CAM-I cross
In Figure 12.4, the systems design and delivery sub-process can be seen as one of
the sub-processes that contributes to the infrastructure, which in turn contributes
to the core processes. It illustrates that the sub-process is made up of a flow of six
activities, each of which in turn can be analysed into the flow of tasks that perform
the activity. If required, each of the tasks could similarly be analysed into sub-tasks.
All organizations are made up of a number of sub-processes, some of which are of
a support nature and are common to most organizations, like procurement,
recruitment and provision of management information. Others are specific to their
industry sector, in the way that maintaining a waiting list (see Figure 12.5), reactive
repairs, allocations and tenancy management are to housing associations.
Housing association
Seven departments physically structured through a head office,
three regions and ten areas
SOUTH
Housing
management
Housing
services
Repairs and
maintenance
Development
Care and
repair
Extra
care
MIDLANDS
NORTH
POLICY UNIT
SECRETARY
CENTRAL
SERVICES
FINANCE
D
e
l
i
v
e
r
i
n
g
c
u
s
t
o
m
e
r
-
f
o
c
u
s
e
d
s
e
r
v
i
c
e
s
Fig. 12.4
Systems design and delivery sub-process
Activity level
Business
analysis
Task level
Initial
analysis
Cost
justification
Write business
specification
Review
specification
Agree
specification
System
development
System
development
System
testing
System
assurance
Documentation
System
delivery
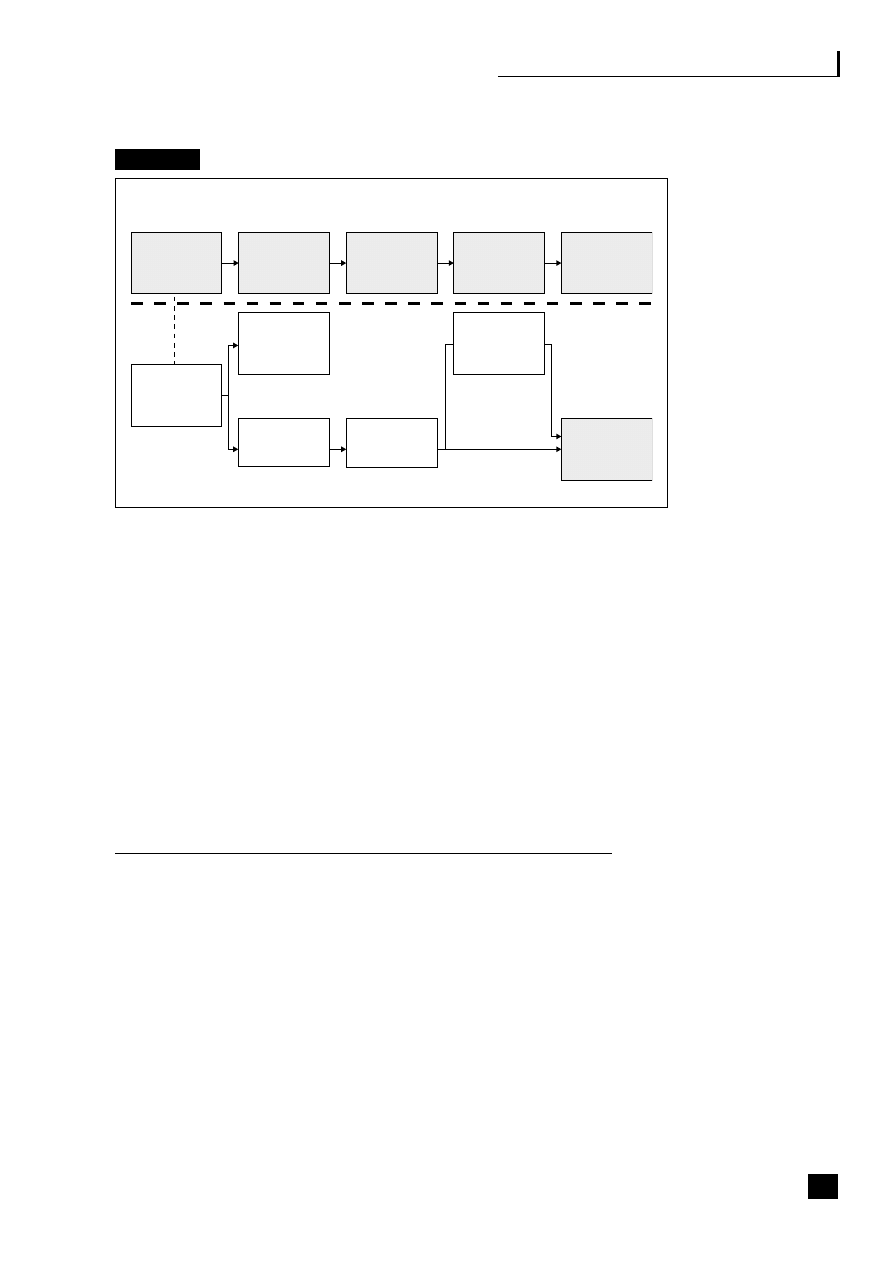
Business process analysis
Fig. 12.5
Waiting list sub-process
Tips when designing the model include the following:
■
Determine the correct level of detail needed for the purpose, e.g. detailed
information for performance improvement initiatives.
■
Describe activities clearly and consistently, using an activity dictionary, e.g.
keep descriptions short, activities should end in ‘ing’.
■
Keep it as simple as possible.
■
Evaluate all requirements before building process models, e.g. short term may
be BPR, but longer term E2E.
■
Ensure that you build to the strengths of the software being used.
COLLECTION OF ACTIVITY/PROCESS INFORMATION
Depending on the P/ABT that is being used, data needs to be collected, generally
from the people carrying out the activities within each budget/cost centre or sub-
process.
Information collected could include:
■
activities and tasks performed;
■
relationships to other activities/processes (flows);
■
inputs and outputs to and from the activities/processes and their units of measure;
■
resources consumed, e.g. time spent, amount of office space used (resource drivers);
■
basis of allocation to products or services and customers (activity drivers);
153
Applications
Acceptance
Pointing and
coding
Assessment and
verification
Review and
maintenance
Applicant enquiry
(phone, letter
or visit)
Advise of reason
for rejection
Send standard
pack
Application
received and
checked
Obtain missing
information
Acceptance
Activity level
Task level

154
Part Four: How to Analyse Business Processes
■
factors that influence the process/activity’s performance (cost drivers);
■
performance measures (financial and non-financial, quantitative and qualitative);
■
activity/process objectives and responsibilities;
■
activity classifications (core, diversionary, support);
■
alternative service levels;
■
ideas for improvement.
It is worth noting at this point that detailed time recording and analysis by all staff
on an ongoing basis are not prerequisites to activity process analysis. This is a
popular misconception that has no foundation in practical application.
Methods of data collection
Many methods can be used for collecting data; generally, the initial analysis will
be undertaken on the best data available and then specifically automated systems
will be set up for ongoing monitoring.
Sources of existing data can usually be found in:
■
timekeeping systems (for identifying resource drivers);
■
corporate information systems (for activity drivers, outputs and non-financial
performance measures);
■
financial information systems (for costs, assets and budgets);
■
HR systems (for payroll, people information and organizational structures);
■
the department cost centre or process being analysed (activities, relationships,
flows, cost drivers, inputs and outputs).
Methods of data collection include:
■
observation;
■
storyboards or group workshops used to brainstorm activity/process analysis
(useful when trying to get a quick, first cut of information);
■
downloading of information from other IT systems;
■
interviews are a popular method but one that has the disadvantages of being
time-consuming and dependent on instant responses from the interviewees,
though ideal if one area only is being analysed;
■
questionnaires/forms will need to be explained carefully to the people who are
going to complete them, with support available for questions that arise. Select
one representative from each cost centre to complete the questionnaire/forms

Business process analysis
and train them in how to carry out the analysis, encouraging them to involve
all the staff within their cost centre. A sample form designed for collecting basic
activity and resource allocation data can be seen in Figure 12.6.
Fig. 12.6
Data collection form
Once the data has been collected and analysed, always validate it by checking
with the cost-centre staff and management to ensure that no errors have occurred
during preparation. If the collection of data has involved the selection of choices,
e.g. which methods of allocation to use, then it is advisable to hold a workshop
of all interested parties and gain consensus on the ‘preferred’ methods.
155
Name
Emp. No
1
2
3
4
5
6
Fraction
Ann Williams
12341
40
28
32
1.0
Handling routine enquiries
Cost centre code:
HDK
Cost centre name:
Help Desk
Completed by:
Joan Ayres
Date:
28.04.99
Resolving problems
Escalating problems
Management
Fred Smith
56782
35
25
40
10
1.0
John Shore
90123
45
32
23
1.0
Lynne Edwards
34514
55
20
25
1.0
James Roberts
78905
60
25
15
1.0
Peter Brook
1236
50
28
22
1.0
Joan Ayres
45677
40
35
15
10
1.0
Ron Jones
89018
0
30
20
50
1.0
Personnel
Activities
Description
1
2
3
4
5
6
£k Budget
Code
C2200
General travel
30
30
40
6.0
C3300
Office supplies
25
25
25
25
2.0
C4450
Publications
50
50
1.5
C3320
Photocopying
30
40
30
0.7
C2260
Car allowance
100
4.5
C4999
Internal purchases
25
25
25
25
20.0
34.7
Consumables

156
Part Four: How to Analyse Business Processes
STEPS IN BUILDING A PROCESS MODEL
1. Decide what the model is going to be used for. As in all projects, clearly
defined objectives are essential. Indicate the level of detail required in the
activity hierarchy and the software features and functionality required – BPR
and E2E is likely to require process mapping and detailed task-level
information whereas ABC is likely to require the ability to carry out multi-
dimensional allocations and sub-process and activity detail only. Beware too
much detail.
2. Make decisions regarding use of appropriate software. This is covered in
Transforming the Finance Function.
3
3. Design the structure of the model. The methodology will vary with the choice
of software and project objectives, but decisions need to be made at this stage,
e.g. what are the products/services and customers/markets/channels to be
analysed? Remember that because this is a model, the process analysis can be
viewed from different perspectives.
4. Collect the data. See p. 152–3.
5. Build the model on the chosen software and validate with users. Remember
that the model is going to be utilized for decision making throughout the
organization and possibly by partner companies. It is important that all the
users trust the information and, as such, need to be involved and consulted at
every stage.
6. Update, review and report regularly.
Case study 12.1
Anglian Water Services
Background
Anglian Water Services
4
(AWS) is the regulated water and waste water business. It is
geographically the largest of the ten regional water services companies of England and Wales,
with a region stretching from the Humber to the Thames and to Oxfordshire in the West. AWS
employs in the region of 5,000 people and has an annual turnover of approximately £700
million.
In 1997, AWS decided to upgrade its three-year-old, centrally operated ABC system based
on Microsoft Access to a business intelligence tool. The existing system had analysed all
budget centres into activities and processed actual data on a quarterly basis. This meant that
activity analysis was discrete to each budget centre and limited in how it could be developed.
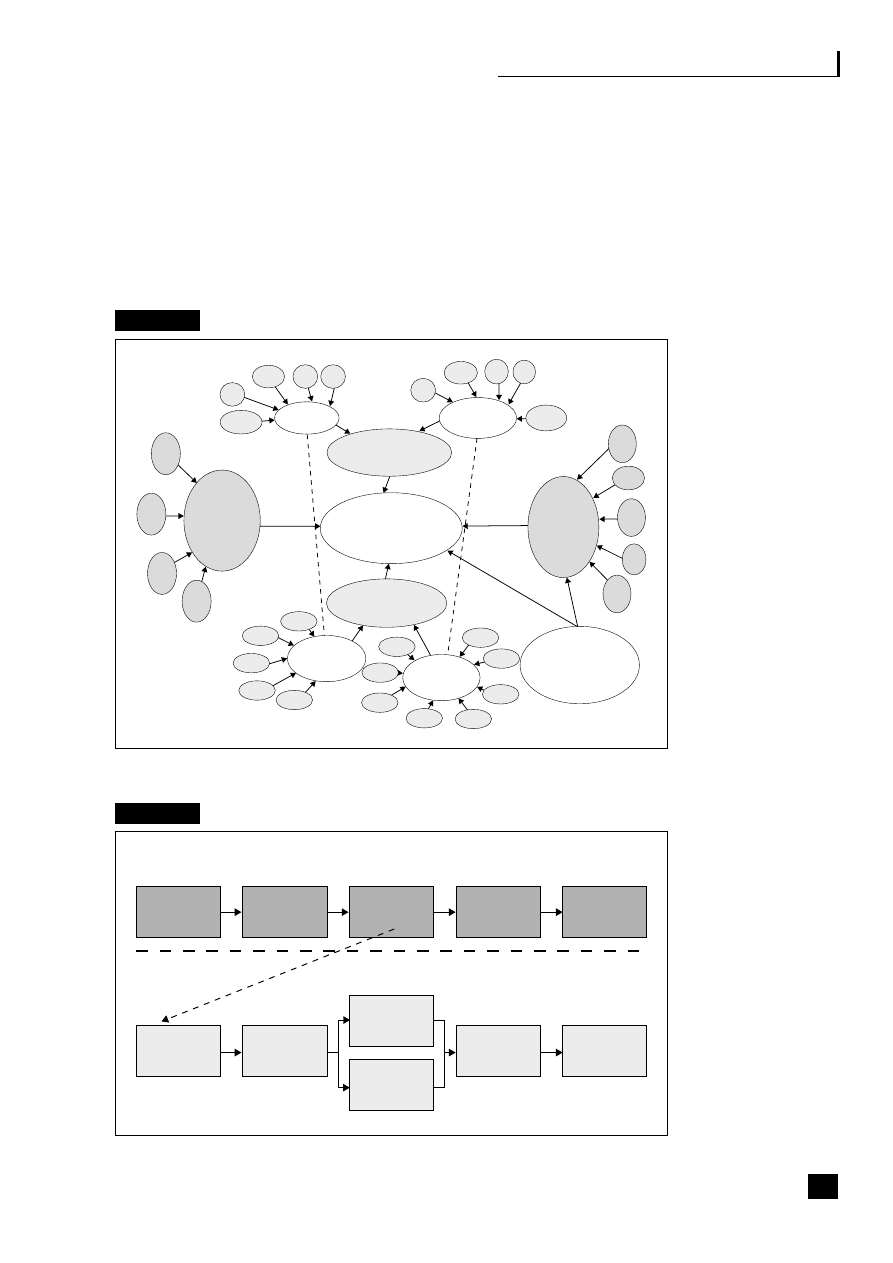
Business process analysis
The solution
A network of process-based models was designed as its replacement, with detailed models
for each strategic business unit (SBU) replacing the hundreds of budget centre statements
produced via Access. Figure 12.7 shows how the design allowed for the individual (micro)
models to be provided for each SBU and a macro company-wide view that could be used
for corporate purposes, including a regulatory model.
Fig. 12.7
AWS – user network
Fig. 12.8
AWS – billing and collection process (micro)
157
Customer
services
Water
Sewerage
Networks
CORPORATE
Production
Water
Waste
water
Support
services
Whitwell
training
centre
Determine
customer
base
Read
meters
Produce
bill
Activity level
Task level
Deal with
queries
Receive
payment
Run
computer
system
Sort
bills
Envelope
bills
Redirect
bills
Dispatch
Send
reminders
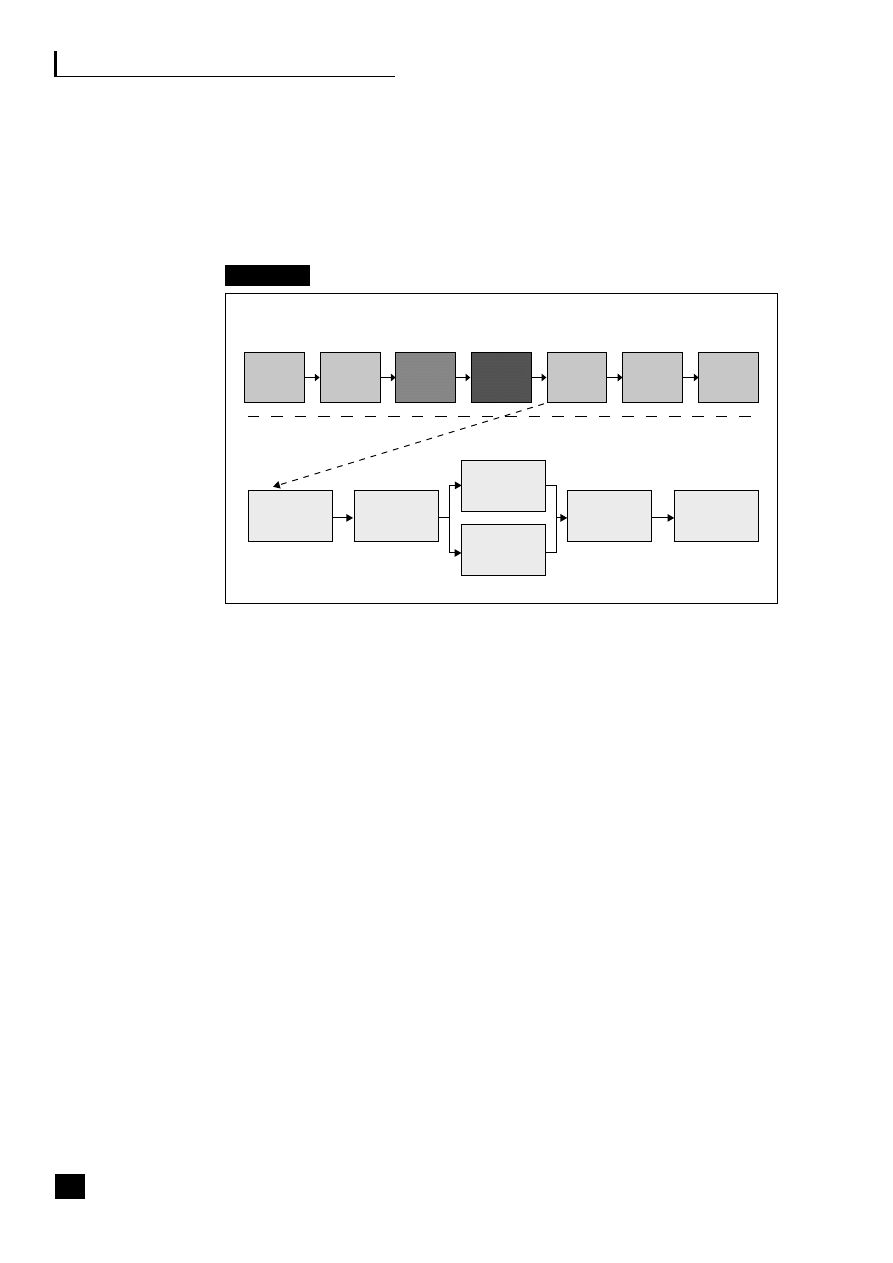
158
Part Four: How to Analyse Business Processes
Figure 12.8 shows the process at a micro level as it appears within the Customer Services
Department and Figure 12.9 shows the same process at corporate level once it has been
merged with other departments/SBUs. It has activities/processes added from the Networks
and Finance Departments/SBUs.
Fig. 12.9
AWS – billing and collection process (macro)
The system is designed so that each of the 40 micro models is owned and run monthly by
the SBU performance managers. Once validated, the models are then made available on
the computer network/intranet and are accessible by managers and staff, who can
manipulate the data in the BI interactive tool. For example, the production drill-down,
geographic, operational computer system ARTS 2000, illustrated in Figure 12.10, which all
production staff are accustomed to using has been simulated by the BI mapping tool as
illustrated in Figure 12.11. This shows the familiar visual but displays cost and output
performance information instead of operational data.
Maintain
meters –
(networks)
Determine
customer
base
Read
meters
Produce
bill
Activity level
Task level
Deal with
queries
Receive
payment
Run
computer
system
Sort
bills
Envelope
bills
Redirect
bills
Dispatch
Send
reminders
Set
tariffs –
(F & P)
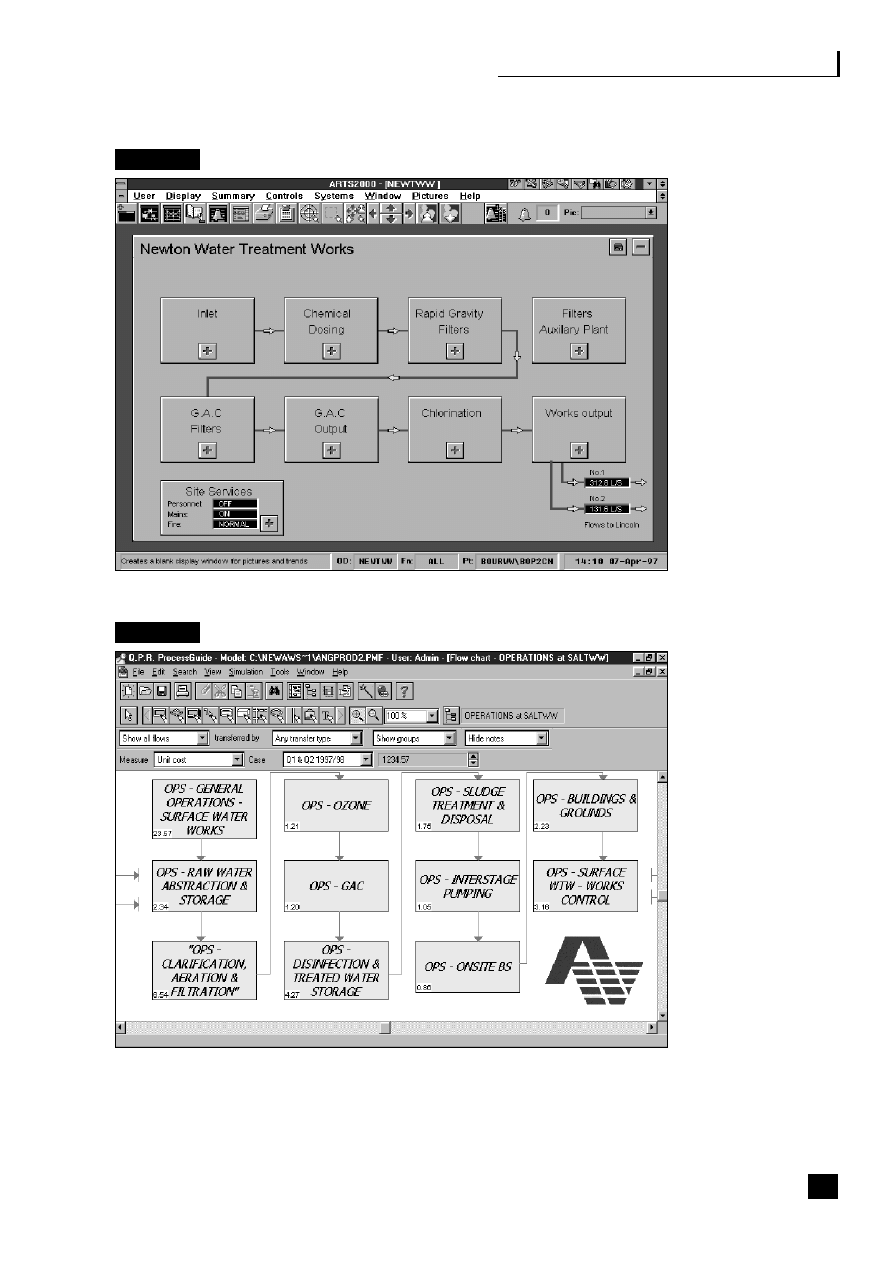
Business process analysis
Fig. 12.10
AWS – ARTS 2000
Fig. 12.11
AWS – process view
159
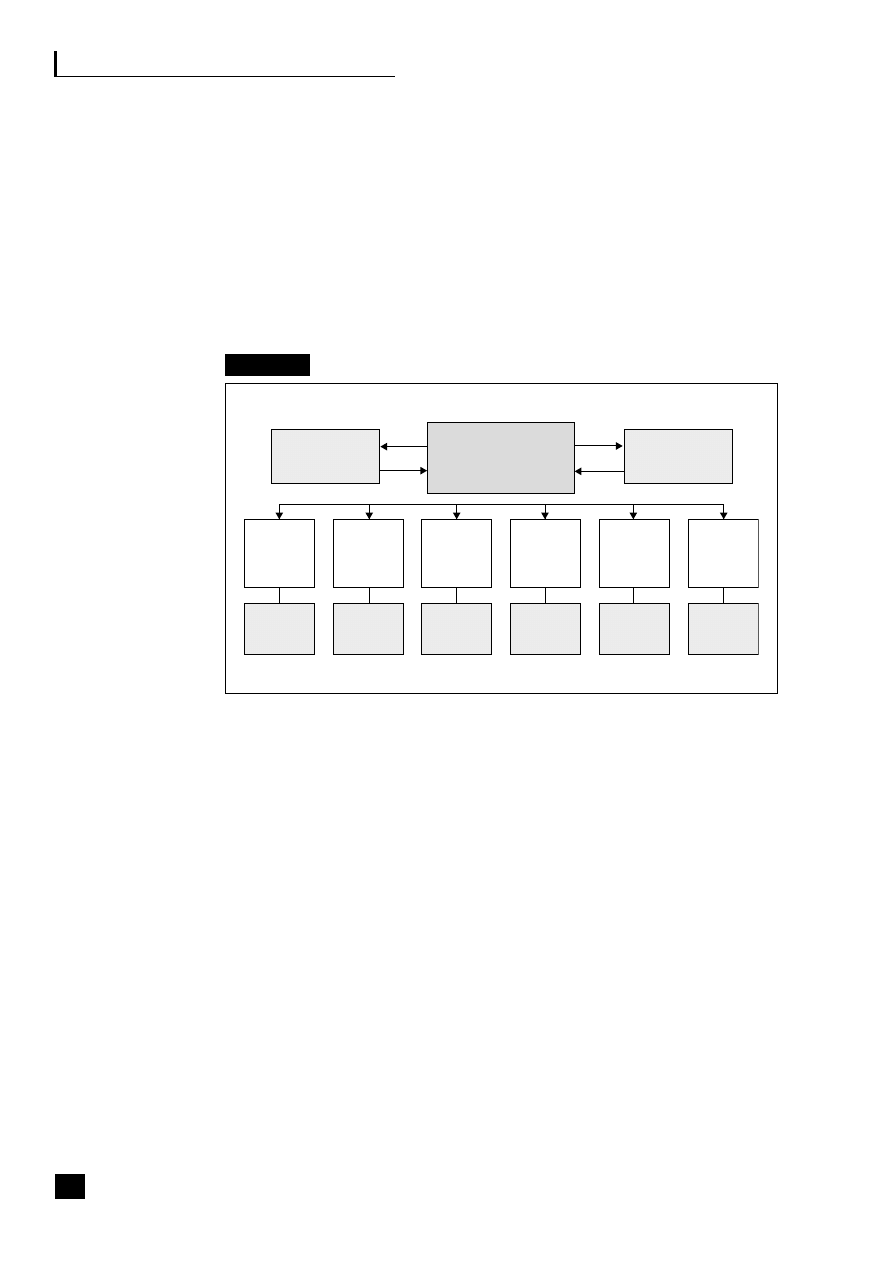
160
Part Four: How to Analyse Business Processes
This new, advanced decision support system was built to provide value-adding features and
functionality in an interactive tool capable of being used as the enterprise-wide, end-user
information delivery system. As you can see from Figure 12.12, it was designed to download
data from the then accounting system Millennium, and then enable it to be converted to
the ERP system SAP R/3 once fully implemented. Information is also obtained from
numerous other operational systems, depending on the specific micro models, e.g. the
production model data coming from the ARTS 2000 telemetry system, the training model
data coming from the bookings database.
Fig. 12.12
AWS – system flows
System uses
■
Outputs from the system provide hierarchical activity/process analysis and unit costs at
all levels.
■
Product and service costing, compared to income, customer (including internal customers
via service level agreements) and market/sector analysis, also incorporating income.
■
Asset and income data is incorporated to provide value-based management (VBM)
5
statements, which drill down to the detailed process-based management information
held in the models.
■
Additional metrics against activities/processes – quantitative and qualitative measures
and drivers – enabling drill-down from the corporate balanced scorecard.
6
■
Performance-improvement techniques, e.g. BPR and benchmarking.
7
Considerable
opportunities for internal benchmarking exist within the operational areas.
■
Creation of a budget model – with fixed, variable and semi-variable indicators on
resources that allows for ‘what if’ simulations to be evaluated – an essential tool in the
armoury of value-enhancing managers. An example of this feature can be seen in Figure
12.13 which graphically illustrates the impact on resource and process/activity utilization.
‘What if’
models for
each area
Activity
analysis
+ volumes
Additional
performance
measures
BPR/
benchmarking
Corporate
models –
regulation
profitability
Product/
service
costs vs
income
Strategy
planning
ABM
Balanced
scorecard
Performance
improvement
Income
strategy
Value/FBM
Information
delivery system
Controlled
by management
accountants
Access by
150 users
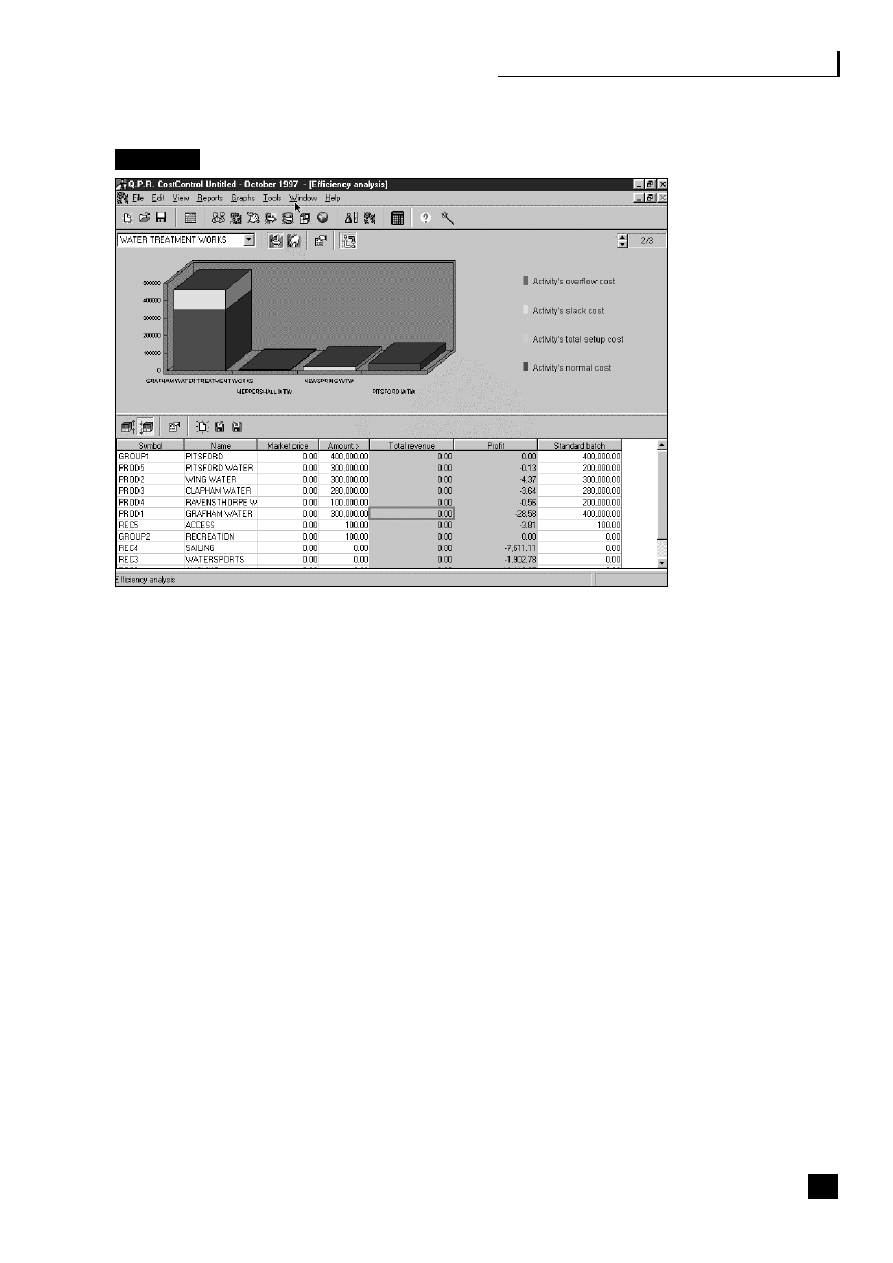
Business process analysis
Fig. 12.13
AWS – efficiency analysis
161


13
Activity/process-based costing
Introduction
165
Research
165
Signs of the need to review the costing system
166
How ABC differs from traditional costing
166
Choice of drivers
167
ABC example
169
Customer profitability
172
Process-based modelling
173
■
■
■
■
■
■
■
■
163

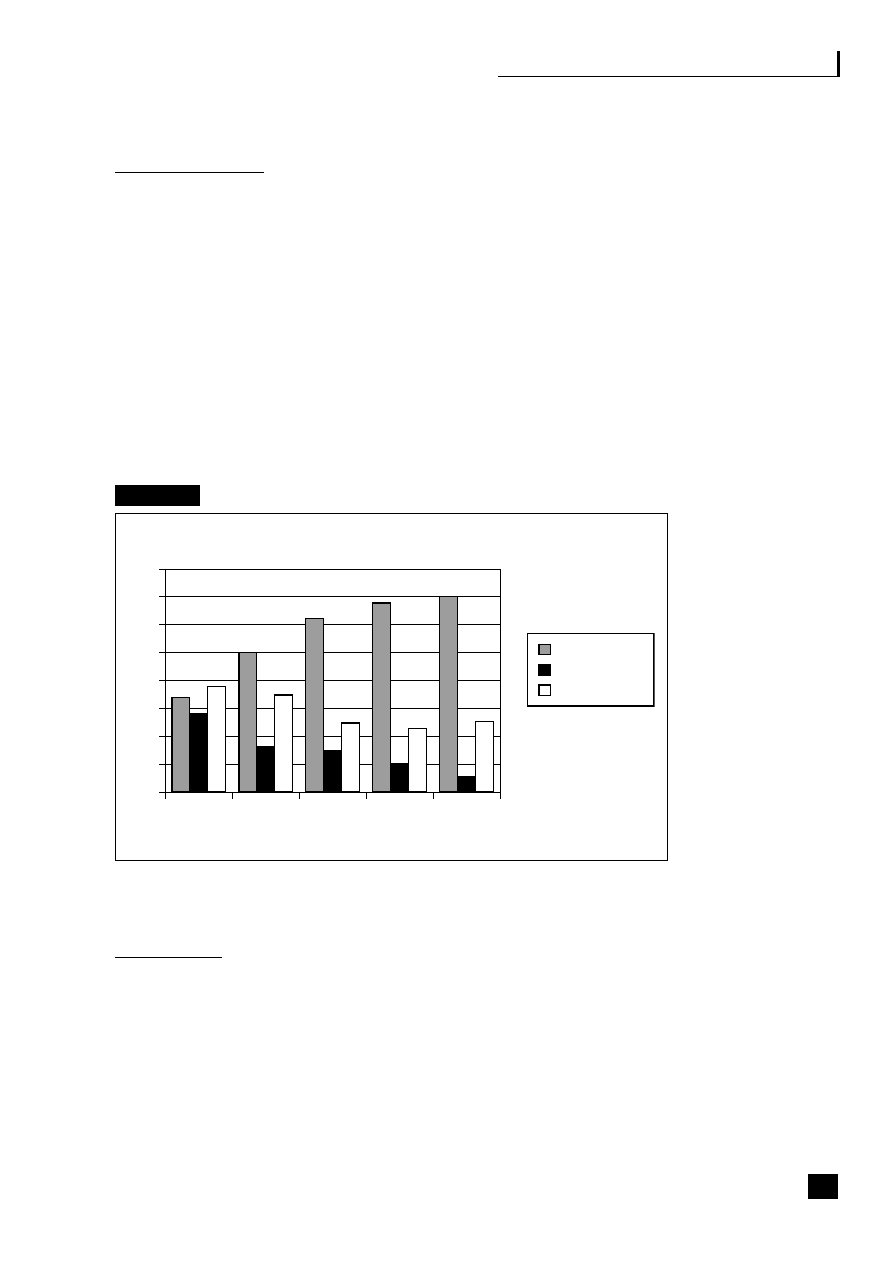
Activity/process-based costing
INTRODUCTION
Costing systems developed in the first half of the twentieth century, which allocate
overhead costs primarily as a percentage of direct labour costs, are no longer
appropriate in the world of the twenty-first century. Figure 13.1 (taken from the
ABB case study, on pp. 183–87) illustrates why it was reasonable in the 1960s to
allocate indirect costs of 34 per cent of total costs (including direct materials) as a
percentage onto direct labour of 28 per cent. By the 1990s, the sharp changes in
the proportion of the make-up of business costs show indirect costs of 70 per cent
of total costs (including direct materials) being allocated as a percentage onto direct
labour of only 6 per cent. This can no longer be considered to be appropriate,
producing costings that are inaccurate, misleading and dangerous when used for
decision-making purposes.
Fig. 13.1
ABB: changes in cost composition
RESEARCH
A book written in the 1980s by Kaplan and Johnson,
1
clearly identified the
problem illustrated in Figure 13.1, with further evidence of this practice coming
from a CAM-I
2
survey, which showed that over 80 per cent of companies
allocated costs based on direct labour.
CIMA Research published in 2000 analysed 187 UK companies with turnover of
more than £25 million.
3
The findings showed that in 1998/9 an average of 25 per
cent of organizations have adopted activity-based costing (ABC) and this rose to 45
165
60%
70%
80%
50%
40%
30%
20%
10%
0%
1960
1967
1977
1987
1990
Overhead costs
Wages (direct)
Material costs

166
Part Four: How to Analyse Business Processes
per cent for those organizations with over £300 million turnover and to 71 per cent
for organizations in the financial and commercial sectors. This usage continues to
spread through the application of ERP, Best Value public sector initiatives and the
need to better control costs. For example, Shell announced plans to reduce its cost
base by $2.5 billion in 1999 and its rival BP Amoco countered with plans to cut its
costs by $4 billion, both organizations aware of the importance of delivering
shareholder value. It can be seen from the case study at the end of this chapter that
the Defence Logistics Organization (DLO) is using ABC to reduce its cost base by
20 per cent over five years, saving the taxpayer well over £1 billion a year.
SIGNS OF THE NEED TO REVIEW THE COSTING SYSTEM
■
lack of official costs being used in product and pricing decisions;
■
unofficial cost information being used due to lack of confidence in the
information provided;
■
sales rising but profits falling;
■
expected cost reductions not materializing;
■
customers ‘cherry picking’ products;
■
decisions being taken by operational managers to outsource the production of
components to save high overhead costs which have been allocated via the
outdated costing system.
HOW ABC DIFFERS FROM TRADITIONAL COSTING
The ability to calculate accurate process, product and service costs and evaluate
the profitability of pricing strategies and customers is essential in any organization
wishing to be competitive in the twenty-first century. ABC is now accepted and
widely used as the most appropriate method of costing processes, products and
services. Figure 13.2 shows that while traditional methods collected overhead
costs into one (or more) central pools to be arbitrarily allocated to all products
and services by a percentage on-cost generally based on labour, ABC puts in an
additional step for activities. It allocates resources to activities/processes, prior to
allocating activity/process costs to products and services based on actual usage.
By doing so, as seen earlier in the chapter, it enables the business to understand
the costs of the activities it performs and to identify their interrelationships. For
example, if the overhead cost centre was Finance, the three activities shown in
Figure 13.2 might be:
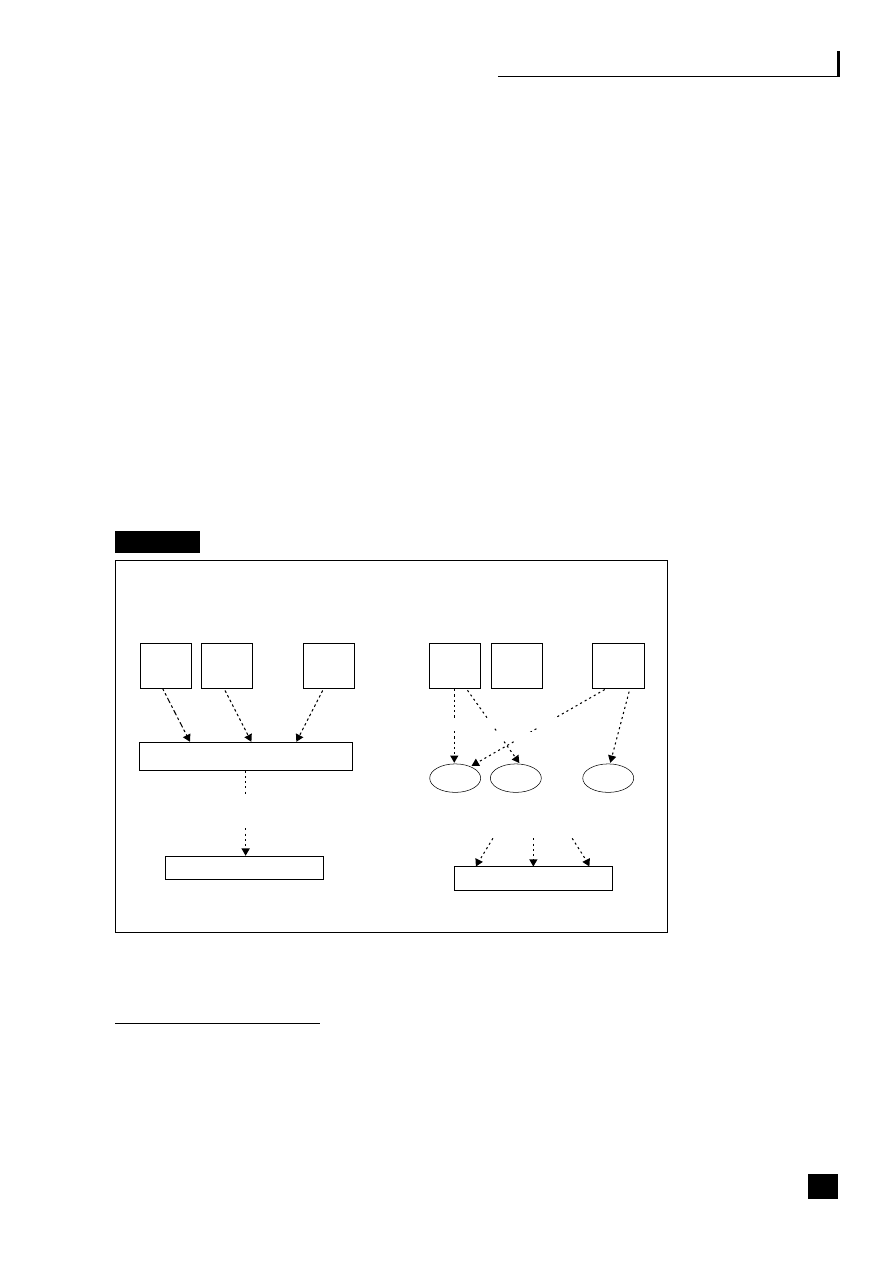
Activity/process-based costing
■
financial operations
■
payroll
■
provision of management information.
ABC, then, allows each of these activities/processes to be allocated costs according to
how they are being consumed, by identifying their activity drivers, their unit costs and
where they are being used. Payroll would have the number of employees as its activity
driver and be allocated equally to all employees, while financial operations would
probably use the number of invoices processed as one of its drivers and its costs
allocated according to usage. The method of allocating resource costs to activities is
by a resource driver relating directly to the activity’s consumption of resources. In this,
the costs of employing the finance staff would be allocated to the activities based on
the time they spent on each activity. Similarly, the costs of IT would be allocated
according to usage, possibly per package used and/or per PC or number of
transactions, and so on with the other resources in the cost centre.
Fig. 13.2
How ABC differs from traditional costing
CHOICE OF DRIVERS
The choice of methods of allocation between resource and activity are known as
the ‘resource drivers’ and between activity/process and the product/service or
another activity/process as the ‘activity drivers’. The choice will vary depending
on the specific circumstances and the information that is available. The term ‘cost
167
Traditional costing
Overhead
cost
centres
Resources allocated on basis of
consumption
Collected in central pool
Global absorption usually based
on labour
Activity
Activity-based costing
£
£
£
• • •
£
£
£
• • •
• • •
Products/services
Activities allocated on
basis of absorption
Products/services
Activity
Activity
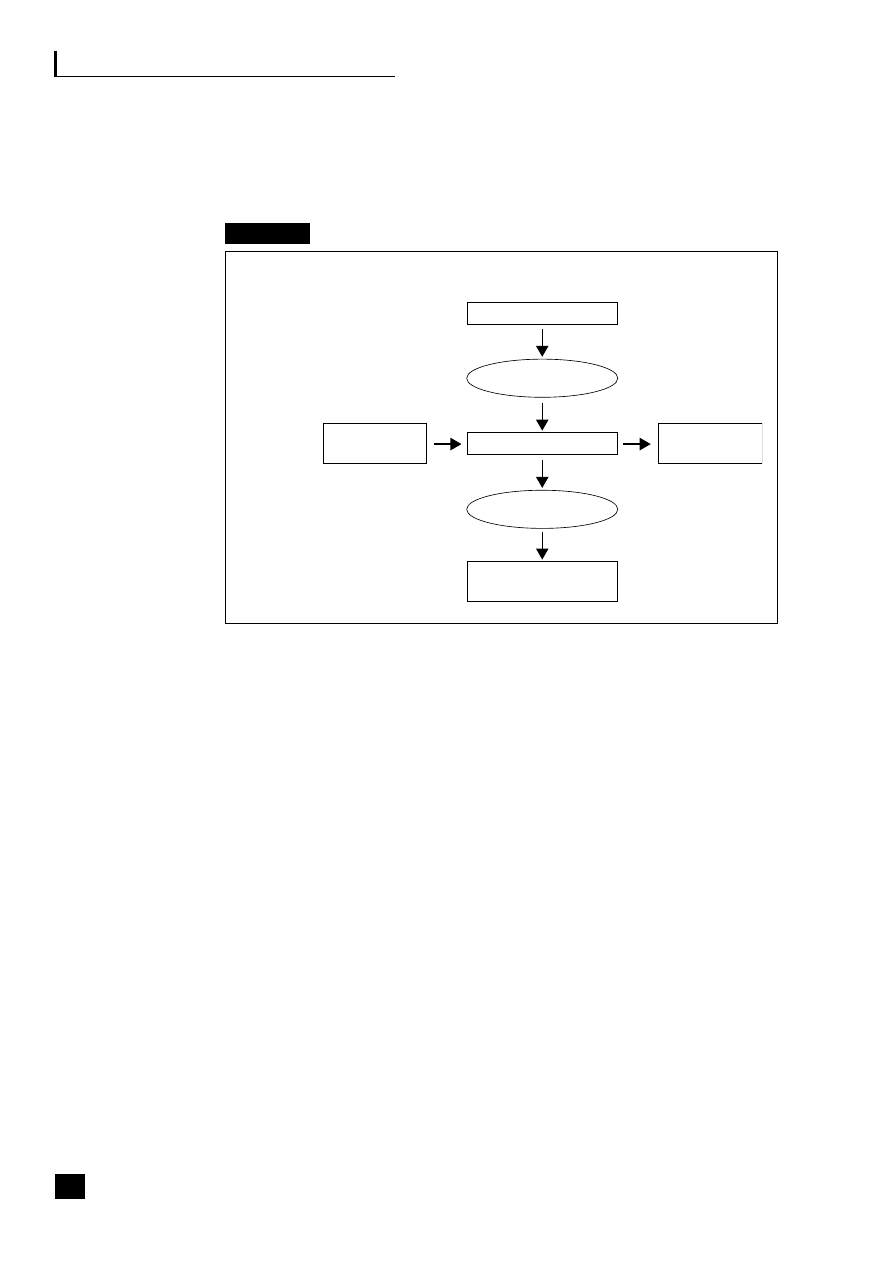
168
Part Four: How to Analyse Business Processes
driver’ refers to what influences or drives the cost of the activity or process and is
used in performance improvement initiatives. This is illustrated in Figure 13.3.
Fig. 13.3
ABC drivers
Wherever possible:
■
Use specific data that relates to consumption.
■
Use data that is already available or collected either manually or by computer,
or can be easily collected by computer if not currently counted.
■
Allocate at as high a level as possible in the activity hierarchy without losing
accuracy, usually at the activity or sub-process level (see Figure 12.2 p. 149).
This ensures that the ABC analysis remains simple and understood by those
who need to use it and that it is not over-complex to maintain, while
maintaining its accuracy.
■
Gain consensus from all parties involved in the allocation on the best method
to be used, in their view. If the data is to be used, their ‘buy-in’ will be needed.
ABC models must not be built in isolation. They need to be understood by
everybody in the organization.
Figure 13.4 is a simplistic example of how resources are allocated to the help-desk
process by resource drivers, then overhead activities are allocated based on
activity drivers. This gives a total cost for the help-desk process and a unit cost
per enquiry dealt with by the help-desk, which can be used to allocate costs to the
"As is"
"Should be"
Resources
Activities/processes
Products/services/
customers
Cost
drivers
Performance
measures
Resource
drivers
Activity
drivers

Activity/process-based costing
final cost object, e.g. a product produced or an E2E process, utilizing the
help-desk. The example points out that there are a small amount of other costs,
termed ‘business sustaining’, that have not been attributed to this or any other
activity because it is not appropriate to do so. Business sustaining costs may
include such things as legal and audit costs and will be collected in a pool at the
centre. The difference between this pool and the pool in the traditional method of
costing, illustrated in Figure 13.2, is that it should be minimal, around 5–10 per
cent maximum, rather than the 50
per cent of the traditional overhead pools.
Fig. 13.4
ABC – help-desk
ABC EXAMPLE
A problem with product costing at an insurance company
General information
To illustrate the benefits of ABC over traditional methods, a simple product costing
example is shown, where a fictional insurance company sells two products, a
‘Regular’ and a ‘Super’ policy. It has traditionally costed its policies on a volume-
based overhead absorption system, using premium income to absorb overhead. It
counts all costs as overhead; there are no direct costs.
169
Direct costs of activities
Resource drivers
Total
Per enquiry £
Personnel costs
Time spent
XXX
XX
Stationery, phone and post
Cost
XX
X
Office equipment/furniture
Depreciation
XX
X
Premises costs
Square foot
XX
X
Travel costs
Cost
XX
X
XXXX
XX
Attributable costs
Activity drivers
Management
No. of staff
XX
X
IT
No. of transactions
XX
X
Payroll
No. of staff
X
X
Purchasing
No. of invoices
X
X
Personnel
No. of staff
X
X
XXXX
XX
Total cost excluding business-sustaining costs
XXXXX
XXX

170
Part Four: How to Analyse Business Processes
Data gathered in the last financial year
Policy
Quantity
Average
Customer
Underwriting
Computer
type
sold
premium*
visits
amendments
enquiries
Regular
70,000
£50
1
1
2
Super
10,000
£100
5
8
6
* Numbers represent income per policy.
Overhead costs gathered by activity
Activity
£000s
Selling
360
Underwriting
300
Computing
140
Premium collection
100
Total costs
900
The questions
1. Calculate unit overhead costs for the Regular and Super policies by the
traditional system based on value of premium income.
2. Using an activity-based product costing method and the data available,
recalculate unit costs on the basis (drivers) that seems appropriate. Explain
your choice of drivers.
3. Indicate the advantages that ABC can provide to aid decision making.
The answers
1. Traditional costing system
Quantity
Unit premium
Premium income
000s
£
£000s
Regular
70
50
3,500
Super
10
100
1,000
4,500

Activity/process-based costing
Overhead costs:
=
900,000
=
20 pence/£ or 20%
Premium income
4,500,000
Unit overhead costs:
Regular
£50
20%
= £10
Super
£100
20%
= £20
2. Activity-based product costing
Overhead
£000s Driver
Freq.
Qty
Cost
Unit cost
Total freq.
Selling
360
No. of customer visits
1
70
360
£3.00
5
10
120
Underwriting
300
No. of amendments
1
70
300
£2.00
8
10
150
Computing
140
No. of comp. enquiries 2
70
140
£0.70
6
10
200
Premium collection
100
No. of policies sold
1
70
100
£1.25
1
10
80
Cost/driver
frequency/unit
Regular
Super
£
£
Selling
£3.00 1
3.00
£3.00
5
15.00
Underwriting
£2.00
1
2.00
£2.00
8
16.00
Computing
£0.70
2
1.40
£0.70
6
4.20
Collection
£1.25
1
1.25
£1.25
1
1.25
£7.65
£36.45
Compared to traditional
£10.00
£20.00
Under (over) costed
(£2.35)
£16.45
3. Advantages
The example illustrates how, by introducing four distinct activities/processes, each
with its own driver or method of allocation, into the methodology and counting the
171
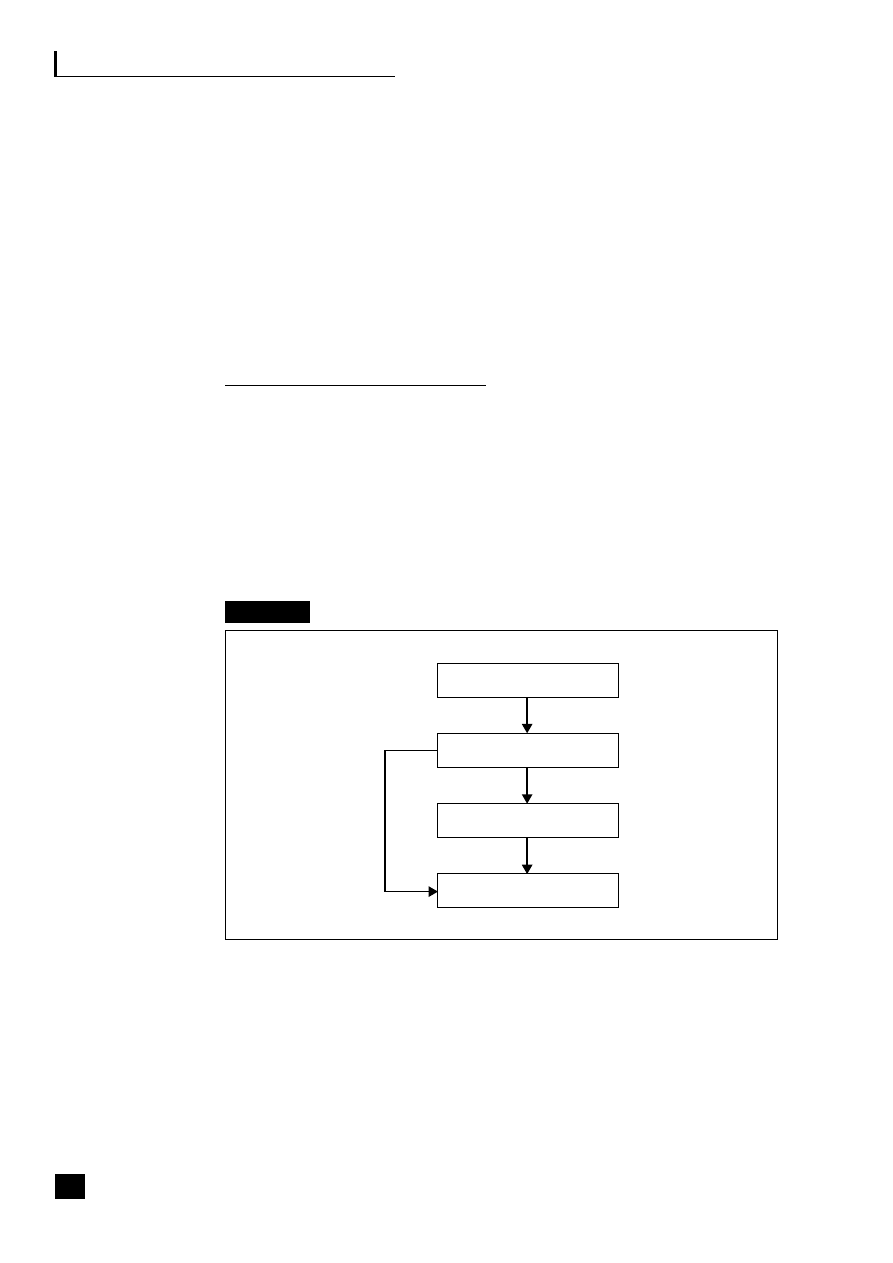
172
Part Four: How to Analyse Business Processes
frequency with which they occurred, it is possible to calculate the unit cost of each
activity/process output. It can then be allocated to the type of policy based on the
number of outputs of that activity that the specific product consumed. This allows
the varying complexity of the different products to be represented within their costs.
As a general rule, high-volume, less complex products tend to be over-costed by
10–30 per cent (in this case 23.5 per cent) and low-volume, more complex products
tend to be under-costed by 50–400 per cent (in this case 83 per cent).
CUSTOMER PROFITABILITY
Figure 13.5 shows the allocation to the fourth dimension of the ABC model,
beyond products and services to markets and customers. By multiplying product
and service costs and revenues by the volume of sales to each customer the true
profitability of each customer can then be ascertained. It will be necessary to
allocate any customer-driven activities directly to the market or customer, e.g. the
activity costs of selling in China would be allocated directly to that market area
and ‘trickle down’ to the customers within it.
Fig. 13.5
Customer profitability
Pricing scenario example
An IT outsourcing company provides operational and support products and
services to clients based on a fixed cost per user, e.g. per PC. After building an
ABC model of the costs of its services and identifying the cost drivers, the
company discovered that the basis of the pricing mechanism, although variable
Resources
Processes/activities
Products/services
Market/customers
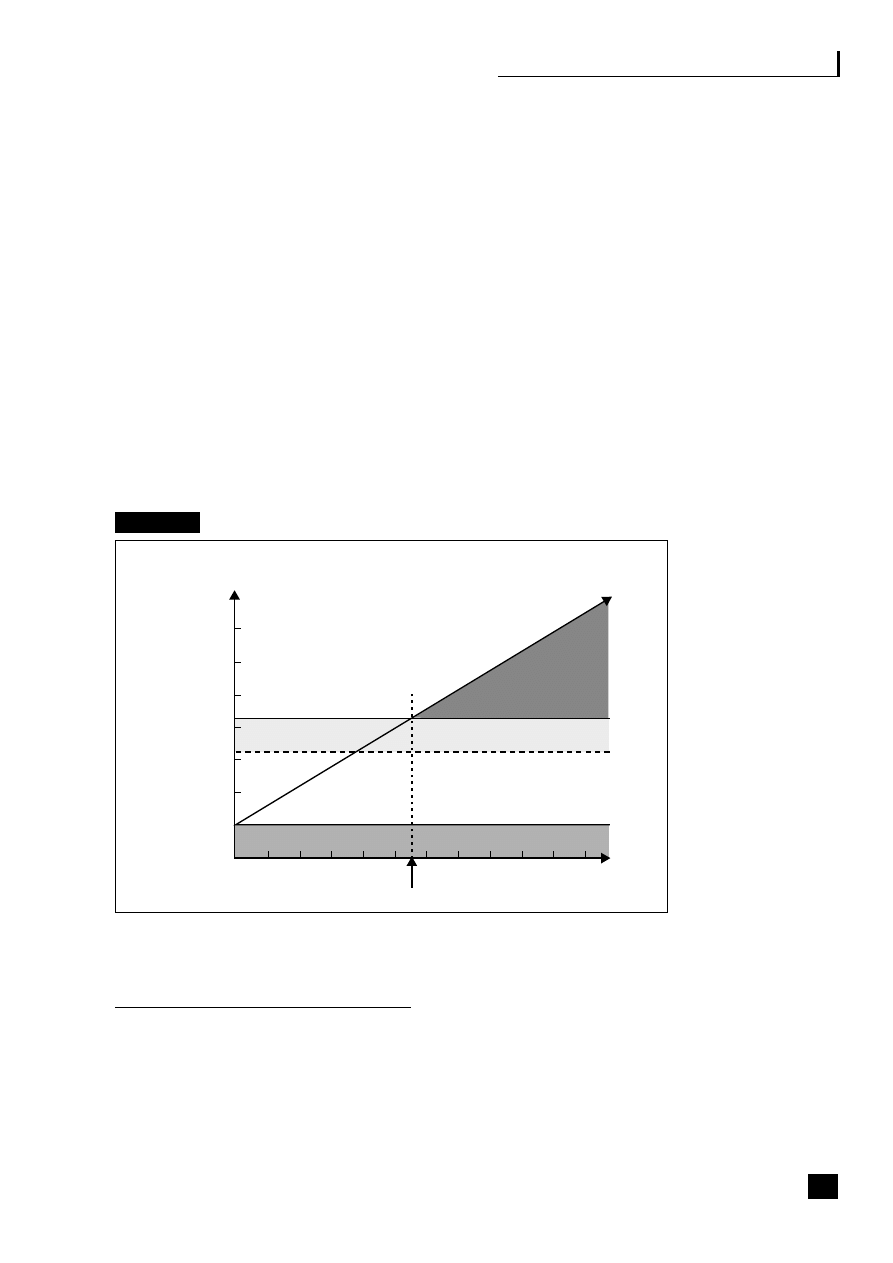
Activity/process-based costing
based on volumes, was often different to the way the costs were being driven, thus
identifying an unnecessary risk. For example, the help-desk support service is
charged on a fixed price per user, but the costs are primarily driven by two
variable cost drivers: the number of calls and the length of calls made to the
help-desk, with a small fixed capital cost per user for the equipment spread over
a number of years.
Figure 13.6 shows at what point, in terms of the number of calls received, the
outsourcer will start to show a loss. The outsourcer’s risk can be reduced by
changing the pricing mechanism to reflect the way the costs are being driven; this
change would also give the customer an incentive to reduce the number of calls
made by its staff, taking responsibility for driving cost. By both parties working in
partnership, through investing in new help-desk technology and undertaking the
training of help-desk staff and system users, the number and length of calls could
be reduced to the benefit of the customer and the removal of risk to the outsourcer.
Fig. 13.6
Help-desk pricing
PROCESS-BASED MODELLING
Software allows complex models to be built and ‘what if’ scenarios to be performed
on them to aid decision making and planning and to optimize performance. It is
enormously powerful to be able to back calculate, by making changes to
product/service volumes and selling prices and simulate the effects on profitability,
173
Loss
Planned profit
Fixed cost of capital over x years
Breakeven point
Fixed income
per user
£
Variable
cost line
Number of calls

174
Part Four: How to Analyse Business Processes
activities/processes and resource utilization, where fixed, variable and semi-variable
indicators can be applied. Sophisticated common data models that can simulate the
workings of the business are essential tools for adding company-wide value and are
discussed further in Transforming the Finance Function.
4
Case study 13.1
Defence Logistics Organization
5
In 1999 the government announced its plans to meld all the logistics and support services
for the country’s Army, Navy and Air Force into one body called the Defence Logistics
Organization (DLO). Its motives were to cut costs. From its inception in April 2000 it was
instructed to reduce its £4.6 billion annual operating costs by 20 per cent by 2005, without
reducing any services provided by its 43,000 staff. The DLO is involved in everything from
supplying uniforms for soldiers to repairing warships. It operates through integrated project
teams (IPT), which are customer-focused. Previous to the merger each service operated its
own logistics services, with maintenance and procurement often outsourced to the 44
agencies that made up the MoD. The DLO recruited PwC and Deloitte Consulting to help it
deliver these targets.
By the end of March 2001, all of its 75 BUs, which are multi-million pound businesses,
had begun using ABC. Before beginning, the DLO had to introduce resource accounting,
which entailed producing a balance sheet for the first time – the previous system measured
units of cash expenditure against annual budgets. The DLO’s ABC roll-out was one of the
first public-sector organizations in Europe to use fully-fledged ERP, so it initially used a stand-
alone package as back-up to mitigate any risks. The migration to the ERP system was
planned for completion by summer 2001. The Army, which started the project in April 2000,
was able to reduce costs even in its first year, particularly in its supply chain efficiency. This
is not the MoD’s first success with ABC – it had been in use by the Defence Evaluation and
Research Agency (DERA) since 1996.

14
Business process
performance improvement
Introduction
177
Activity classification
177
Activity-based cost management
178
Removal of constraints
179
Business process re-engineering
180
■
■
■
■
■
175


Business process performance improvement
INTRODUCTION
The use of activity analysis for improving company-wide performance has been
regarded as good practice since the late 1980s. Its use to remove ‘non-value-
added’ activity was seen as an excellent way of reducing costs, but the early focus
was on activities within functional departments. Each cost centre would analyse
its activities and then classify them.
ACTIVITY CLASSIFICATION
Primary value added or core
These are activities that are ‘essential’ to the being of the organization, delivering
the products or services that denote the business’s existence. They add value and
meet customer needs. When identified, focus on these activities will encourage
enhancement, improvements in effectiveness and variation in levels of service.
Primary non-value added or diversionary
These are activities that are usually considered ‘urgent’ because they result from
failure elsewhere. They are regarded as adding cost without adding value to the
business. This category of activity needs to be eliminated by getting things right
first time, removing unnecessary barriers and improving methods and systems.
Activities classified in this category include:
■
approving
■
filing
■
reviewing
■
preparing
■
inspecting
■
accumulating
■
decanting
■
searching
■
expediting
■
storing
■
moving
■
counting
■
retrieving
■
revising.
177

178
Part Four: How to Analyse Business Processes
Support or secondary
These activities are considered ‘necessary’ to enable core activity to take place.
The focus on support activities is to make them more effective through improved
methods and systems and variations in levels of service and inter-business unit
charging, which is discussed in Transforming the Finance Function.
1
ACTIVITY-BASED COST MANAGEMENT
After conducting classification or value analysis, early activity-based cost
management (ABCM) programmes would hold workshops to discuss the analysis
and find improvements by focusing on the elimination of non-value-added
activities at:
■
cost-centre level;
■
departmental level;
■
corporate level.
The understanding of what activities are performed, their classification, their cost
make-up and their unit costs allows their cost drivers to be identified, i.e. those
factors that drive or influence costs. For example, in Finance such influences
might be:
■
system availability;
■
number of cost centres;
■
number of ad hoc requests;
■
changing business requirements;
■
number of upgrades made to systems;
■
number of system users.
Cost drivers, i.e. influencers of cost, are not to be confused with methods of
allocation used in activity-based costing, which are known as activity drivers. Typical
activity drivers in Finance would include:
■
number of sales invoices;
■
number of purchase invoices;
■
number of cost centres;
■
number of reporting periods;
■
number of customers;
■
number of suppliers;

Business process performance improvement
■
number of PCs;
■
number of system users.
REMOVAL OF CONSTRAINTS
The result of a functional focus was that activities were optimized within their
function, irrespective of the effect on the rest of the business. An example would
be where attention is focused on the activity ‘after-sales service’, which forms part
of the engineering department (see Figure 14.1). Improvements within the function
would focus on quicker response times to customer calls or a faster repair cycle,
not on the cause of the fault which requires repair. The fault may go back in the
value chain to:
■
distribution – there might be problems with packaging or delivery;
■
production – there may be problems with manufacturing;
■
procurement – the wrong or substandard materials may have been purchased;
■
sales – the order may have been wrongly processed;
■
development – the design of the product may be the cause of the need for ‘after-
sales service’.
Fig. 14.1
Value chain
As a result, in the early 1990s it was realized that such performance-improvement
initiatives should focus on processes, irrespective of functional boundaries; hence
the birth of business process redesign and its big brother, business process
re-engineering (BPR). The latter is where an organization also looks at all outside
influences to find more innovative solutions – E2E processes would be an example.
Johnson emphasized the need to remove constraints, i.e. practices and assumptions
that cause delay, excess and variation of processes that cause further work, not to
optimize within them.
2
He questioned the categorization of non-value-added tasks
179
Development
Design
of
product
Sales
Order
processing
Procurement
Purchasing
of
materials
Manufacturing
Production
and QA
Distribution
Packing
and
delivery
Engineering
After-sales
service

180
Part Four: How to Analyse Business Processes
as ones that must be removed and instead argued that, if the activity was being
performed, then it was considered essential within the constraints that management
had laid down for performance of that activity. The insistence of ABCM teams in
asking workers to categorize their work as ‘non-value-added’ activity proved
counter-productive and demotivating to staff. Activity categorization is still useful
within project teams, but the use of the alternative descriptions ‘core, diversionary
and support’ are less emotive and are recommended.
BUSINESS PROCESS RE-ENGINEERING
Introduction
While activity classification or value analysis still has its place within project
teams, the focus of business improvement initiatives is now rightly directed at
processes and the removal of constraints. Business process re-engineering (BPR)
has acquired something of a bad reputation since it was first proposed by
Hammer and Champy in the early 1990s.
3
A statistic often quoted was that ‘seven
out of ten BPR projects fail’, without any clear definition of what constituted
either BPR or failure. The principle of examining processes to see if they can be
improved by redesign is sound, but like all projects it should have clearly defined
objectives and senior management backing to carry through those objectives, even
if this is sometimes politically difficult. The management of change is dealt with
separately in Chapter 15.
Analysing the flow of activities within a business process can help to identify:
■
duplication
■
missing activities
■
wasteful activities
■
over-bureaucratic procedures
■
bottlenecks
■
measurement of each activity within the process.
Steps in a BPR programme
■
Decide on the processes to be examined and their order of priority.
■
Appoint a process-review project team, comprised of representatives of all parts
of the process to be examined, including external in E2E processes.
■
Carry out hierarchical process analysis as explained in Chapter 12 (p. 148–50).
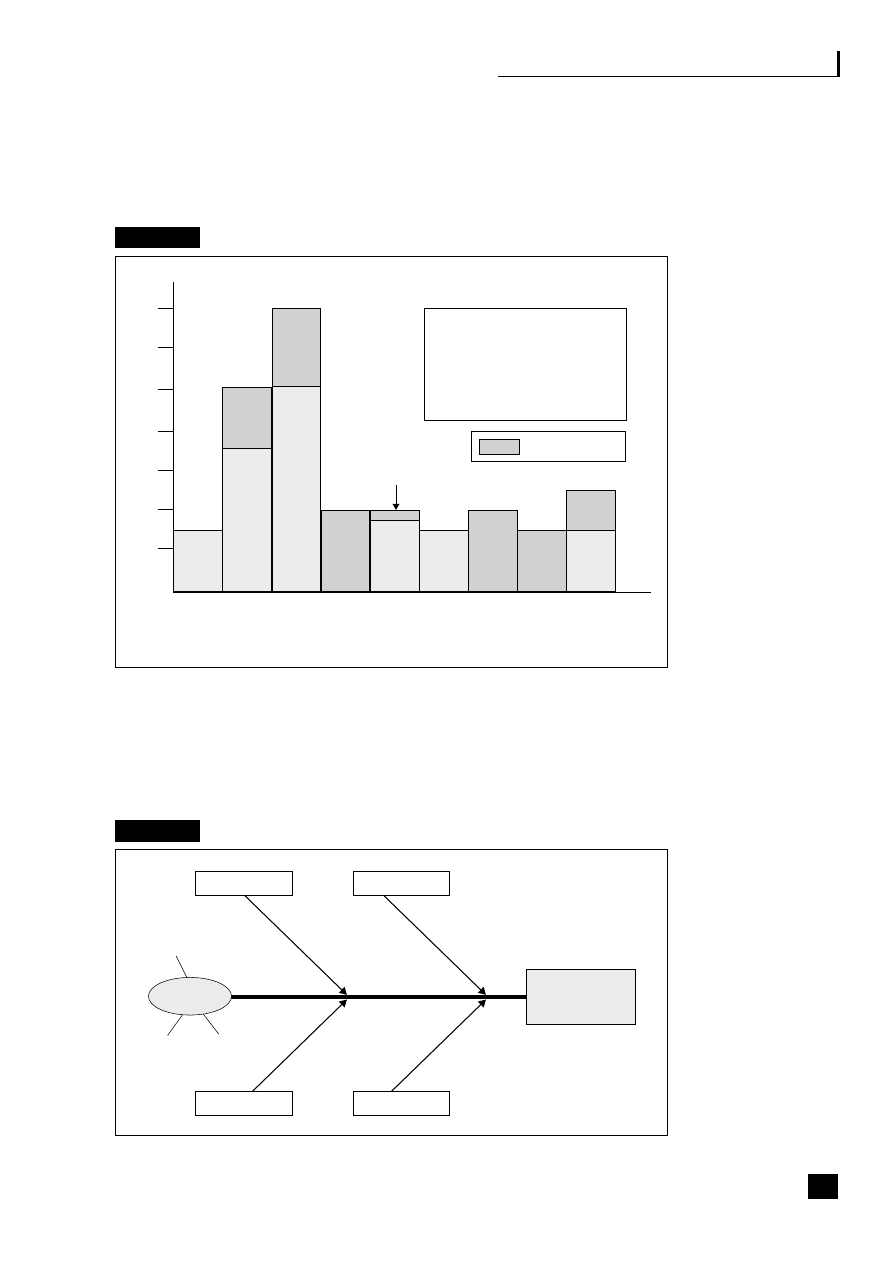
Business process performance improvement
■
Draw process maps and graphics, showing flows, costs, cost drivers, value
analysis and functional and geographic boundaries (see Figure 14.2).
Fig. 14.2
The procurement process (£1.1 million)
■
Use other tools and techniques to illustrate all of the factors relating to the
particular process under examination. See, for example, Figure 14.3, cause and
effect analysis, for brainstorming and analysis. This figure has been used to depict
the technique while reminding analysts of the areas of improvement to look for.
Fig. 14.3
Cause and effect analysis
181
£k
350
300
250
200
150
100
50
Cost drivers
£k
Poor supplier relationships
227
Large no. of items
216
Goods received procedures
157
Large no. of suppliers
92
Non-value added
Receive
rejected
goods
Resolve
vendor
problems
Expedite
and
rework
PO
Expedite
orders
Process
rejected
goods
Matching
Potential
quality
problem
Produce
tentative
delivery
schedule
Negotiate
terms
with
suppliers
Raise
purchase
orders
Expedite
orders
Receive
goods
Update
inventory
control
system
Inspect
goods in
Process
rejected
goods
Pay
vendor
invoices
1. STRATEGY
3. INTEGRATE
2. SIMPLIFY
Vision
Business
strategy
Mission
Guiding
principles
Values
Quality
Low cost
Flexibility
Speed
Dependability
Robots
Computers
Marketing
strategy
Operations
strategy
Eliminate waste
IMPROVED
BUSINESS
PERFORMANCE
4. AUTOMATE
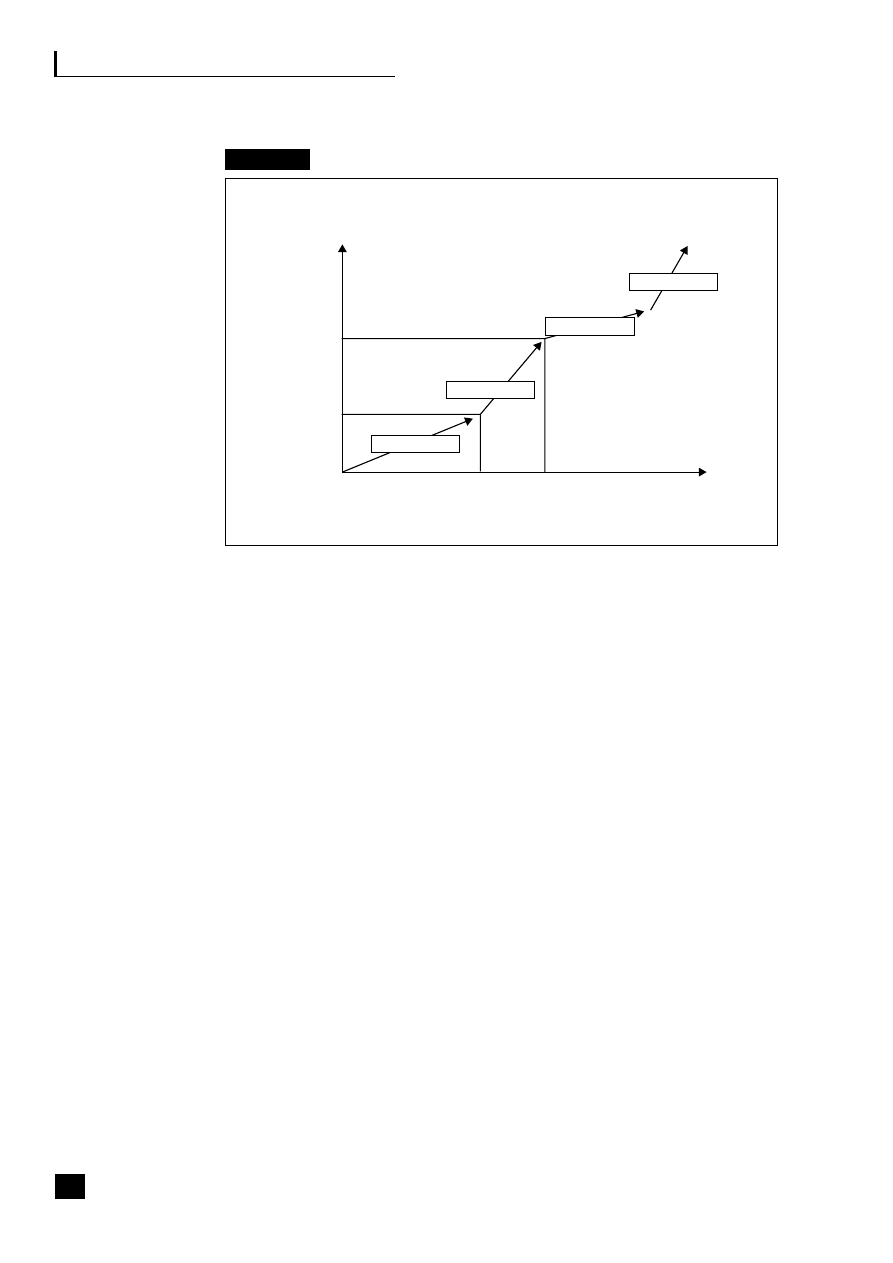
182
Part Four: How to Analyse Business Processes
Fig. 14.4
Process improvement lifecycle
Figure 14.4 on the other hand, illustrates the effect of performance improvement
ideas on the process. Some 90 per cent of ideas from these initiatives are small
and easily implemented, while 10 per cent are larger and require more radical
change, such as a new computer system.
■
Hold brainstorming workshops to discuss and agree changes and establish best
practice within the process. The project leader should never attempt to tell the
process representatives directly what they are doing wrong or it is probable that
the ‘not invented here’ syndrome will be encountered. Allow the project team
to draw its own conclusions from the information presented.
■
Set implementation and performance targets and responsibilities and monitor
progress.
Benefits of BPR
■
Brings about a better understanding of the relationships between
activities/processes allowing a radical rethink of how they are performed.
■
Ideas for improvement are identified by people within the process, who are
motivated to implement the changes.
■
Is a cross-functional project which helps to improve communications throughout
the business.
■
All levels of staff are involved in the process, encouraging ownership and
accountability for performance.
Improvement
World
class
Now
Improvements to
existing processes
Radical
reshape
Time
Cost effective/
competitive
Evolutionary
Revolutionary
Evolutionary
Revolutionary

Business process performance improvement
■
Commitment to continuous improvement is built at all levels in the organization.
■
Identifies priority services and any ‘gaps’ in the process.
■
Enables the evaluation of alternative service levels.
■
Facilitates comparison of costs with other similar organizations (benchmarking).
4
■
Allows the examination of the effectiveness of all services to be evaluated,
including support services.
■
Enables value for money or best value to be demonstrated.
Case study 14.1
Asea Brown Boveri
5
Background
Asea Brown Boveri
5
(ABB) is a global $30 billion engineering and technology group serving
customers in electrical power generation, transmission and distribution; automation; oil, gas
and petrochemicals; industrial products and contracting; and financial services. ABB
employs 200,000 people in over 100 countries.
ABC and BPR project objectives
True to its tradition of innovation and leadership, ABB launched a company-wide ABC project
in 1996. Volker Hevler, Vice-President and Project Manager ABC Group based at ABB
headquarters in Zurich, Switzerland says that the decision taken was to implement ABC as
ABB’s common costing method throughout the world by the end of 2000. He stated that:
The decision to go for ABC represented a corporate concern and priority to, at the end
of the day, further our competitiveness in an increasingly global and competitive
marketplace. We set our sights very high from the start – ABC must cover the entire
group and include full management buy-in and commitment. It is not sufficient to use
ABC in your current cost accounting system or to use it as a parallel tool. Rather you
must do it by the book and progressively.
One reason behind this decision was the recognition that there had been a significant
change in the make-up of product costs during the preceding three decades. Indirect costs
are now a larger proportion of the whole and there is a need to find a better way of assigning
those costs than purely by percentage allocation (see Figure 13.1, p. 163).
ABB’s objectives were fourfold:
■
to cost and price products better by assigning many more indirect costs to products and
services than can be achieved with traditional cost accounting;
■
to enable better management with thorough analyses and insights into activities and
processes;
■
to use ABC as a tool for change management in the organization and its processes;
■
to facilitate strategic decision making based on relevant cost calculations.
183

184
Part Four: How to Analyse Business Processes
Methodology
The analysis was aided by the use of a software tool from Sweden chosen by ABB to provide
an ABB-tailored solution for use as a standard worldwide.
Although the project was defined and driven by the Central Project Group, the execution
and implementation were the responsibility of each country’s management. Local projects
in the operating companies were led by experienced certified facilitators. The UK ABC
manager, Andy Daniels, was responsible for 29 projects running in 18 operating units,
assisted by ten trained facilitators.
One of the benefits of a standard methodology is the ability to offer cross-border support,
e.g. teams from the UK successfully worked on projects in both the US and Turkey. This not
only overcame resource problems but created the opportunity to share experiences.
Project stages
■
Stage 1 involved the analysis of processes and activities in the business followed by
optimization of those processes; in addition, data was gathered about cost drivers,
business volumes and resources. This involved interviews with all members of staff to
ascertain the type of work done. This created a detailed picture of the business when
combined with the relevant financial information and enabled selection of the key
processes that would offer the greatest opportunity for improvement.
These processes were mapped in detail in two forms:
– ‘as is’ – how the work is actually done now;
– ‘should be’ – the optimized way of performing the work.
In order to move from the ‘as is’ situation to the ‘should be’, an action plan was
developed and implemented. This key step involved the creation of cross-functional
teams, who actually worked in the process and experienced the day-to-day problems.
This also served as a good teambuilding and learning experience.
■
Stage 2 used the data from Stage 1 and developed an integrated cost accounting solution,
which resulted in the regular reporting of financial performance using ABC as the base.
Company A implementation
Andy Daniels explains:
Experiences of Stage 1 projects in the UK were generally favourable, with many good
examples of employee-driven change. However, not all projects were a success and
there were lessons to be learned from both the successes and the ‘non-successes’,
where the results could be better with improved focus.
One of ABB’s success stories in the UK is Company A, which is involved in the management
of large-value projects and the subsequent provision of spares. Created by the merger of
two divisions following an acquisition, there were a number of cultural differences to
overcome, as well as the inefficiencies of duplication. From the first meeting, management
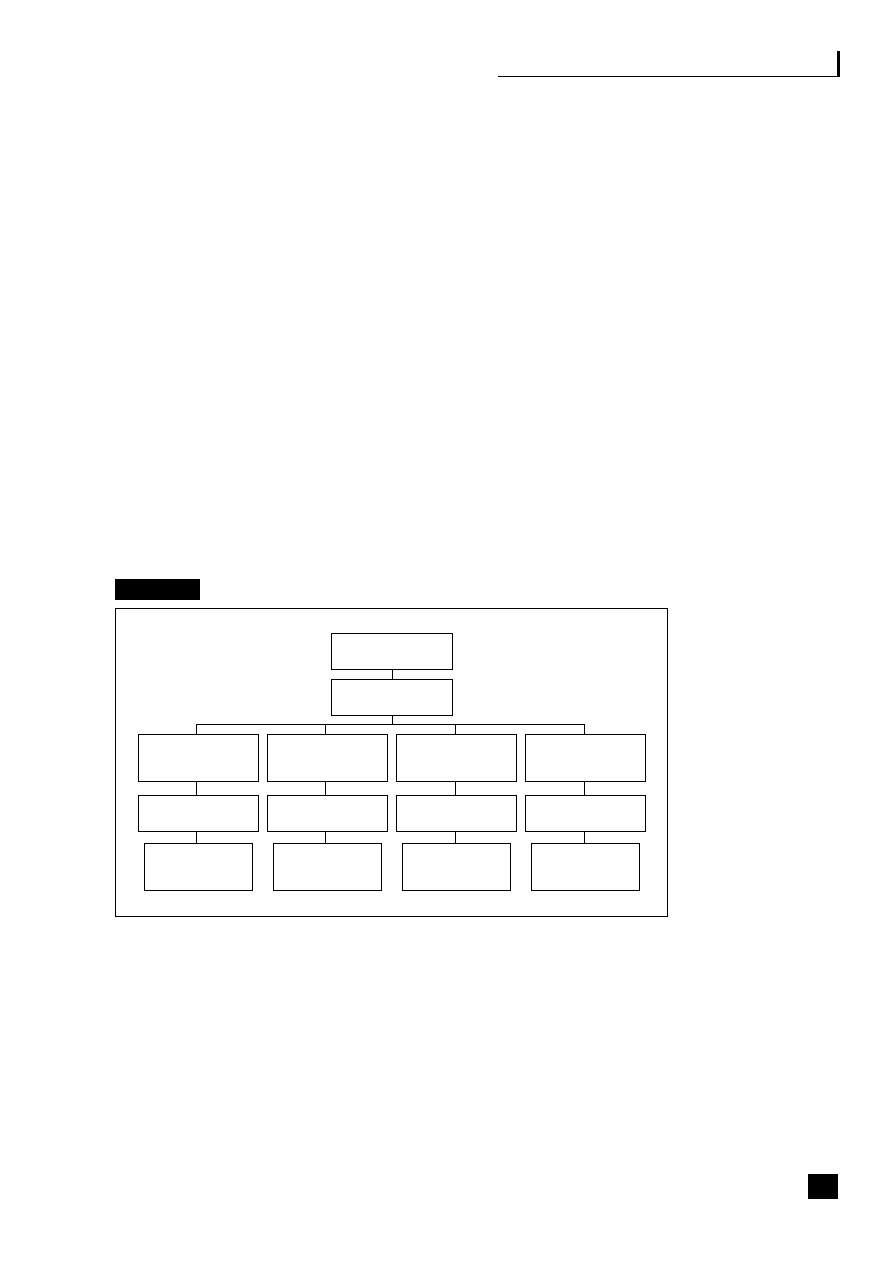
Business process performance improvement
recognized the benefits that could come from the project and made a firm commitment to
ensure success. This positive message was sent throughout the company and helped to
overcome the sceptics.
The initial analysis identified that three out of 17 processes accounted for over 50 per
cent of the indirect cost base – clearly, these were the areas on which to focus. Teams were
set up to map the processes, ensuring that the make-up was representative not only cross-
functionally but also cross-business unit. The outcome was a common set of
recommendations for change, which were presented to management. It was clear from
these recommendations and the initial analysis that there were significant opportunities for
savings. However, there was still a degree of scepticism that anything would be done with
this information, previous initiatives having suffered from poor follow-up.
Management’s response to this was to appoint a company coordinator with responsibility
for ensuring that the opportunities became reality. A team structure was put in place to
ensure continuity with the mapping teams and also to involve as many people as possible,
as illustrated in Figure 14.5. Each of the five teams was tasked with looking at one of the
key improvement areas – setting targets and timescales that were acceptable to both staff
and management. The role of management became one of support rather than execution:
making time (a scarce resource) available for more team meetings.
Fig. 14.5
ABB – ABC working team structure
One common failing of ‘improvement’ initiatives is that they are not coordinated with the
overall business plan, leading to confusion and frustration. Company A has sought to
overcome this by putting in place a link between the business plan, the improvement plans
and individuals’ objectives. This link is created through the improvement teams and an
appraisal scheme, which in turn is the basis for the training plan, as seen in Figure 14.6.
185
Managing Director
Sponsor
New position:
ABC Coordinator
Nine improvement areas
currently under review
Eight improvement areas
currently under review
Eleven improvement areas
currently under review
Two improvement areas
currently under review
Procurement/Project
Management
Team Leader 1
Engineering
Team Leader 2
Tendering
Team Leader 3
Site Services
Team Leader 4
Improvement areas
assigned to
personnel
Improvement areas
assigned to
personnel
Improvement areas
assigned to
personnel
Improvement areas
assigned to
personnel
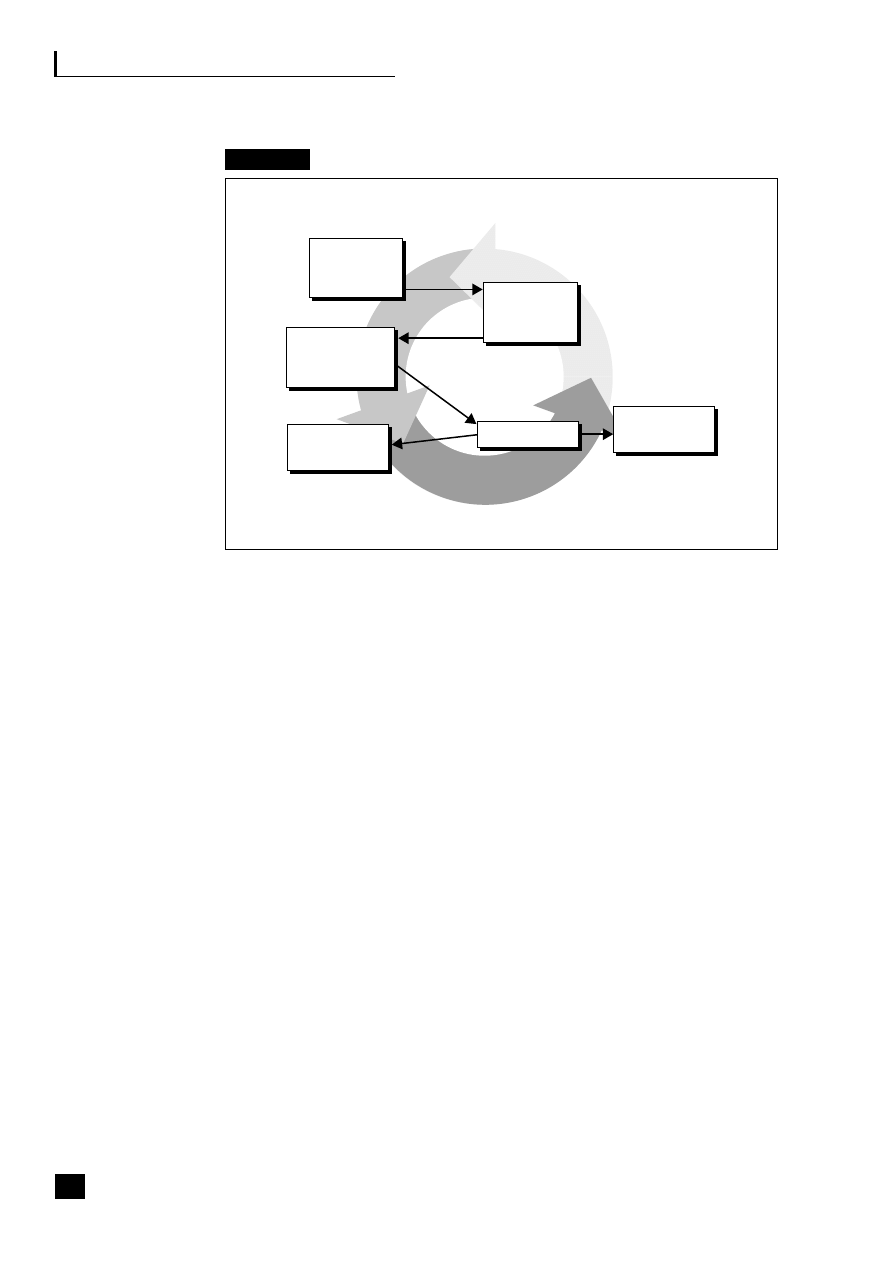
186
Part Four: How to Analyse Business Processes
Fig. 14.6
ABB – linking the plans
Measures of success for Company A
External
The real test of any project is whether the changes bring results, especially in the area of
customer relationships. For this company, the proof came when it applied its new optimized
tendering process to a customer enquiry that it had no real prospect of winning – all previous
bids to this customer having produced no orders. Resources were assigned to follow the
new process and the bid was submitted. Despite not being the lowest price, the contract
was awarded to ABB on the strength of the quality of the bid.
Internal
The project has brought about change in a number of ways. Previously two engineering
departments worked separately with different standards, mainly for historical reasons (the
‘but we’re different’ syndrome). The experience gained from working together during the
process mapping sessions demonstrated that the differences were more perception than
reality. There is now one engineering department working to common standards.
Keys to success at Company A
■
Early buy-in from general manager.
■
Strict adherence to timetable, demonstrating commitment.
■
Teams working on own initiative.
■
Additional mapping sessions facilitated locally.
■
Separate engineering departments brought together using common working practices.
■
Used as introduction to form strategic alliance with key customer.
Training
plan
Company
business
plan
ABC
working
teams
Process
improvement
plans
Individual
objectives
Appraisals

Business process performance improvement
Conclusions
Keys to success of the overall project
■
Buy-in from senior management – not just lip service.
■
Experienced facilitator(s) to lead the project – overcomes resistance at all levels.
■
Dedicated resources to work on project – keep to agreed timescales.
■
Structured approach to improvement opportunities – look for the quick wins.
■
Communicate, communicate, communicate – people are more comfortable when they
know what is happening, even if it is bad news.
It was essential that to gain the maximum benefit from the new measurements that ABC
brought, it was necessary first to change the way in which the business was managed.
Simply implementing a new costing system would not improve the business. Likewise,
optimizing your processes without ongoing, meaningful measurements would not bring
about lasting change and real business improvement. Finally, without the active support
from senior management the chances of success would have been reduced considerably.
187


15
Change management
Introduction
191
Achieving successful change
191
How not to do it
193
Qualities of a change agent
195
■
■
■
■
189


Change management
INTRODUCTION
In 1995, 62 per cent of UK managers were affected by some sort of organizational
change programme; in manufacturing and financial services, it ran at 75 per cent;
in utilities it reached 90 per cent.
1
In the twenty-first century change is a constant.
For organizations which manage change skilfully, it can become the driving force
that perpetuates success and growth, with every change presenting a new
opportunity to increase efficiency or to build the business. But all too often change
fails as companies do not rise to the challenges it brings.
The reasons for failure often come from within the company:
■
misunderstanding of what change is – it is a process not an event;
■
lack of planning and preparation – provide skills and training;
■
goals are set too far in the future – short-term wins are important;
■
complacency – the belief that past success was based on how things are done;
■
employee resistance – a combination of inertia, scepticism, fear and
misunderstanding;
■
Risk-averse, blame culture – fear of failure.
The move from top-down command and control culture to an empowered bottom-
up approach through the 1980s and 1990s has led to great success for those
organizations which have made the change successfully.
2
Equally, the move from
functional to process management now underway in E2E process organizations is
challenging and demands the use of active change management.
ACHIEVING SUCCESSFUL CHANGE
ABC and BPR have received much bad press in the past, with high failure rates
reported. Like all the techniques and tools explained in this book, their success
depends entirely on how they are implemented. Far too many of these initiatives
were, in the past, regarded as mechanical exercises, often undertaken by engineers
or accountants with little or no regard for the human component. The success of
change using BPR and other techniques is dependent on involving staff at all levels,
gaining their ‘buy-in’ and commitment, selling them the benefits, allaying their
fears about job losses that may result, to gain their trust and cooperation. Such
involvement, commitment and support are needed as much from middle and senior
management as from the staff performing the work. Far too many traditional
managers see change and new ideas as threats to their security and, even worse, as
personal criticism of their existing systems. All of these problems need to be
understood and dealt with when making any of the changes discussed in this book.
191

192
Part Four: How to Analyse Business Processes
It was Machiavelli who said:
Change is difficult – those who stand to lose will resist, while those who
stand to gain don’t know it yet.
Figure 15.1 shows the normal negative reaction of those who are subjected to change.
The speed at which people move from shock to acceptance will vary considerably
from person to person. Nick Obolensky says that resistance is a natural occurrence
– to overcome it, one must motivate changes in people’s behaviour.
3
Fig. 15.1
The impact of change
Techniques to motivate change in behaviour
■
Bring resistance to the surface and continually gauge readiness for change.
■
Create and maintain dissatisfaction of the status quo.
■
Generate new training for new skills.
■
Allow participation in planning and implementing change.
■
Reward required behaviour and results in the transition and future states.
■
Provide time for people to disengage from the current state.
■
Use pilots and reposition the remainder.
■
Burn bridges and build ambassadors.
■
Actively manage in/out-placement in a firm, clear and sympathetic way.
Anger
Negotiation
Realisation
Depression
Rationalization
Acceptance
Shock
Denial
Impassive
Neutral
TIME
F
E
E
L
I
N
G
S
Emotional

Change management
SMART objectives
■
S
Specific
■
M
Measurable
■
A
Achievable
■
R
Results oriented
■
T
Time specific
The culture change process
■
Use cross-functional project teams throughout the process.
■
Use workshops to build consensus, awareness, commitment and feedback.
■
Use facilitators widely to assist smooth implementation.
■
Employ training seminars to develop new skills and attributes.
■
Establish a team to act as a focal point of change and learning.
■
Use a values statement (ten commandments) to summarize needed behaviours.
■
Communicate – use a wide range of media, manage the communications process
and remember: actions speak louder than words, so lead by example!
How to motivate your staff
4
■
Direction – clear direction reduces uncertainty and gives meaning to people’s
work.
■
Job clarity – clear and achievable goals.
■
Client focus – meeting clients’ needs creates a sense of purpose and is rewarding.
■
Competence – the skills and knowledge to do the job.
■
Resources – right resources to do the job.
■
Empowerment – sense of freedom to make choices and take control of
environment.
■
Involvement – involvement engenders commitment.
■
Cooperation – relaxed and non-competitive working relationships.
■
Feedback – lets people know how they are doing and what they need to learn.
■
Recognition – the emotional side of feedback.
HOW NOT TO DO IT
Figure 15.2 is a humorous reminder and warning about the way in which projects
need to be undertaken effectively with the right leadership.
193

194
Part Four: How to Analyse Business Processes
Fig. 15.2
The boat race
MEMORANDUM
To:
Whom it may concern
From:
Management, Chicago
Date:
May 1999
Subject:
ANNUAL BOAT RACE, Lake Michigan Marina
Company A and Company B decided to have a competitive boat race on Lake
Michigan. Both teams practised hard and long to reach their peak performance. On
the big day they were as ready as they could be.
RESULT:
Company A won by a mile.
Afterwards, Company B’s team was very discouraged by the loss and morale sagged.
Corporate management decided that a reason for the crushing defeat had to be found.
Subsequently, a task force comprised of key executives, called the ANALYSIS OF
SUPERVISORY SYSTEMS for EXECUTIVES and SUBORDINATES (A.S.S.E.S.), was formed
to investigate the problem and recommended the appropriate corrective action.
THE A.S.S.E.S.’ CONCLUSION
The facts indicated that both teams had nine people involved in the contest. However
the distribution of duties differed considerably. Company A’s team had eight people
rowing and one steering, whereas Company B had eight people steering and one
person rowing. The task force concluded that it was obvious that the loss was due to
poor rowing staff performance.
THE A.S.S.E.S.’ RECOMMENDATION
To prevent this from happening next year, the person rowing the boat should work
harder to be a premier performer during the next evaluation period. To reach this goal,
the steerers should delegate authority and give the staff rower empowerment to do
better. The rower should be placed on progressive discipline.
RESULT OF THE NEXT YEAR’S RACE: Company A won by two miles.
Company B’s management laid off the rower for poor performance, sold the paddles,
cancelled all capital investment for new equipment, halted development of new
canoes and distributed money saved as a bonus to senior executives for the risks they
had taken.

Change management
QUALITIES OF A CHANGE AGENT
Skills
■
Technical expertise, skills and competencies (has credibility)
■
Oral and written communication skills and presentation skills
■
Interpersonal competence in influencing and motivating
■
Decision-making capability
■
Negotiation skills
■
Problem-solving skills
■
Leadership ability
■
Teamworking skills
■
Good at organizing and deploying resources
■
A good project manager
■
Experience, track record, maturity, rounded
Characteristics
■
Assertive, willing to pressure others
■
Quick thinking, decisive
■
Energetic, enthusiastic, committed, positive
■
Mature
■
Creative ‘on the hoof’
■
Charismatic
■
Sensitive to change
■
Confident but not arrogant
■
Articulate and clear
■
Approachable, open, good listener, sense of humour
■
Logical thinker
■
Adaptable, flexible, innovative
■
Honesty, integrity, trustworthy, reliable and sincere
■
Diligent
■
Thick-skinned, tenacious, not easily intimidated
■
Patient and persistent
■
Politically aware
195

196
Part Four: How to Analyse Business Processes
Leadership qualities
The definitive quality that sets leaders apart is their ability to inspire willing
followers. Leaders who inspire and deliver do not do it alone. Qualities they
exhibit include:
■
inspires rather than drives people;
■
commands rather than demands respect;
■
has a deep interest in people;
■
radiates support not fear;
■
depends on personality and goodwill not rank and authority;
■
coaches and encourages rather than directs and bullies;
■
generates other people’s ideas instead of enforcing own ideas;
■
is quick to understand, not to judge;
■
helps people to plan to meet objectives rather than enforces deadlines;
■
shows what is wrong rather than who is wrong;
■
focuses on effectiveness not efficiency;
■
relies on trust rather than control;
■
walks the talk.
The art of facilitation
■
Supporting
–
listening
–
clarifying
–
providing equal time
–
confronting distractions
–
respecting ‘air time’.
■
Leading
–
agreeing outcomes
–
focusing discussion
–
managing time
–
encouraging participation
–
displaying enthusiasm and action.
■
Exemplifying
–
providing congruence
–
showing openness
–
exhibiting candour with sensitivity
–
walking the talk
–
role playing.

Change management
■
Normalizing
–
positive conflict management
–
even handed and unbiased
–
awareness of personal agenda
–
use of humour
–
de Bono’s six hats.
Case study 15.1
GE
We spend a lot of time with our people. The day we screw up the people thing, this
company is over.
So said GE CEO, Jack Welch, who receives volumes of information from multiple sources,
tracking executives’ progress in detail: feedback is specific, constructive, to the point. When
committing to Six-Sigma quality, he confronted senior executives whose beliefs did not align
with the values required and told them GE was not the place for them.
197


16
Business process
performance management
Introduction
201
Process-based budgeting
201
Objectives and responsibilities
203
Balanced performance measures and targets
204
Evaluation of alternative service levels
206
Priority-based budgeting
206
Process/activity-based monitoring and reporting
210
■
■
■
■
■
■
■
199


Business process performance management
INTRODUCTION
In Chapter 2, Figure 2.2 (p. 20) illustrates the need to link the organization’s value-
based strategy via the balanced scorecard to operational, quality and performance
management systems, which ‘drill down’ through the organization and include
balanced measures of cost, quality and time for each process and activity. One holistic
performance management system should emerge hand in hand with the development
of one corporate information system. Process-based management (PBM) is the
management and control of the company using P/ABT.
The P/ABT discussed in this chapter relates not to one-off initiatives like ABC or
BPR, but to an ongoing planning, monitoring and control system that facilitates
controlled continuous improvement company-wide. The use of one-off P/ABT to
inform and reduce costs can be likened to a crash diet – weight is noticeably lost,
but once you are off the diet the weight quickly returns. The need to maintain the
necessary weight loss requires a recognition that a complete change of eating habits
and lifestyle is required and that is what the use of PBM provides for a business.
PBM is a series of related management techniques based on process/activity
analysis, including:
■
process-based budgeting;
■
cascading of objectives and responsibilities down the organization through
processes and activities;
■
setting of a balanced set of performance measures and targets – cost, time and
quality – for each process and activity;
■
ability to evaluate alternative levels of service;
■
priority-based budgeting;
■
process/activity-based reporting, including earned value analysis;
■
Six Sigma;
■
benchmarking;
■
cause and effect analysis;
■
process-based accounting;
■
ABC;
■
BPR;
■
E2E process management.
PROCESS-BASED BUDGETING
Having carried out the necessary process/activity analysis and fully understood how
the business operates, it is then possible to plan, monitor and control the entire business
based on the activities and processes that are performed. The traditional approach to
201

202
Part Four: How to Analyse Business Processes
budgeting looks simply at cost elements, e.g. how many people, how much office space
and how much other resource is required to run a budget centre (see the companion
publication Transforming the Finance Function and the section on beyond budgeting,
for more details on this subject).
1
The process-based budgeting approach allows us to
examine exactly what activities are performed within the process and what resources
are consumed by each activity, as can be seen in Figure 16.1.
Fig. 16.1
Activity budgeting
By understanding not only what each activity costs to perform, i.e. what resources
it has consumed, but also what outputs it produces, e.g. how many systems are
being developed, enabling examination of the unit costs, quality and time
measures per activity output. This effectively enables us to:
■
make comparisons to other similar activities both internally and externally, i.e.
benchmarking;
■
set measurable objectives and responsibilities for all activities/processes (support
and operational) linked hierarchically to the corporate strategy;
■
set performance measures and targets for the planning period, linked hierarchically
to the balanced scorecard, incorporating non-financial and qualitative measures as
well as quantitative;
■
set a clear link between, and vary the budget for, resources consumed in
relationship to outputs produced;
■
examine alternative service levels for activities and processes and prioritize their
importance to the business, allowing reductions in budget to be made on a basis
that relates to the importance to the business, in preference to the traditional
‘across-the-board’ cuts irrespective of the medium- and long-term effects, i.e.
priority-based budgeting (PBB);
System design and delivery sub-process
Cost element report
£k
Staff salaries
500
Equipment 600
Consultancy 150
Office expenses
100
Premises 90
1,440
Activity-based report
£k
Business analysis
230
System development
250
System testing
190
System assurance
100
Documentation 70
System delivery
600
1,440
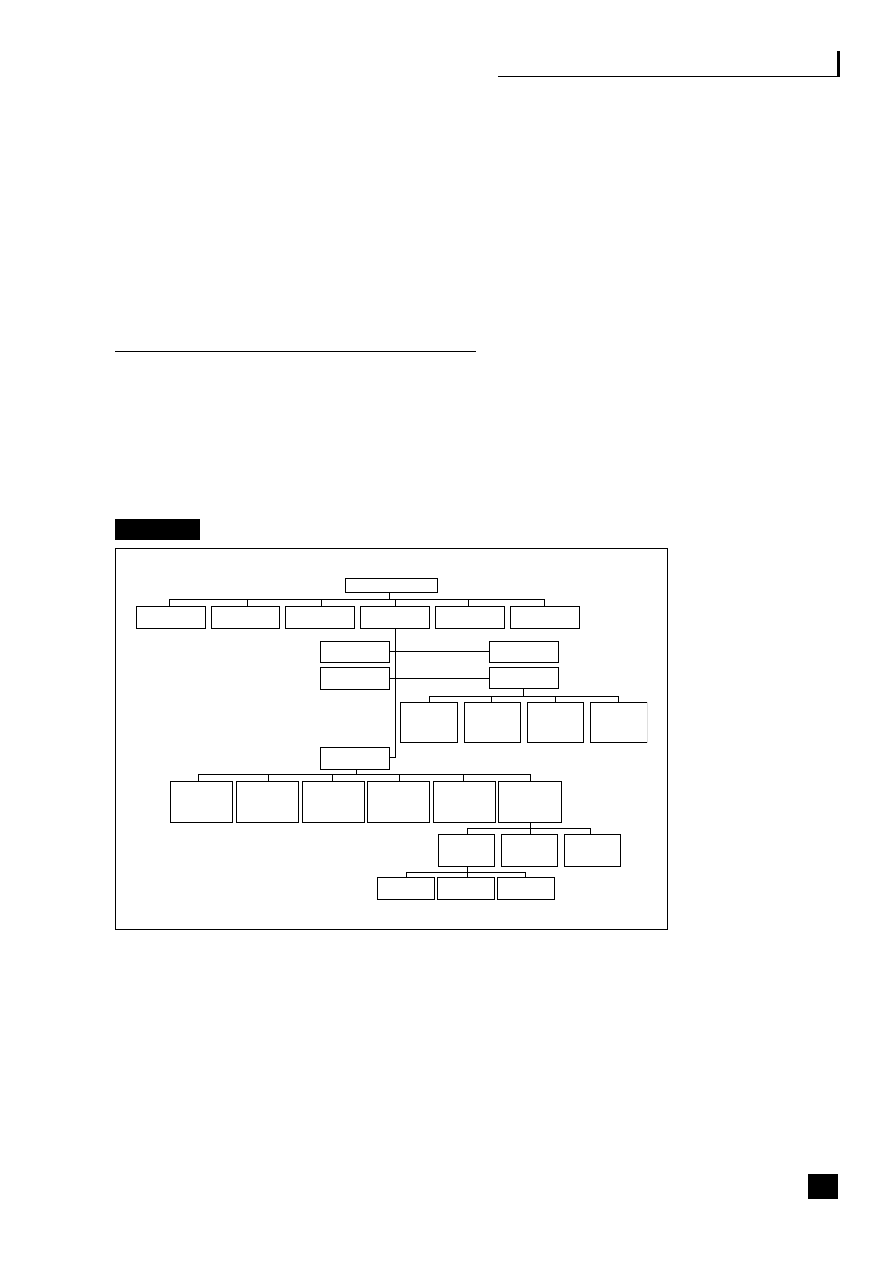
Business process performance management
■
evaluate strategic simulations using ‘what if’ scenarios within the model;
■
apply quality techniques to measure and correct process variation, e.g. Six
Sigma (see Chapter 17, pp. 220–22).
■
use process-based accounting to leverage processes to predict results (see
Chapter 17, pp. 217–20).
OBJECTIVES AND RESPONSIBILITIES
Using the IT example, the setting of objectives and responsibilities can be
cascaded down the process/activity hierarchy by drilling down in the same way as
delegated or devolved budgeting would do. The only difference is that the
association is against the activity and process hierarchy, not the organizational
structure (see Figure 16.2).
Fig. 16.2
Process hierarchy
■
Level 1 – Corporate. Objectives and responsibilities set as guidelines for the
company as a whole, linked into the corporate level balanced scorecard (BSC)
outcomes, critical success factors (CSFs) and key performance indicators (KPIs).
■
Level 2 – Core processes. Objectives and responsibilities set as guidelines for each
core process delivering goods and/or services to the customer, linked into cascaded
lower-level BSCs. In our example ‘Housing Management’ is a core process.
203
Extra care
Care and repair
Development
Rents and
service charges
Housing Association
Allocations
and lettings
Tenancy
management
Tenant
consultation
Pre-tenancy
counselling
Rent
collection and
arrears
collection
Enforcement
of tenancy
conditions
Liaison with
statutory and
voluntary
bodies
Systems
delivery
Transition
to new
system
Operating
system
Systems
support
Documentation
Systems
assurance
Systems
testing
Systems
development
Business
analysis
Systems design
and delivery
Help
desk
Systems
management
Software
maintenance
Housing
management
Housing
services
Repairs and
maintenance

204
Part Four: How to Analyse Business Processes
■
Level 3 – Sub-processes. The sub-processes each have clearly defined objectives
and responsibilities and are again linked to the BSC. One such sub-process
would be the ‘Systems Design and Delivery’ sub-process.
■
Level 4 – Activities. Linked again in the process hierarchy. One activity would
be ‘Systems Delivery’.
■
Level 5 – Tasks. One task would be ‘Systems Support’.
■
Level 6 – Sub-tasks. One sub-task would be the ‘help-desk’.
An example of an overall objective set for ‘help-desk’ might be:
To support customers in the most effective and efficient manner possible.
BALANCED PERFORMANCE MEASURES AND TARGETS
Performance measures are the quantification of how well the activities within a
process or the outputs of processes achieve specified goals. Hronec, in his book
Vital Signs, said:
Without performance measurement, improvement cannot be meaningful: it
cannot last and only by focusing simultaneously on cost, quality and time
can a company optimize its results.
2
■
Quality quantifies the ‘goodness’ of a product or service.
■
Time quantifies the ‘goodness’ of a process.
■
Cost quantifies the economics of the ‘goodness’.
Traditionally, finance would have concerned itself solely with cost, and the quality
function, through the company’s quality management initiative, would equally be
trying to maximize quality without due concern for the cost implications. Figure
16.3 shows how within this holistic, company-wide system each activity and
process needs to be measured, not just in cost terms, but in terms of its quality
and time measures, representing a balanced view. Any change in one measure will
have a direct relationship on the other measures. For example, reductions in cost,
all other things being equal, will result in an adverse effect on time or quality or
both. The measurement of these three elements defines clearly the level of service
being provided by the activity.
These measures and targets will be linked directly to the objectives and
responsibilities cascaded down the organization and linked to the corporate BSC.
In our help-desk example in Figure 16.3, the cost measure could be average cost

Business process performance management
per enquiry, the time measure average time taken to handle the enquiry, and the
quality measure the percentage of enquiries answered without referral.
Fig. 16.3
Balanced performance measures
Some of the benefits of setting performance measures for all levels of activities and
processes within the organization are as follows:
■
It enables the level of service being delivered by the activity or process to be
defined.
■
It enables the customer (internal or external) to specify his or her requirements.
■
It allows a baseline to be measured and any improvements or other deviations
to be monitored against it.
■
It allows ‘best practice’ to be identified through benchmarking.
■
It facilitates the drive for change to achieve ‘best practice’.
Hronec’s quantum performance matrix
To use as a prompt when setting process/activity performance measures, Hronec
produced a matrix of the types of time, quality and cost measures that could be set:
Cost
■
Inputs
Unit cost of process inputs
■
Outputs
Unit cost of process outputs
205
Time
Cost
Quality
Help-desk
Activity
time taken to handle enquiry
cost per enquiry
Percentage of enquiries
answered without referral

206
Part Four: How to Analyse Business Processes
■
Activities
Cost of performing a process/activity
■
Tasks
Cost of performing a task
Time
■
Velocity
Speed of delivery of process output
■
Flexibility
Ability of the process to respond to varying demands
■
Responsiveness
Willingness and readiness to provide prompt service
■
Resilience
Ability to change
Quality
■
Conformance
Effectiveness of a process, i.e. meeting or exceeding customer
satisfaction
■
Productivity
Efficiency of a process, i.e. doing the right things in the
correct way
■
Reliability
Consistency of performance and dependability
■
Empathy
Individualized attention, e.g. customer satisfaction rating
■
Credibility
Trustworthiness, honesty
■
Competence
Required skills and knowledge
It is possible to set time, quality and cost measures for any activity or process.
EVALUATION OF ALTERNATIVE SERVICE LEVELS
Figure 16.4 demonstrates how, once the level of service of an activity or process like
the help-desk has been defined in terms of time, quality and cost measurements,
alternative levels of service can be evaluated. This means that when setting budgets,
measuring performance or discussing levels of required service with customers
(internal or external), alternatives, where appropriate, can be clearly identified,
measured and compared.
In this example of the help-desk, it can be seen that by increasing or decreasing
staffing of the activity, cost and quality increase or decrease accordingly, thus
providing a clearly defined choice as to the appropriate level of service for the business.
PRIORITY-BASED BUDGETING
By applying a rating scale like the one shown in Figure 16.5 to the various levels
of service evaluated at activity/process level, it is possible to rank the levels of
service in order of importance to the running of the business.

Business process performance management
Fig. 16.4
Alternative service levels
Fig. 16.5
Priority-based budgeting rating scale
In this way, when scarce funds are being competed for, those that are evaluated as
being more crucial to the running of the business are funded first. Ranking and
prioritizing of this kind have been common in capital budgeting for many years.
Figure 16.6 is an example of priority based budgeting (PBB) being applied to
Security. It clearly sets out the objectives and goals to be achieved by the activity. It
lists the ideas for change that the team has considered as ways of improving the
service, some of which it is assumed will proceed and have been included in the
proposal, two of which are still being evaluated and one which has been rejected. It
sets out four possible levels of service that it could deliver over the coming budget
period, with their subsequent number of employees and total costs. The MOD
standard is the minimum level of service possible, because the company depends on
MOD contracts for its core business. It can be seen that by incorporating the
207
Help-desk activity
Higher
Current
Cost
Lower
Cost per enquiry £5
95 per cent answered without referral
Two minutes to answer enquiry
Cost per enquiry £3
90 per cent answered without referral
Three minutes to answer enquiry
Cost per enquiry £2
85 per cent answered without referral
Five minutes to answer enquiry
10
Essential to the business
9
Critical – unavoidable without substantial loss or damage
8
Very attractive, important and productive increments of service
7
Important – hard to see how they could be dropped
6
Significant benefits, but could conceivably be dropped
5
Desirable, but first to be dropped if funding curtailed
4
Marginal, but first to be supported if funding increased
3
Possible, but only if much increased funding available
2
Doubtful – not sufficient justification at present
1
Unlikely ever to be funded

208
Part Four: How to Analyse Business Processes
assumed changes, a higher level of service is being offered at service level 4 at a
lower cost than the current budget.
Fig. 16.6
Priority-based budget – Security
Figure 16.7 lists the alternative levels of service for Security together with the
levels of service being offered by two other activities, Catering and Typing. They
are ranked in order of the rating score that they achieved.
Fig. 16.7
Ranked priority budget
Purpose and benefits
• Secure environment for staff
• Retain MOD contracts
• Minimize vandalism and theft
• Protect intellectual property
Changes
Service levels
No.
£k
• Assumed
– Remote-controlled
gates
– Combined
security/reception
–
Offices monitored remotely
• Possible
–
Card key access
– Agency
personnel
• Rejected
– Dogs
1 MOD
standard
11
193
2 Increased
security 18
309
3 Third traffic gate
24
408
4 Reduced
vandalism 27
444
Total proposed 27
444
81%
Current budget 35
548 100%
Rank
Rating
Subject Level of service
No. £k No. £k %
1
10
Security
1 Night cover
11
193
11
193
20
2
10
Catering 1 Room and hot water
1
15
12
208
22
3
9.1
Security
2 Day patrols
7
116
19
324
34
4
8.5
Typing
1 External only
7
70
26
394
41
5
7.2
Catering 2 Sandwiches and drinks
4
50
30
444
46
6
6.7
Typing
2 Important reports
5
50
35
494
51
7
5.2 Catering 3
Basic/self-service
10 120 45 614 64
8
4.5
Catering 4 Choice and service
6
85
51
699
73
9
4.2
Security
3 Third traffic gate
6
99
57
798
83
Increment
Cumulative

Business process performance management
This enables the manager to draw a line in accordance with the resource that is
finally allocated in the budget for these activities. For example, if it were £500,000
then everything would be funded up to and including Typing service level 2,
‘important reports’, but excluding Catering service levels 3 and 4 and Security
service levels 3 and 4.
Budgeting panels
The ranking of importance to the organization of the alternative service levels
needs to be carried out by a group of managers who are representative of the whole
organization. This is crucial to gain a balanced view. For example, if the Finance
budget were being considered, it is probable that the finance manager may, quite
understandably, put a higher rating score on the provision of financial information
than would other members of the organization. It would depend entirely on how
useful they viewed the information being provided. This process would begin a
useful dialogue between internal suppliers and customers.
A budgeting panel should include:
■
the overall SBU/process manager (usually in the chair);
■
lower-level managers from SBU/process (as appropriate);
■
managers representative of the rest of the organization, particularly from its
(internal) suppliers and (internal) customers;
■
the PBB project manager.
The activity/process manager would be responsible, with help from the PBB manager
and line manager, for the preparation of documentation.
The budget proposal would include:
■
proposed activity/process budget;
■
proposed objectives and goals;
■
proposals for performance improvements;
■
proposed performance measures and targets;
■
alternative service levels, with details of their benefits and consequences;
■
performance to date (unless this was the first meeting of the panel).
The security manager would attend the budgeting panel to present the proposals
and answer questions directly from the panel members, prior to them ranking the
alternatives and recommendations.
209

210
Part Four: How to Analyse Business Processes
The panel outputs would include:
■
ranked levels of service;
■
performance improvements;
■
performance measures and targets.
This information arms the SBU/process manager and the PBB manager with the
necessary priorities when the final decision on funding is made by the company’s
board of directors or other final decision-making body.
PROCESS/ACTIVITY-BASED MONITORING
AND REPORTING
Monitoring and reporting in PBM is based on:
■
forward-looking trend analysis;
■
processes in control;
■
a balanced set of performance measures at all levels;
■
waste and unused capacity;
■
a concentration on utilization and output volumes;
■
measurement of quality and correction of deviations from process;
■
service-level options as formally prioritized for the good of the business;
■
an emphasis on activities and processes not functional departments;
■
value-based strategy not ‘last year minus’;
■
a focus on benchmarked industry targets;
■
support for a ‘bottom-up empowered’ organization with a culture of continuous
improvement;
■
the use of technology to present in a graphical way, using trend analysis, alerts
and exceptions to the full.
The activity/process analysis does not necessitate everyone in the organization
collecting time-recorded information on a regular basis. In Figure 16.8 the earned
value activity analysis approach can be seen in financial processing which carries
out five activities where as a calculation can be made for each activity based on
Actual volume
Budgeted cost (a standard cost approach). This approach can be
compared to Figure 16.9 actual activity analysis where actual time recording and
actual costs are available for each activity.

Business process performance management
Fig. 16.8
Earned value activity analysis
Fig. 16.9
Actual activity analysis
211
Activity
Output
Actual output Budget cost Earned value
Target
measure
(k)
per unit (£)
(£)
Cost per unit
EV (£k)
Financial processing
Process sales invoices
Invoices
1.5
16.7
25.0
10.0
15.0
Process staff claims
Claims
1.2
3.0
3.6
2.0
2.4
Banking/cash receipts
Cheques banked
3.0
0.7
2.1
0.7
2.1
Control balance sheet
Accounts
0.5
6.0
3.0
6.0
6.0
Management Staff
5.0
1.0
5.0
1.0
5.0
Total earned value (£k)
38.7
30.5
Actual cost
42.0
42.0
Variance
3.3 11.5
% effective
92%
73%
Activity
Output measure
Volume
Cost
Cost
Target cost
(number of)
(£k)
per unit (£)
per unit (£)
Budget
1.5 25 16.7
Process sales invoices
Invoices
10
Actual 1.5 27 18
Budget
1
3 3
Process staff claims
Claims
2
Actual 1.2 3 2.5
Budget
3
2 0.7
Banking/cash receipts
Cheques banked
0.7
Actual 3
3 1
Budget
0.5 3 6
Control balance sheets
Accounts
6
Actual 0.5 3 6
Budget
5
5 1
Management Staff
1
Actual 5
6 1.2
Budget
38
TOTAL
Actual
42
Financial processing

212
Part Four: How to Analyse Business Processes
Case study 16.1
Metropolitan Housing Trust
Background
Metropolitan Housing Trust
3
(MHT) operates out of four regions, three in London and one in
the Midlands. Senior management wanted to look at the relevance and cost effectiveness
to MHT of PBM by undertaking an exercise to look at the administrative process from receipt
of a maintenance fault notification to the payment of the invoice, referred to for this exercise
as the ‘reactive repair process’.
A new housing-specific software package had been installed by MHT about a year prior to
this project being undertaken. This software was designed to enable properties to be viewed
online while calls from tenants were in progress. A methodology for using the new system was
agreed and all regions were trained. The objectives of the exercise were agreed as follows:
■
Map the ‘reactive repair process’ (RRP) and identify any differences between regions.
■
Cost the activities within the process.
■
Examine quantitative and qualitative performance measures for the process.
■
Hold workshops to discuss analyses and identify improvements and best practice.
■
Review external influences and support activities.
■
Benchmark the process with another housing association, Northern Counties, based in
Manchester, which uses the same software package. (This objective was added during
the project to enable a better understanding of the problems being experienced with IT
performance.)
ABC
A member of staff built an ABC model using a spreadsheet package, determining the costs,
of the activities within the process (see Figure 16.10), for each region (see Figure 16.11),
and for costs per order and stock unit (see Figure 16.12).
Fig. 16.10
MHT – RRP activity costs
Tenant satisfaction
slips (TSSs)
4%
Post inspection
holds
12%
Payment
0%
Process invoices
22%
Print and issue
works order and TSSs
4%
Pre-inspection
12%
Logging, raising
and authorizing
9%
Receiving, logging
offline and phoning
37%
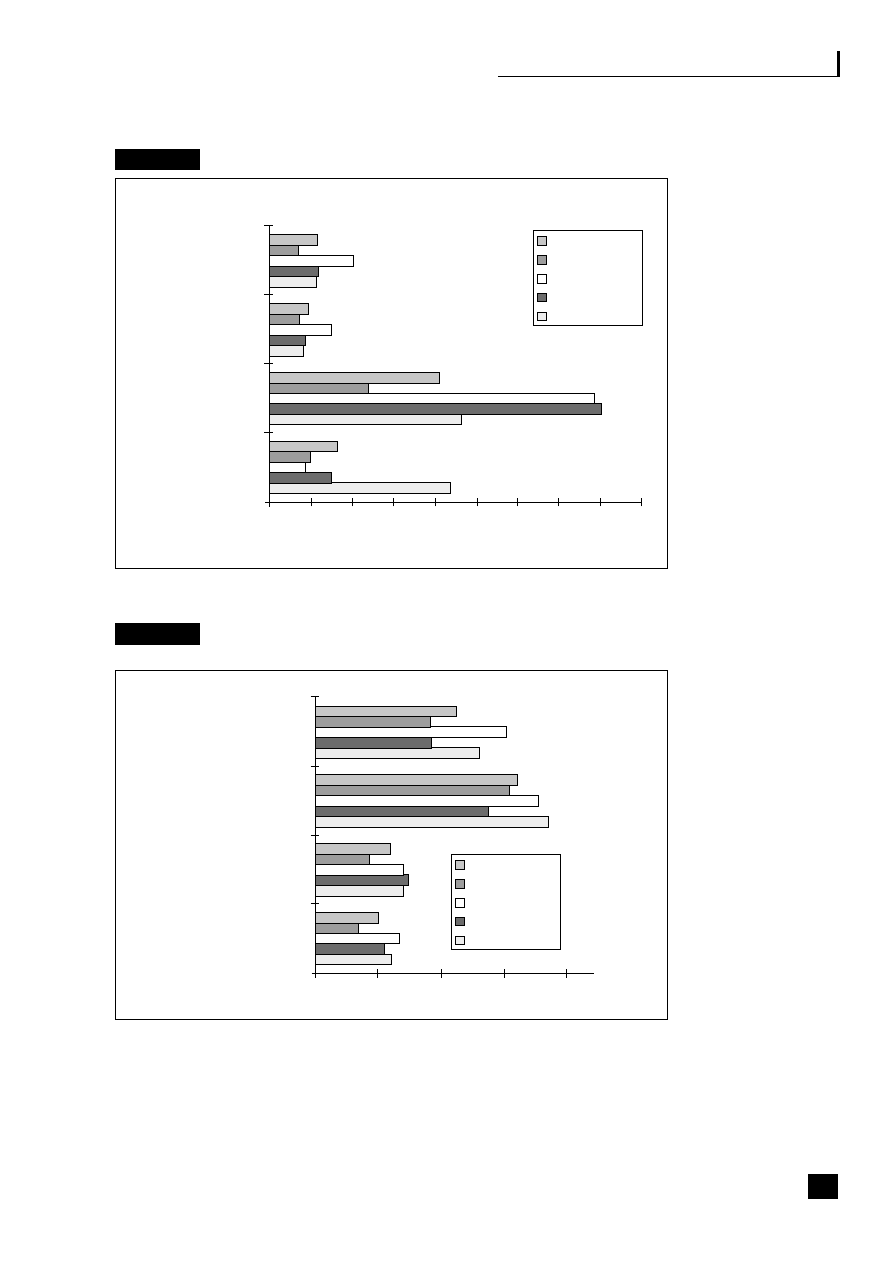
Business process performance management
Fig. 16.11
MHT – RRP regional activity costs per order
Fig. 16.12
MHT – average costs for repairs and maintenance
administration
This information made MHT aware that the administration of each reactive repair order was
costing about £50, which, when multiplied by the number of average repairs per year per
stock unit, equalled about six weeks’ rent. This useful ABC data was available to inform and
influence the future operational management of the process.
213
Average
OFFLINE – receipt,
log and phone
ONLINE – log, raise,
authorize, print and TSS
SURVEYORS – pre- and
post-inspection
FINANCIALS –
process and pay invoices
£ 0
10
20
30
40
50
60
70
80
90
East Midlands
NW London
South Thames
North London
Average
Reactive cost per
stock unit
Total maintenance cost
per stock unit
Per total maintenance
works order
Per reactive
works order
£ 0
50
100
150
200
East Midlands
NW London
South Thames
North London
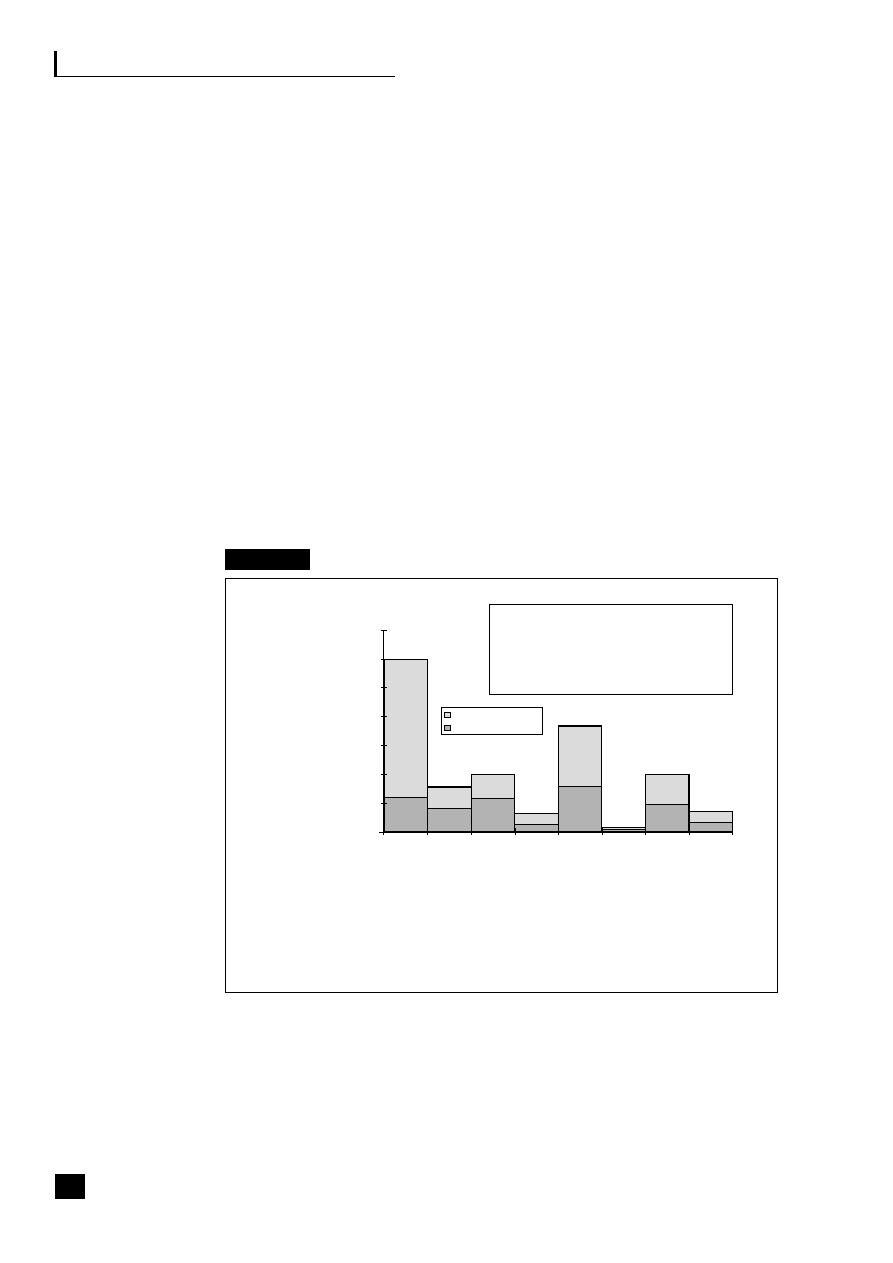
214
Part Four: How to Analyse Business Processes
BPR and benchmarking
The mapping of the processes in each region revealed a number of different practices, which
proved beneficial input to the best-practice workshop. The one main common problem that
all regions were experiencing was the failure to be able to operate online when tenants
phoned in. It was as a result of this that the decision was taken to benchmark with another
housing association which used the same software package, with the aim of identifying the
cause of the problem. A one-day benchmark visit was organized and a report prepared for
both parties, which compared:
■
general information about the size, geography, etc. of the organizations;
■
maps of the ‘reactive repair processes’ of both organizations;
■
the organizational structures and practices for repairs;
■
IT hardware, software and practices.
From the ABC, BPR and benchmarking information, the main influences on cost, i.e. cost
drivers, were identified as well as the potential savings if all of the possible changes were
put into place (see Figure 16.13).
Fig. 16.13
MHT – RRP cost drivers
All of the information and analyses were input into the best-practice workshop for
consideration, including:
■
external benchmark data;
■
costing data;
■
regional analyses;
350
Potential savings
Receiving, lo
gging offline a
nd phoning
Logging, raising and autho
rizing
Pre-inspecti
on
Print and iss
ue work order and
TS
Ss
Process invo
ices
Payment
Po
st-inspection h
olds
Te
nant sa
tisfacti
on slips
Core
300
250
200
150
100
50
0
COST DRIVERS
No. of contractors/SOR
£243k
System performance
£137k
No. of offices/work orders/inspections
£96k
Invoice authorization
£50k

Business process performance management
■
ideas for improvements, identified from all involved in the process. These included
suggestions relating to those departments that interfaced with the process, such as
Finance and IT.
Attending the workshop were staff and management from the processes in each region and
representatives from the interfacing departments, enabling all issues to be discussed,
including the external benchmark data.
Balanced performance measurement
However, to stress the importance of not just looking at cost information in isolation, a series
of balanced performance measures needed to be examined as well as the obvious social
considerations of such an organization taken into account. These included the following:
■
Cost measures:
– per call received
– per works order raised
– per inspection carried out
– per invoice processed
– per payment made
– per repair carried out
– per stock unit.
■
Time measures:
– time taken to answer phone calls
– time taken to carry out inspections
– time taken to carry out repairs
– time taken to pay contractors
– time taken to process invoices
– time taken to set up new contractors
– time taken by system to process fault.
■
Quality measures:
– tenant satisfaction
– percentage of inspections carried out
– percentage of inspections that proved unsatisfactory
– percentage completed within priority levels
– percentage of errors made on payments
– Number of repairs per stock unit.
Activity-based budgeting
Because this was a pilot project, information needed to be collected from all of the support
processes and decisions taken on how the costs should be allocated to the RRP, which had
been ring-fenced for the exercise. These included costs from all the head office departments
and some regional overhead costs. The traditional costing/budgeting system allocated central
215
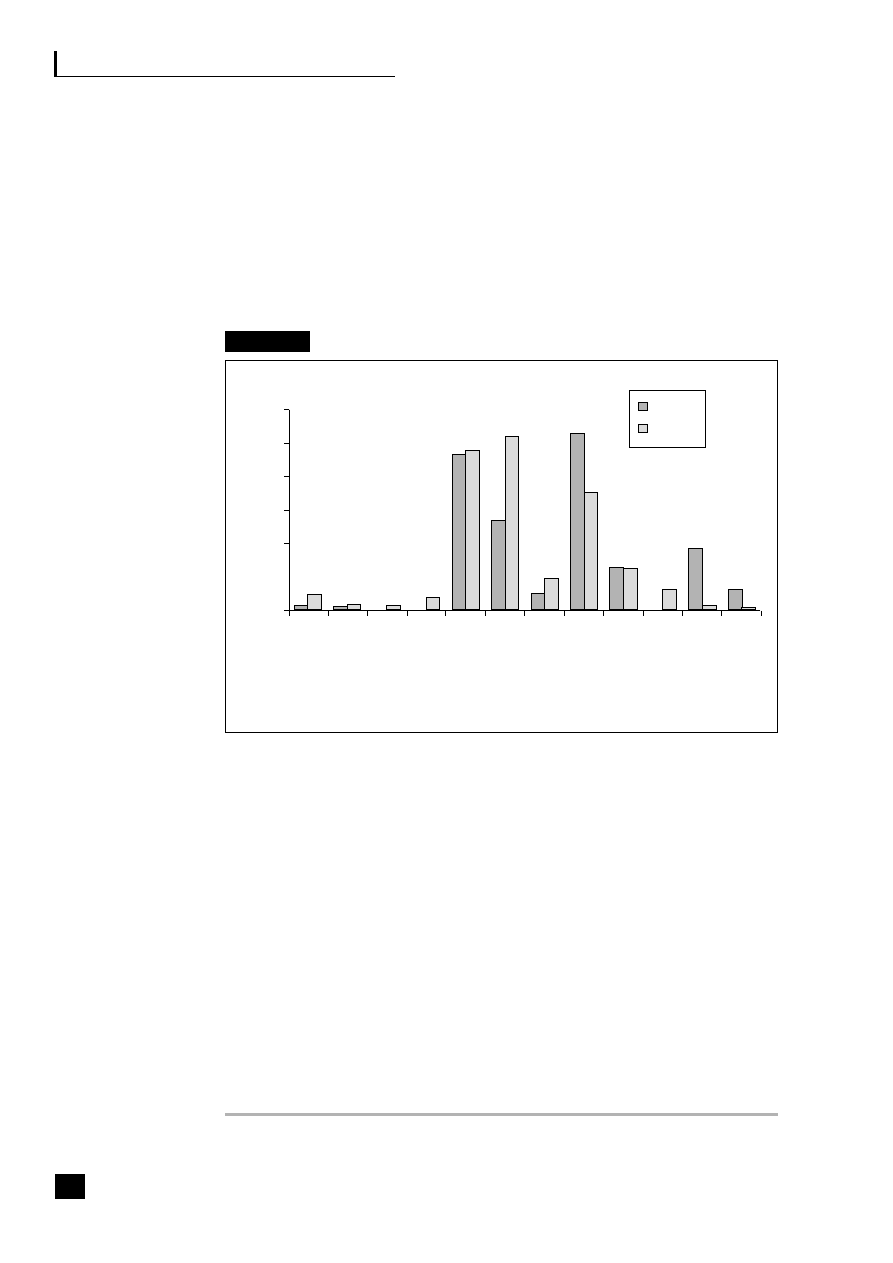
216
Part Four: How to Analyse Business Processes
overheads to regions based on the number of housing units or on staff numbers. These central
costs were then added to the regional overhead costs and incorporated as a percentage on-
cost into the estimate of time spent on each housing type made by all direct employees.
The ABC/ABB methodology took the average cost of each repair and multiplied it by the
number of repairs that actually took place in each housing type, scheme, region. This
information was readily available in the housing software.
See
Figure 16.14 which compares
the traditional and the activity based approaches for the repairs and maintenance budget.
Fig. 16.14
MHT – repairs and maintenance budget: traditional versus ABC
Equally, if applied across all of MHT’s processes, then these differences would occur
differently in each process – voids, arrears, applicants on waiting lists, allocations and
tenancy management. Each of these processes would show a different pattern in different
housing types and areas. This provides significant information for housing associations
which are bidding to take over other properties.
Conclusion
The main benefits of the exercise were identified as:
■
allowing the complexity of maintaining provision to be costed thus informing future
housing strategy;
■
mapping of processes and procedures allowing best practice to be ascertained,
benchmarked and maintained;
■
examination of activity costs by region, allowing more informed operational decision making;
■
assignment of budgets and performance measures to activities within the process, allowing
alternative service levels to be evaluated and ongoing performance monitored.
£
120,000
10,000
80,000
60,000
40,000
20,000
0
Leasebacks
Garages
Commercial
MB
OA
Hostels directHostels partner Hostels agent
Older people all categories
Health authority
PSL
HALS
HAMA
Existing
ABC

17
Process-based accounting
incorporating Six Sigma
Introduction
219
Forward-looking characteristics of processes
219
Ten bottom-line management guidelines for PBA
219
Steps for implementing PBA
220
Steps for operating PBA
220
A process-based performance measurement
framework
221
The Six Sigma way
222
Knowledge transfer systems
222
■
■
■
■
■
■
■
■
217


Process-based accounting incorporating Six Sigma
INTRODUCTION
Jim Brimson in his book The Handbook of Process-Based Accounting: Leveraging
Processes to Predict Results
1
brings together all of the elements of process-based
management and other accounting and performance measurement tools and
techniques, including Six Sigma, into one all-encompassing predictive accounting
framework.
FORWARD-LOOKING CHARACTERISTICS OF PROCESSES
■
Flow – sequence of activities within a process.
■
Resource consumption – average amount of resources consumed in producing
one unit of output.
■
Cycle time – time taken by the process to transform an input into an output.
■
Effectiveness – how well a process meets its cost and performance targets.
■
Storehouse of value – value inventory created for future operations.
■
Process value creation – gauged by the excess of lifecycle revenue over cost.
TEN BOTTOM-LINE MANAGEMENT GUIDELINES FOR PBA
■
Before one can improve performance, one must improve the process. BPR and
progress monitoring.
■
PBA proactively focuses management attention on processes. Outstanding
performance requires:
– sustained effort;
– constancy of purpose;
– an environment where continual improvement is the operating philosophy.
■
Predictive ability is directly related to process variation. It is necessary to
incorporate Six Sigma techniques to minimize process variability and maintain
process stability.
■
Control charts are a superior tool in interpreting financial results. The control
chart approach concentrates on the behaviour of the underlying process, while
variance analysis tries to attach meaning to each specific actual to budget
comparison. Control charts are comprehensive and yield more insight and
greater understanding than variance analysis.
■
The process model must use statistics to anticipate, rather than forecast, future
events. A forecast is based on historical trends and patterns, while understanding
219

220
Part Four: How to Analyse Business Processes
the key events that disrupt the processes enables adjustments to minimize the
impact of events.
■
Product/service features are a source of process variation. Process variation
includes normal random (systemic) and problem-induced variation. Systemic
variations which result from the whole process are often uncontrollable, while
problem-induced variations are largely controllable.
■
Capacity affects process cost. Getting the correct capacity is critical to achieving
target cost. Too little capacity creates bottlenecks, while too much capacity
results in wasted resources.
■
PBA obligates managers to strive to totally eliminate process variation. Six
Sigma, TQM, lean manufacturing, ERP, computer-integrated manufacturing,
productive maintenance and reliability engineering all strive for zero defects,
reduced time, labour or failures as their goals. Support processes must also
strive for precision.
■
PBA adds a process foundation. The management system should be based on a
systematic, fact-based process that collects and analyses a variety of information.
■
PBA is based on objective and verifiable information. PBA is based on hard
facts including:
– the sequence of the order and timing of activities – process maps;
– the repeatability of activities;
– the degree to which a process is in control;
– the significant few problems, following Pareto’s 80/20 rule, that management
must focus on using root cause analysis.
STEPS FOR IMPLEMENTING PBA
1 Conduct activity analysis.
2 Develop activity standard costs.
3 Assess process variation and conduct root cause analysis.
4 Identify process performance measures.
5 Identify external value drivers.
6 Assess the planned workload using key event planning tables.
STEPS FOR OPERATING PBA
■
Track actual workload.
■
Track actual cost incurred by the group.

Process-based accounting incorporating Six Sigma
■
Compute earned value cost.
■
Compute earned value variance.
■
Assign the earned value variance to individual activities.
■
Track earned value variance on a control chart.
■
Interpret earned value results.
A PROCESS-BASED PERFORMANCE
MEASUREMENT FRAMEWORK
Processes should be the foundation of a performance management system. The
resulting framework would incorporate a balanced scorecard and strategic
performance measurement principles (see Transforming the Finance Function for
more details of these tools)
2
and integrate a wide range of other management tools,
such as ABC, BPR, Six Sigma and TQM. A process affects results in two ways:
■
The totality of the interconnections of all processes creates enterprise-wide
performance result.
■
Each individual process has its own unique performance outcome.
Process-based performance measurement principles
■
An in-control process delivers consistent and predictable results. A performance
measurement system should never measure the results of a process. Use control
charts for the process and each of its main activities – these instantaneously
detect problems and point to their root causes, enabling immediate corrective
action.
■
Performance targets are what the customer or executive team wants
performance to be. A process can deliver performance only within certain limits
depending on its capabilities. The two must be reconciled.
■
Performance measures should assess whether the desired outcome of a process
is being achieved. A performance measure assesses progress relative to
predetermined goals or objectives.
Improving predictability with control charts
Performance results are directly related to the stability of the process, which is
directly related to:
■
measurements of the amount and distribution of process variation;
221

222
Part Four: How to Analyse Business Processes
■
detection of signals rather than random noise by using control charts;
■
identification and elimination of the cause of process variation;
■
continuous improvement of stable, in-control processes;
■
identification of key events that might disrupt a process.
THE SIX SIGMA WAY
The quality initiative Six Sigma is sweeping the US among business leaders on a
quest for operations performance improvement. For peak performance,
companies should assign process owners and position Six Sigma as one tool in the
context of a holistic and strategic business process management approach, which
would incorporate BPR, PBB, CRM and BSC among others tools and techniques.
Pande Nueman in The Six Sigma Way says:
Whether designing products and services, measuring performance, improving
efficiency and customer satisfaction – or even running the business – Six
Sigma positions the process as the key vehicle of success. Research has
shown that the costs of poor quality (rework, mistakes, abandoned projects,
etc.) in service-based businesses and processes typically run as high as 50 per
cent of total budget.
3
Six Sigma is a measurement of standard deviation.
4
A manufacturer with a process
operating at a level of Three Sigma, which is the average for US corporations, has
about 65,000 errors per million opportunities. Motorola, which developed the
concept in the 1980s, was still hovering at around 5.8 defects per million on
average in 1998. It differs from an old-style total quality programme because the
ultimate measure is whether operating margin is improving. The results deliver
higher quality at a lower cost. Six Sigma is based on facts and starts by training
and equipping quality teams to perform rigorous data gathering and statistical
analyses that unveil the root causes of defects. The teams are then trained to deliver
solutions that will eliminate the causes of error, whether they are products that do
work, distribution channels that stall or a slow response to customer requests.
KNOWLEDGE TRANSFER SYSTEMS
5
An integrated knowledge management system is more effective from a process-
improvement, decision-support, training and risk-management perspective than
just a focus on storing and accessing information in a central repository.

Process-based accounting incorporating Six Sigma
Integrated knowledge has:
■
structure – it is process-centric;
■
links – it integrates parts into a dynamic, cohesive whole;
■
relevance – it is meaningful to the execution of the task in hand;
■
accurate delivery – required in a time-critical environment.
The transformation cycle begins with:
■
Instruction – capturing instructions or leveraging existing information is the
first step towards transforming tacit knowledge and experience into explicit
knowledge, which can be mined and shared across an organization in the form
of process-based best practices.
■
Action – decision support information must be based on the most up-to-date and
approved knowledge. While web portals and content management tools make
information more accessible, process-centric knowledge must be organized in a
task-specific actionable hierarchy.
■
Measurement – a structure that is bound to both the process and the customer
provides the basis for responding to warning signals or problems.
■
Collaboration – to improve the process at task and cross-functional level.
■
Transformation – provision of best practice-based decision support and training
plus ongoing improvement of processes.
Benefits
■
Reduce the learning curve throughout the process.
■
Support performance of employees.
■
Focus on performance measures to improve processes.
■
Improve customer satisfaction.
■
Share ideas.
■
Leverage best practice combined with continuous improvement.
Case study 17.1
GE Six Sigma
6
The reason behind the introduction of Six Sigma was to improve processes so that GE would
not have to spend $7 billion of its revenues each year on scrap, rework and error resolution.
GE was operating at slightly better than average Six Sigma, with the average process
generating less than 3.4 defects per million opportunities. However, Jack Welch pointed GE
squarely at the Six Sigma goal – which can be viewed as 99.999 per cent perfection – and
223

224
Part Four: How to Analyse Business Processes
vowed he would attain it before he retired at the turn of the century. Any manager who failed
to undertake Six Sigma training during 1998 had to forego promotion into the top executive
ranks. Beginning on 1 January 1999, all professional employees will have started training.
The programme contributed more than $300 million to the company’s 1997 operating
income, helping to propel the operating margin above 15 per cent. In 1998 the company
invested more than $450 million in Six Sigma projects to reap cost savings or revenue
enhancements, worth about $1 billion during the year. The projects involve cross-functional
teams lead by what GE calls Black Belts – full-time quality gurus who have been trained by
Master Black Belts to drive out defects. Green Belts are project team members who also
occupy their usual full-time positions.
Finance Green Belts help design performance measurement frameworks, and collect,
monitor and audit savings. The savings drop back to the bottom line by allowing the
business that found the savings to consume them. People are rewarded for capturing future
savings, but also for getting real cost savings that they can re-use immediately.
The savings are categorized as:
■
cost avoidance;
■
reduced investment;
■
cash flow.
An example success story was the plastics division, which essentially created a free plastics
plant which would have cost $400 million to build – by adding 330 million lb. weight of
production capacity.

225
Notes and references
INTRODUCTION
1. IDC Research, www.idcresearch.com.
2. KPMG Consulting Europe, www.kpmg.co.uk.
3. The Gartner Group, www.gartner.com.
4. Rod Newing (2001) ‘Watch the economics and the risk not the technology’,
Financial Times, 5 December (Paul Strassman, National Defense University in
Washington).
5. Abbie Lundberg (2002) ‘IT inside the world’s biggest company’, CIO magazine,
1 July.
6. Martin Butler, Butler Group (2001) IT Analyst Organization Symposium,
November (www.butlergroup.com).
7. Pande Nueman (2000) The Six Sigma Way. Cavanagh: MacGraw-Hill.
8. Bulletpoint, Making change work, March 1999.
1 THE STRATEGIC BENEFITS OF BUSINESS
COMMUNITY INTEGRATION
1. Christopher Koch (2002) ‘It all began with Drayer’, CIO magazine, 1 August
(www.cio.com).
2. R. Kraut et al. (1998) ‘Co-ordination and virtualisation: the role of electronic
networks and personal relationships’, Journal of Computer Mediated
Communications, vol. 3, no. 4.
3. Margaret May (2002) Transforming the Finance Function Adding
Companywide Value in a Technology-based Environment, FT Executive
Briefing. London: Pearson, Chapter 3, pp. 39–47.
4. E. Stuart and D. McCutcheon (2000) ‘The manager’s guide to supply chain
management’, Business Horizons, March/April.
5. See May (2002).
6. Butler Group (2002) Business process management report – improving
business efficiency (www.butlergroup.com).
7. Shani Raja (2000) ‘Intel’, CFO Europe, May.
8. Andrew Sawers (2001) ‘Cisco Systems, I’m not worried about our share price’,
Financial Director, April.

226
Notes and references
2 E-BUSINESS STRATEGY
1. Dell.co.uk (2001) ‘E-business at Dell driving real ROI’, Finance Today.
2. Andy McCue (2002) ‘Say you want e-revolution’, Accountancy Age, 27 May.
3. Nick Leyland (2001) Enterprise Integration Report: A Priority for European
Business (www.AMS.com and Management Consultancy, December).
4. Paul Strassman, National Defense University in Washington, quoted in Rod
Newing (2001) ‘Watch the economics and the risk not the technology’,
Financial Times, 5 December.
5. Janet Kersnar (2002) ‘The age of reason’, CFO Europe, July/August.
6. Margaret May (2002) Transforming the Finance Function Adding
Companywide Value in a Technology-driven Environment, FT Executive
Briefing. London: Pearson. See Benchmarking (pp. 167–77); Value-based
management (pp. 87–125); Shareholder value analysis techniques such as
EVA™ (pp. 93–7); Risk management (pp. 117–23); Valuation of intangible
assets (pp. 111–17); Balanced scorecard (pp. 145–60).
7. Hilary Rosenberg (2001) ‘Mad to measure’, eCFO, Autumn.
8. Sari Kalin (2002) ‘Return on Investment’, CIO magazine (www.cio.com), 15
August.
9. Kalin (2002).
10. Kalin (2002).
11. See May (2002), pp. 51–60.
12. The Gartner Group, www.gartner.com.
13. IDC Research, www.idcresearch.com.
14. Nextra (2001) ‘Hosting as an outsourcing proposition’, Finance Today
(occasional publication).
15. See www.cio.com.
3 WEB-ENABLING TECHNOLOGY
1. John Harney (2001/2) ‘Web service value proposition emerges’, Knowledge
Management, December/January.
2. Scott Leibs (2002) ‘Can we talk’, CFO Europe, May.
3. Adam Lincoln (2002) ‘Taming the beast’, CFO Europe, June 2002.
4. Lem Bingley (2001) ‘vnunet’, Accountancy Age, 29 November.

Notes and references
5. See Lincoln (2002).
6. See Lincoln (2002).
7. See Lincoln (2002).
8. Anthony Harrington (2002) ‘Centre stage’, Financial Director, April.
9. Anthony Sibillin (2001/2) ‘The great storage challenge’, CFO Europe,
December/January.
4 MOBILE AND WIRELESS TECHNOLOGY
1. Martin Dunsby and Peter Lee, Deloitte (2001) ‘Wireless’, Financial Times, 5
December.
2. Differentis Mackintosh and Peter Keen (2001) The Freedom Economy.
Osborne/McGraw-Hill.
3. Phil Smith, Cisco Systems UK & Ireland (2001) ‘Bandwidth’, Management
Consultancy, December.
4. Ulf Baggstrom, CSC UK (2001) ‘Telecomms’, Management Consultancy,
December.
5. Anthony Sibillen (2001) ‘No free rides’, CFO Europe, November.
6. Anthony Sibillen (2001) ‘Cutting the wires’, CFO Europe, October.
5 ELECTRONIC INVOICING AND PAYMENTS
1. IDC Research, www.idcresearch.com.
2. Dave Chaffey (2002) E-Business and E-Commerce Management. London:
Pearson.
3. Janet Kersnar (2002) ‘Paying your respects’, CFO Europe, April.
4. Justin Wood (2002) ‘Philips sees the lite’, CFO Europe, July/August.
5. Janet Kersnar (2001/2) ‘FX and the Holy Grail’, CFO Europe, December/January.
6. John Rozek (2001) ‘Securing the online payments’, Finance Today (occasional
publication).
7. Anne Queree (2001) ‘Pragmatism pays’, CFO Europe, October.
8. Rozek (2001).
9. Alex Miller (2002) ‘Out in the cold’, Accountancy Age, 24 January.
10. ‘Dotcoms cut and thrust’, Management Consultancy, January 2002.
227

228
Notes and references
6 STATUTORY AND RISK
MANAGEMENT CONSIDERATIONS
1. Anthony Harrington (2002) ‘IP security’, Management Consultancy, January.
2. Department of Trade and Industry (DTI), www.dti.gov.
3. Esther Shein (2001/2) ‘The corporate defence’, eCFO, December/January.
4. Adam Lincoln (2002) ‘Thinking the unthinkable’, CFO Europe, March.
5. The Gartner Group, www.gartner.com.
6. Keith Foggon (2001) Internet Security. IIA (Institute of Internal Auditors).
7. Louella Miles (2001) ‘Rome II, Internet 0’, eCFO, Spring.
8. Dave Cook (2001) ‘Border patrol’, eCFO, Summer.
9. Networking (2002) ‘Taxing times on the web’, Accountancy Age, 16 May.
10. J.G. Space (2000) ‘The final frontier’, eCFO, May.
7 ENTERPRISE RESOURCE PLANNING
1. In Mary Huntington (2002) ‘The ups and downs of an ERP career’,
Management Consultancy, March.
2. Ted Kempf (2002) ‘SPO: competitive necessity for services economy’, Gartner
Dataquest, May.
3. Aggresso Business World, a Unit 4 Aggresso Company (www.aggresso.com).
4. See Kempf (2002).
5. Judith Saint (2001) ‘RNLI’, November 2001.
8 BUSINESS TO EMPLOYEE
1. Randy Myers (2000) ‘The absent professors’, eCFO, Winter.
2. David Link (2002) eWorkplace. Hunter Group, Information Management
Consultancy, Baltimore.
3. Mike Friend (2002) European HR Services Programme. IDC.
4. See Myers (2000).
5. Karen Bannan (2001) ‘Take this job and post-it’, eCFO, Spring.
6. Mary Huntington (2002) ‘The ups and downs of an ERP career’, Management
Consultancy, March.
7. Link (2002).

Notes and references
8. Margaret May (2002) Transforming the Finance Function Adding
Companywide Value in a Technology-driven Environment, FT Executive
Briefing. London: Pearson, pp. 67–82.
9. Abbie Lundberg (2002) ‘IT inside the world’s biggest company’, CIO
magazine, 1 July.
10. John Edwards (2002) ‘Doing it with meaning’, CIO magazine, 15 August.
11. Tim Reason (2001/2) ‘A good idea gone bad’, eCFO, December/January.
12. Gary Flood (2002) ‘Document management’, Management Consultancy,
January.
13. Alix Nyberg (2002) ‘Seek and/or destroy’, CFO Europe, July/August.
14. Butler Group (2002) ‘Content management in the portal’, Opinionwire, 22
August.
15. www.cio.com.
16. Jacque Hale and Martin Butler, Butler Group (2001) IT Analyst Organization
Symposium, November (www.butlergroup.com).
17. See Hale and Butler (2001).
18. See Hale and Butler (2001).
19. Maggie Holland, Steve Ranger and Bryan Glick (2001) ‘Enterprise’,
Computing, 29 November (www.vununet.com).
20. See May (2002).
21. See May (2002).
22. Penelope Ody (2001) ‘Trading exchanges’, Financial Times, 5 December.
23. Holland, Ranger and Glick (2001).
24. Holland, Ranger and Glick (2001).
25. Holland, Ranger and Glick (2001).
26. Mark Samuels (2002) ‘Serious fun’, Management Consultancy, February.
9 SUPPLY/DEMAND CHAIN MANAGEMENT
1. Jim Langabeer and Jeff Rose (2001) Creating Demand-Driven Supply Chains.
Oxford: Chandos Publishing (www.ft.com/ftit).
2. www.cio.com.
3. The Gartner Group, www.gartner.com.
4. Thomas Koulopoulos (2001) The X-economy. Texere.
5. Janet Kersnar (2001) ‘Premier Paper’, CFO Europe, May.
6. The Gartner Group, www.gartner.com.
229

230
Notes and references
7. Andrew Baxter (2001) ‘Product lifecycle management, Financial Times,
5 December.
8. Guy Matthews (2000) ‘BAT case study’, Management Consultancy, May.
9. Lauchlan and Bennett (2000) ‘Front-end systems’, Computing, June.
10. Campbell McCracken (2001/2) ‘Making it happen’, Knowledge Management,
December/January.
11. Melanie Ellis and Donryn Dewar, PLAUT.co.uk (2001) ‘Winning the online
customer’, Finance Today (occasional publication).
12. Russ Banham (2000) ‘Sittin’ on the dock of eBay’, eCFO, Winter.
10 E-PROCUREMENT
1. T. Cooper-Jones and C. Macklin (2002) ‘Buy-by-wire’, Financial Management,
April.
2. www.pwcglobal.com.
3. E. Turban et al. (2000) Electronic Commerce: A Managerial Perspective,
Prentice Hall.
4. Andy McCue (2002) ‘Credit Suisse saves £23m using e-procurement’,
AccountancyAge.com, 12 June.
5. Andy McCue (2002) ‘AstraZeneca aims for £600m e-procurement saving’,
AccountancyAge.com, 17 May.
6. Ben McLannahan (2002) ‘Demand and supply’, CFO Europe, July/August.
7. Abigail Waraker (2002) ‘E-procurement success depends on good planning’,
AccountancyAge.com, 23 April.
8. Penelope Ody (2001) ‘E-procurement’, Financial Times, 5 December.
9. Penelope Ody (2001) ‘Trading Exchanges’, Financial Times, 5 December.
10. Tim Cooper-Jones (2002) Implementing E-Procurement in Europe, Unilever.
11 CUSTOMER RELATIONSHIP MANAGEMENT
AND E-MARKETING
1. Dave Chaffey (2002) E-Business and E-Commerce Management. London:
Pearson.
2. Adam Lincoln (2001) ‘Localisation’, eCFO, Spring.
3. Forrester Research, www.forrester.com.

Notes and references
4. See Chaffey (2002).
5. Mark Samuels (2001) ‘Make this the service model that works’, Computing,
29 November.
6. Bryan Glick (2001) ‘Consignia’s CRM initiative’, Financial Director, September.
7. Maggie Holland (2001) ‘View from the top’, Computing, 29 November
(vnunet.com; chordiant.com).
8. See Samuels (2001).
9. Butler Group (2002) Real CRM Report (www.butlergroup.com/reports/realcrm).
10. Rob Coomber, Cambridge Technology Partners (2001) ‘Unleash the potential
of your CRM system’, Computing, 29 November.
11. Paul Smith (1999) Marketing Communications: An Integrated Approach,
SOSTAC™. London: Kogan Page.
12. See Chaffey (2002).
13. Gartner (2001) Strategy and Trends Research Note, 29 October
(www.gartner.com).
14. AMS Europe (2002) Leveraging Customer Information for Bottom-line
Results, Case Study (www.ams.com/Europe/).
15. John Berry (2001) ‘Hey big spender’, eCFO, Autumn.
16. Margaret May (2002) Transforming the Finance Function Adding
Companywide Value in a Technology-driven Environment, FT Executive
Briefing. London: Pearson. See: Balanced scorecard, pp. 147–66; Website and
CRM analytics, pp. 81–2; and Customer valuation, pp. 113–15.
12 BUSINESS PROCESS ANALYSIS
1. A.L. Friedman and S.R. Lyne (1995) Activity-Based Techniques – Real-Life
Consequences. CIMA Research.
2. CAM-I, International Research Organization, UK base in Poole, Dorset.
3. Margaret May (2002) Transforming the Finance Function Adding
Companywide Value in a Technology-driven Environment, FT Executive
Briefing. London: Pearson. See: P/ABT software, pp. 79–80.
4. Abhai Rajguru and Margaret May, Anglian Water Case Study, 1998.
5. See May (2002) Value-based management, pp. 87–125.
6. See May (2002) Balanced scorecard, pp. 145–60).
7. See May (2002) Benchmarking, pp. 167–77.
231

232
Notes and references
13 ACTIVITY/PROCESS-BASED COSTING
1. H.T. Johnson and R.S. Kaplan (1987) Relevance Lost: The Rise and Fall of
Management Accounting. Cambridge, MA: Harvard Business School Press.
2. CAM-I, International Research Organization, UK base in Poole, Dorset.
3. C. Drury and M. Tayles (2000) Cost System Design and Profitability Analysis
in UK Corporations. CIMA Research.
4. Margaret May (2002) Transforming the Finance Function Adding
Companywide Value in a Technology-driven Environment, FT Executive
Briefing. London: Pearson. See pp. 127–40.
5. Ian Rowley (2001) ‘Combatting costs’, CFO Europe, April.
14 BUSINESS PROCESS PERFORMANCE IMPROVEMENT
1. Margaret May (2002) Transforming the Finance Function Adding
Companywide Value in a Technology-driven Environment, FT Executive
Briefing. London: Pearson. See Inter BU charging, pp. 101–2).
2. H.T. Johnson (1992) Relevance Regained. New York: Free Press.
3. Michael Hammer and James Champy (1994) Reengineering the Corporation:
A Manifesto for Business Revolution. London: Nicholas Brealey.
4. See May (2002) Benchmarking, pp. 167–77.
5. Andy Daniels (1999) Case study ABC and BPR at ABB, Asea Brown Boveri.
15 CHANGE MANAGEMENT
1. ‘Making change work’, Bulletpoint, March 1999.
2. Margaret May (2002) Transforming the Finance Function Adding
Companywide Value in a Technology-driven Environment, FT Executive
Briefing. London: Pearson. See pp. 129–32.
3. Nick Obolensky (1996) Practical Business Re-engineering. London: Kogan Page.
4. Kaisen Consulting (2001) ‘How to motivate your staff’, Financial Management,
November, p. 45.

Notes and references
16 BUSINESS PROCESS
PERFORMANCE MANAGEMENT
1. Margaret May (2002) Transforming the Finance Function Adding
Companywide Value in a Technology-driven Environment, FT Executive
Briefing. London: Pearson. See Beyond budgeting, pp. 127–67.
2. Steven Hronec (1993) Vital Signs. AMACOM.
3. George McMorran and Margaret May (1999) ‘MHT Case Study’,
Transforming the Finance Function (edition 1).
17 PROCESS-BASED ACCOUNTING INCORPORATING
SIX SIGMA
1. James Brimson (2002) The Handbook of Process-Based Accounting:
Leveraging Processes to Predict Results. AICPA.
2. Margaret May (2002) Transforming the Finance Function Adding
Companywide Value in a Technology-driven Environment, FT Executive
Briefing. London: Pearson. See pp.145–60.
3. Pande Nueman (2000) The Six Sigma Way. Cavanagh: MacGraw-Hill.
4. The Economist Intelligence Unit (1998) Excellence in Finance. EIU.
5. James Conlan (2001) ‘Improving business process’, KMWorld, November/
December.
6. The Economist Intelligence Unit (1998) Excellence in Finance. EIU.
233


235
Executive summary
Introduction
1. A true e-business is one which thinks and acts in a way that allows it to
collaborate, integrate and empower by:
– internal and external business processes working together seamlessly,
enabling collaboration with suppliers, partners, employees and customers
across traditional enterprise boundaries;
– companies ensuring that employees have at their fingertips the information,
applications and services they need to do their jobs.
2. It is the Web and the applications, standards, tools and services that have been
developed around it that has removed the traditional barriers to building
collaborative relationships and that has now made this an economically
attractive option.
3. A joint survey released in May 2002 by KPMG and the CBI reveals that 90
per cent of companies believe e-business will reduce costs by at least 10 per
cent but only 15 per cent are currently reaping the rewards. Improving
business processes alongside new technology could boost profits of UK
companies by £4.3 billion a year according to the Gartner Group, who quote
Easyjet and Tesco as examples.
PART 1 THE STRATEGIC BENEFITS OF COLLABORATIVE
WEB-ENABLED BUSINESS PROCESS MANAGEMENT
1 The strategic benefits of business community integration
4. The roots of automated business trading links can be found more than 20
years ago with electronic data interchange (EDI). At the same time the move
towards closer collaborative trading relationships began when Proctor &
Gamble who prototyped ‘continuous replenishment’ with Wal-Mart. P&G’s
success is attributed to:
– the importance of a trusting business relationship with your counterpart;
– the necessity of having senior management support;
– the challenge of changing the customer’s culture as well as your own;
– the move from continuous replenishment to collaborative planning,
forecasting and replenishment (CPFR).

236
Executive summary
5. Today, with the move towards greater collaboration and increased outsourcing
of both core and non-core activities companies are becoming virtual
organizations – a combination of organizations working together in close
partnership, with shared risk and reward, to deliver end value to customers. In
1978 the average book value of financial and physical assets was some 95 per
cent of market value; today it is nearer 20 per cent with the other 80 per cent
deriving from intangible assets.
6. The forming of partnerships is increasingly important. Companies need to
decide the options for the extent and control of the supply/demand chain
process. Losing control of the process does not preclude the ability to exert
strong control over the outputs of the process.
7. Equally important is the complete change in culture and organizational
structure needed. Corporate structures at the start of the twenty-first century
look very different, with process management dominating, operational
departments set up as strategic business units (SBU) and back-office functions
often incorporated into shared services centres (SSC).
8. Cisco owns only 2 of its 40 manufacturing operations – the rest are run by
partners. It owns the designs and software that controls its products; the rest
are in the hands of its manufacturing partners and resellers. This makes Cisco
as near as you get to a virtual corporation, yet it is the third most valuable
company in the world today.
2 E-business strategy
9. Organizations involved in B2C marketing must be able to know that the item
being ordered is in stock and can be delivered in a short time-scale. This ability
is very attractive to any business, particularly when it brings with it massive
processing cost reductions, improved productivity and satisfied customers.
10. ERP and integrated middleware systems are now being linked to front-office
customer relationship management (CRM) and supply/demand chain
management (S/DCM) packages, which have automated these processes and
produced even more strategic and operational efficiency and information for
decision-making purposes.
11. In the public sector e-business activity is driven by the government, which has
decreed that by 2005 100 per cent of delivery of services will be by electronic
means. The solution must improve the service to the citizen and reduce costs.
12. Research by AMS found that the majority of companies are approaching
enterprise integration on an ad hoc basis. They estimate that 30 per cent of

Executive summary
integration budgets are being wasted as a result of inefficient practices; 34 per
cent embark on projects without quantifiable objectives; 40 per cent cannot
specify when projects will pay back; and less than 40 per cent have a corporate
team in place to coordinate implementation.
13. Research has shown that there is no automatic correlation between the
amount of money spent on IT per employee and company profitability,
although if done well spectacular results can be achieved. Companies must
insist on quick payback times, thorough business plans and careful, regular
pre- and post-implementation analyses of all major technology projects.
14. The balanced scorecard approach can be applied in a matter of days,
providing the company is clear on the knowledge level and understanding of
the project is sound. If it takes longer then it is because the company is unable
to clearly define issues regarding project scope, business strategy, market
climate or departmental alignment.
15. Application service providers (ASP) rent out hosted applications over the Web,
managing the servers, network connection and other equipment required in a
dedicated and secure Internet data centre. ASP enables a business to have
access to applications that would otherwise be too costly to implement and
run on an affordable rental basis.
PART 2 TECHNOLOGICAL, FINANCIAL, LEGAL AND RISK
MANAGEMENT CONSIDERATIONS
3 Web-enabling technology
16. The Internet provides the communications network and the standard
mechanism for exchanging and publishing information on it is termed the World
Wide Web (www or the Web). The Web is accessed through a web browser
which displays web pages of embedded graphics and standard document
formats such as HTML and XML. All Web interaction is charged at local rate.
17. A typical large company has 30–50 separate applications which are not
integrated. The situation is exacerbated by an urgent need to connect to
customer and supplier systems. With wholesale replacement of systems often
a non-viable solution, Web standards and services and enterprise application
integration (EAI) middleware are providing an automated, cheap alternative
to labour-intensive point-to-point integration.
237

238
Executive summary
4 Mobile and wireless technology
18. Wireless means transmitting signals over invisible radio waves instead of
wires. It is used from something as simple as making a phone call to the
complexity involved in enabling the sales force to access information from an
ERP application. It means new, more convenient ways of staying in touch with
suppliers, customers and employees.
5 Electronic invoicing and payments
19. Electronic transactions and payments began with EDI. Interactive web
browser based solutions that require only a web browser and Internet
connection at the customer end are less expensive. The EU directive which
comes into force on 1 January 2004 permits companies in member states to
use digital invoices rather than paper-based ones for tax and regulatory
purposes. B2B and B2C invoicing and payment systems are examined as well
as e-treasury.
6 Statutory and risk management considerations
20. Directors now find themselves responsible for: evaluating risks to the IT
infrastructure; guarding against unauthorized access to client and employee
information; their servers being used to harbour offensive material; their
systems being corrupted; and from third parties when servers are hijacked
without their knowledge and used for denial-of-service (DOS) attacks on
other sites. So it is not surprising that companies are becoming attuned to the
idea that infrastructure security is an essential cost of doing business.
21. There is a need for a sound, dynamic security policy which is embedded in the
corporate culture, combined with an ongoing risk assessment and mitigation
process, including business continuity, in addition to the more obvious
physical and technical tools such as firewalls. The challenge is to achieve
maximum functionality within an entirely secure environment by including
security in the design.
PART 3 END-TO-END BUSINESS PROCESSES
7 Enterprise resource planning
22. ERP vendors have redesigned their products into easily integrated components
that allow the use of other components as well. The strength of global ERP

Executive summary
products is that they are needed to provide a firm foundation on which to
build on other products to achieve the desired BCI.
23. Service process optimization has grown out of the need for services-based
organizations, both internal and external, to fully exploit their capacity to
change and evolve in today’s dynamic business environment. They have more
natural flexibility than manufacturing or supply chain operations and this
leads to a very different set of systems requirements and approach to systems
development to that of ERP.
24. Document management now aims to challenge the amount of documentation
being received and consider how and if it needs to be stored electronically.
Workflow systems can be designed to deliver specified data periodically to
selected people, automatically routing electronic documents and enforcing
procedures written into a process.
25. The RNLI case study demonstrates how an entire ERP suite of SAP R/3 can
be implemented in nine months, coming in on time and within budget.
8 Business to employee
26. An increasing number of companies are seeing the benefits of employing a
self-service approach to HR, i.e. relying on corporate intranets and web-
enabled software to deliver documents, benefits information and company
data directly to workers. Hunter Group research shows that typical self-
service HR initiatives pay for themselves in about 18 months.
27. Increasingly, corporations are going online to fill management-level positions.
The Net enables employers to trawl through an enormous pool of talent much
more quickly with exponentially more prospects than traditional headhunters
can contact, hirers can put jobs up on specialized boards to reach qualified
and interested candidates and it is considerably cheaper.
28. Corporate use of the Internet to deliver training via virtual instructors makes
sense. Distance learning cuts the costs of both delivering and attending
training, but it lacks human interaction and is being used by companies to
supplement rather than completely replace traditional learning.
29. There is an appreciation of the need for a process-oriented, enterprise-wide
decision-support system and an urgent demand for its implementation to
enable companies to maintain their competitive advantage. Wal-Mart has
4,457 stores, 30,000 suppliers and an annual turnover of $217 billion and just
one information system (IS).
30. The problems associated with data consistency and quality of different merged
systems can be assisted by semantics-based integration tools, which are
considered a kind of middleware that thinks, because they utilize a
239

240
Executive summary
combination of natural language analysis, pattern recognition, artificial
intelligence and other leading-edge cognitive technologies.
31. Content is an integral part of the business and is a product of every application
and should be managed from a single repository as part of the infrastructure.
What the technology industry is offering is better ways to share information in
chunks, remotely, but in a structured way. Sitting on top of existing technologies
such as ERP, workflow and document management is the corporate portal – a
simple personalized Web environment offering one view of all data and
information sources. Content management functionality is now being embedded
into portals, like mySAP Enterprise Portal.
32. Martin Butler believes that two-thirds of the value of large companies is made
up of information and knowledge and to overlook this issue is to devalue the
business.
9 Supply/demand chain management
33. When products are produced and then pushed to customers it is a supply-led
chain; when the customer is involved in specifying the products to be produced,
it is a demand-led chain. The demand chain (DC) focuses all its resources on
consumer demand, involving a radical change in thinking that takes the
company, its SC partners and its systems into a new business environment.
34. Building an e-commerce S/DC not only requires integration with back-office
finance and payment systems, but equally all along the value chain to suppliers
and their suppliers. There are five basic components for S/DCM: plan, source,
make, deliver, return. At each stage, monitoring and measurement systems need
to be put in place to provide information for all parties to the chain and to
monitor performance, efficiency and effectiveness.
35. The S/DC in many organizations can consume well over 50 per cent of a
company’s operating expenses, so it is an obvious area to explore and exploit
in the search for business systems improvement. It is unlikely to be possible to
move the entire S/DC to the Internet at one time so it may be necessary to have
a strategy of phased implementation starting with the areas where the greatest
impact and ROI can be achieved.
36. Product lifecycle management covers everything from now well-established
mechanical CAD software to new web-based tools allowing non-engineers
access to ‘lite’ versions of 3D data. Collaborative product commerce and
visualization software help companies plan factories and production digitally.
Companies that have been using digital mock-up software, reducing the need
for physical mock-ups or prototypes, can now use the Internet to give all their
suppliers access to the digital data.

Executive summary
37. The challenge for logistics is to deliver the promise made to the customer and
allow customers to track deliveries while in progress.
38. According to McKinsey research, just 15 per cent of all websites accounted for
85 per cent of all revenues. The best companies’ websites make it easy to buy
and easy and secure to pay, with web pages downloading quickly and 95 per
cent of orders delivered on time, e.g. Tesco and Amazon. With e-commerce,
companies only have one chance to win and keep a customer.
39. Organizations seeing eBay’s success are moving into B2C online auctions, e.g.
Dell, Microsoft, and more than 100 other companies have linked their websites,
along with 46 million users, to a new auction platform run by FairMarket.
10 E-procurement
40. E-procurement is the electronic acquisition of goods and services, which can
include any stage from identifying the needs for goods through to contract
management. It works upstream in the S/DCM process and covers the five
rights of purchasing: price, time, quality, quantity, source. Tangible benefits
can be assessed in three broad areas: transactional efficiency, supply market
management and supply chain restructuring e.g., Microsoft’s average
transaction cost dropped from £145 to £5.
41. There are three models of approach to links with suppliers:
– Buy side – a many-to-one trade transacted via the buyer’s website, who has
responsibility for maintaining data.
– Sell side – a one-to-many trading relationship carried out via the supplier’s
website, with the supplier having responsibility for maintaining data.
– E-market – a many-to-many trading relationship with multiple buyers and
sellers brought together by an online intermediary. This allows companies
to exchange information, source products and services and execute online
transactions, through online catalogues, hubs and auctions.
42. There are three main types of B2B exchanges:
– private trading exchanges (PTX) – owned and run by one company to
manage its own trading-partner relationships, e.g. Cisco, Dell and
Volkswagen;
– independent exchanges – a many-to-many network, which can be either
vertical (IVX) connecting many buyers to many sellers in a vertical market
segment or horizontal (IHX) connecting buyers and sellers in any industry;
– Consortium trading exchange (CTX) – bringing together major industry
players seeking to reduce transaction and product costs and speed up the
delivery chain, e.g. Transora, Covisint.
241

242
Executive summary
43. Open standards are used to increase interoperability between systems as well
as interconnectivity because everyone is exchanging consistent, standardized
content.
44. The Unilever case study explains how the e-procurement project is expected
to contribute substantial savings through effective leverage of size and scale
enhanced by common business processes and simplification of complexity.
Unilever has recognized the importance of implementing a global supply
management programme focused on non-production items.
11 Customer relationship management and e-marketing
45. CRM is about transforming an organization to become customer-centric and
customer-facing in all that it does. It is about a change in culture that switches
the emphasis of, for example, fulfilment from looking inwardly at what suits
manufacturing and the supply chain to satisfying the company’s external
promises about service and delivery. Successful CRM is about giving the
customer a better experience, hence enhancing the company’s chances of
retaining the lifetime value of that customer and acquiring new customers.
46. The CRM process can be split into three stages and involves both online and
offline techniques: customer acquisition, customer retention and customer
extension.
47. The application of technology to achieve CRM is a key element of any
e-business. CRM applications cover three broad categories: marketing
automation, sales process automation and customer service automation.
48. Marketing is responsible for identifying, anticipating and satisfying customer
requirements profitably and the different stages that should be involved in an
e-marketing strategy are: situation analysis, objectives statement, strategy
definition, tactics, action and control.
PART 4 HOW TO ANALYSE, RE-ENGINEER AND
MANAGE BUSINESS PROCESSES
12 Business process analysis
49. Process/activity-based techniques (P/ABT) are now widely used and fall into three
main categories: costing, performance improvement and performance
management. Over the past decade, P/ABT have stopped being used as one-off

Executive summary
techniques and have become a company-wide, all-embracing, advanced planning,
monitoring and control system, incorporating quality initiatives like Six Sigma.
50. All P/ABT involve analysing the business to gain a greater knowledge of what
activities it performs and how those activities relate to one another to form
processes. This process-based analysis then forms the central database, which
can be utilized by all P/ABT.
51. The Anglian Water case study examines the company’s design methodology,
using a process-based business intelligence tool, building detailed business unit
models and merging them to form a corporate model. The software was
selected because of its suitability to be used as an end-user information
delivery system, with interaction capabilities.
13 Activity/process-based costing
52. ABC is now accepted as the most appropriate method of costing company
processes, products and services. The main difference between ABC and
traditional costing is that, instead of collecting overhead costs into one or
more central pools to be allocated arbitrarily to all processes, products and
services, it first allocates resources to activities, prior to allocating to
processes, products and services based on actual usage.
53. The fourth dimension of the ABC model provides customer/market/sector/
process profitability, by multiplying product and service costs and revenues by
the volumes of sales to each customer and attaching any customer- or market-
driven costs directly.
54. In 1999 the government announced its plans to meld all the logistics and
support services for the country’s Armed Services into one body called the
DLO, its motive being to reduce its £4.6 billion annual operating costs by 20
per cent by 2005, without reducing any services provided by its 43,000 staff.
It is using ABC to achieve this.
14 Business process performance improvement
55. Early activity-based cost management performance improvement initiatives
based on functional responsibilities have now given way to business process
re-engineering (BPR), focusing on processes and constraint removal, not
departments and functions.
56. In the ABB case study, the objectives are to cost and price products better; to
enable better management through insights into activities; to use ABC as a
tool for change management; and to facilitate strategic decision making.
243

244
Executive summary
15 Change management
57. In the twenty-first century change is a constant. For organizations which
manage change skilfully, it can become the driving force that perpetuates
success and growth, with every change presenting a new opportunity to
increase efficiency or to build the business. But all too often change fails as
companies do not rise to the challenges it brings.
16 Business process performance management
58. The need for one integrated performance management system that links strategy
via the BSC to a detailed model of the organization, incorporating objectives and
balanced measures for time, quality and cost cascaded down the process hierarchy
throughout the organization, is now well understood (see Figure 2.2, p. 20).
59. This chapter examines P/ABT including activity-based budgeting; cascading of
objectives down the organizational processes hierarchy together with
balanced performance measures and targets; the ability to evaluate alternative
service levels; priority-based budgeting; and process/activity reporting,
including earned value analysis.
60. Metropolitan Housing Trust applied many P/ABT to its reactive repair
process, including using ABC to calculate the cost of the process, identifying
potential cost-savings; benchmarking with another organization utilizing the
same software; establishing best practice, performance measurement and
comparisons of process-based methods and its traditional budgeting.
17 Process-based accounting incorporating Six Sigma
61. Jim Brimson in his book The Handbook of Process-Based Accounting:
Leveraging Processes to Predict Results brings together all of the elements of
process-based management and other accounting and performance measurement
tools and techniques, including Six Sigma, into one all-encompassing predictive
accounting framework.
62. Six Sigma is a measurement of standard deviation. Pande Nueman in The Six
Sigma Way says:
Whether designing products and services, measuring performance,
improving efficiency and customer satisfaction – or even running the
business – Six Sigma positions the process as the key vehicle of success.
Research has shown that the costs of poor quality (rework, mistakes,
abandoned projects, etc.) in service-based businesses and processes
typically run as high as 50 per cent of total budget.

Executive summary
63. The GE case study explains that the reason for the introduction of Six Sigma
is to improve processes so that GE will not have to spend $7 billion of its
revenues each year on scrap, rework and error resolution. An example success
story was the plastics division, which essentially created a free plastics plant
which would have cost $400 million to build.
245


247
Index
a-Services
8
AA
139
Accenture
22
accounting, process-based
217–24,
244–5
action
142
activities
150, 151, 203, 204
activity analysis
150–5
activity-based budgeting
201–3,
215–16
activity-based cost management (ABCM)
178–80
activity-based costing (ABC)
163–74,
183–7, 191, 212–13, 216, 243
activity classification
177–8, 179–80
activity drivers
167–9, 178–9
adapters
36–7
Add to Telephone Bill
55–6
Address Verification Service (AVS)
55
Advisory Commission on Electronic
Commerce
67
Aggresso
77–8
Amazon
56, 63, 66, 107, 109
American Express
134
AMS
18
Anglian Water Services (AWS)
156–61
anti-virus protection
62
AOL
67
Apogee Networks
44
application service providers (ASPs)
22–5
application vendors
52
Applied Discovery
92
Ariba
121, 124, 125, 129
Asea Brown Boveri (ABB)
165, 183–7
AstraZeneca
115
asynchronous transfer mode (ATM)
45
Atriax
54
auctions
108–9
Authentica
92
automated auditing processes
(‘auditbots’)
9
automation
136–9
BAAN
73
balanced performance measures
204–6, 207, 215
balanced scorecard (BSC)
19–20
Band-X
119
banking
53
Barclays
63, 66
Bayer
47
BEA
37
benchmarking
214–15
Benetton
7
Bertelsmann
55
BiBit
56
BizTalk
33–4, 37
Bluetooth
46
BOC Group
96
Boston Scientific
85
BP Amoco
24, 87, 166
British American Tobacco (BAT)
106
Brittany Ferries
52
broadband
44
BS 7799
63
BT
17
Ignite
23–4
budgeting
priority-based
206–10
process-based
201–3, 215–16
budgeting panels
209–10
Build-on-line
118
business to employee
83–97, 239–40
Business Exchange
109
business intelligence
89–90
business process analysis
10, 147–61,
242–3
Business Process Management Initiative
(BPMI)
9
business process re-engineering (BPR)
82, 103, 179, 180–7, 191,
214–15
business strategy
13–25, 236–7
business sustaining costs
169
Butler Group
93–4
buy side procurement
116
buyer direct EIPP
52
Cable & Wireless
8
Cabot
21
CAM-I cross
151, 152
Cambridge Technology Partners
140–1
capacity on demand (COD)
39

248
Index
card security code (CV2)
55
cause and effect analysis
181
CFO Europe
19
CGU Life
35
change agents
195–7
change management
189–97, 244
Chemconnect
119
Cincinnati Bell
91
Cisco Systems
7, 11, 106, 113, 117,
118
Clarify
136
Clarks Shoes
104
Coats
38
Coda
43
collaborative commerce (c-commerce)
5
Commerzbank
139
Compaq
8
Computer Misuse Act 1990
66
computer and telephone integration
(CTI)
80
Con-Way Transportation Services
21
Connect 2020
22
Consignia
138
consolidator EIPP
52
consortium trading exchanges (CTX)
119–21
Constructeo
119
content management systems
92
continuous replenishment
5
Contivo
91
control
142–3
control charts
219, 221–2
Convention on Cybercrime 2001
67
Convergys
143–4
copyright law
65
core processes/activities
151, 152, 177,
203
Corechange
93
corporate processes
203
cost
113
ASPs
23–4
balanced performance measure
204–6, 207, 215
implementation of S/DCM
104–5
cost drivers
167–8, 178
costing
149
ABC
163–74, 183–7, 191, 212–13,
216, 243
how ABC differs from traditional
166–7
indicators of need to review
166
Covisint
119
credit cards
54–5
Credit Suisse First Boston (CSFB)
114
culture change process
193
customer acquisition
134
customer extension
136
customer profile
134
customer profitability
172–3
customer relationship management
(CRM)
16, 44, 90, 131–44, 242
customer retention
134–6
customer service
107–8
automation
138–9
cybersmearing
65
data
collection
153–5
quality and compatibility
90–1
Data Protection Act 1998
59, 64
data storage
38–9
debit cards
54–5
Defamation Act 1996
65
Defence Logistics Organization (DLO)
166, 174
Dell
16–17, 109, 117
Delta Air Lines
21
demand chain management see
supply/demand chain
management
denial of service (DOS) attacks
66
Deutsche Bank
62
DHL
52
disaster recovery
60
disintermediation
7
Disney
64–5
distributed DOS attacks
66
diversionary (primary non-value added)
activities
177, 179–80
document management
79–80
downstream supply chain
101
DuPont
59
e-business
15
E-Exchange
119
92
management policy
61
earned value activity analysis
210, 211
EasyBis
56
eBay
66, 108–9

Index
eBIS-XML
33
EDS
25
electronic bill presentment and payment
(EBPP)
54–6
Electronic Commerce Code Management
Association (ECCMA)
121
electronic data interchange (EDI)
5, 51
electronic funds transfer (EFT)
51, 54
Electronic International Attribute Code
(EIAC)
121
electronic invoice presentment and
payment (EIPP)
51–2
electronic marketplaces
108–9, 116–21
elogistics
119
emotional impact of change
192
employees
83–97, 239–40
encryption
92
end-to-end business process management
(E2E BPM)
8–10
enterprise application integration (EAI)
36–8
enterprise integration (EI)
18
enterprise portals
93–7
enterprise resource planning (ERP)
16,
71–82, 128, 238–9
ethical hacking
62
European Union law
51, 66–7
Eutilia
119
extended message service (XMS)
46
external audits
141
extranets
32, 62
facilitation
196–7
FairMarket
109
firewalls
62
Flymo
51
Ford Motor Company
15, 43–4, 95,
107
foreign exchange trading
53–4
fraud, measures against
55
Freeserve
67
front-end systems
106–7
General Electric (GE)
113, 118, 197,
223–4
General Motors (GM)
15, 104
general packet radio service (GPRS)
45
Gigabit Ethernet
39
Hailstorm
35
Halifax
116
Herman Miller
95
Hewlett-Packard (HP)
94, 117
high speed circuit switched data
(HSCSD)
45
horizontal independent exchanges (IHX)
119
hosting
22–3
Hronec, S.
204, 205–6
HSBC
55
HTML (hypertext mark-up language)
33
HTTP (hypertext transfer protocol)
32
human resource management
85–7
Hummingbird
93
i2
121
IBM
37, 88–9
IDC
85
IdeaMarketplace
119
IMI Norgren
106
independent exchanges
118–19
industry standards
63–4
Infobank
119
information management
89–90
Inland Revenue
96
instant messaging (IM)
46–7
insurance
61
Intel
10
intellectual property rights (IPR)
65
internal audits
141
Internet
31–2
security
63
standards and protocols
32–4
see also Web
Internet service providers (ISPs)
31, 65
Internet Tax Freedom Act 1998
67
integrated performance management
20
Intel
10
intranets
32, 62
intrusion detection services
63
invoicing, electronic
49–56, 127, 238
IS 17799
63
IT
dynamic corporate IT policy
60–1
investment
18–19
JC Penney
109
JD Edwards
73, 76
Jefferson County
37–8
249

250
Index
Keen, P.
43–4
KeyBank
91
knowledge mobilization
43
knowledge transfer systems
222–3
Koerting, P.
75–6
Kraut, R.
6
KVS
92
Lafarge Group
87
leadership qualities
196
legislation
59, 64–7
lifetime customer valuation (LCV)
143–4
Liverpool City Council (LCC)
17
Liverpool Direct
17
Lloyds TSB
143
localization
135
logistics
43–4, 107
Lufthansa
44
Mackintosh, D.
43–4
manufacturing
105–6
marketing
242
automation
136–7
communications
134
e-marketing strategy
141–3
marketplaces, electronic
108–9,
116–21
mass customization
134–5
Masterbit
47
Mercator
37
messaging
46–7
Metalspectrum
119
Metropolitan Housing Trust (MHT)
212–16
micro payments
55–6
Microsoft
8, 63, 109, 113
BizTalk
33–4, 37
Hailstorm
35
.Net My Services
63–4
.Net 2.0 Web Services platform
35
mobile technology
41–7, 238
modelling, process-based
173–4
Modulant Solutions
91
Mondus
31
monitoring
210–11
More Th>n
137
motivation of staff
193
Motorola
88, 222
NASA
63
National City
21
National Health Service (NHS)
87
network attached storage (NAS)
38–9
Network Inference
91
Nike
7
Nissan North America
25
non-value added activities
177, 179–80
objectives
203–4
objectives statement
142
Obscene Publications Act 1959
59, 65
online communities
135
Online Personal Privacy Act
64–5
open standards
35, 121
Open Systems Interconnection (OSI)
34
opportunity management
78
Oracle
23–4, 73, 121
9i
76
Virtual Private Database
62
Orient Express
96–7
outsourcing
22–5, 105–6
PacifiCare Health Systems
60
partnerships
7–8
PayDirect
55
payment service provider (PSP)
54
payments, electronic
10, 49–56, 127,
128, 238
peer-to-peer (P2P) computing
47
Peoplesoft
73, 76, 88
performance improvement
149,
175–87, 243
performance management
20, 149,
199–216, 244
permission marketing
133
personalization
134–5
Philips
53
PIN numbers
55
PLAUT
107–8
Plumtree
93
portals, enterprise
93–7
Powergen
63
Premier Paper
104
pre-pay cards
55
pricing
149, 172–3
priority-based budgeting (PBB)
206–10
private trading exchanges (PTX)
117–18

Index
process analysis
150–5
process/activity-based techniques
(P/ABT)
149–50, 201, 242–3
process-based accounting (PBA)
217–24, 244–5
process-based budgeting
201–3,
215–16
process-based costing see activity-based
costing
process-based management (PBM)
199–216, 244
process-based modelling
173–4
process-based performance measurement
221–2
process hierarchy
151, 203–4
process improvement lifecycle
182
process management
73–4
process model
156
processes, characteristics of
219
Procter & Gamble (P&G)
5
procurement
101, 111–29, 241–2
models
115–16
product lifecycle management (PLM)
105
production
105–6
profitability
149, 172–3
project management
78
proposal creation
78
protocols, Internet
32–4
ProXchange
144
public key infrastructure (PKI)
62
public sector
17
quality
balanced performance measure
204–6, 207, 215
service quality
135–6
quantum performance matrix
205–6
recruitment
87–8
Regulation of Investigatory Powers (RIP)
Act 2000
64
Reitan Narvesen
47
reporting
78, 210–11
resource drivers
167–9
resource scheduling
78
responsibilities
203–4
return on investment
18–20
risk management
59–60, 238
Rolls Royce
25, 115
Rome II
66–7
Royal Bank of Scotland (RBS)
45
Royal Dutch/Shell
36, 166
Royal National Lifeboat Institution
(RNLI)
77, 80–2
Royal & Sun Alliance (R&SA)
95–6,
137
Safeway
88
Sage
73, 136
Sainsbury
60
sales process automation
137–8
SAP
73, 76, 81, 82, 121
Sara Lee DE
54
Scala
73, 76
security
59–64, 238
SeeBeyond
37
self-service HR
85
sell side procurement
116
seller direct EIPP
52
semantics-based integration technology
91
service levels
206–9
service process optimization (SPO)
77–9
service quality
135–6
shared-services centre (SSC)
8, 9
Shell
36, 166
short message service (SMS)
46
Siebel
136
situation analysis
141
Six Sigma
219, 222, 223–4, 244–5
Sky Services
138–9
smart cards
55
SMART objectives
193
SOAP (single object access protocol)
33, 35
SOSTAC framework
141–3
Splash Plastic
55
standards
industry
63–4
Internet
32–4
open
35, 121
Steinbeis Temming
80
STI Knowledge
87
storage area network (SAN)
39
Storebrand
36
straight through processing (STP)
53
Stralfors Group
106–7
Strassman, P.
19
251

252
Index
strategy
benefits of business community
integration
3–11, 235–6
business strategy
13–25, 236–7
definition
142
supply/demand chain
103–5
sub-processes
151–3, 203, 204
sub-tasks
152, 203, 204
supply/demand chain management
16,
43–4, 99–109, 114, 125, 240–1
support activities
178
Swedish National Board of Health and
Welfare
44
SWOT analysis
141
Synstar and SchlumbergerSema
60
tactics
142
tasks
150–3, 203, 204
taxation
67
TCP/IP
34
technology
9
mobile and wireless
41–7, 238
web-enabling
29–39, 237
Telia
38
Tesco
107, 108
Thames Water
22
3D SET (three domain secure electronic
transaction)
55
Tibco
37
time
balanced performance measure
204–6, 207, 215
time and expense capture, accounting
and reporting
78
training
88–9
transaction vendors
52
transactional efficiency
113
Transora
119
Trojan Horse software
66
Tumbleweed Communications
92
Turban, E.
114
Turnbull Report
59
Uni-X Software OpenInformer
44
Unicorn Solutions
91
unified messaging (UM)
47
Unilever
121–9
United Airlines
105
Universal Description Discovery and
Integration (UDDI) project
35
Universal Standard Product and Services
Classification (UNSPSC)
121
UPS Logistics Group
107
upstream supply chain
101
US telecom company
91
value, measurement of
18–21
value chain
179
Vantive
136
vertical disintegration
6
vertical independent exchanges (IVX)
118–19
vertical integration
6
vertical organization
6
video-conferencing
45
virtual organization
6–7
virtualization continuum
6
Vitria
37
Voice over Internet Protocol (VoIP)
45
voice over packet networks
44–5
Volkswagen
47, 113, 117
Wal-Mart
5, 90, 107
Web
31–2
hosting
22–3
services
34–6
see also Internet
web-enabled organization
15–17
web-enabling technology
29–39, 237
WebMethods
37
WiFi
44
wireless application protocol (WAP)
46
wireless local area networks (WLANs)
44
wireless technology
41–7, 238
Woolworths
63
workflow systems
80
World Wide Web see Web
World Wide Web Consortium (W3C)
91
XBML (extensible business mark-up
language)
33
XBRL (extensible business reporting
language)
33
XML (extensible mark-up language)
33
Yahoo!
46, 55, 63, 67, 93
Document Outline
Wyszukiwarka
Podobne podstrony:
Seahra S Path integrals in quantum field theory (web draft, 2002)(36s) PQft
Workflow, Business Process Modeling Notation
Business Process Modeling with EPC and UML
Business Process Reengineering, ZARZADZANIE WSB W
Supply Chain Risk Management practices in automotive industry
Business Process Reengineering
Integration in Psychotherapy
Exploiting large memory management vulnerabilities in Xorg server running on Linux
Financial Times Prentice Hall, Executive Briefings, Business Continuity Management How To Protect Y
Writing at Work A Guide to Better Writing Administration, Business and Managemen
Lecture 1 Business Performance Management
Enough With Default Allow in Web Applications!
St George Semantic Integration in Reading, Right Hemisphere
więcej podobnych podstron