
Modelling Large Sound Sources in a Room Acoustical
Calculation Program
Claus Lynge Christensen
Department of Acoustic Technology, Technical University of Denmark, Building 352, DK-
2800 Lyngby, Denmark. mailto:clc@dat.dtu.dk.
Summary: A room acoustical model capable of modelling point, line and surface sources is presented. Line and surface
sources are modelled using a special ray-tracing algorithm detecting the radiation pattern of the surfaces in the room.
Point sources are modelled using a hybrid calculation method combining this ray-tracing method with Image source
modelling. With these three source types, it is possible to model large and complex sound sources in workrooms.
INTRODUCTION
The ODEON model described in this paper has its roots in the auditoium acoustics, but recent
development has been directed towards improving the model as a tool for prediction of
workroom acoustics as well. Like0 auditorium acoustics, the acoustics of workrooms are often
hard to predict using diffuse field theory and large errors may arise. Many types of workrooms
exist - to mention a few examples: A turbine hall at a power plant, the condenser hall at a power
plant and the check-in desk at an airport. These examples include the problems of modelling:
•
Large and distributed sources.
•
Fittings in rooms.
•
Unevenly distributed absorption.
•
Unevenly dimensions of the room, and possibly complicated geometry.
•
Coupled rooms.
Some of the problems are somewhat known from the auditorium acoustics, however the problem
of large sources and fittings deserves some extra attention.
LARGE SOURCES
Sound sources in some industrial environments, e.g. in a turbine hall are often of considerable
size. This means that sources may also have a shielding effect and sound radiation may be
distributed in space. If neglecting the shielding effect, the calculated levels will be overestimated.
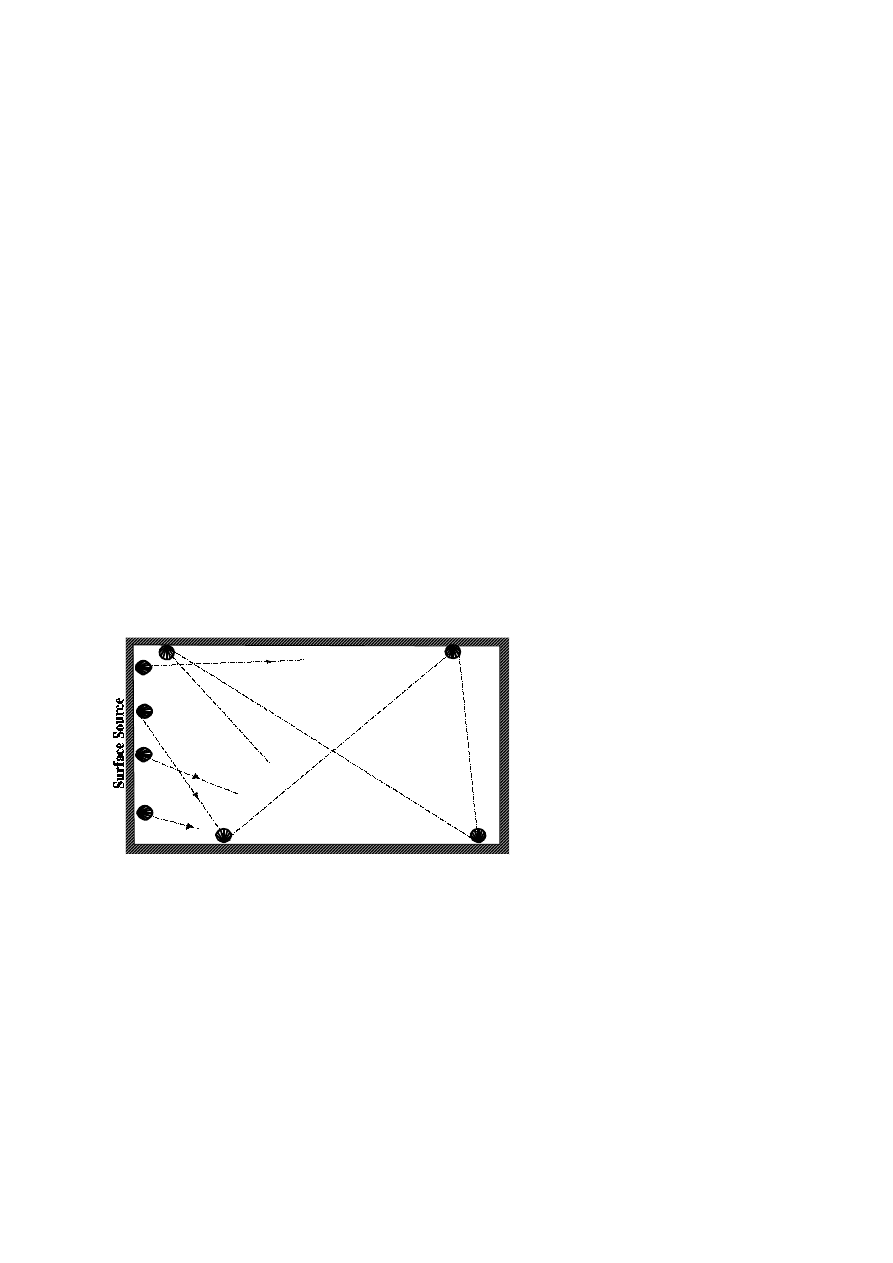
FIGURE 1. Surface source radiating four rays, of which the first
four reflections are shown for the first ray.
If modelling a sound-radiating panel as a few point sources on the surface sources, Sound
Pressure Levels will be overestimated in some areas and underestimated in other. In ODEON 3.x
it is possible to model point sources which are implemented using a combination of the Image
Source Method (ISM) and a special ray-tracing method (RTM) and surface and line sources
which are implemented using the RTM.
The hybrid calculation method used in ODEON for modelling the radiation from point sources
is described elsewhere [1,2,3], so this section will rather focus on the calculation method applied
on line and surface sources. It should however be mentioned that the ISM implemented in
ODEON takes into account the limited size of the surfaces [2]. This is important when modelling
machinery using many small surfaces, where the ISM would otherwise lead to problems as the
classical implementation assumes the reflecting surfaces to have infinite size.
In any case, the calculation method in ODEON is, simplified a bit, divided into two parts. The
first part has the focus on tracing down the radiation pattern of the room, the second part on
collecting reflections received at a specific receiving point.
TRACING DOWN RADIATION PATTERN
A number of rays N are emitted from
the surface (or line) source each
carrying 1/N‘th of the source power.
For each ray emitted from a line or
surface source, a random starting point
is created on that source. At each
starting point, a secondary source is
located, each of the secondary sources
have a directivity of
meaning
c o s
ϕ
that their radiation into the room is
proportional to the projection of the
area of the surface source as seen from
a given point. Each ray is traced
around the room and each time a ray is
reflected by a wall, a new secondary
source is created at the point of reflection. The secondary source will have a strength due to
absorption and distance travelled and it will have a delay because of the distance travelled.
Directivity due to Lamberts law is assigned to each secondary source. Lamberts law is taken
from the optics and suggests that radiation /reflection from a surface is proportional to the
projection of the surface as seen from the receiver. The reflected directions of the rays are
calculated as a weighting between the specular direction and a random direction with a
probability distribution according to Lamberts Law [3]. The scattering coefficient entered by the
user is used as a weighting factor. So if the scattering coefficient of a surface is exactly 0.5, the

FIGURE 2 Model of turbine hall containing two
turbines. The hall is modelled from 54 surfaces and
contains 46 surface sources and four point sources.
reflected direction is calculated as a weighted average between the specular direction due to
Snells law and a random direction.
COLLECTING REFLECTIONS AT A RECEIVER
Having traced rays around in the room, a number of secondary sources have been located on the
surfaces of the room, each with its own orientation, delay and strength. At this point reflections
from the sources can be collected at a receiving point, each source contributing a reflection to
the receiver if it is visible from the given receiver position. The visibility is checked by tracing
the path from the receiver to the secondary source, using ray-tracing.
Compared to a more traditional RTM, one of the main advantages in tracing down the radiation
patterns of the room, is that rays do not necessarily need to come close to the receiver to
contribute reflections. If just a reasonable number of reflection points are visible from a receiver
point, reliable results can be obtained. Consequently good results can be obtained with
substantially fewer rays than from more traditional ray-tracing (typically 1000 rays per source
are used to obtain reliable results).
FITTINGS
In room acoustics models used for auditorium acoustics the audience area is usually considered
as one surface, with a high scattering coefficient. This way of modelling fittings may also be
applied on workroom acoustics, if modelling fittings which are located on a surface and has a
limited size and the fitting density is high. However this method may not prove valid in all
situations as fittings in workrooms may be of considerable size and may be located at ‘any’ place
in the room or are hard to describe. In such cases the fittings will have to be modelled in another
way. Using a CAD program or indeed the parametric modelling language which is build into
ODEON (a parametric modelling language allowing definitions of points and surfaces to be
carried out using constants, variables, counters etc.), it is easy to model many obstacles
(machinery, beams and columns). A special option it is allowed to assign a transparency
coefficient to a surfaces in ODEON enabling fast modelling of installations which are not well
defined e.g. electric installations. Future work may look into when the different approaches can
be used at its optimum.
EXAMPLE OF VERIFICATION
The verification example given here is a turbine hall
with uneven dimensions (153 x 34 x 20 metres),
uneven distribution of absorption area and sound
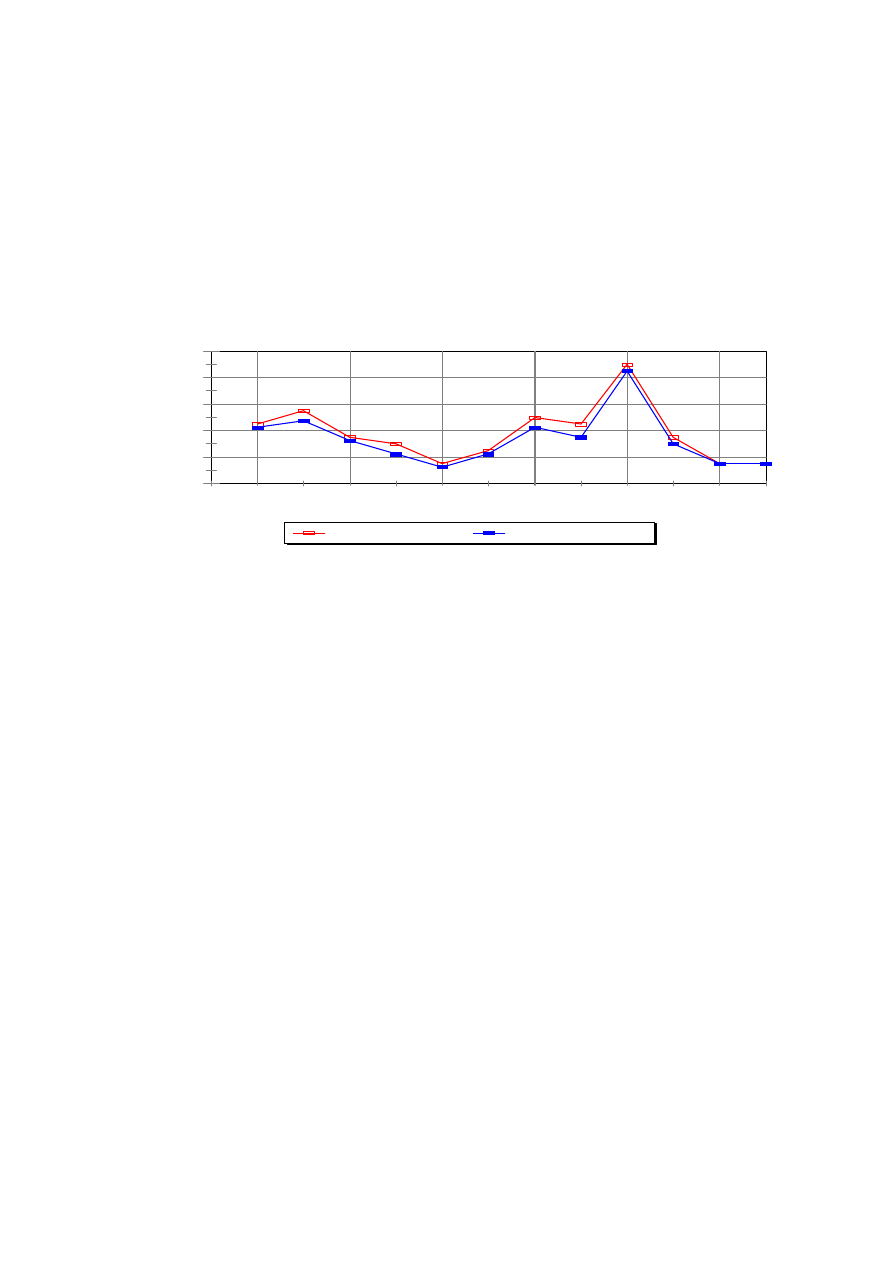
sources (see figure 2). In figure 3 calculated versus
measured A-weighted Sound Pressure Levels in the
78
82
86
90
94
98
SPL(A) in dB
0
2
4
6
8
10
12
Receiver positions
Measured
Calculated
FIGURE 3. Measured and calculated SPL(A) values in 12 receiver points in a turbine hall. Maximum deviation
between measured and calculated levels are 1.6 dB(A) - the average deviation is 0.83 dB(A).
turbine hall with two turbines are shown. The turbine hall was modelled using 54 surfaces and
contains 46 surface sources and four point sources (ball bearings). The absorption data used in
the calculations were provided by manufacturer and in some cases guessed. Source data were
measured using the intensity method. A-weighted sound pressure levels were measured and
calculated at 12 receiver points, in distances of 0.7 - 20 metres from the nearest sound source
[4]. The measured levels range from 81 to 96 dB(A) and the maximum deviation between the
measured levels and the levels calculated using surface and point sources is 1.6 dB(A) with an
average deviation of 0.83 dB (A) [5].
CONCLUSION
The ODEON room acoustical computer model has been extended to allow the modelling of large
sound sources. It has been shown that this allows predictions of SPL(A) the in a turbine hall
within 1.5 dB, with an average derivation from measured values below 1 dB.
REFERENCES
[1] Christensen,C. L., Odeon Room Acoustics Program, Version 3.1, User Manual, Industrial, Auditorium and
Combined Editions, Department of Acoustic Technology, Technical University of Denmark, Lyngby, 1998. (55
pages).
[2] Rindel J. H,, Computer simulation techniques for the acoustical design of rooms - how to treat reflections in
sound field simulation. ASVA 97, Tokyo, 2- 4 April 1997. Proceedings p. 201-208.
[3] Rindel J. H., Computer Simulation Techniques for Acoustical Design of Rooms. Acoustics Australia 1995, Vol.
23 p. 81-86.
[4] Foged, H. T., Test af program til beregning af intern støj - test af Odeon ver. 3.0 for Windows 95.
Elsamprojekt, Denmark, November 1997.
[5] Christensen, C. L., Foged, H. T., A room acoustical computer model for industrial environments - the model
and its verification. Euro-noise 98, München, Proceedings p.671-676, 1998.
Wyszukiwarka
Podobne podstrony:
Dance, Shield Modelling of sound ®elds in enclosed spaces with absorbent room surfaces
Dance, Shield Modelling of sound ®elds in enclosed spaces with absorbent room surfaces
IMPORTANCE OF EARLY ENERGY IN ROOM ACOUSTICS
New possibilities in room acoustics measuring
Farina, A Pyramid Tracing vs Ray Tracing for the simulation of sound propagation in large rooms
Stasheff, Christopher Rogue Wizard 01 A Wizard in Mind
Rindel MODELLING IN AUDITORIUM ACOUSTICS Sevilla 2002 Rindel 8p
Stasheff, Christopher Rogue Wizard 02 A Wizard in Bedlam
Rueda Electromagnetic Zero Point Field as Active Energy Source in the Intergalactic Medium (1999)
Feehan, Christine Magic Sisters 01 Magic in the Wind
Stasheff, Christopher Rogue Wizard 03 A Wizard in War
Christmas is my favourite time in year
Installing sound drivers in Windows 95
Stasheff, Christopher Rogue Wizard 05 A Wizard in Chaos
A Country Song For Christmas Andria Large
AJA Results of the NPL Study into Comparative Room Acoustic Measurement Techniques Part 1, Reverber
The Beck Brothers 4 Christian Andria Large
Stasheff, Christopher Rogue Wizard 04 A Wizard in Peace
więcej podobnych podstron