
1
Keynote Lecture, Forum Acusticum, Sevilla, 16-20 September 2002.
Proceedings CD-ROM, paper KL-04.
MODELLING IN AUDITORIUM ACOUSTICS –
FROM RIPPLE TANK AND SCALE MODELS TO COMPUTER SIMULATIONS
PACS: 43.55.Ka
Rindel, Jens Holger
Ørsted
•DTU, Acoustic Technology, Technical University of Denmark
Building 352, DK 2800 Kgs. Lyngby, Denmark
Tel: +45 45 25 39 34
Fax: +45 45 88 05 77
E-mail:
jhr@oersted.dtu.dk
ABSTRACT
The paper deals with the tools for the acoustic design of auditoria, and the development of
these tools during the last century. Ripple tanks could model the wave nature of sound in a
reflecting enclosure, but only in two dimensions. Scale models using high frequency sound
waves have been used for testing the design of new auditoria since the 1930es. The
development of the room acoustic parameters flourished along with the development of scale
model technique. But also the possibility to listen to the sound in the model was a challenge
since the early days. The first computer models for room acoustic design appeared around
1967 and during the1990es they have matured. The results became more and more reliable,
the calculation speed increased significantly, and new methods for acoustic analysis of the
auditorium were developed, one of them being the possibility of producing high quality
auralization.
INTRODUCTION
The development of the design tools is described in three sections considering physical models,
scale models, and computer models. First is mentioned the early attempts by Sabine and others
to use various physical models, primarily to analyse the first reflections in a two dimensional
section of a room. Either wave fronts or rays could be modelled. With microphones it became
possible to take recordings of sound in scale models, and from the beginning the purpose was
to perform listening tests, i.e. what today is called ‘auralization’. The development of the scale
modelling technique from the 1930es to the 1970es was mainly to reduce the scale from
originally 1:5 to 1:50, and thus making the technique a more efficient tool for the design
purpose. The development of computer models has been in the direction of combined hybrid
models with emphasis on calculation speed and more reliable results. For the developers of
room acoustic computer models it has been very important that a number of international Round
Robin comparisons have been organised. From those it has been clear that the modelling of
scattering effects is crucial for obtaining reliable results. Thus it may be of great importance for
the future development that ISO is now preparing methods for treatment of scattering.
This presentation will focus on the historical development with emphasis on the old and partly
forgotten techniques, whereas the newest development in computer models can easily be found
elsewhere.
2
PHYSICAL MODELS
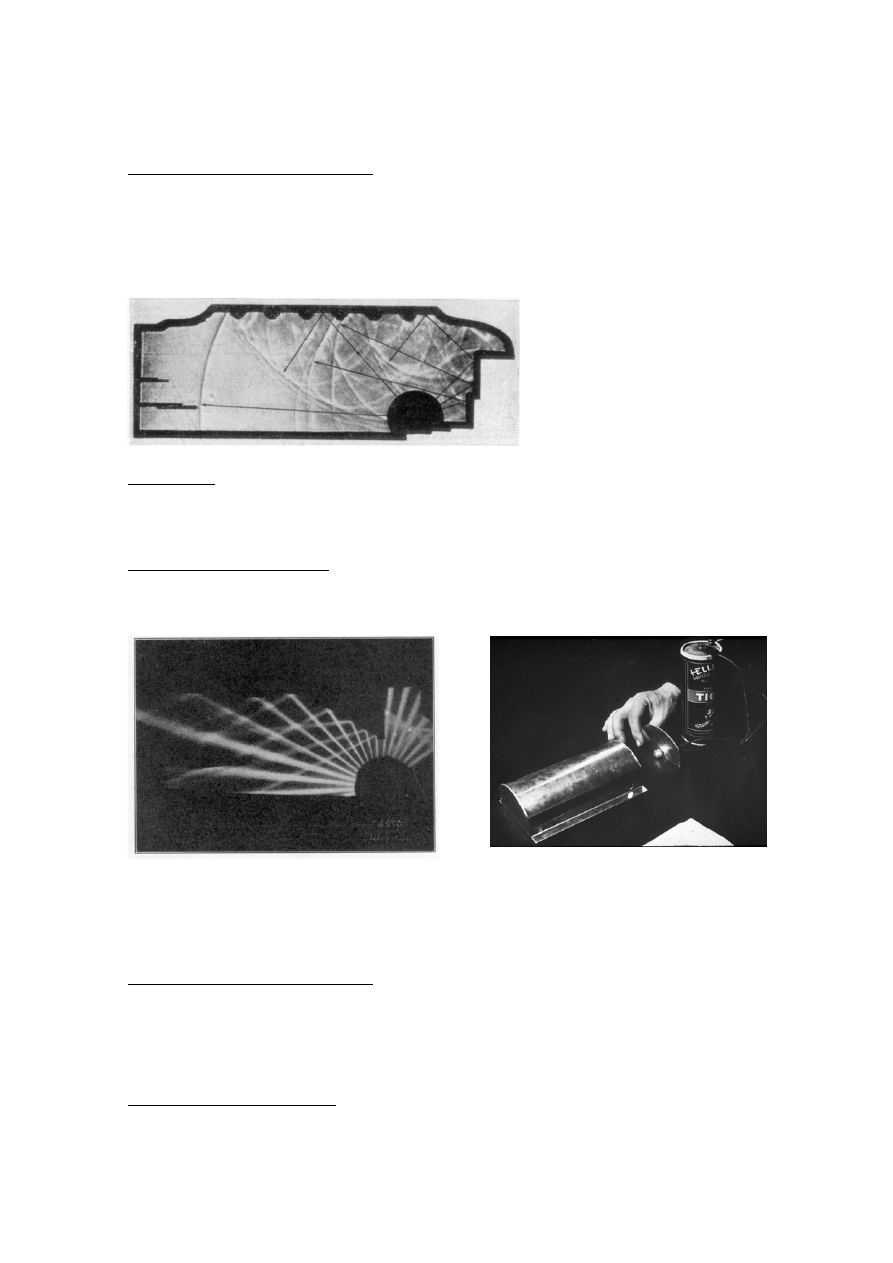
Ultrasonic – Schlieren Photography. In 1913 Sabine published a paper describing the use of
ultrasonic waves and Schlieren photography to study wave front reflections from the ceiling and
walls in 2D sections of a scale model [1]. The sound source is an electric spark made by the
discharge of a condenser. With smoke-filled air and strong light from behind, the wave fronts
are made visible and can be registered on a photographic plate. The light is refracted because
the wave front is much denser than the surrounding air. The method can visualize effects of
diffraction and scattering from irregularities.
Fig. 1. Schlieren photograph
showing reflections of ultrasound
wave fronts in a sectional model of
the Gewandhaussaal in Leipzig.
(Teddington – from Engl, [2]).
Ripple Tank. Very similar pictures can be made by sending light through a water tank with
shallow water waves that are created by a mechanic vibrator [3]. A continuous source will
create a train of waves and the wavelength can be chosen to represent that of a typical
frequency of sound. In a 1:50 scale model the water depth should be approximately 10 mm.
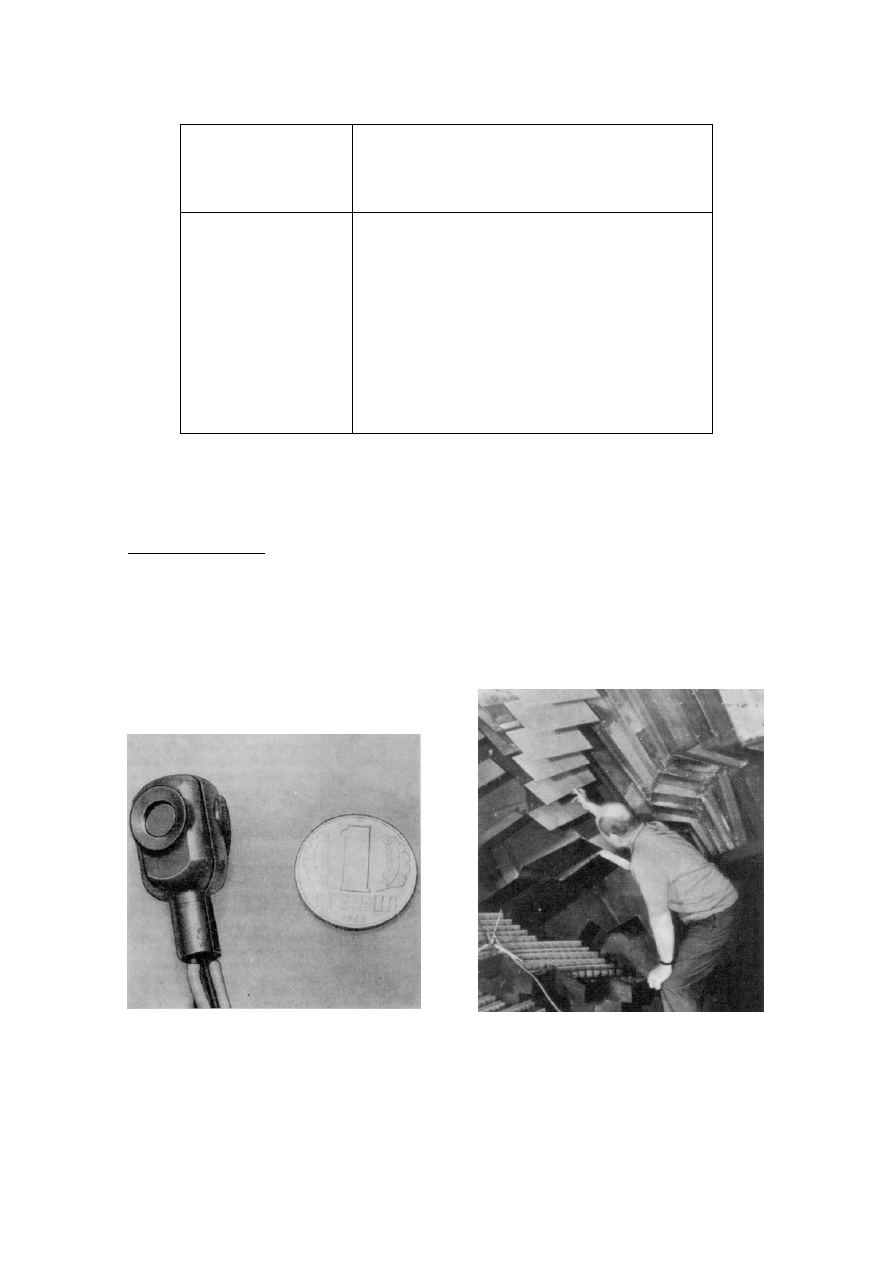
Optical – Light Beam Method. A light source has been used to replace the sound source. One
method published in 1929 uses a light source inside a cylinder with a lot of slits. In a 2D model
with light reflective surfaces it is possible to get a picture of light beams and their first order
reflections. Surfaces that should be absorbing can be painted black to avoid the reflection.
Fig. 2. Light beam investigation of
reflections in a sectional model of Okuma
Memorial Auditorium. (Satow, 1929 – from
Knudsen [4]).
Fig. 3. Optical model of a hall with a con-
cave ceiling. The energy distribution on the
floor can be studied on a photographic
plate.
Optical – Light Distribution Method. In the 1930es an optical method was used to investigate
the energy distribution in an auditorium. An opal glass plate is used to represent the audience.
The other surfaces of the room are modelled of sheet aluminium with an optical reflection
coefficient of about 50%. With a light source representing the sound source, the brightness of
the opal glass indicates the steady-state sound pressure distribution over the seating area.
Vermeulen & de Boer [5] used this method for the design of the Philips Theater in Eindhoven.
Optical – Laser Beam Method. In more recent time the laser beam has been used by Nagata
Acoustics to investigate first order reflections in a 3D model of Suntory Hall (1986).
3
Schlie
ren
method
Rippl
e tank
Optical -
light beam
s
Optical -
distrib
ution
Optical -
lase
r bea
m
Earliest
report
1913 1921 1929 1936 1985
Dimensions 2D
2D
2D
3D
3D
Physics Ultrasound Water
Light
Light
Laser
Wavefront X
X
Wavelength
X
Typical scale
1:200
1:50
1:50
1:200
1:10
Early reflections
X
X
X
X
Energy distribution
X
Surface absorption
X
((X))
((X))
((X))
Scattering effects
X
X
Diffraction effects
X
X
Table 1. Some characteristics of physical models.
ACOUSTIC SCALE MODELS
Technicolor Models. In 1934 Spandöck [6] made the first report on a method for subjective
assessment of the acoustics of a room by use of three-dimensional models. The scale was 1:5
and he used a wax drum at 60 rev/min to record a sound signal, which was played back at 300
rev/min and radiated into the model. Sound in the model was recorded at the high speed and
played back at the low speed. In the following years Jordan [7] improved the method by using a
magnetic recorder (the Poulsen Telegraphone) with 20 sec samples of speech. This could
demonstrate the influence of sound absorption in the room on the speech intelligibility.
Fig. 4. Dummy head with two microphones
in scale 1:20. ([10] fig. 9.69).
Fig. 5. View from a 1:10 scale model of the
Major Hall for the Sydney Opera House (not
the final design, but the last Utzon design
around 1966). ([11] fig. 4.10).

4
The principle in scale modelling is that all physical dimensions including the wavelengths are
reduced by the scale factor. The name ‘Technicolor Models’ as well as the other names used
here for scale models was originally proposed by Burd [8]. The reason for this name is the
attempt to choose surface materials with the correct absorption coefficients at the scaled
frequencies. In the further development by Reichardt [9] and others the scale was reduced to
1:10 or 1:20. In order to minimize the influence of the air attenuation at high frequencies, the air
in the model was dried to around 2% RH. Dummy heads in the chosen scale were developed
for the recording of binaural signals from the models. The example in Fig. 4 was used for the
redesign of the Semper Opera in Dresden.
Half-Tone Models. When the scale model technique is used for the design of a hall, it may be
too time consuming and impractical to use listening tests to assess the acoustical quality.
Objective room acoustical measurements are faster and more precise. Such measurements are
based on the impulse response, which can easily be measured with an electric spark as
impulse sound source. During the 1950es and -60es this technique was taken into use for
design of opera theatres and concert halls, and in the same period the development of new
objective room acoustic parameters flourished [11]. These models are called ‘Half-Tone Models’
because there is no attempt to model the absorption of the surfaces with high precision. Only
the audience is modelled with approximately to correct absorption [12]. Other surfaces are
made as reflective as possible, and the air attenuation is taken as it is without drying the air.
Before the model is taken into use the reverberation time as a function of the frequency is
adjusted approximately by adding patches of sound absorbing material in the ceiling or on other
suitable surfaces. With a small-scale dummy head it is possible to include an approximate
auralization by convolution of a test sound with the measured Binaural Room Impulse
Response (BRIR).
Black & White Models. In order to shorten the time needed for model tests, the modelling
technique was further developed in the late 1970es for very small models in the scale of 1:50
[13]. In this scale it is very difficult to control the absorption of the materials, and if the surfaces
are either reflective or absorptive this may be characterized as ‘Black & White Models’.
Tech
nicolo
r model
s
El. dynami
c source
Tech
nicolo
r model
s
Im
pulse sou
rce
Half-ton
e mo
dels
Black & white
models
Earliest
report
1934 1956 1968 1979
Typical scale
1:8 - 1:20
1:8 - 1:20
1:8 - 1:20
1:50
Source Loudspeaker
El.
spark
El. spark
El. spark
Source directivity
X
(X)
Microphone
receiver X X X X
Dummy head receiver
X
X
(X)
Surface absorption
X
X
(X)
((X))
Early
reflections
X X X X
Scattering
effects
X X X X
Diffraction
effects
X X X X
Impulse
response
X X X X
Reverberation time
X
X
(X)
(X)
ISO 3382 parameters
X
X
X
(X)
Auralization X
X
(X)
Time for construction
12-24 weeks 12-24 weeks
8-20 weeks
3 weeks
Time for measurements
4-8 weeks
4-8 weeks
3-8 weeks
1 week
Table 2. Some characteristics of acoustic scale models. (Partly after Burd [8]).
5
COMPUTER MODELS
Wave Equation Models. Such models like the Finite Element Method (FEM) and the Boundary
Element Method (BEM) are characterized by creating very accurate results at single
frequencies. However, since the number of modal frequencies in a room increases with the third
power of the frequency, wave models are typically restricted to low frequencies and small
rooms.
Image Source Model. This method is based on the principle that a specular reflection can be
constructed geometrically by mirroring the source in the plane of the reflecting surface. In a
rectangular box-shaped room it is very simple to construct all image sources up to a certain
order of reflection [14-15]. But in an arbitrary room the number of possible image sources
increases exponentially with the order of reflection, and thus the method is not suitable for
rooms like concert halls where reflection orders of several hundred are relevant for the audible
reverberant decay.
Markoff Chain Model. The decaying sound in a room can be considered as a process of sound
absorption in discrete steps of a time interval that corresponds to the mean free path in a three-
dimensional sound field, dt = 4V/cS, where V is the volume, c is the speed of sound, and S is
the total surface area in the room. This model is based on a probability function for sound
travelling from one surface to any other surface in the room. Thus a room averaged decay curve
is calculated and the location of absorption material on the different surfaces is taken into
account [16].
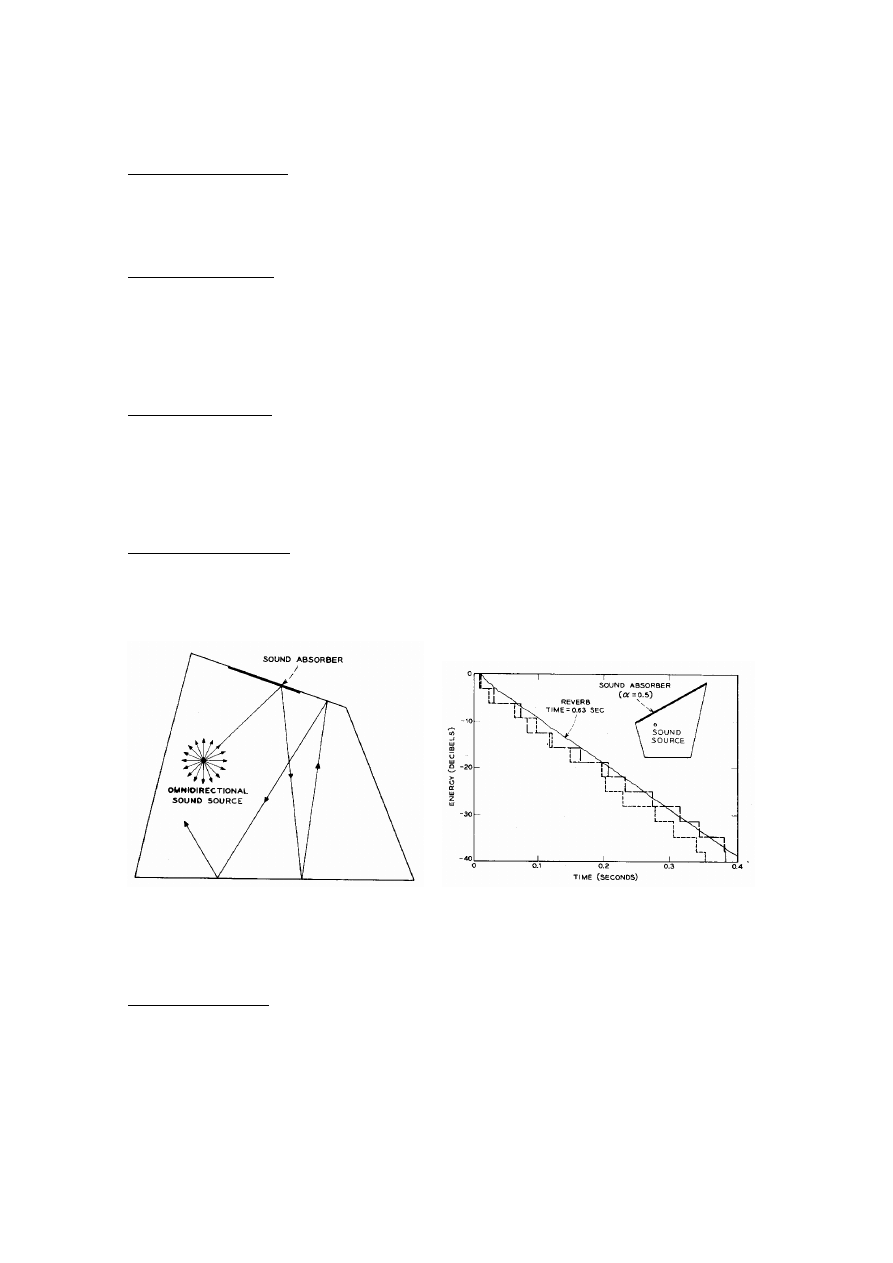
Particle Tracing Models. A more realistic way to simulate the decaying sound is to trace a large
number of particles emitted in all directions from a source point. Each particle carries a certain
amount of sound energy that is reduced after each reflection according to the absorption
coefficient of the surface involved. As shown in Fig. 6 the result is the average decay curve for
the room from which the reverberation time is evaluated [17].
Fig. 6. Particle tracing based on geometrical acoustics. Left: The sound energy follows the path
of several hundred rays (only one is shown), and the energy of the particles is reduced when
they hit an absorbing surface. Right: Average decay curve. (After Schroeder [17]).
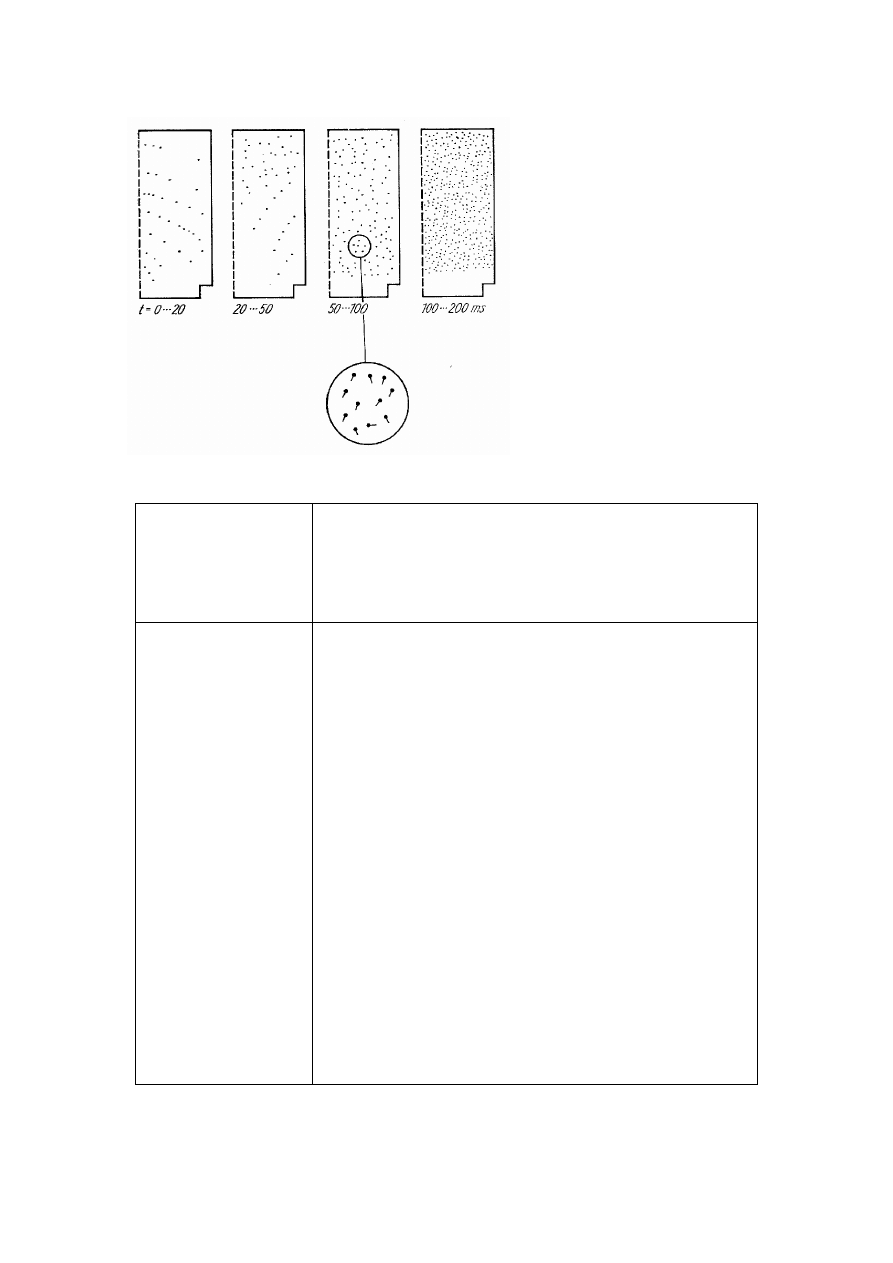
Ray Tracing Models. The first computer model that was used for practical design of auditoria
was a ray tracing model [18]. A large number of sound rays are traced from a source point up to
high order reflections following the geometrical/optical law of reflection. The main result of this
early model is the distribution of ray hits on the audience surface, analysed in appropriate
intervals of the time delay. So, this is a qualitative presentation of the sound distribution in
space and time. For a closer analysis the direction of incidence of each ray can also be
indicated. In order to obtain quantitative results it is necessary to introduce receiver surfaces or
volumes for detection of the sound rays. So, an approximate energy-reflectogram can be
calculated and used for an estimate of some room acoustic parameters [19-20].
6
Fig. 7. Example of results from the
first ray tracing model [18]. Hit
points of sound rays as distributed
on one half of the floor, shown in
time intervals relative to the direct
sound. Some directional information
is included, see the enlargement.
Statictically
based eq
uati
ons
Wa
ve eq
uatio
n
model
s
Image so
urce
model
s
Markoff chai
n
model
s
Particle tracing
model
s
Ra
y tra
cing
model
s
Con
e traci
ng
model
s
Radi
osit
y mo
dels
Hybrid m
odel
s
Earliest
report
1900 1979 1975 1970 1968 1986
1993
1989
Low
frequency
model X
(X)
High
frequency
model X X X X X X
X
Point
source
X X X X X X X X
Line
source
X X
X
Surface
source
X X
X
Source
directivity
X X X X X
Point
receiver
X X (X) X X X
Grid
of
receivers
X X X X X
Sound
distribution
X
X
X
X
Volume
average
X X
X
Surface
absorption
X X X X X X X X X
Early
reflections
X X
X X
Echo tracing in 3D
X
(X)
(X)
X
Scattering
effects
X X X X X
Diffraction
effects
X X
Coupled
spaces
X X X X X X
Impulse
response
(X)
(X)
(X)
X
X
Reverberation
time
X X X (X) (X) X X
ISO
3382
parameters
(X)
(X)
X
X
Auralization
(X) X X X X
Time
for
modelling
(1-5) 1 5 3 3 3 3 3 3 3
Time
for
calculations
(1-5)
1 5 5 1 1 4 4 3 2
Table 3. Some characteristics of computer models. The time consumption is evaluated on a
scale from 1 (very fast) to 5 (very slow).
7
Cone Tracing Models. An alternative to the receiver volume used in ray tracing models is a
point receiver in combination with cones that have a certain opening angle around the rays.
Cones with circular cross section have the problem of overlap between neighbour cones [21].
Cones with a triangular cross section can solve this problem [22], but still it is difficult to obtain
reliable results with this method.
Fig. 8. Tracing of a circular cone from the
source S to the receiver M. The first and
second order image sources are also shown.
([21] fig. 2).
Radiosity Models. The principle is that the reflected sound from a surface is represented by a
large number of source points covering the surface and radiating according to some directivity
pattern, typically a random distribution of directions [22]. This method has also been used as an
efficient way to model the scattered part of the early reflected sound [30].
Hybrid Models. The disadvantages of the classical methods have lead to development of hybrid
models, which combine the best features of two or more methods [22–30]. Thus modern
computer models can create reliable results with only modest calculation times. The inclusion of
scattering effects and angle dependent reflection with phase shifts has made it possible to
calculate impulse responses with a high degree of realism. This in turn has been combined with
Head Related Transfer Functions (HRTF) to give Binaural Room Impulse Responses (BRIR),
which are convolved with anechoic sound recordings to make auralization of high quality.
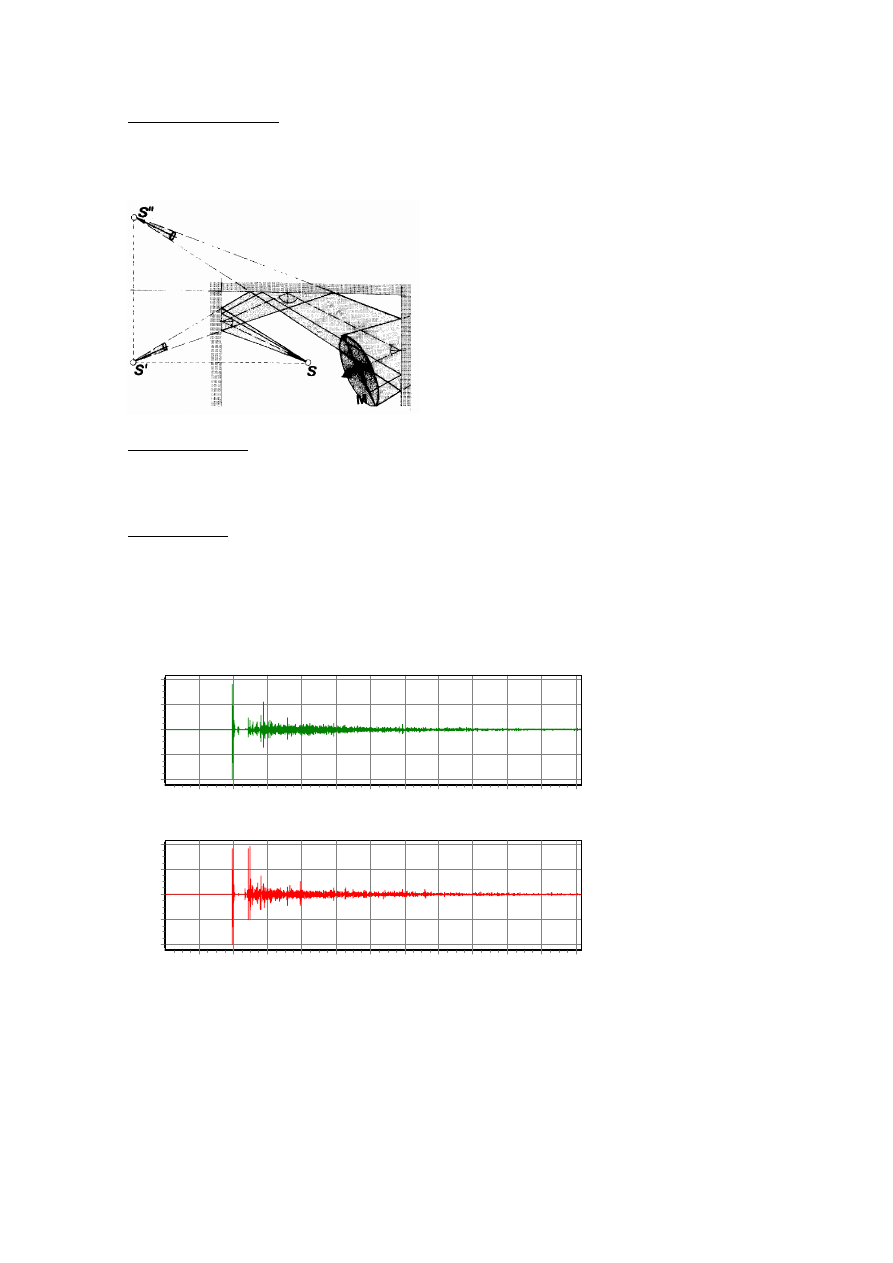
Fig. 9. Examle of a
Binaural Room Impulse
Response calculated in
a new opera house
project. The first 600 ms
are shown, but in this
example the calculated
impulse response is 2 s
long.
CONCLUSION
During the last century a rich variety of ideas and methods have been created in order to bring
the acoustic design of auditoria from a weakly understood art to a scientifically based field of
engineering. With the latest development in computer modelling it has been possible to combine
the best features of the older methods, to get reliable predictions of objective acoustic
parameters, and in addition to offer auralization for subjective listening tests.
Left ear
time (seconds)
0,6
0,55
0,5
0,45
0,4
0,35
0,3
0,25
0,2
0,15
0,1
0,05
p (
%
)
100
50
0
-50
-100
Right ear
time (seconds)
0,6
0,55
0,5
0,45
0,4
0,35
0,3
0,25
0,2
0,15
0,1
0,05
p (
%
)
100
50
0
-50
-100

8
BIBLIOGRAPHICAL REFERENCES
[1] W.C. Sabine (1913). Theater Acoustics. The American Architect 104, 257. Reprinted in:
Collected Papers on Acoustics, Harvard University Press, 1922.
[2] J. Engl (1939). Raum- und Bauakustik. Akademische Verlagsgesellschaft, Leipzig.
[3] A.H. Davis & G.W.C. Kaye (1927). The Acoustics of Buildings. London.
[4] V.O. Knudsen (1932). Architectural Acoustics. John Wiley & Sons, New York.
[5] R. Vermeulen & J. de Boer (1936). Philips Techn. Review 1, 46.
[6] F. Spandöck (1934). Raumakustische Modellversuche. Ann. Phys. 20, 345.
[7] V.L. Jordan (1941). Elektroakustiske undersøgelser af materialer og modeller. (In Danish).
Doctoral Thesis, Copenhagen.
[8] A.N. Burd (1975). Acoustic Modelling – Design Tool or Research Project? Chapter 7 in
“Auditorium Acoustics” R. Mackenzie (ed.), Applied Science Publishers, London.
[9] W. Reichardt (1956). Die Akustik des Zuschauerraumes der Staatsoper Berlin Unter den
Linden. Hochfrequenztechnik und Elektroakustik 64, 134.
[10] W. Fasold, E. Sonntag & H. Winkler (1987). Bau- und Raumakustik. Verlag für Bauwesen,
Berlin.
[11] V.L. Jordan (1980). Acoustical Design of Concert Halls and Theatres. Applied Science
Publishers, London.
[12] B.F. Day (1968). A tenth-scale model audience. Applied Acoustics 1, 121-135.
[13] M. Barron & C.B. Chinoy (1979). 1:50 Scale Acoustic Models for Objective Testing of
Auditoria. Applied Acoustics 12, 361-375.
[14] J. Allen & D.A. Berkley (1979). Image method for efficiently simulating small-room
acoustics. J. Acoust. Soc. Am. 65, 943-950.
[15] J. Borish (1984). Extension of the image model to arbitrary polyhedra. J. Acoust. Soc. Am.
75, 1827-1836.
[16] R. Gerlach (1975). The Reverberation Process as Markoff Chain – Theory and Initial Model
Experiments. Chapter 9 in “Auditorium Acoustics” R. Mackenzie (ed.), Applied Science Publ.
London.
[17] M.R. Schroeder (1970). Digital Simulation of Sound Transmission in Reverberant Spaces.
JASA 47, 424-431.
[18] A. Krokstad, S. Ström & S. Sörsdal (1968). Calculating the Acoustical Room Response by
the use of a Ray Tracing Technique. J. Sound and Vibration 8, 118-125.
[19] U. Stephenson (1985). Eine Schallteilchen-Computersimulation zur Berechnung der für die
Hörsamkeit in Konzertsälen massgebenden Parameter. Acustica 59, 1-20.
[20] P.A. Forsberg (1985). Fully Discrete Ray Tracing. Applied Acoustics 18, 393-397.
[21] J.P. Vian & D. van Maercke (1986). Calculation of the room impulse response using a ray-
tracing method. Proceedings of 12
th
ICA Symposium, Vancouver, 74-78.
[22] T. Lewers (1993). A Combined Beam Tracing and Radiant Exchange Computer Model of
Room Acoustics. Applied Acoustics 38, 161-178.
[23] M. Vorländer (1989). Simulation of the transient and steady-state sound propagation in
rooms using a new combined ray-tracing/image source algorithm. J. Acoust. Soc. Am. 86, 172-
178.
[24] G.M. Naylor (1993). ODEON – Another Hybrid Room Acoustical Model. Applied Acoustics
38, 131-143.
[25] B.I. Dalenbäck (1996). Room acoustic prediction based on a unified treatment of diffuse
and specular reflection. J. Acoust. Soc. Am. 100, 899-909.
[26] R. Heinz (1996). Zur Modellierung des diffusen Streuverhaltens der
Raumbegrenzungsflächen innerhalb raumakustischer Schallteilchen-Simulationen. Acustica –
Acta Acustica 82, 82-90.
[27] U. Stephenson (1996). Quantized Pyramid Beam Tracing – a New Algoritm for Room
Acoustics and Noise Immission Prognosis. Acustica – Acta Acustica 82, 517-525.
[28] K. Nakagawa & H. Shimoda (1997). Hybrid analysis of sound fields in rooms using the
Bergeron method and the image source method. Proceedings of ASVA 97, Tokyo, 627-632.
[29] J.H. Rindel (2000). The use of computer modeling in room acoustics. Journal of
Vibroengineering, No 3(4) 219-224.
[30] C.L. Christensen (2001). ODEON – A design tool for auditorium acoustics, noise control
and loudspeaker systems. Proc. Institute of Acoustics 23 (8), 137-144.
Wyszukiwarka
Podobne podstrony:
Lokki T , Gron M , Savioja L , Takala T A Case Study of Auditory Navigation in Virtual Acoustic Env
Claus Lynge Christensen Modelling Large Sound Sources in a Room Acoustical
Lynge Odeon A Design Tool For Auditorium Acoustics, Noise Control And Loudspeaker Systems
IMPORTANCE OF EARLY ENERGY IN ROOM ACOUSTICS
Summers Measurement of audience seat absorption for use in geometrical acoustics software
Bruel & Kjaer Measurements in Building Acoustics
Brian Bond The Unquiet Western Front, Britain s Role in Literature and History (2002)
Computer Modelling with CATT Acoustic Theory and Practice of Diffusion Reflection and Array Modelin
Noxon Auditorium Acoustics 104
Griesinger D Spaciousness and envelopment in musical acoustics
New possibilities in room acoustics measuring
Rindel Computer Simulation Techniques For Acoustical Design Of Rooms How To Treat Reflections
Gade, Lisa, Lynge, Rindel Roman Theatre Acoustics; Comparison of acoustic measurement and simulatio
2002 4 JUL Topics in feline surgery
Dance, Shield Modelling of sound ®elds in enclosed spaces with absorbent room surfaces
2002 3 MAY Lasers in Medicine and Surgery
Pancharatnam A Study on the Computer Aided Acoustic Analysis of an Auditorium (CATT)
Ouellette J Science and Art Converge in Concert Hall Acoustics
więcej podobnych podstron