
This booklet answers some of the basic questions
asked by the newcomer to building acoustic measure-
ments. It gives a brief explanation of the following:
See page
Introduction ......................................................................... 2
Behaviour of Sound in a Room ....................……........... 3-4
Build-up and Decay of Sound in a Room ....…..…......... 5-6
Sabine's Formula for Reverberation Time ...……….......... 7
Measuring the Reverberation Time ..............…….….... 8-10
Measuring the Sound Absorption .................…......... 11-13
Measuring the Sound Distribution .................…........ 14-15
Speech Intelligibility ......................................................... 16
How is Speech Intelligibility Quantified? ....…................ 17
Rapid Speech Transmission Index (RASTI) ..……..... 18-19
Real-Time Analysis in Room Acoustics .......….…..... 20-21
Acoustics of Buildings.
What Should be Measured? ........................................ 22
Sound Reduction Index of a Wall .................................... 23
What is the Coincidence Effect? ....................…....... 24-25
Laboratory and Field Measurements ............................. 26
Airborne Sound Insulation .......................…................... 27
Measuring Airborne Sound Insulation .....…............. 2
Impact Sound Insulation ................................................. 30
Measuring Impact Sound Insulation .............................. 31
Outdoor - Indoor Noise Insulation ....……................. 32-33
Insulation between Offices — Influence
of Background Noise .................................................... 33
Comparing Results with Requirements (R'
Vibration Measurements ................................................. 35
Survey of Building Acoustic
Measurements (ISO) .........................................…... 36-43
Further Reading ............................................................... 44
January 1988
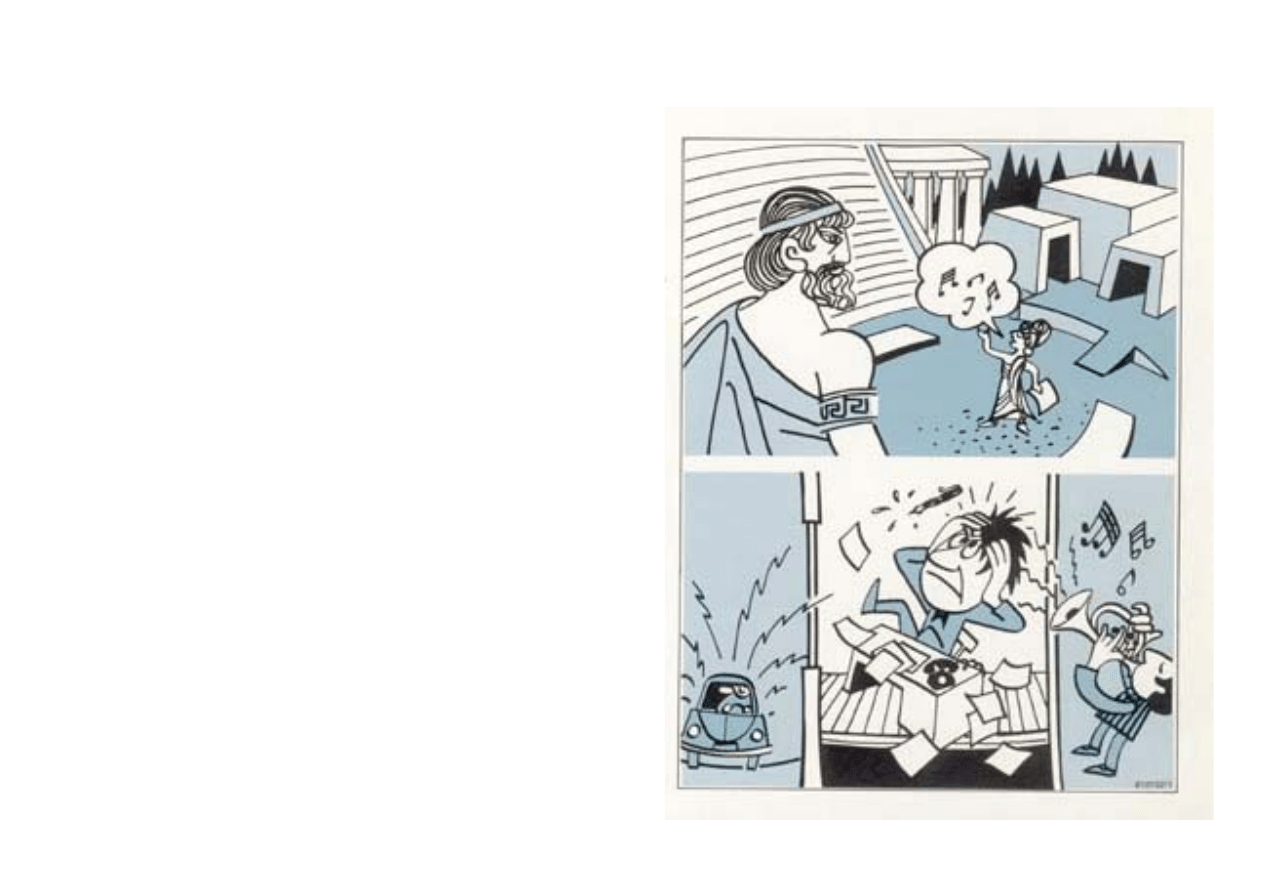
Introduction
The influence of acoustics on the design of buildings can
be observed through the ages from Roman amphitheatres
to the modern houses or buildings in which we spend our
working hours and our leisure. The great difference, howev-
er, between life in ancient Rome and life in our crowded
modern cities is the presence of noise from an ever in-
creasing number of sources, from neighbours, traffic and
industry.
Consequently, the science of building acoustics is no longer
limited to the acoustic design of theatres, but has increased
in scope to cover noise control and abatement in all types
of buildings.
2
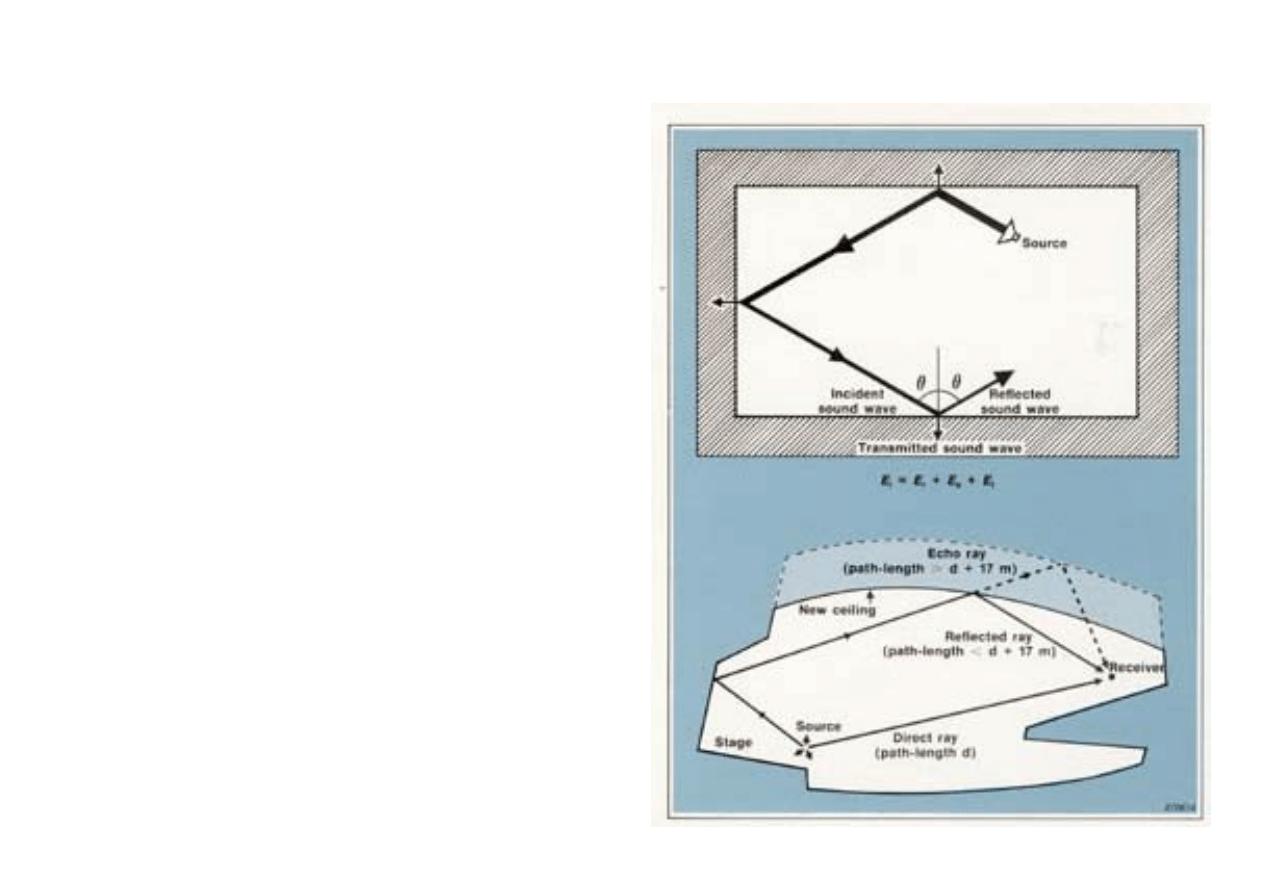
Behaviour of Sound in a Room
A knowledge of the behaviour of sound in a room is neces-
sary if we wish to adapt the room for speech or music and
if we want to attenuate external noise. Consider the effect
of placing a sound source in a room. When sound energy
(E
i
) from the source strikes a room boundary, the reflected
sound energy (E
r
) contributes to the sound-field in the
room, the absorbed sound (E
a
) dissipates as heat, and the
transmitted sound energy (E
t
) propagates away through the
boundary layer.
Reflection of Sound
If the wavelength of an incident sound-wave is much small-
er than the dimensions of the reflecting surface, then the
angle of reflection of the sound-wave equals the angle of
incidence. We can use this geometrical behaviour to predict
the pattern of sound rays in a room, a limitation being that
only the primary and possibly the secondary reflections can
be studied before the reverberant field begins to mask the
ray paths.
In larger rooms such as concert halls, 'ray tracing' can
identify problematic echoes, an echo being defined as a
reflection which arrives more than 50 ms after the direct
sound. An echo can also be thought of as a reflected ray
with a path-length that is at least 17 m longer than that of
the direct ray. Echo problems in large enclosures are
solved by reducing the path length of the reflected ray. This
can be done either by lowering the ceiling or by suspending
reflectors from the ceiling.
By observing the behaviour of the reflections in a room, we
can control subjective properties such as intimacy, the
quality of which depends on early arrival of reflections after
the direct sound, and diffusion which is the evenness of the
reverberant field.
3
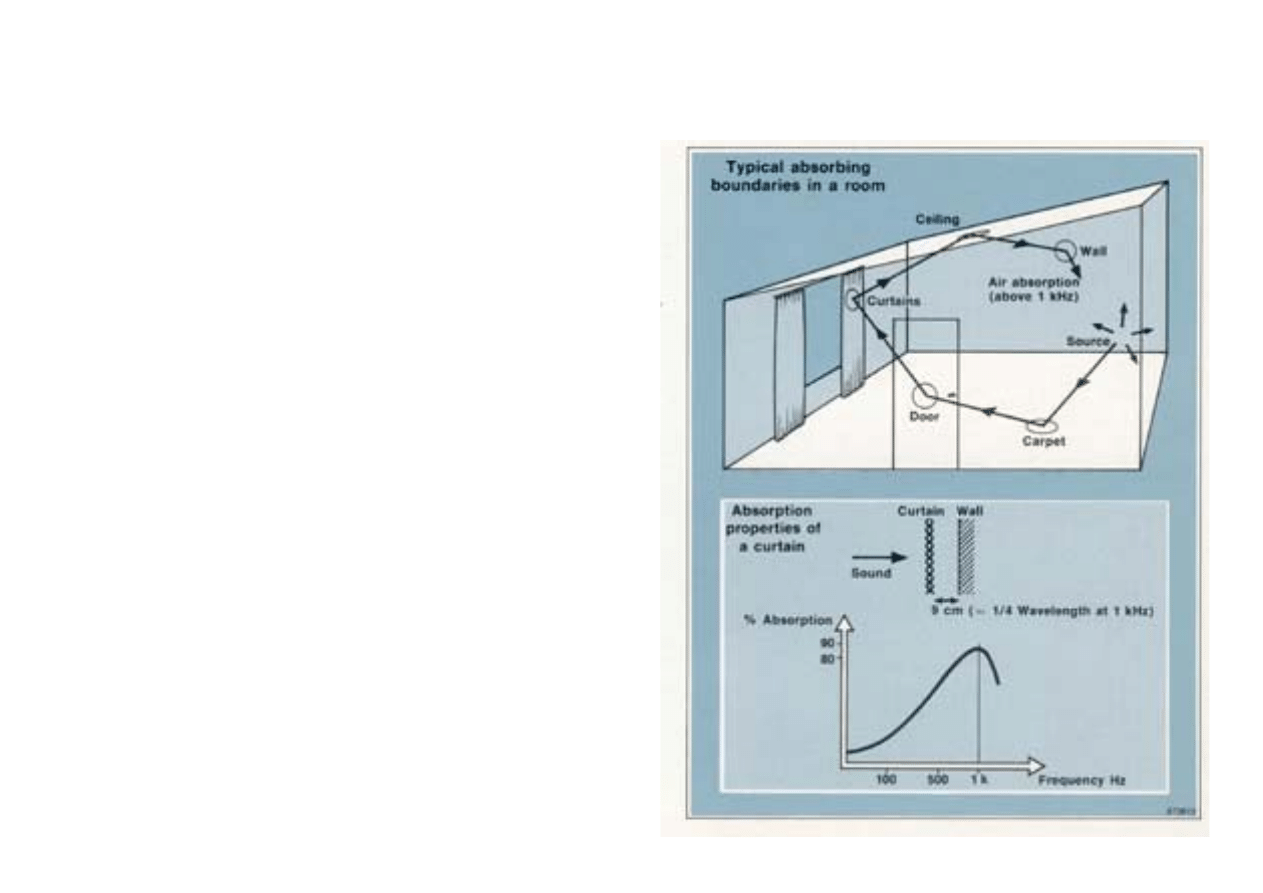
Absorption of Sound
We can understand the effect of absorption by measuring,
at a given position in a room, the sound pressure level
caused by a steady sound power source. Instead of rising
indefinitely as an increasing number of reflections arrive at
the measuring position, the sound pressure level soon sta-
bilizes. This must mean that the rate of energy input is ex-
actly compensated by the rate at which the energy is ab-
sorbed by the different surfaces of the room. If more
absorption material is put in the room, the sound pressure
level is less because the energy in the reflections is re-
duced.
Typical absorbing surfaces in a room include carpets and
curtains. These are simple porous absorbers which absorb
sound energy by restricting the movement of air particles,
the frictional forces causing the dissipation of energy as
heat. Porous absorbers are most effective when placed at a
point on the sound-wave which has maximum particle ve-
locity. This position is a quarter wavelength away from a
reflecting surface (when a wave is incident at right-angles)
and is therefore frequency depedent. A carpet is an exam-
ple of a porous absorber close to a reflective boundary. It
absorbs best at high frequencies because the dimensions
of the quarter wavelengths are then comparable with the
thickness of carpet.
Other surfaces in the room absorb different frequencies to
different extents, and by controlling the proportions of
these absorbers it is possible to adjust the warmth of a
room for music, or its clarity for speech.
4
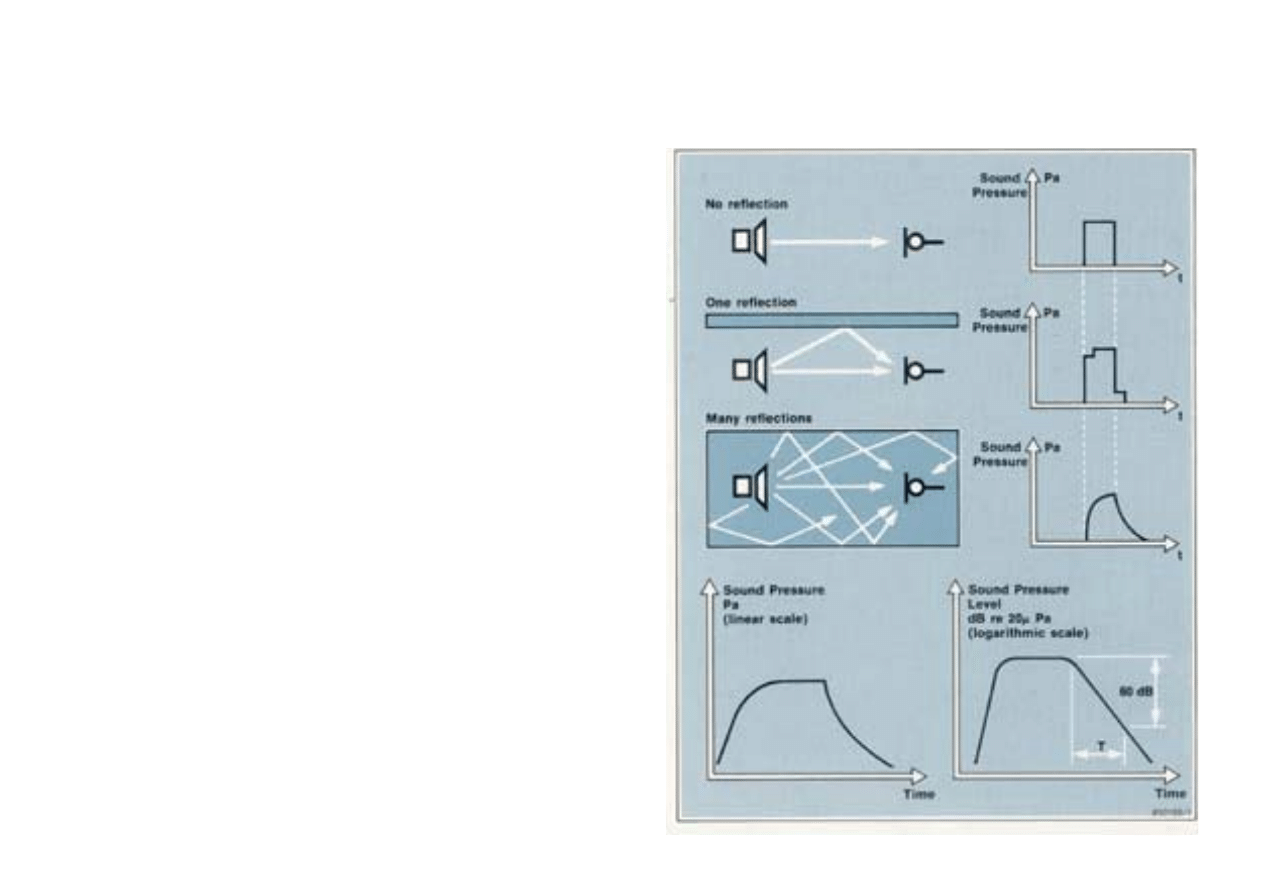
Build-up and Decay of Sound in a Room
If we position a microphone in a room and then switch on a
steady sound-source, we notice that the sound pressure
level does not immediately reach a steady level. This is be-
cause the first reflection and subsequent reflections take a
finite time to reach the microphone.
In the resulting equilibrium state, interference between the
sound-waves causes a spatial distribution of pressure max-
ima and minima which can be detected by moving the mi-
crophone around the room. These natural resonances or
normal room modes are associated with the geometry of
the room and the wavelengths emitted by the sound-source.
Interesting consequences of these modes are that pressure
doubling occurs at reflective boundaries, and that since all
the room modes have antinodes at the corners of the room,
they can all be "driven" by a sound-source placed there.
If the sound-source is now switched off, the collection of
decaying room modes is called the reverberant sound-field.
The rate of decay depends on the amount and positioning
of absorption in the room. Reverberation Time is defined as
the time taken for the sound pressure level in a room to
decay by 60 dB. This corresponds to a decrease in sound
pressure by a factor of 1000.
5
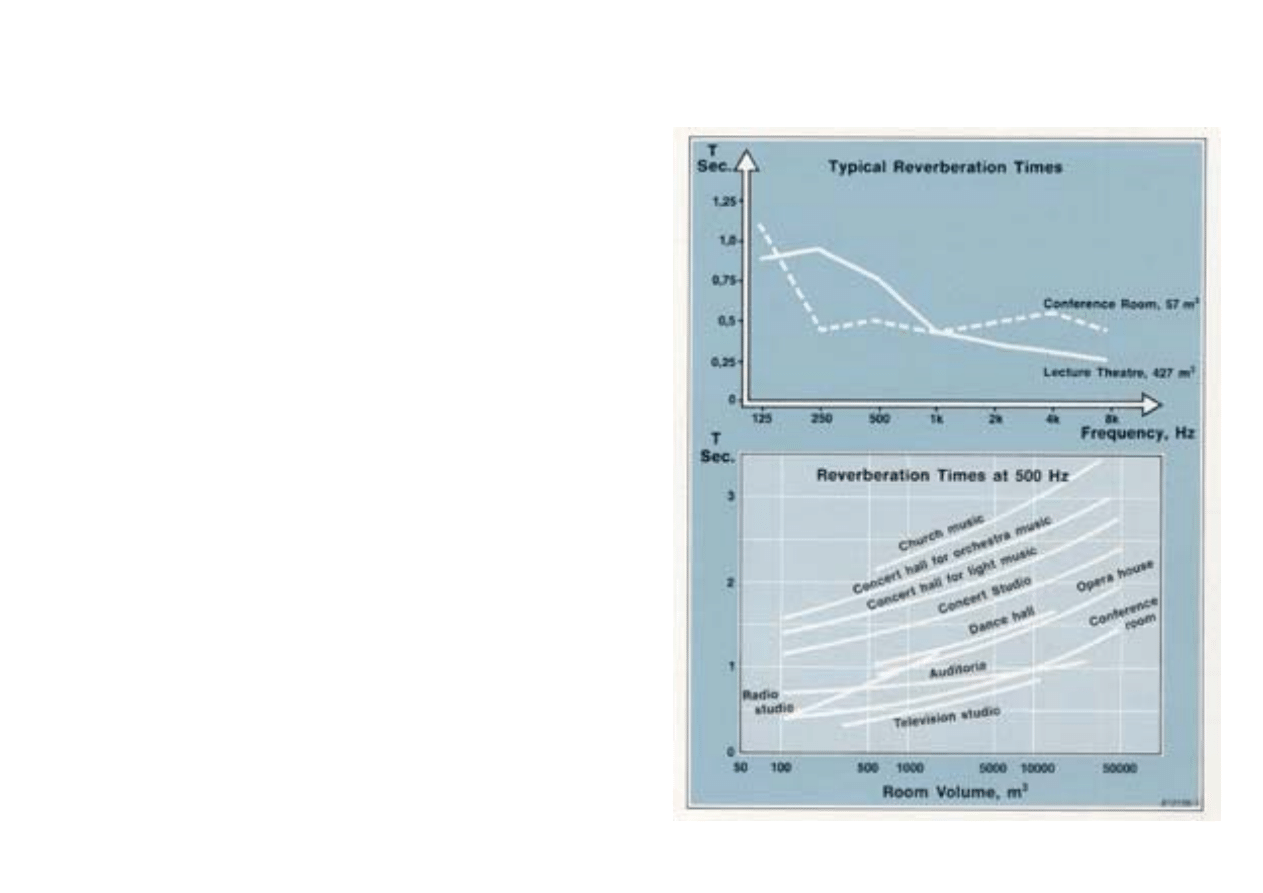
Importance of Reverberation Time in the Design of Rooms
and Auditoria
In a room with highly reflecting surfaces, such as a bath-
room, the reverberation time is relatively long, while in an
anechoic chamber where all the walls, the ceiling and the
floor are covered by a highly absorbent material, the rever-
beration time is nearly zero. The absorption of different
materials varies widely with the frequency of the incident
sound and the angle of incidence. It follows that the rever-
beration time is liable to vary with frequency. Generally, the
reverberation time is longer at lower frequencies because
these are usually less effectively absorbed than higher fre-
quencies.
It is important that the reverberation time suits the intended
use of the room. Too long a reverberation time renders
speech less intelligible and music more cacophonous and
produces higher background noise levels. A short reverber-
ation time deadens background noise, but muffles speech
and makes music sound "thin" and staccato.
6
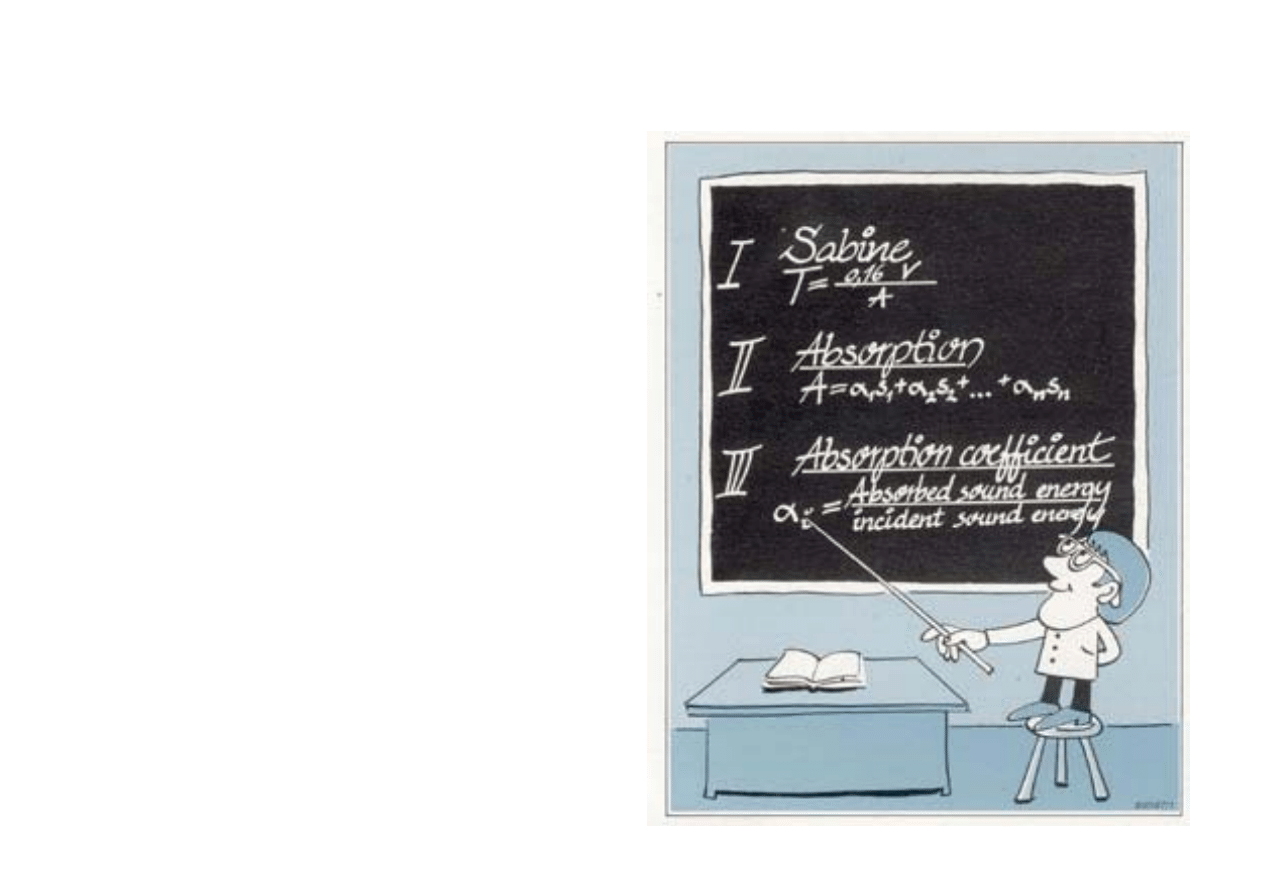
Sabine's Formula for Reverberation Time
Reverberation time is related to the volume and the total
absorption of a room. The relation has been empirically
stated by Sabine and gives a good indication of the behav-
iour of most of the rooms we encounter daily. It is not suit-
able for a room with very absorbent boundaries such as an
anechoic chamber.
In relationship (I)
T is the reverberation time, s
V is the volume of the room, m
3
A is the absorption of the room, m
2
0,16 is an empirical constant, s/m
The absorption of a room is obtained by summing the ab-
sorption of all the surfaces in the room, i.e. walls, ceiling,
floor and all the furniture in the room. The absorption of
each surface is the product of the area of the surface with
its absorption coefficient,
α
i
, which is the ratio of the sound
energy absorbed by the surface to the incident sound ener-
gy (relationship III). The absorption coefficient depends not
only on the material but also on the frequency and the an-
gle of incidence of the sound energy.
In relationship (II)
A is the total absorption of the room
α
1
,
α
2
, ....,
α
n
are the absorption coefficients of the
different surfaces of the room
S
1
, S
2
, ...., S
n
their respective areas in m
2
.
7
Measuring the Reverberation Time
To measure the reverberation time one needs a sound-
source to generate sound within the room and a receiving
section to monitor the decay in sound pressure level after
the sound-source ceases.
The Sound-Source
A starting pistol is a practical sound-source, but a pistol
shot lacks both energy in the low frequency regions and
reproducibility. A better way of excitation is to use a loud-
speaker emitting noise in frequency bands. For a given
power amplifier, this allows more energy to be transmitted
into the room than with the starting pistol (which is impor-
tant when high levels of background noise are present).
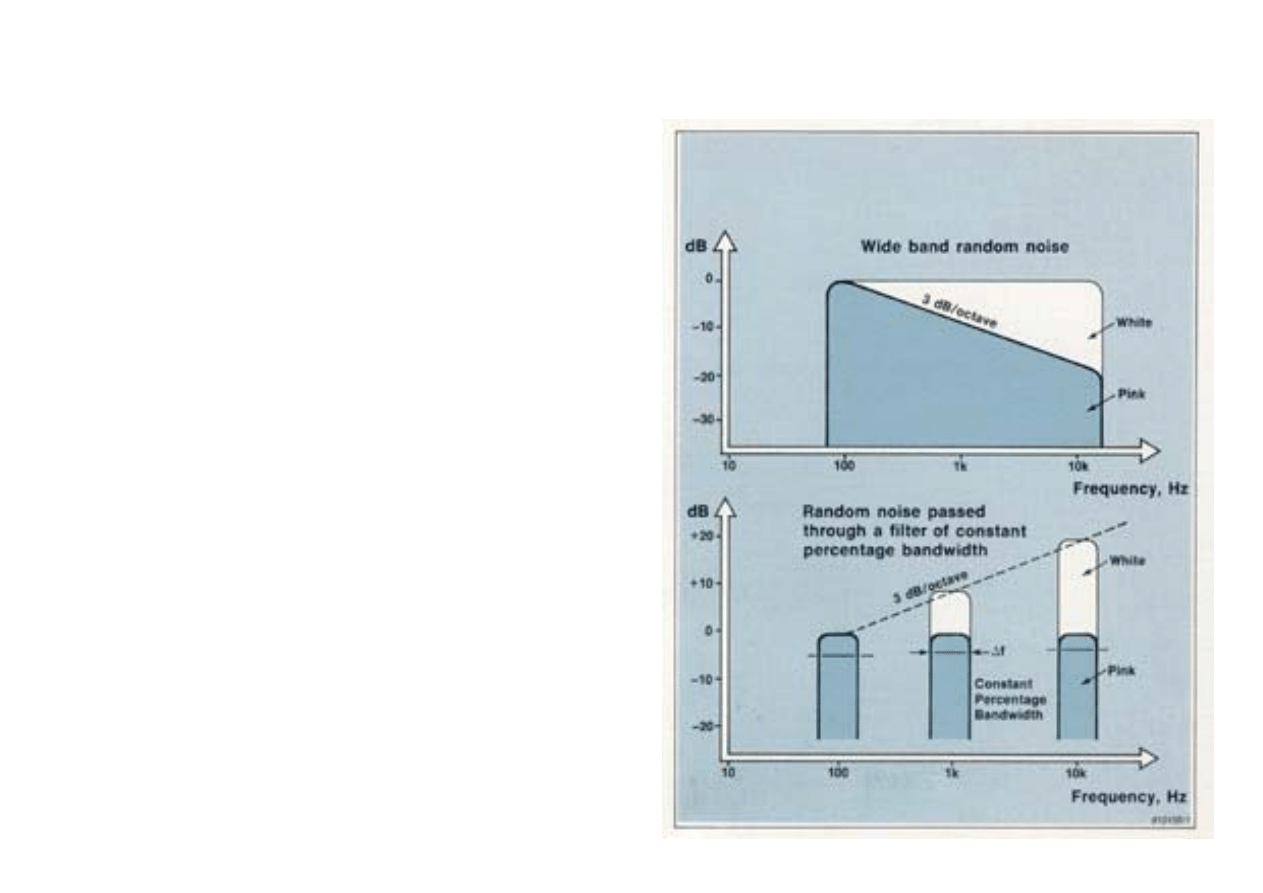
"White" noise is a wide band of random noise (i.e. a signal
containing all the frequencies of the spectrum with a ran-
dom amplitude distribution) with a constant level per Hertz
over the entire frequency spectrum. "Pink" noise is a wide
band of random noise with a level decreasing by 3 dB per
octave. This attenuation is necessary to allow a constant
energy to be transmitted through a filter with a bandwidth
which becomes progressively wider (e.g. an oct. or 1/3 oct.
filter), doubling the width for each octave.
Due to the presence of background noise, it is seldom pos-
sible to measure the full 60 dB reverberation decay and one
has to be content with a 40 dB, 30 dB or even 20 dB decay
extrapolated to 60 dB. It is usual to specify the decay over
which the reverberation time was measured, e.g. T
r
(30),
T
r
(20).
The noise can either be transmitted as a steady sound
which is then cut off, or as a short pulse, the two methods
having different receiving section requirements.
8
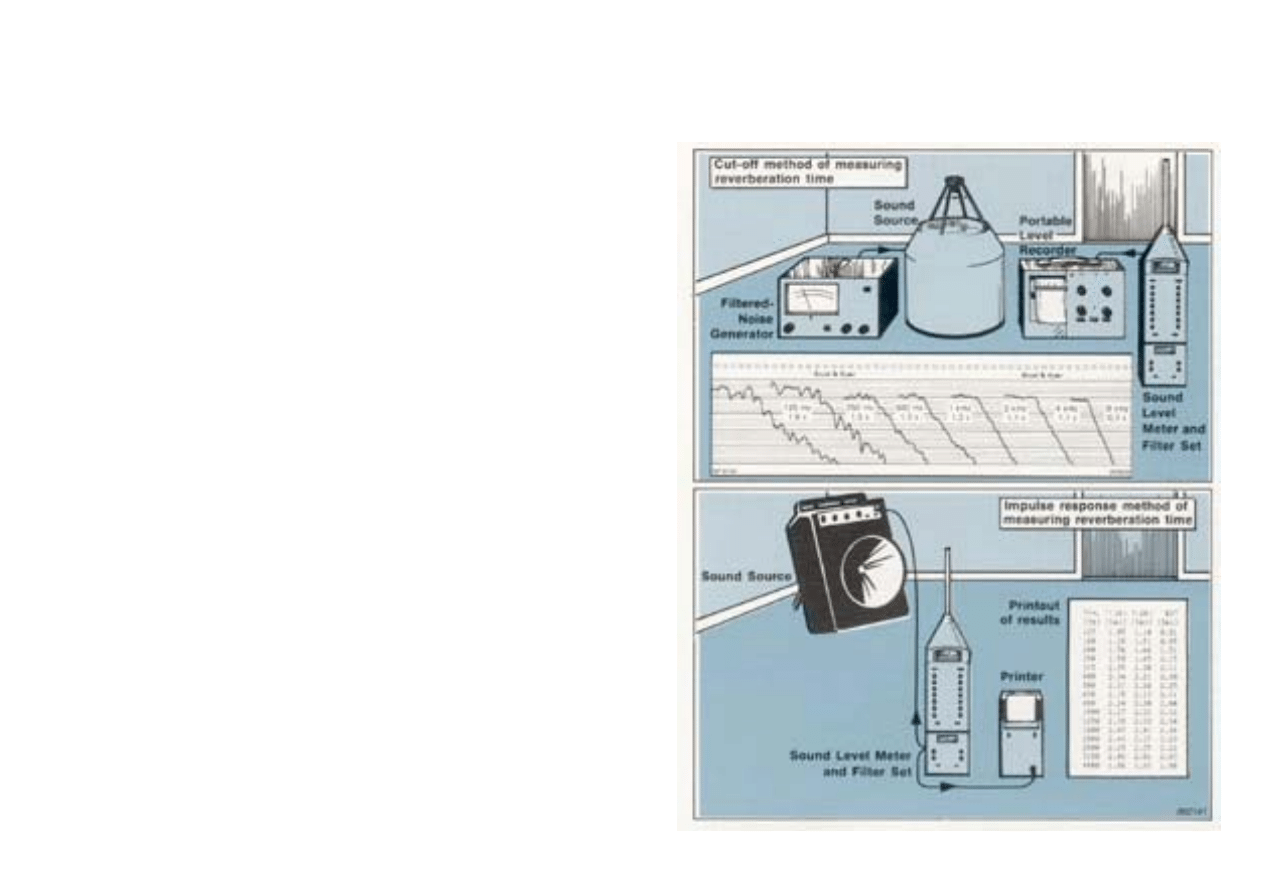
The Receiver
A typical receiving section may consist of a sound level
meter fitted with an octave or a 1/3 octave filter set and a
portable level recorder. A filter centred on the same fre-
quency as the filter in the transmitting section reduces the
influence of background noise. Since reverberation de-
creases in an exponential manner and is recorded on a log-
arithmic scale, the decay will be a straight line on the re-
cording paper. The reverberation time result (for a given
frequency band) is estimated directly from the recording.
The jagged appearance of the decays at low frequencies is
due to the uneven distribution of the normal room modes at
these frequencies.
When the pulse method of noise transmission is used, the
graphical results represent the Impulse Response of the
room and the reverberation time cannot be obtained direct-
ly from the decay. By using the appropriate software, it is
possible to calculate reverberation time results from the im-
pulse response. An advantage of the pulse (or Schroeder)
method is that accurate and reproducible results are ob-
tained faster than with the "cut-off" method.
9
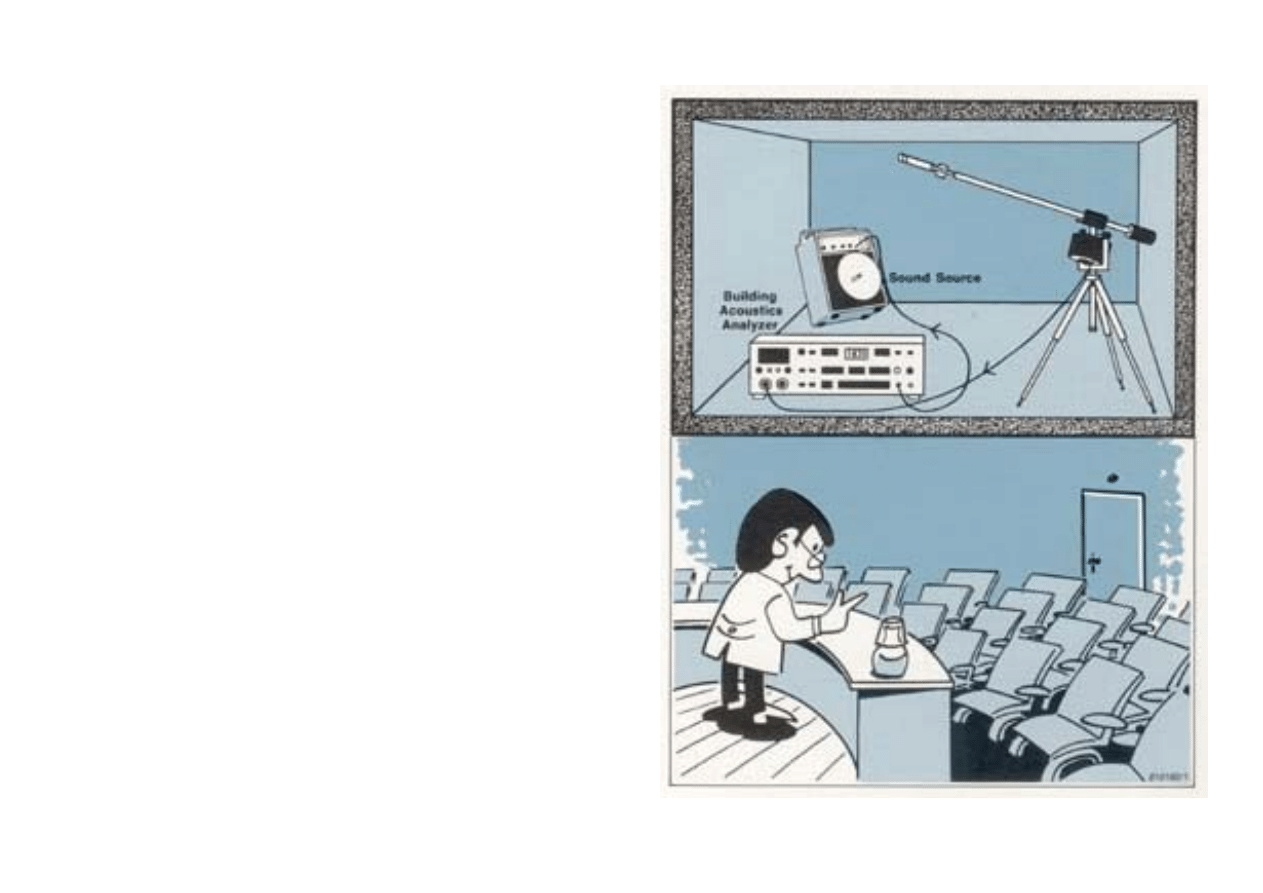
Using a Building Acoustics Analyzer
A Building Acoustics Analyzer is an instrument containing
both the transmitting and the receiving sections. It supplies
random noise in 1/3 octave bands to a power amplifier and
a loudspeaker, analyzes the microphone signal through a
second set of 1/3 octave band filters, and calculates the re-
verberation time for each frequency band.
Position of the Source and the Receiving Microphone
Due to room modes and echoes, the reverberation time of a
room depends on the position of the source and the receiv-
ing microphone. In some cases the position of the source is
obvious (e.g. the rostrum in a lecture theatre). To avoid ex-
citing only some of the normal modes of the room, the
sound-source is usually placed in a corner where every
mode has a pressure maximum.
The receiving microphone should be placed at several posi-
tions in large rooms and auditoria because the reverbera-
tion time can vary from place to place. If required, the mea-
sured times should then be averaged for each frequency
band by one of the following methods:
(a) a single microphone moved from place to place;
(b) several microphones scanned by a multiplexer;
(c) a single microphone on a rotating boom.
10
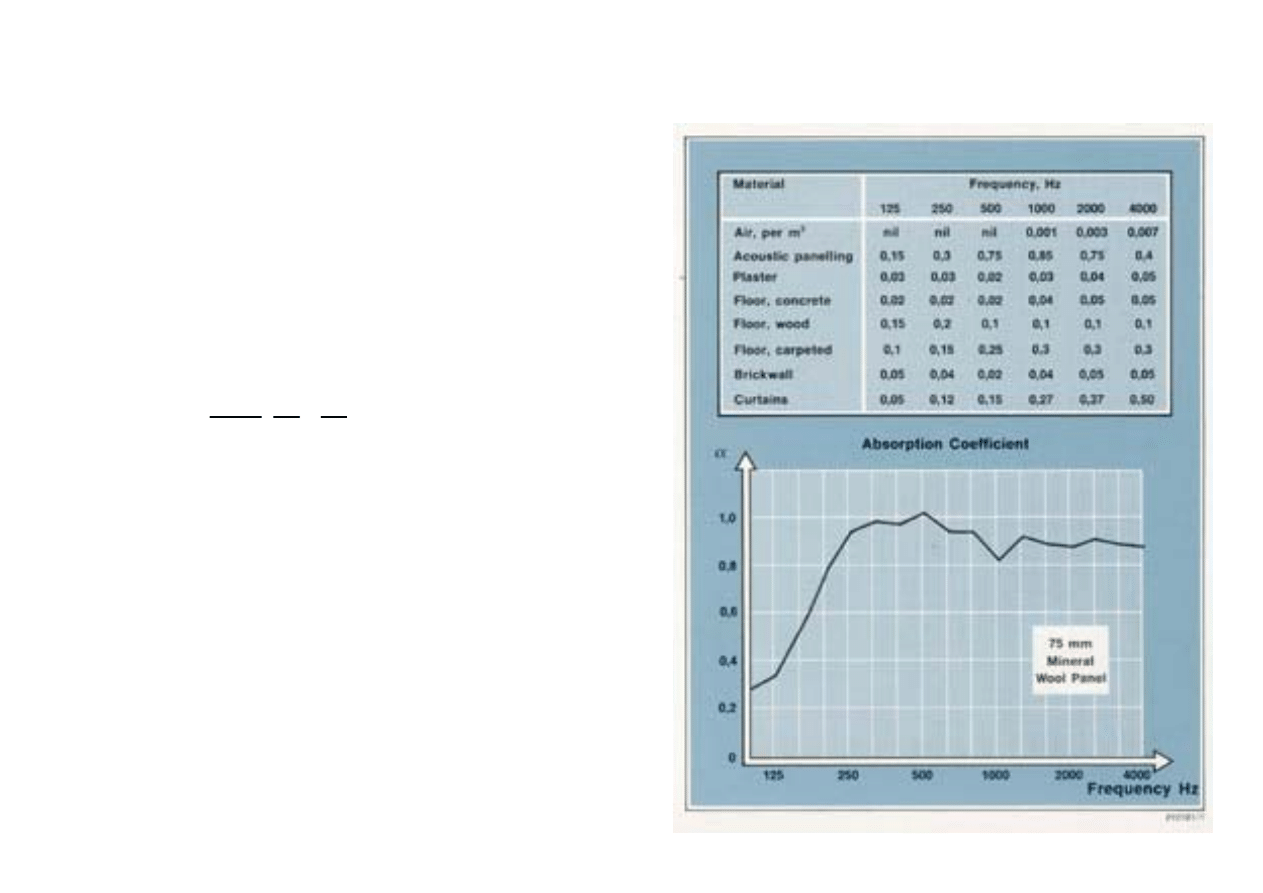
Measuring the Sound Absorption
The absorption coefficient of a material indicates the pro-
portion of sound absorbed by the material relative to the
total incident sound. The total absorption of a surface is
given by the absorption coefficient multiplied by the area.
The most usual measurement methods are:
Reverberation Chamber Method
The change in the reverberation time is measured when a
10m
2
sample of absorption material is introduced into a
reverberation chamber. From Sabine's Formula and the def-
inition of absorption,
α can then be found:
0,16 V ( 1 1)
α = -
S
(T
s
T
e
)
where
α
is the absorption coefficient of the sample
S
is the area of the sample of material
V is the volume of the chamber
T
s
is the reverberation time, with the sample
T
e
is the reverberation time of the empty chamber
The measurements are performed by using an octave or 1/3
octave filter set to obtain
α as function of the frequency.
11
Measuring the Change of Reverberation Time
"in situ"
A similar method can be used in practical situations when
determining the amount of absorbent material necessary to
obtain a suitable reverberation time in a room. From the
absorption coefficient,
α, calculated from measurement in a
reverberation chamber, one calculates the area of absor-
bent necessary to produce a required change in reverbera-
tion time in a particular room. The absorbent material is
installed, the reverberation time is measured in the actual
room and, if necessary, adjusted by adding or subtracting
some of the absorbent material.
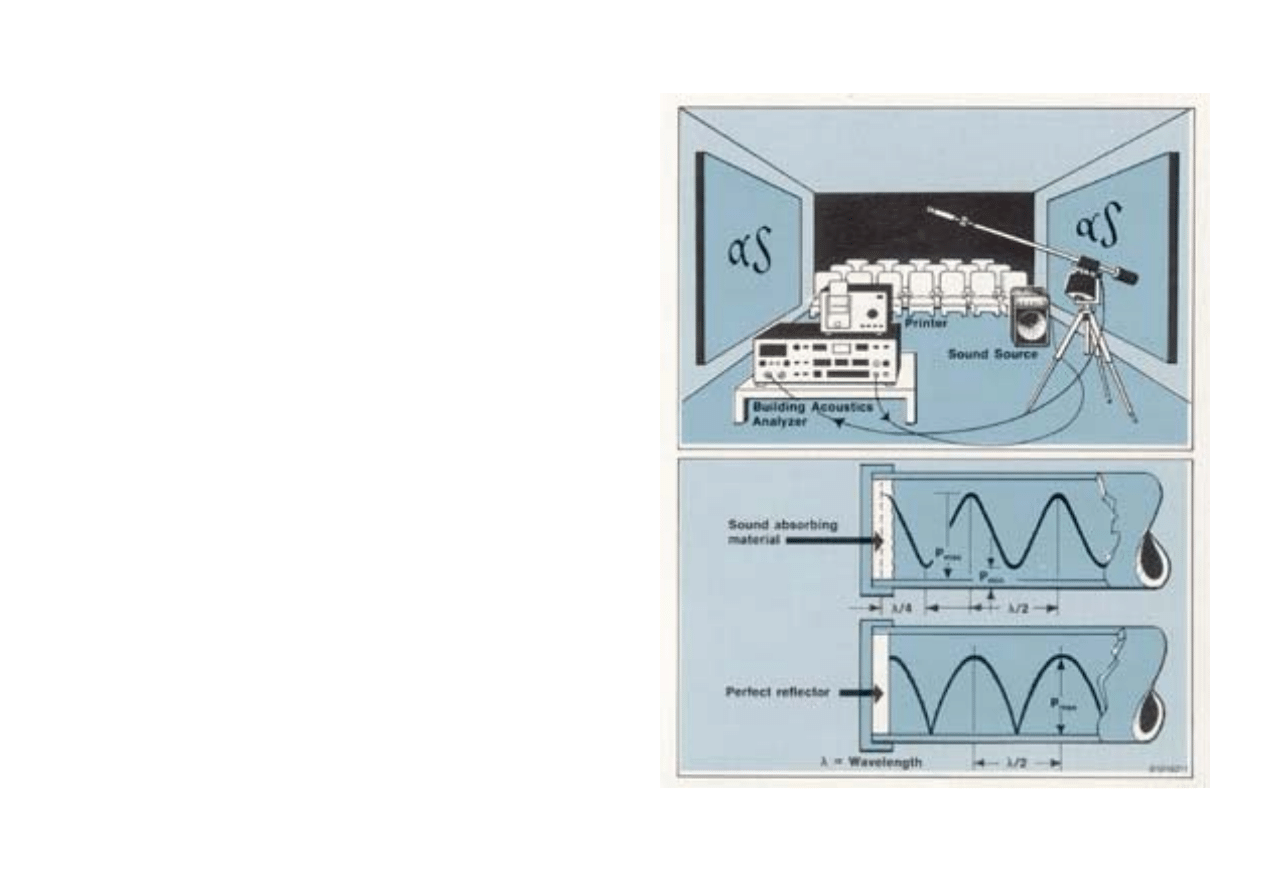
Standing Wave Method
In this method a loudspeaker is used to produce standing
waves in a tube terminated by the sample to be investigat-
ed. By measuring the ratio between the maximum and mini-
mum sound pressures by means of a probe microphone
moved along the axis of the tube, the absorption coefficient
can be calculated. The advantage of the method is that it
only requires small samples of material, gives reproducible
results and yields a direct scale reading for the value of a.
The disadvantages of the method are that
α is obtained for
normal incidence only and that the method can only be
used where the sample is representative of the material.
12
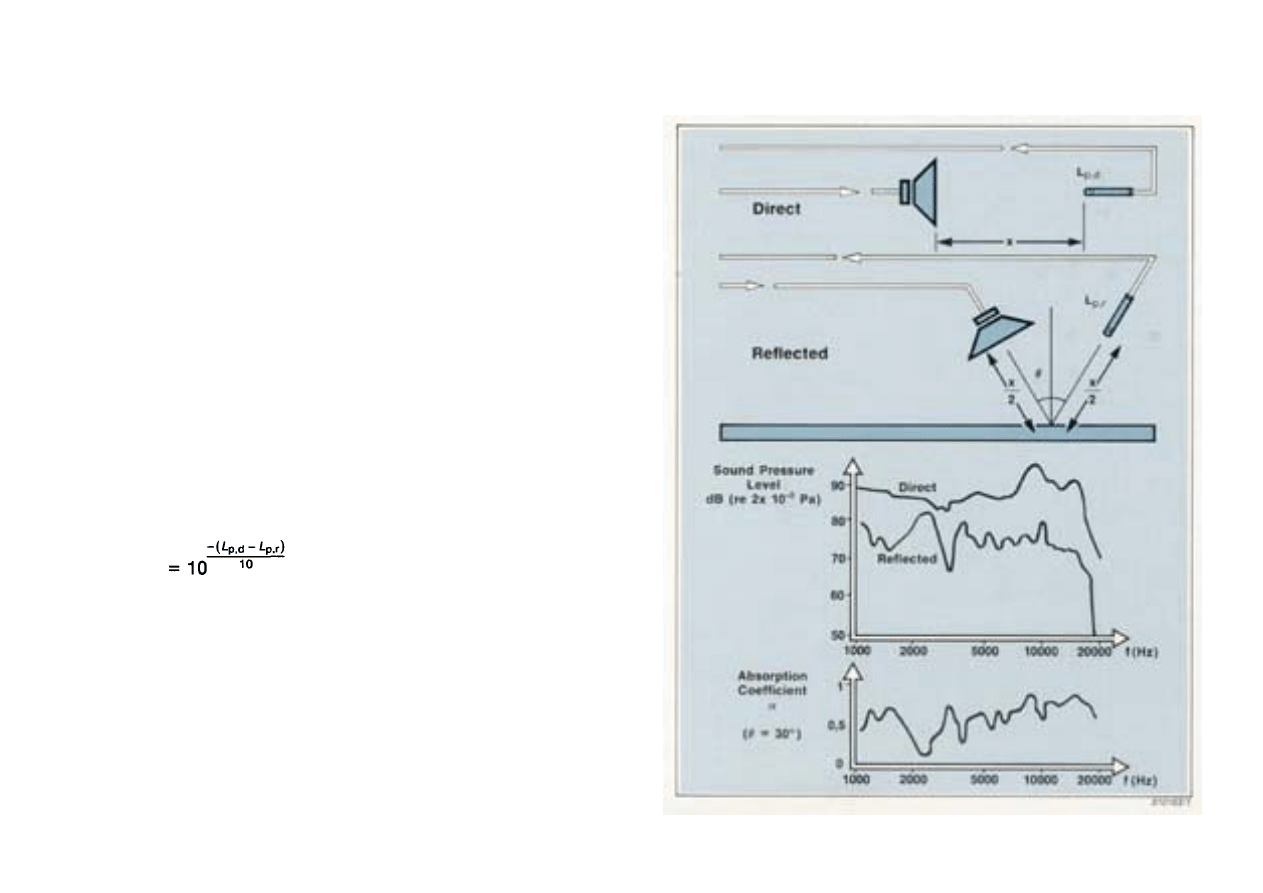
Tone Burst Method
This method enables the absorption coefficient of a materi-
al to be determined for various angles of incidence of
sound energy. No special reverberation room is required for
this test. A short tone burst is emitted from a loudspeaker
into the room at a distance x from the receiving micro-
phone. The loudspeaker is then aimed at the test speciment
at an angle of incidence,
θ, such that the total path length
for the reflected sound is the same as in the first case. By
comparing the sound pressure level, L
p,r
, of the reflected
sound to the sound pressure level, L
p,d
of the direct sound,
the reflection coefficient can be calculated and the absorp-
tion coefficient determined from:
α
θ
,f
= 1 - r
θ
,f
where
α
θ
,f
= the absorption coefficient
r
θ
,f
= the reflection coefficient
13
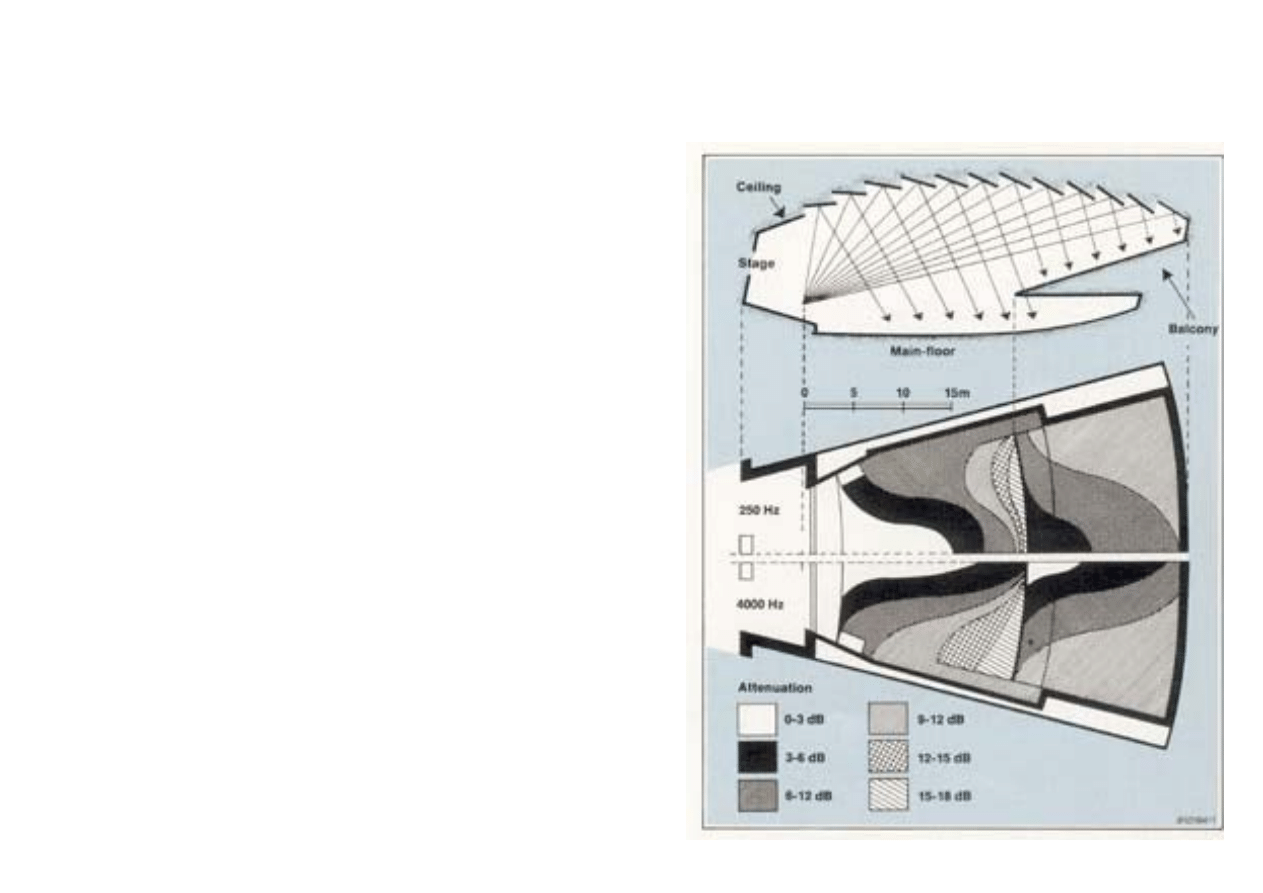
Measuring the Sound Distribution
Sound distribution measurements are especially important
in theatres and concert halls or other public halls where
music and speech must be heard clearly throughout the vol-
ume of the auditoria.
Measurement in Existing Room
Measurements of sound distribution in a room can be made
directly by placing a source in the most probable position
of the actual source (theatre stage, church pulpit, etc.) and
by using a sound level meter to measure the sound pres-
sure levels at various positions in the room. The source
should be a constant sound power source radiating a wide
band signal (white or pink noise).
This method can be made more informative if measure-
ments are made at the same positions but at different fre-
quencies. Filters (octave or third octave) can be used in the
emitting section to limit the necessary power of the source
and/or in the receiving section to reduce the influence of
background noise.
14
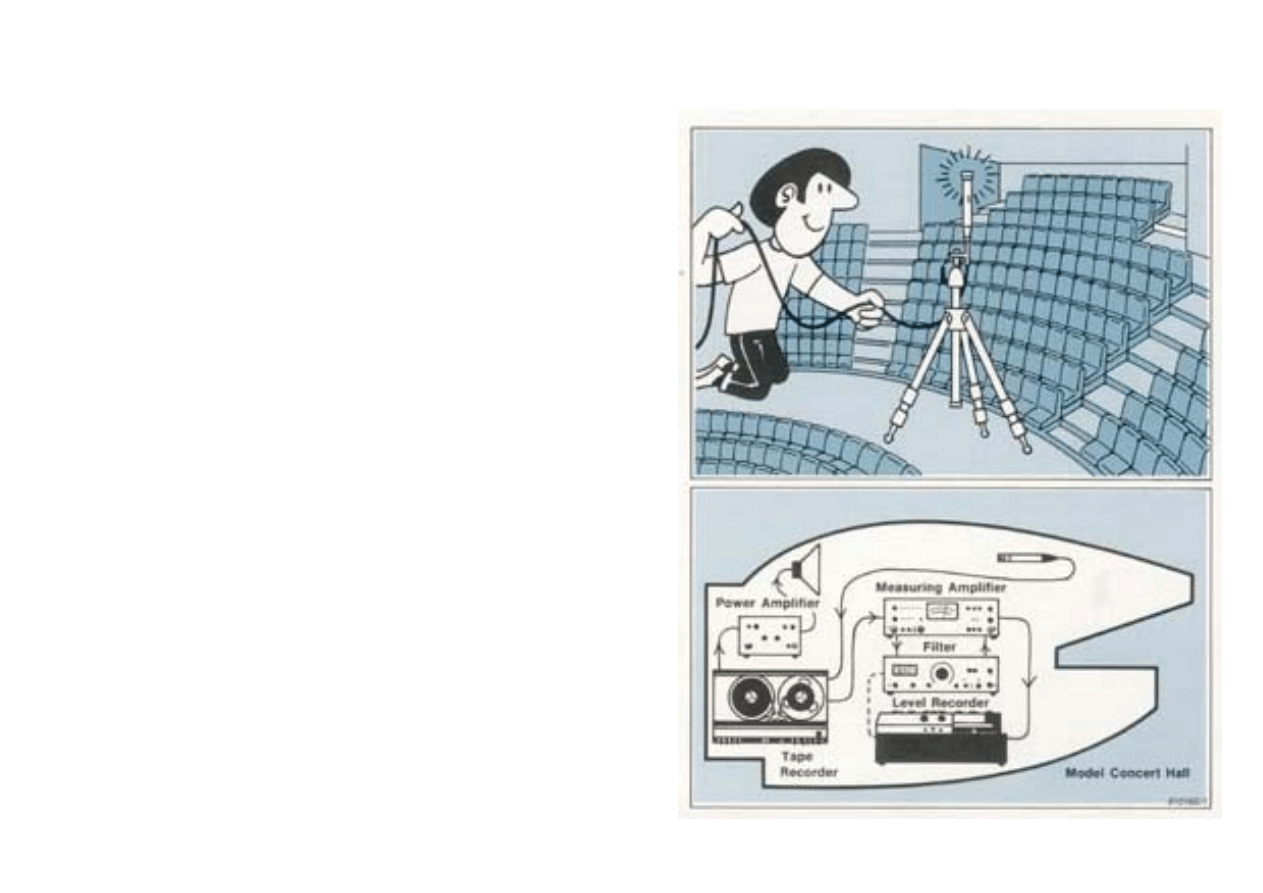
Measurements on Models
Before the construction of a costly new theatre or auditori-
um, it can be economically advantageous to investigate the
acoustics of the new design in a scaled-down model. Pro-
vided certain precautions are taken, model techniques can
be used to investigate amongst other things, reverberation
time, speech intelligibility and sound distribution.
The frequency of excitation of the source should be in-
creased by the same factor as that by which the model has
been scaled down. This may be achieved in three ways:
(a) By using a signal generator capable of producing noise
at the higher frequencies required in the model;
(b) By recording audio range excitation noise on a tape re-
corder and playing back the signal in the model room at
a correspondingly higher speed;
(c) By using a sound-source which has a frequency spec-
trum including relatively high frequencies e.g. an electri-
cal spark or an ultrasonic whistle.
At these high frequencies, both the transmitting and receiv-
ing transducers should be of small dimensions to avoid dis-
turbing the sound-field. Small condenser microphones can
be driven as transmitters, the advantage being the stability
of their frequency response, which can extend up to
140kHz. The signal at the receiving position in the model is
then recorded at high speed on a tape recorder. For analy-
sis, the tape is played back at low speed, which brings the
recorded signal into the audio frequency range.
15
Speech Intelligibility
Speech transmitted across a room by a person or a public
address system is never received at a listening position as
an exact replica of the original signal. Not only is back-
ground noise added but the signal is also distorted by the
reflective and reverberant properties of the room. Often a
direct consequence of these distortions is a reduction in
the intelligibility of speech.
To improve intelligibility, speakers usually adapt their
speech to suit the room - talking slowly in a very reverber-
ant room, or loudly either in a highly absorbent room or
one with dead-spots. However, in some situations, such as
when making an announcement over a public address sys-
tem, speakers cannot adjust their speech. The result is of-
ten an unintelligible announcement.
By quantifying speech intelligibility and measuring it in a
room, the extent to which acoustical treatment is required
to solve such problems is known. Typical remedies to im-
prove the clarity of speech include: sound reinforcement in
auditoria, reduction of reverberation time in meeting rooms,
prevention of echoes in large enclosures, optimisation of
public address systems and attenuation of background
noise.
16
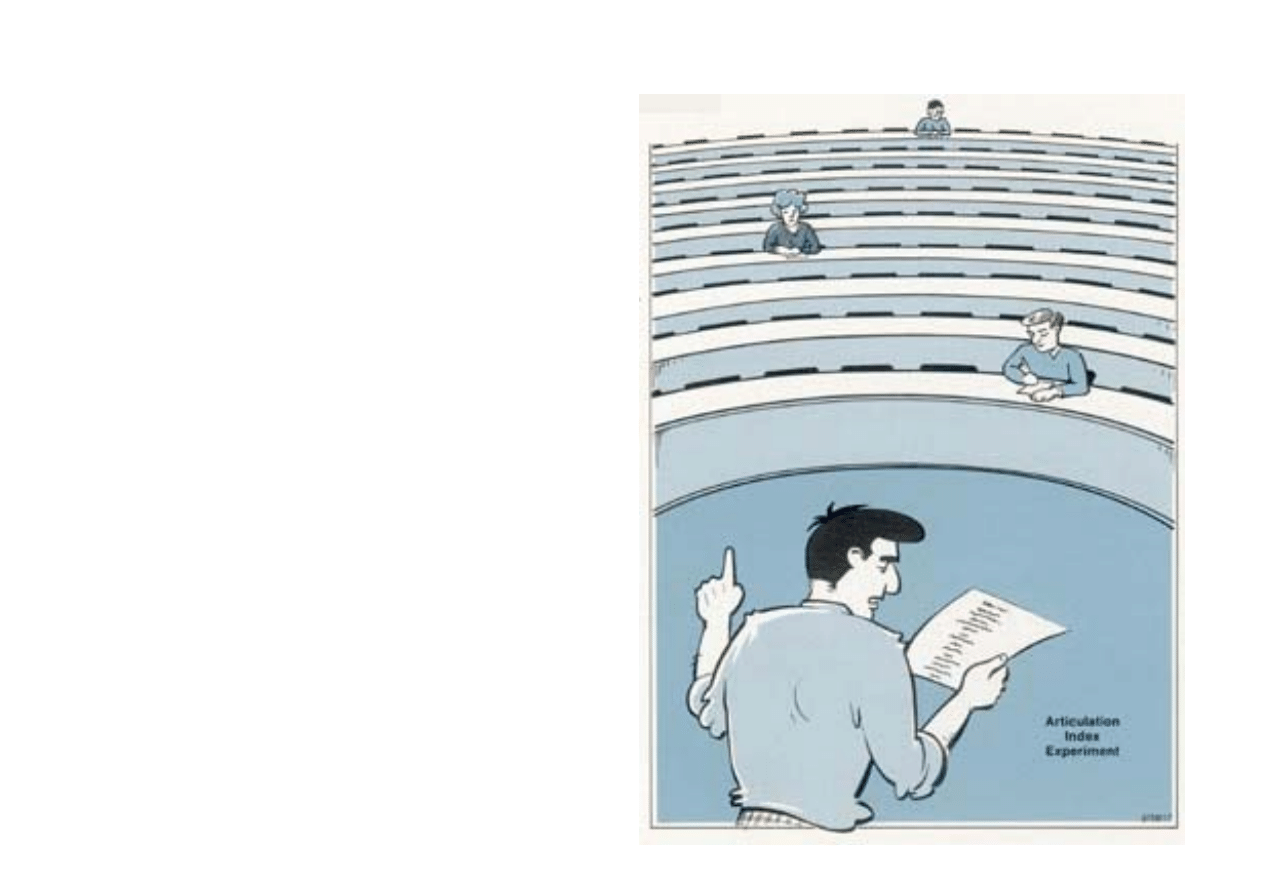
How is Speech Intelligibility Quantified?
Intelligibility is a subjective response, so it can be mea-
sured by examining the number of phonetically balanced
nonsense words correctly noted down by a team of trained
listeners. The results are expressed either as a percentage
word score, or as an index on a scale 0 to 1. An Articula-
tion Index (Al) of less than 0,3 generally suggests unintelli-
gible speech and one over 0,7 indicates excellent intelligi-
bility. Variabilities between different listeners will inevitably
produce a large spread in the results.
Another approach is to determine the Preferred Speech In-
terference Level (PSIL) from a set of sound pressure level
measurements. This involves measuring signal and noise
levels over a preferred speech spectrum (the three octave
bands centred on 500 Hz, 1 kHz and 2kHz) and then adding
an empirically derived correction factor to account for the
effects of reverberation.
Speech Transmission Index (STI) is also a number between
0 and 1 which quantifies speech intelligibility. It is derived
from a family of Modulation Transfer Function (MTF) curves.
These describe the extent to which the original modulations
in a signal are changed by a sound transmission system in
the seven octave bands from 125 Hz to 8kHz. The STI can
be evaluated without speakers and listeners and also pro-
vides information about the way in which the room is dis-
torting a signal.
17
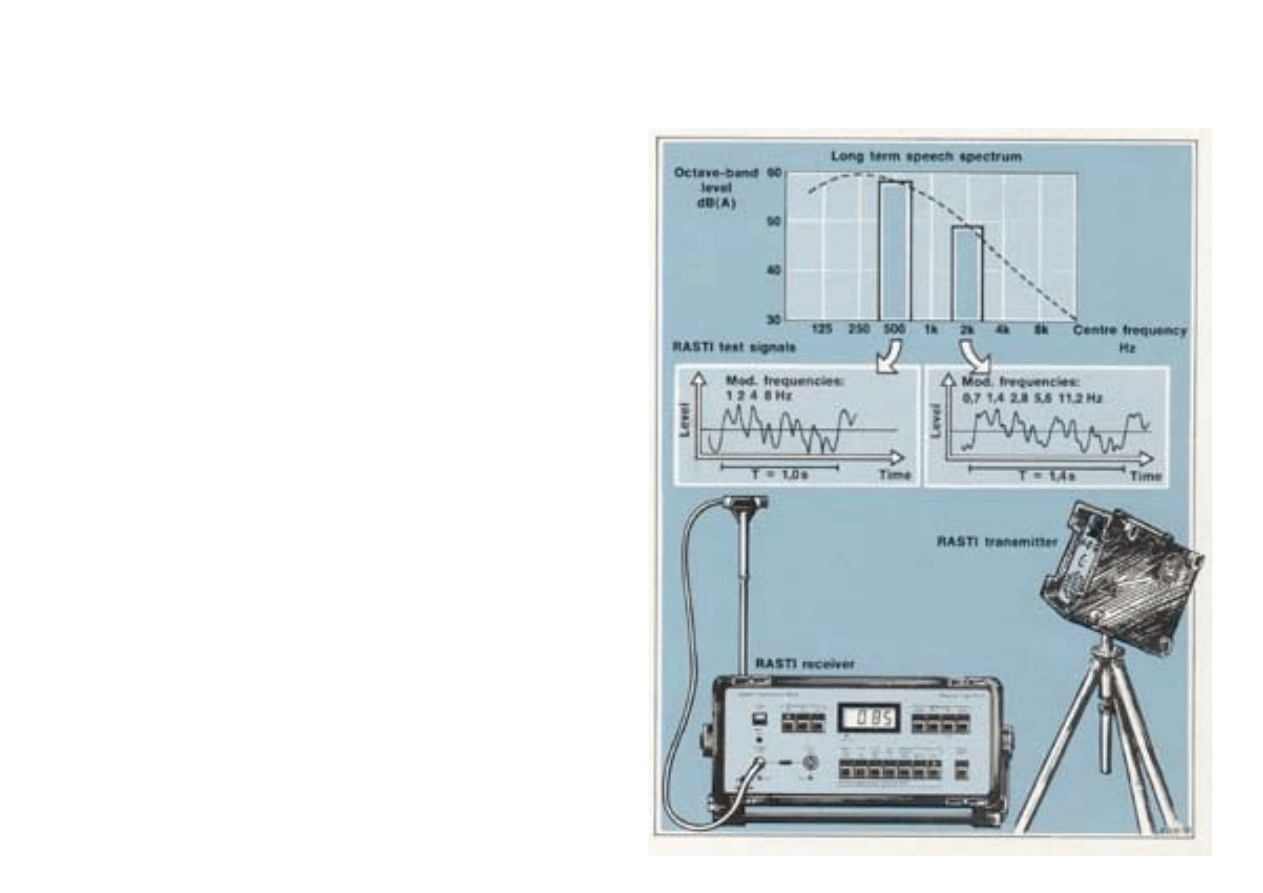
Rapid Speech Transmission Index (RASTI)
By confining the measurement of the Modulation Transfer
Function to only two octave bands, the Rapid Speech
Transmission Index (RASTI) can be calculated. This is much
quicker than following the full STI procedure, and can easily
be accomplished by using RASTI transmitting and receiving
equipment.
RASTI Transmitter
A RASTI transmitter generates pink noise of levels 59 dB
and 50 dB (at a distance of 1m) in the 500 Hz and 2kHz
octave bands, respectively, to mimic the long-term speech
spectrum. This noise is modulated sinusoidally by several
frequencies simultaneously, representing the modulations
found in normal speech. The transmitter transmits with the
directional properties that would be measured 1 m from a
speaker's mouth.
RASTI Receiver
An omni-directional microphone picks up the transmitted
signal, which is analyzed by the RASTI receiver to detect
the changes caused by the transmission medium. The re-
ceiver and transmitter are not synchronized (and are there-
fore independent units) because the signal is repetitive. The
deviation of the received signal from the transmitted signal
is recorded for each modulating frequency as a modulation-
reduction factor (m). RASTI is calculated from the modula-
tion reduction factors and is displayed as a number be-
tween 0 and 1.
18
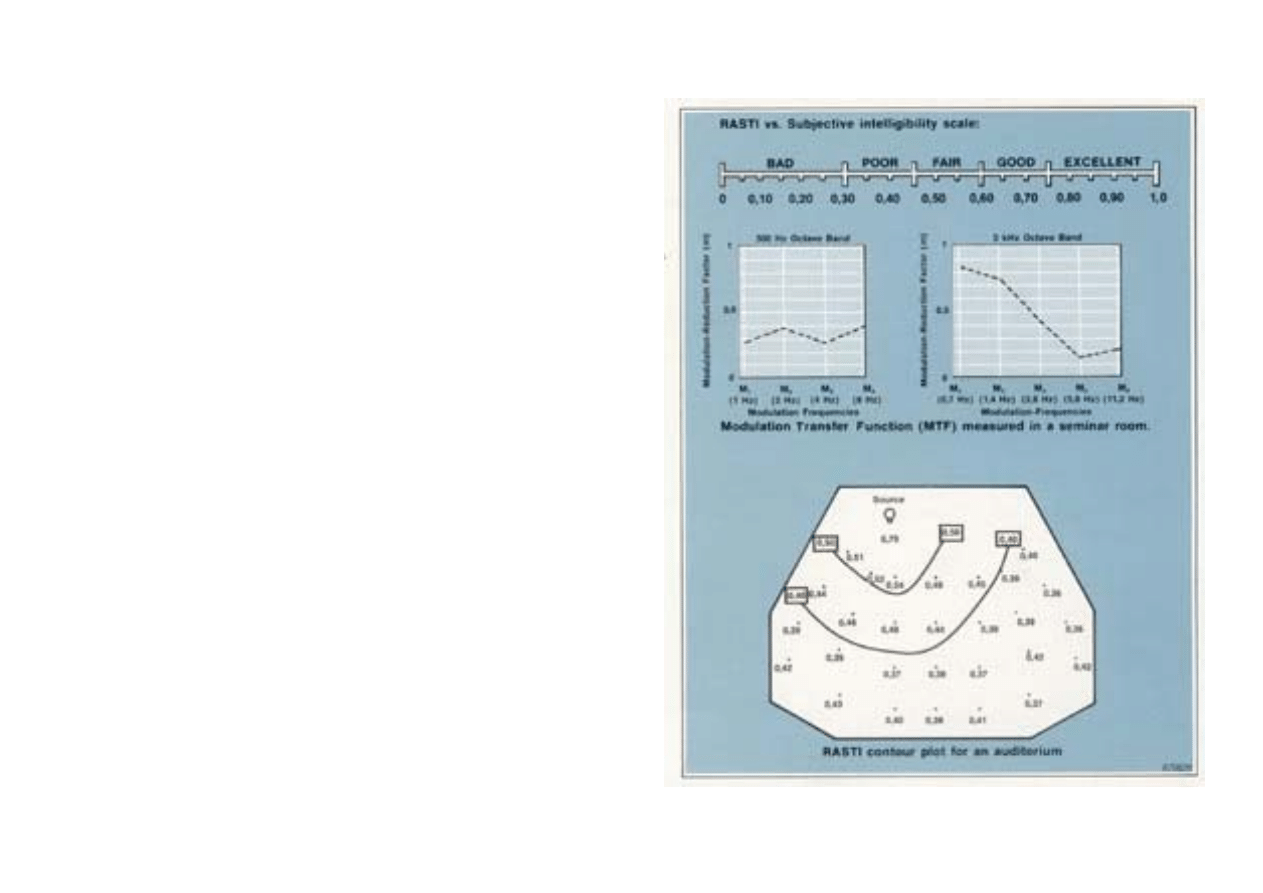
Interpretation of RASTI Measurements
RASTI may be related to the subjective intelligibility scale
shown opposite, which has been derived by comparing the
phonetically balanced word score and STI methods.
Information regarding the acoustical properties of the en-
closure may also be derived from the RASTI measurements
by using the Modulation Transfer Function (MTF). The MTF
is simply a plot of modulation-reduction factor (m) against
modulation frequency (M}. If the MTF is flat then the source
of interference is noise, if it has negative slope then the
interference is reverberation. Examples of these two types
are shown in the figure. A complicated MTF suggests that
there is interference by a discrete echo.
Applications of RASTI
The RASTI method identifies areas of poor speech intelligi-
bility in a room and, because it is a quick method, the re-
sults can be displayed in the form of an iso-RASTI contour
plot. Public address and sound reinforcement systems can
be tested, either with the source placed at the microphone
position or connected electrically to the system.
The method may also be used to assess the suitability of a
room for the recording of speech, or determining the
acoustical privacy of a room from adjoining rooms. In the
latter case, a RASTI of less than 0,3 should be obtained if
the transmitter were set up inside a room, with the receiver
outside.
19
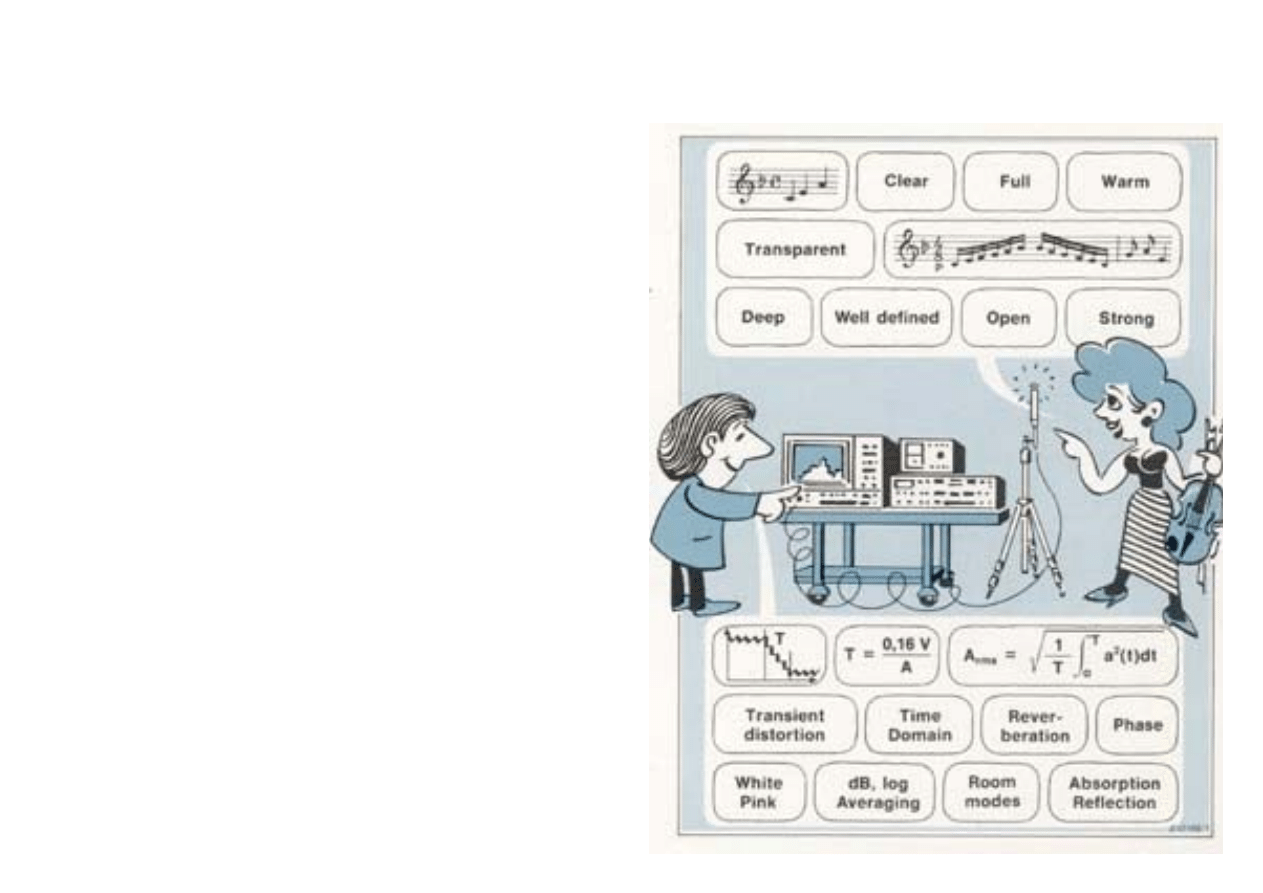
Real-Time Analysis in Room Acoustics
What are "good acoustics"?
It is generally not easy to specify what constitutes "good
acoustics". Firstly, everything depends upon what the room
is intended to be used for. The acoustical requirements are
not the same for a concert hall, a theatre or a lecture room,
and when the same hall has to be used both for concerts
and theatre performances, some compromises have to be
made. Secondly, it depends upon how the acoustics of the
room are defined. An acoustician will talk about reverbera-
tion time, sound distribution, absorption, etc. in other words
objective parameters which it is possible to measure. A
musician listening to a piece of music or someone listening
to a speech in the room will describe the acoustics in terms
of definition, clarity of tone, warmth etc. In other words pa-
rameters which may be subjective or difficult to measure. In
fact, the concept of "good acoustics" consists of a combi-
nation of most of these parameters, objective as well as
subjective, considered in a "global" fashion. Therefore, to
approach a more global evaluation, it may be necessary to
consider several parameters simultaneously, such as ampli-
tude, frequency and time. "Real-time analysis" allows the
whole spectrum of a sound signal to be analyzed without
corrupting or losing parts of the original signal. The time
variations of the spectrum can therefore be studied.
20
Real-Time Analysis
A real-time analyzer frequency-analyzes a sound signal and
displays the results on a screen in the form of a bar graph
of level against frequency band. By continuously updating
the screen a fluctuating picture is obtained which closely
follows the changes in level within the room. This enables
"real-time" tests to be made within the room for the voice
or for musical instruments so that the result can be ob-
served immediately on the screen. For example, differences
in reverberation times between lower and higher frequency
bands will clearly appear on the screen as different decay
rates of the columns representing the instantaneous level in
the different frequency bands of the spectrum. Real-time
analysis is especially useful in the detection of echoes, the
positioning of reflectors, measurement of reverberation
time, etc.
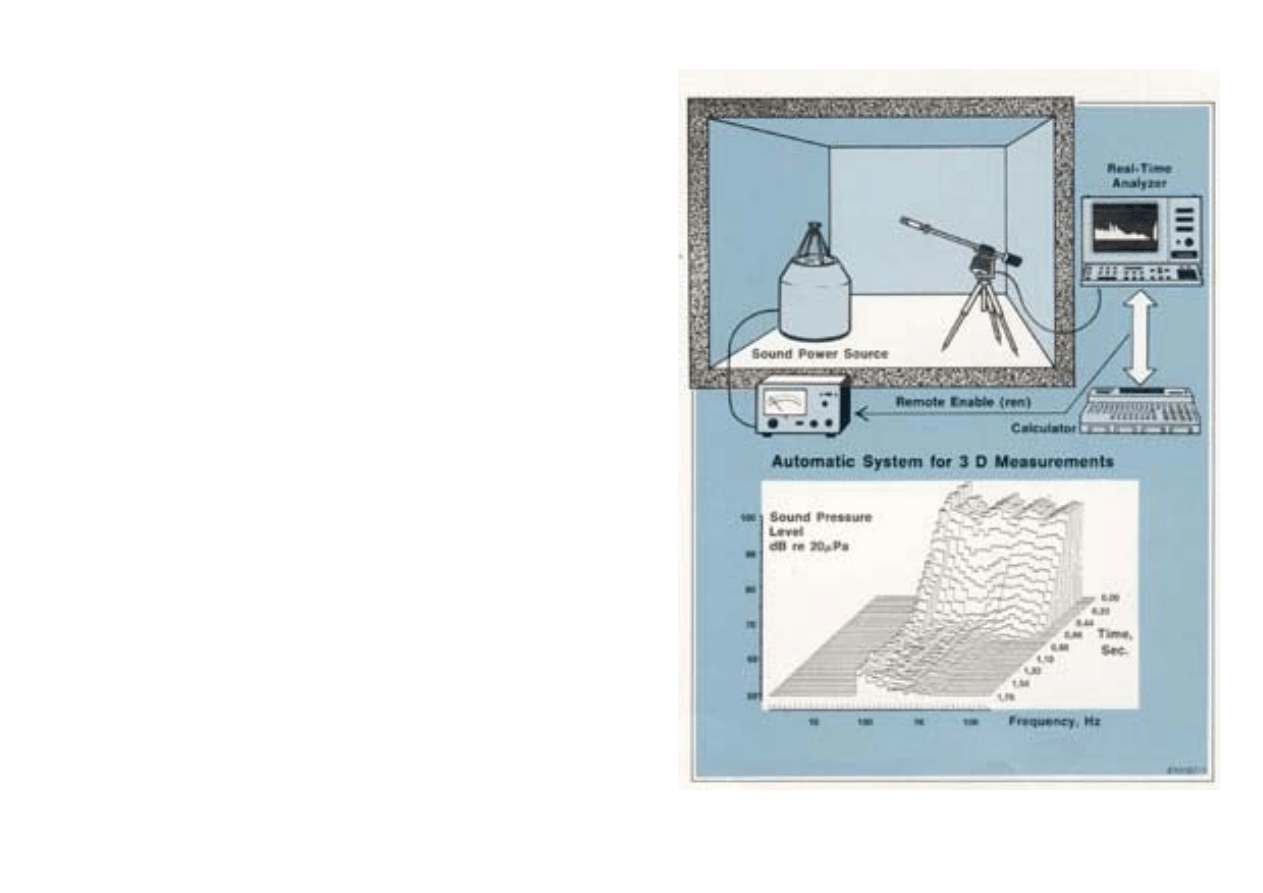
Reverberation Decays in Three Dimensions
The reverberation time decay curves of a sound produced
in a room may be represented as a three-dimensional am-
plitude-frequency-time landscape by using a real-time ana-
lyzer in conjunction with a computer and a graphics plotter.
If the sound-source can be started and stopped automati-
cally by the computer, then a large number of reverberation
decays can be measured and averaged to produce a final
"decay curve" for each frequency band of interest.
21
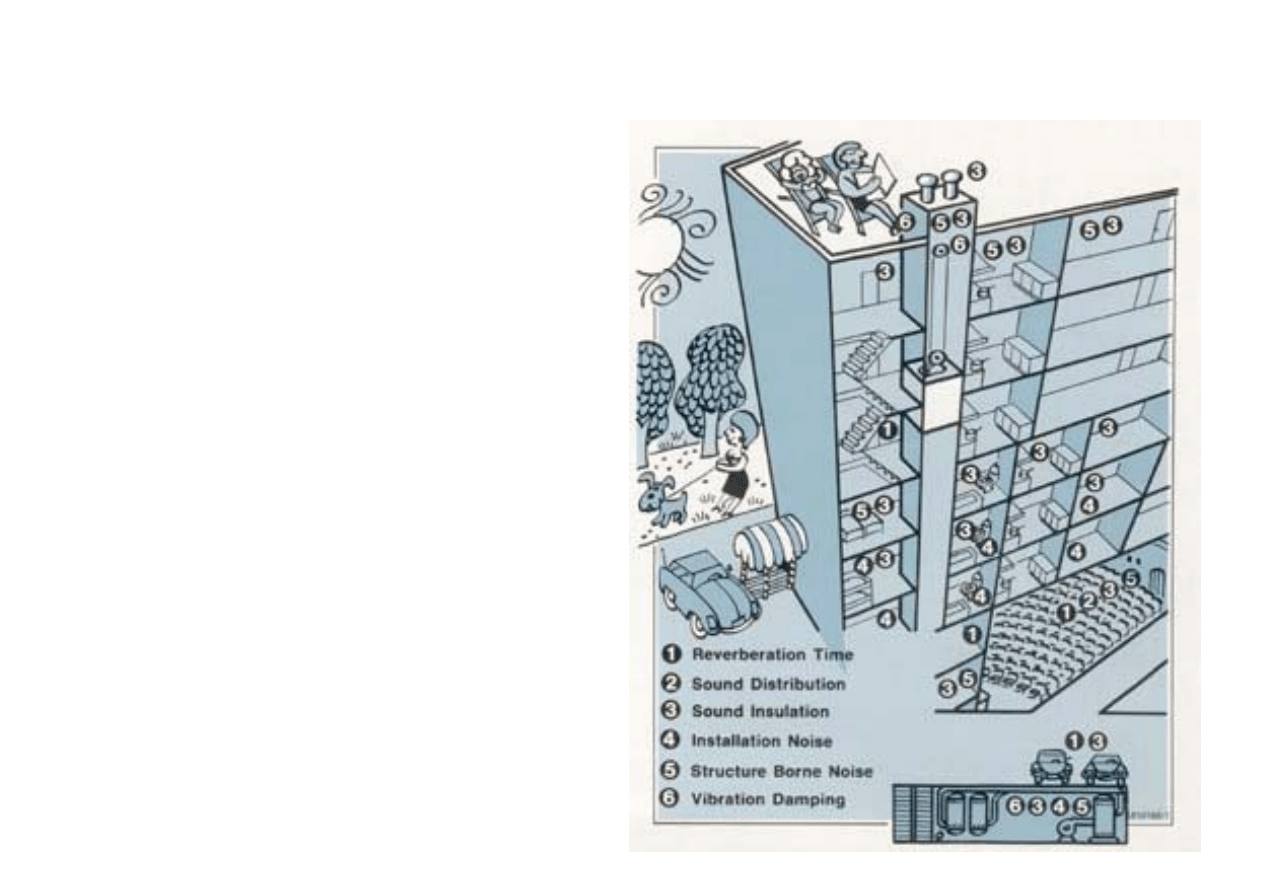
Acoustics of Buildings: What Should be Measured?
Reverberation Time
The reverberation time should be measured in rooms or
parts of the building where noise has to be reduced (e.g.
flights of stairs), and in situations where sound insulation
measurements are to be made (the calculation of certain
insulation indices takes into account the reverberation
time).
Airborne and Impact Sound Insulation
Sound energy does not remain in the room where it is pro-
duced but propagates throughout the building by any avail-
able transmission path and intrudes into other rooms as
noise. Sound energy is transmitted via the air and via the
structure of the building structure. In homogeneous struc-
tures of low loss factors (e.g. a solid concrete wall) sound
energy is transmitted with very little attenuation. The acous-
tic parameters to be measured to describe the sound insu-
lation provided by a wall or a floor are the airborne and the
impact sound insulation.
installation Noise and Vibration Damping
Machinery, heating and elevator installations are often
noisy. Therefore most standards of building regulations
specify maximum limits of the received noise for each in-
stallation in rooms where people are living. What is required
here are measurements of:
(a) noise and vibration at the source;
(b) sound and vibration transmission via the structure or via
ventilation, heating system and water installations;
(c)
the noise level in rooms affected by the installation
noise.
22
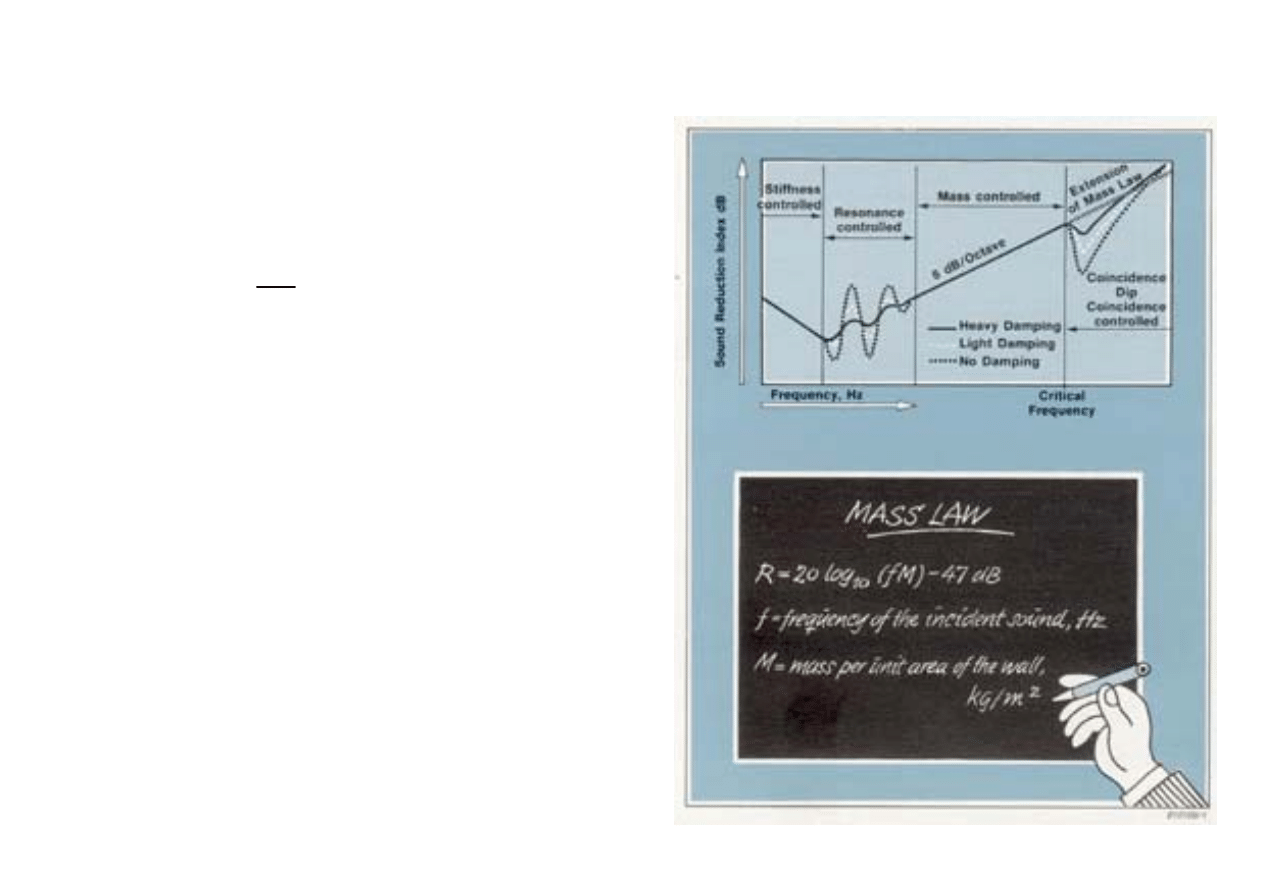
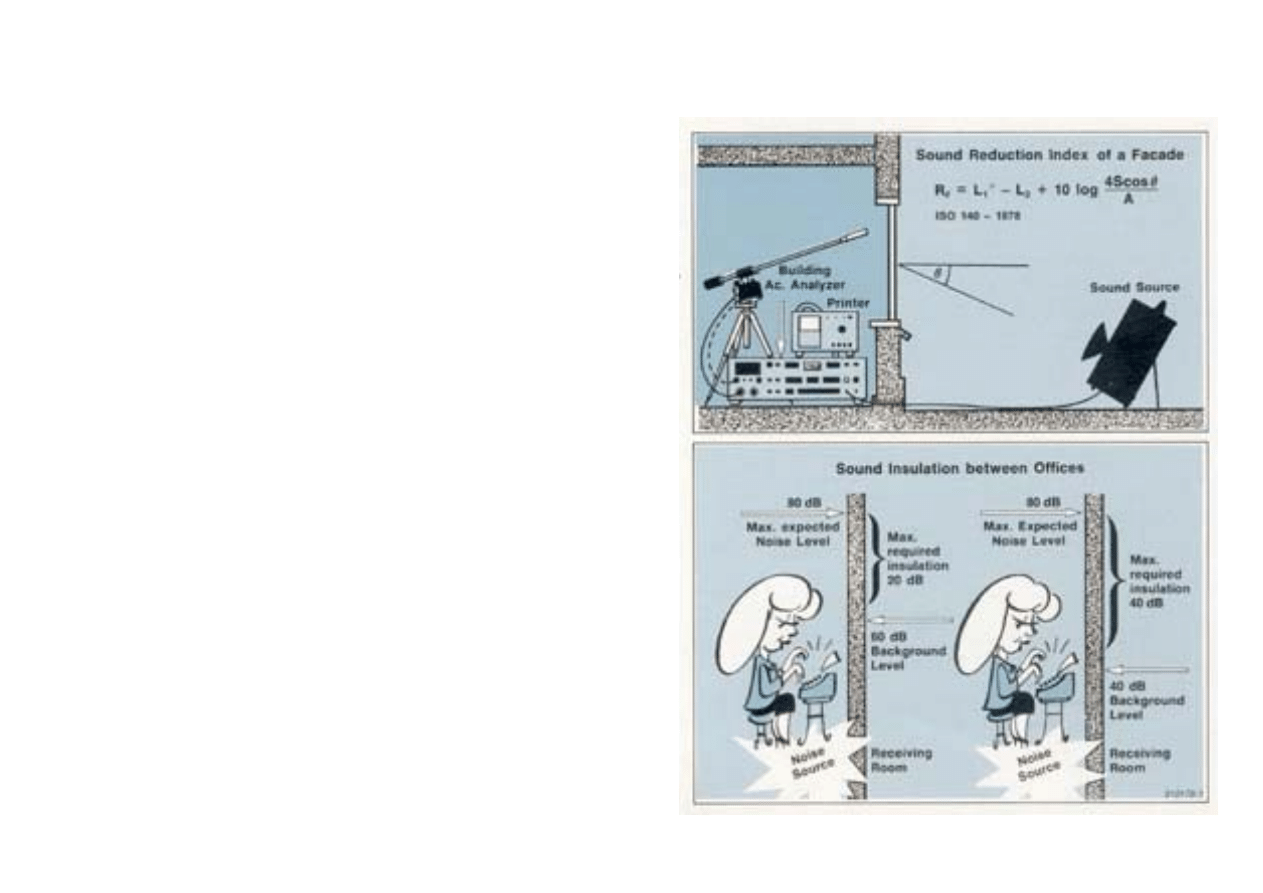
Sound Reduction Index of a Wall
The airborne sound insulation afforded by a wall is ex-
pressed in terms of the Sound Reduction Index, R, which is
the ratio in dB of the incident sound power on the wall to
the sound power transmitted through the wall. The Sound
Reduction Index depends on the frequency and the angle of
incidence of the emitted sound.
W
1
R = 10 log
10
W
t
W
i
= Sound power incident on wall
W
t
= Sound power transmitted through wall
R = Sound Reduction Index, dB
For a solid homogeneous wall the curve of the sound re-
duction index as function, of frequency can be divided into
several regions according to which property of the wall has
most influence on the sound reduction. These properties
are the stiffness, resonance, mass- and coincidence-con-
trolled regions. The damping present in the structure affects
only the profile of the curve in the resonance and the coin-
cidence regions.
The Mass Law
In the mass controlled region, the Sound Reduction Index
increases by 6dB for each doubling in the frequency for a
given mass per unit area of the wall or for each doubling of
the mass per unit area (e.g. a doubling of the thickness) at
a given frequency.
23
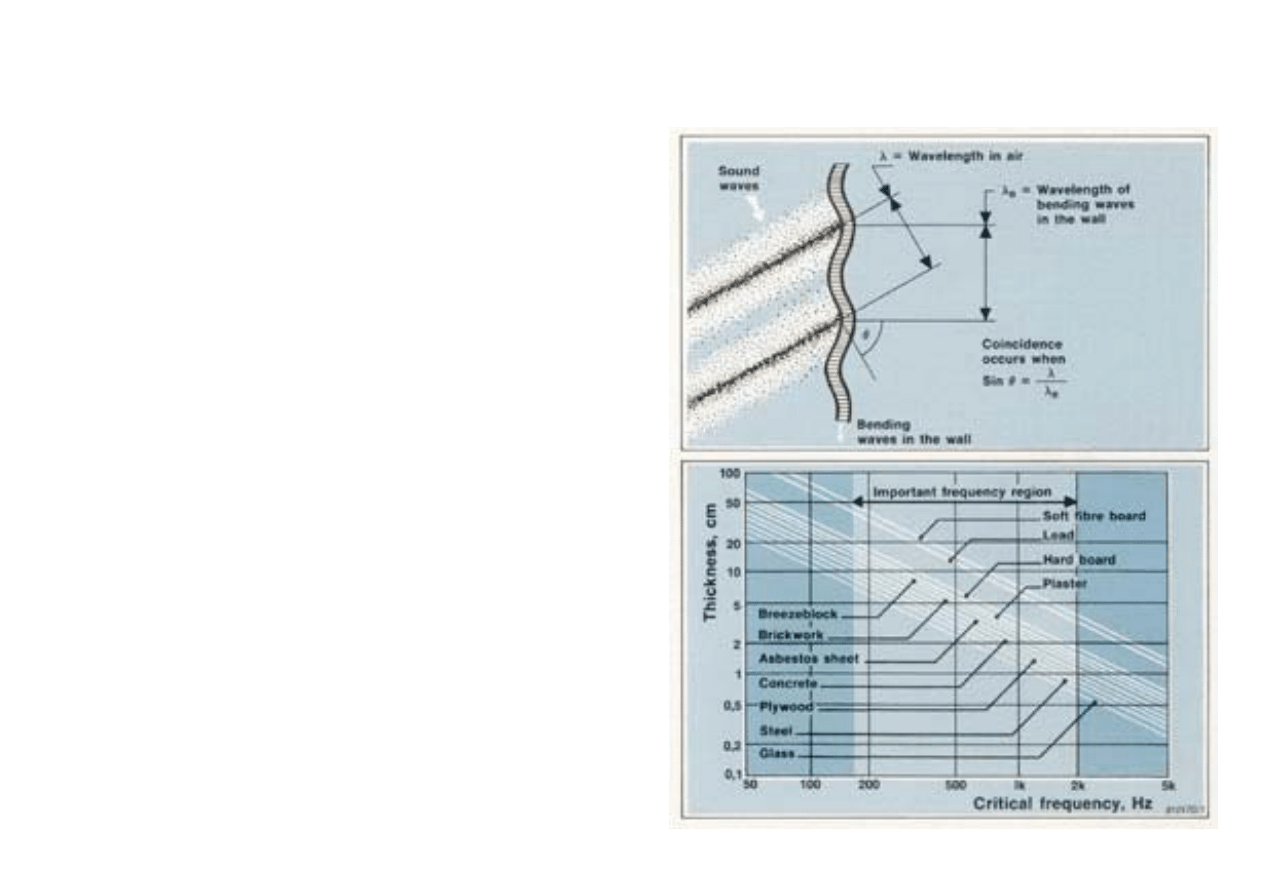
What is the Coincidence Effect?
The Coincidence Effect
The Mass Law provides a good working rule to predict the
airborne sound insulation of a partition but, in practice, the
application of this law is limited in the high frequency re-
gion by the coincidence effect. This effect occurs when the
projected wavelength of the sound in the air is the same as
the wavelength of the bending waves in the partition. For a
certain frequency and a certain angle of incidence of the
incident sound-waves, the bending oscillations of the parti-
tion will be amplified and the acoustic energy will be trans-
mitted through the partition almost without attenuation. In
practice, the incident sound-waves arrive from every angle
of incidence to the partition, which is then almost acousti-
cally transparent for a narrow frequency region, called the
"coincidence dip".
The Critical Frequency
The lowest frequency for which the coincidence effect oc-
curs on a certain partition is obtained when the incident
sound-waves graze the partition (i.e. are parallel with it).
This frequency is called the critical frequency, f
c
.
The nomogram on the right may be used to determine the
critical frequency in an actual situation when designing an
enclosure or a dividing wall. For example, a 3cm thick ply-
wood partition has a critical frequency at about 500 Hz,
which is unfortunately in the middle of the speech frequen-
cy region.
24
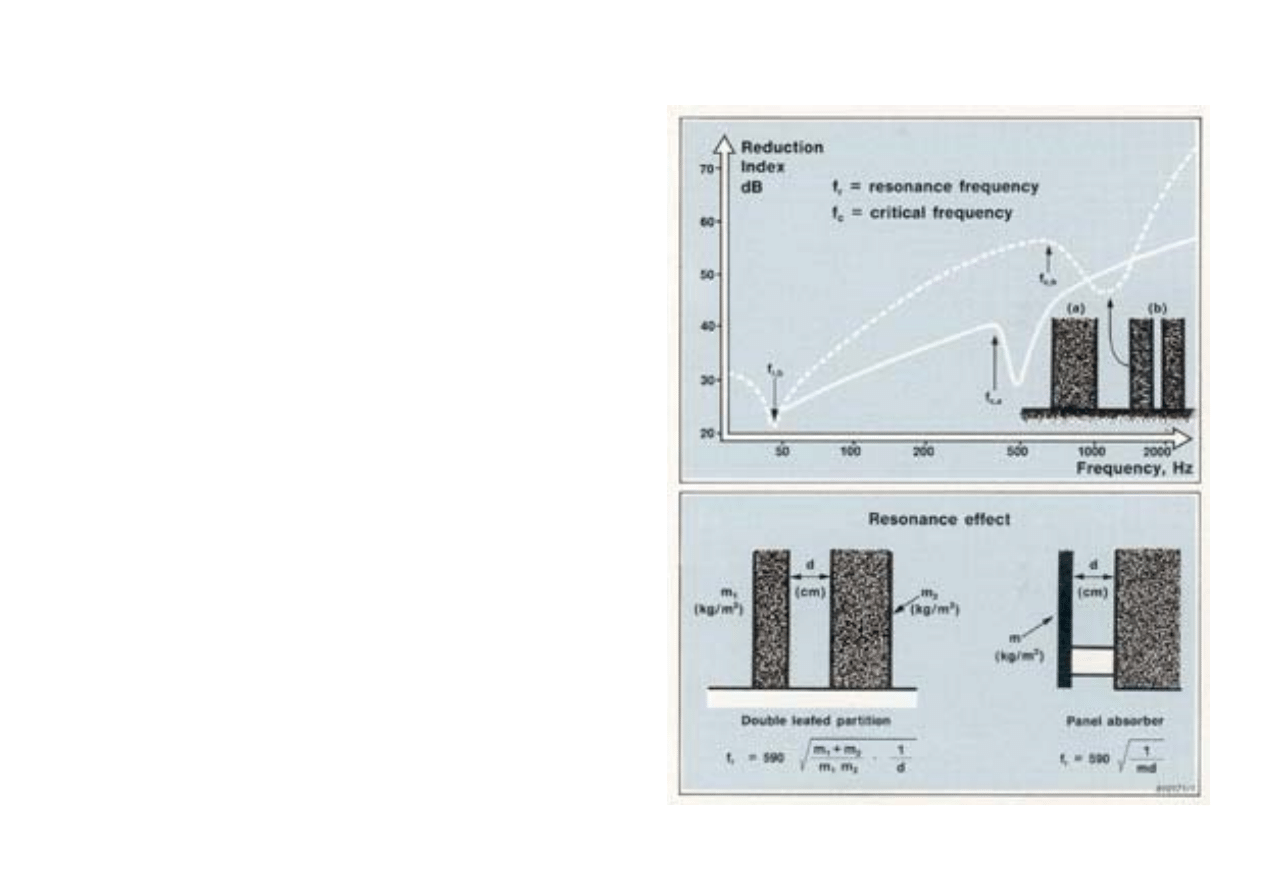
Double-Leafed Partition
One way of moving the coincidence effect to a higher fre-
quency range without reducing the sound insulation is to
use a double-leafed partition. For a double-leafed partition,
the coincidence frequency is determined by the thickness of
each element, while the Sound Reduction Index is even
higher than that predicted by the Mass Law for a single
partition of the same mass. Moreover, it is an advantage to
choose two different thicknesses for both half-elements in
order to avoid both coincidence effects being situated at
the same frequency.
The Resonance Frequency
Generally, the sound insulation of a double-leafed partition
is better than that of a single wall of the same overall mass.
However, at the mass-spring-mass resonance frequency (f
r
)
of the partition, the sound insulation is not better — so
care must be taken to keep f
r
out of the frequency range of
interest (i.e. below 100 Hz).
Note that the resonance effect can be used advantageously
when it is desired to absorb lower-frequency sound energy
in a noisy/reverberant room. A thin panel is fixed at a dis-
tance d from a rigid wall and the resonance frequency of
the panel is chosen in that case to fall in the frequency
region where the noise has to be reduced.
25
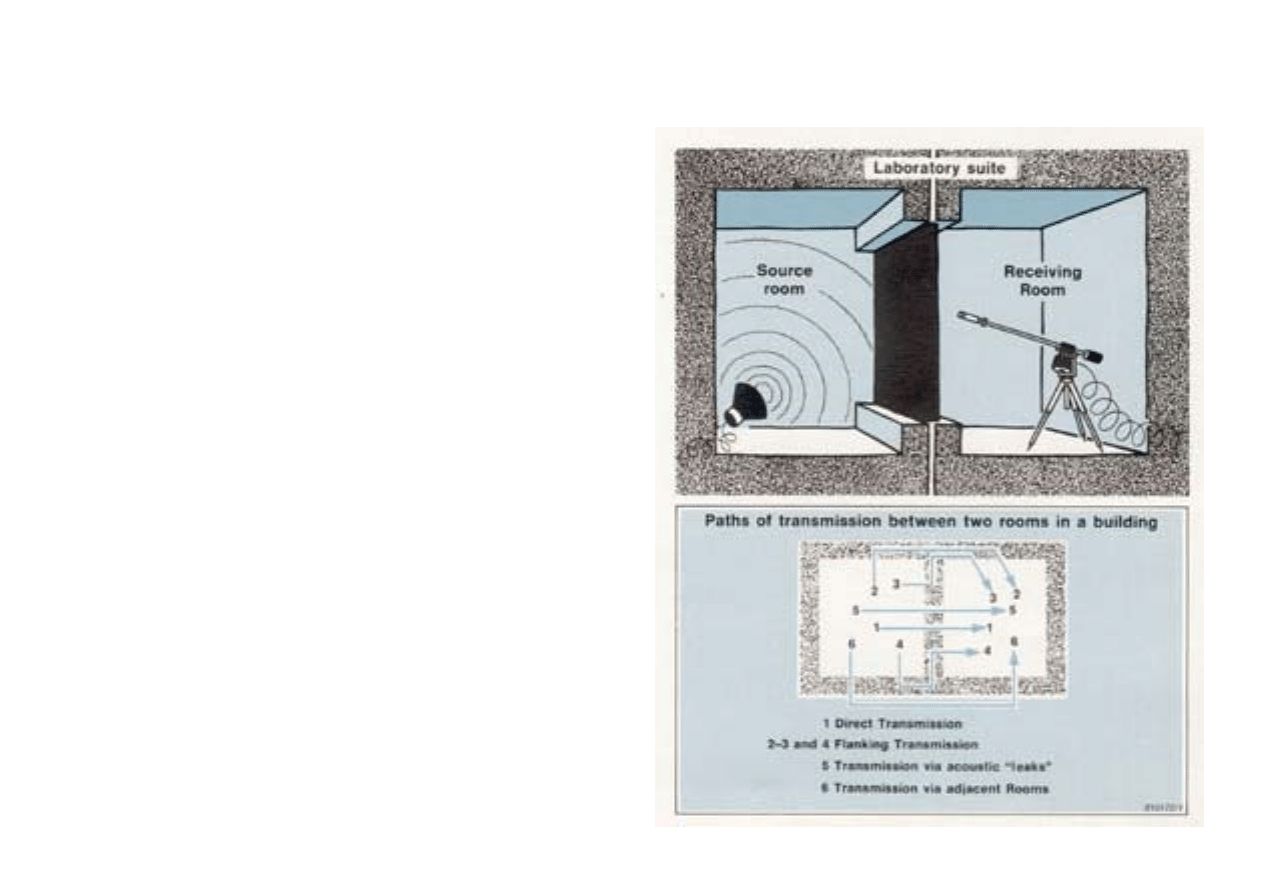
Laboratory and Field Measurements
Laboratory Measurements
Laboratory measurements are used to determine specific
properties of a material or to make a complete investiga-
tion of it in order to establish acoustic data or a quality
standard. They are also used to ensure that the quality of a
material or a sample of building element meets internation-
al standards or local regulations.
The test room suite of a laboratory is constructed very
carefully to avoid any possible flanking transmission. Thus,
when sound insulation tests are performed, practically all
the energy in the receiving room is transmitted through the
partition under test.
Field Measurements
There are so many possible transmission paths of sound in
a building and so many factors influencing the acoustic
quality of the construction that the only way of determining
whether the building meets the legal requirements is to
make measurements "in situ" in the actual building.
In most cases, a part of the sound produced in a room is
transmitted indirectly via flanking elements or acoustic
"leaks" into adjacent rooms. The sound insulation of build-
ing elements is therefore generally lower in situ than in the
laboratory. Therefore, care should be taken when selecting
building materials to include a safety factor in the calcula-
tion of the forecasted sound insulation of building construc-
tions.
26
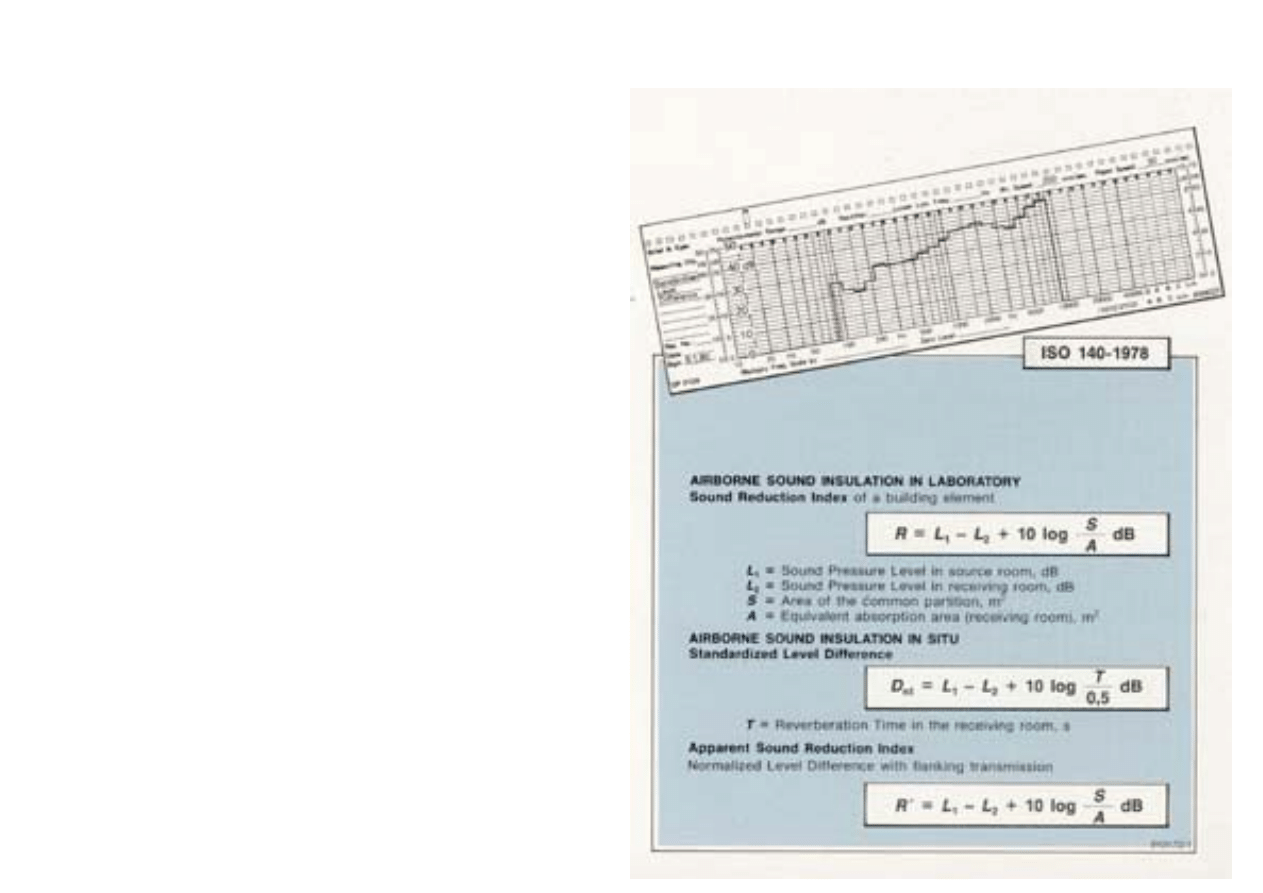
Airborne Sound Insulation
The Airborne Sound Insulation between two rooms is calcu-
lated from the difference between sound pressure levels in
the source and receiving rooms, plus a factor taking into
account the absorption in the receiving room. In a laborato-
ry, the correction factor involves the area of the test speci-
men, S, and the equivalent absorption area of the receiving
room, A, which can be determined from the volume and the
reverberation time of the receiving room. In actual build-
ings, the correction factor depends on the way the room
insulation is defined. The two most usual definitions are:
the Standardized Level Difference, D
nT
, involving the rever-
beration time of the receiving room referred to a standard
reverberation time of 0,5s, and
the Apparent Sound Reduction Index, R', involving the
area of the common partition, the reverberation time and
volume of the receiving room.
Since the reverberation time in a furnished room is about
0,5s, D
nT
-corresponds to the actual sound insulation experi-
enced by people in a living-room or a bedroom. (R', on the
other hand, takes into account the dimensions of the room.)
For small rooms, like bathrooms, R' is the less stringent
requirement of the two.
27
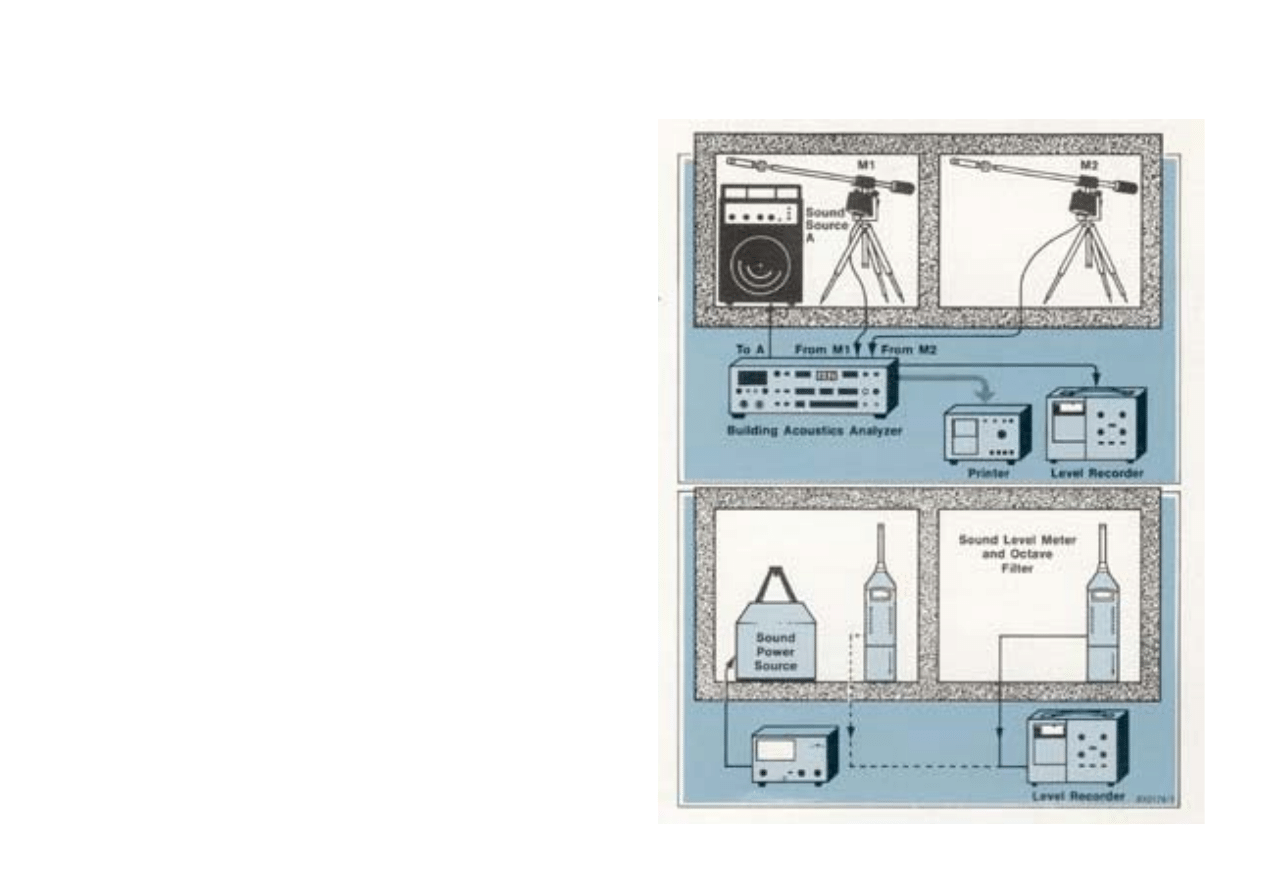
Measuring Airborne Sound Insulation
The Transmitting Section
When measuring the sound reduction index of a building
element in a laboratory, the excitation of the source room
may be obtained (as for reverberation time measurements,
see pp.8-9) from a broad-band signal filtered 1/3 octave
bands supplied by a noise generator followed by a filter set.
For "in situ" measurements, the sound-source can be a
portable system generating noise in wide or narrow bands
or even a noise source available on the spot such as a
machine, providing that the noise emitted is stationary and
broad-band without dominating frequencies. The noise lev-
els in the source room should be high enough to allow
meaningful measurements to be made.
The Receiving Section
The sound pressure levels are measured successively in the
source room and the receiving room and plotted on a level
recorder. A filter in the receiving section may be necessary
if a broad-band noise source is used in the transmitting
section or if the sound levels measured in the receiving
room are not at least 6 dB higher than the background
noise level. For measurements in situ, a precision sound
level meter with built-in filters, or fitted with a filter set, may
be used in connection with a portable level recorder. As for
reverberation time measurements, it is necessary to aver-
age the sound pressure levels both spatially and temporally.
A Building Acoustics Analyzer automatically carries out the
measurement sequence requiring only a microphone, a
power amplifier and loudspeaker, and a printer as external
equipment.
28
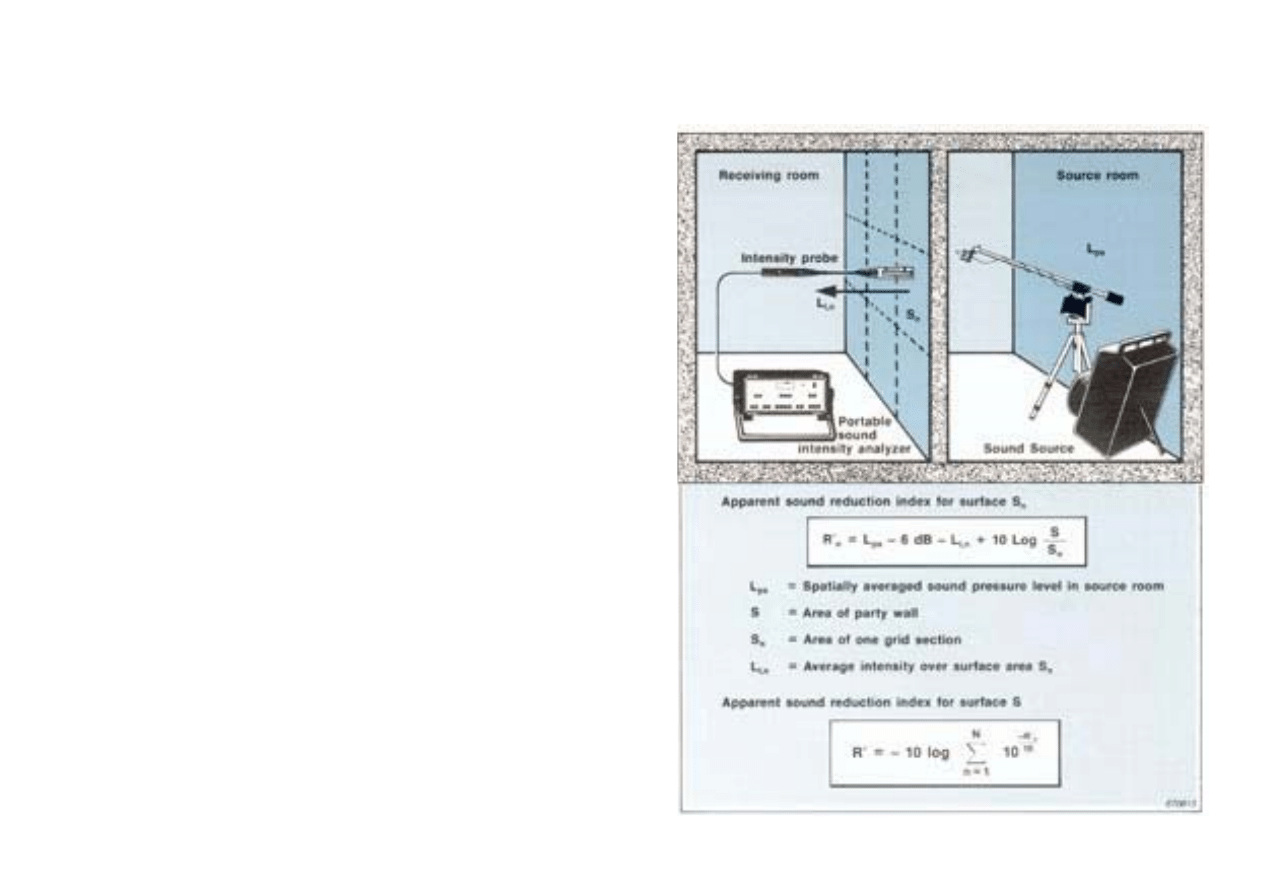
Intensity Approach
Sound intensity measurements provide an alternative ap-
proach for measuring airborne sound insulation. Intensity is
a vector quantity which describes the sound energy flowing
through an area. Units are W/m
2
. It can be measured direct-
ly by using a two-microphone probe and an intensity ana-
lyzer.
Measurements in the source room are carried out in exactly
the same way as previously. In the receiving room, a grid
applied to the measurement surface defines the areas of
interest. The average sound intensity flowing through each
grid-segment can be measured directly by using a sound
intensity analyzing system. The sound power emitted by
each segment in the grid is simply the average sound inten-
sity multiplied by the segment's area.
Since the flow of sound intensity through any surface in the
room may be examined, it is possible to measure the con-
tribution of the various flanking and leakage transmissions
towards the total power in the receiving room. In this way
results can be compared with those obtained by the previ-
ous method.
A significant advantage of the intensity approach is that the
apparent sound reduction index of R'
n
for any area on the
measurement grid may be found. So if a compound parti-
tion is to be studied, for example a wall containing a win-
dow, R'
n
may be found for both the wall material and the
glass.
29
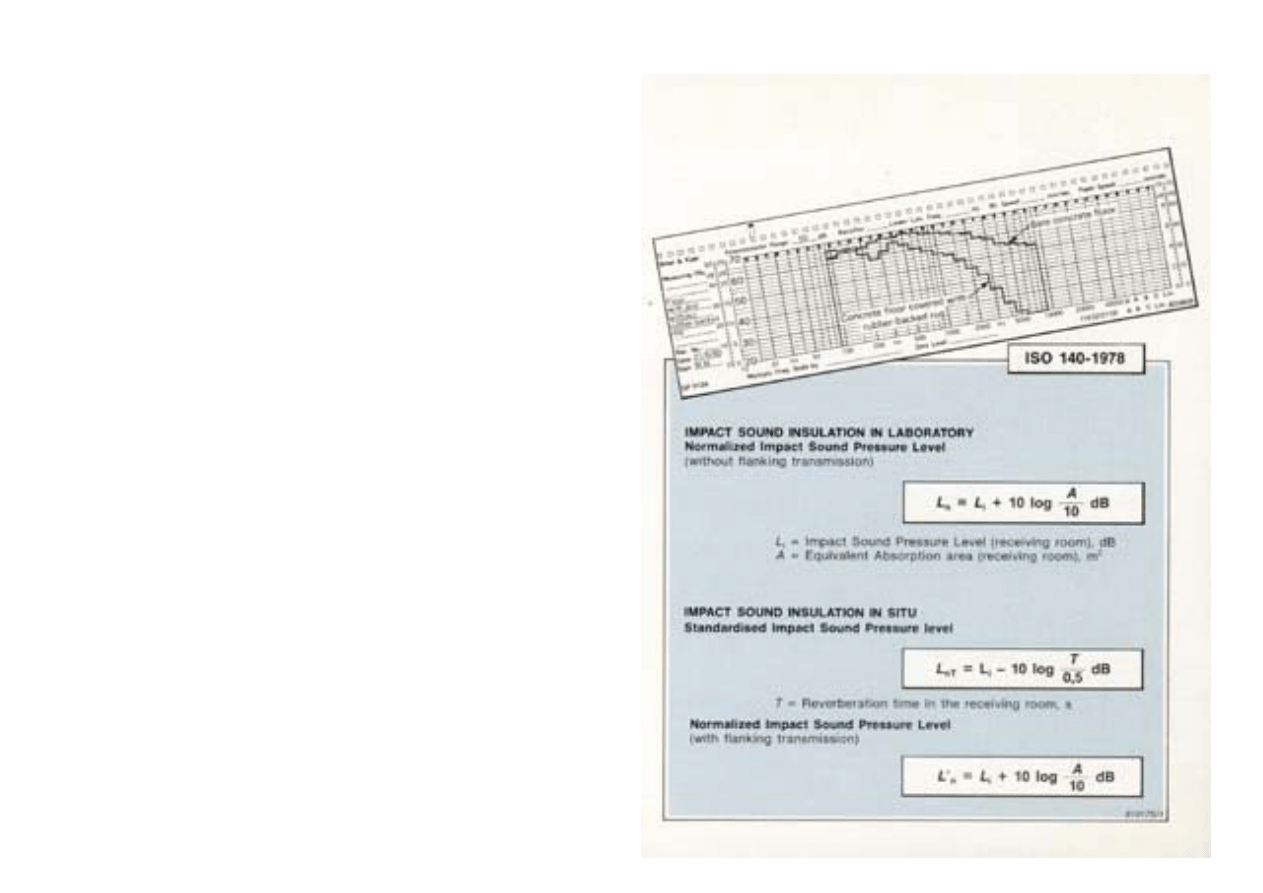
Impact Sound Insulation
Impact Sound
Footsteps on floors or stairs can often be heard more
clearly in other rooms than in the room where they are pro-
duced. The reason is that the building structure is set into
vibration and these vibrations can be transmitted to other
parts of the building almost without damping. An effective
way of reducing impact noise is to attenuate the impact of
the footsteps before it reaches the structure of the building
by, for example, using a floating floor or laying a suitable
carpet or other resilient layer on the floor.
Parameter Measured
The Impact Sound Insulation is determined from the Impact
Sound Level measured in the receiving room when the
source room is excited by a standard impact source. As for
Airborne Sound Insulation a distinction is made between
laboratory measurements and field measurements and a
correction factor involving the absorption in the receiving
room has to be included in the calculation of the Impact
Sound Level.
The Normalized Impact Sound Pressure Level, L
n
(or L'
n
if
flanking transmission is included), calls in the absorption in
the receiving room, A (calculated from the volume, V, and
reverberation time, T, in the receiving room by using Sa-
bine's equation), while in the Standardized Impact Sound
Pressure Level, L
nT
, the reverberation time in the receiving
room, T, is referred to a standard reverberation time of
0,5s.
30
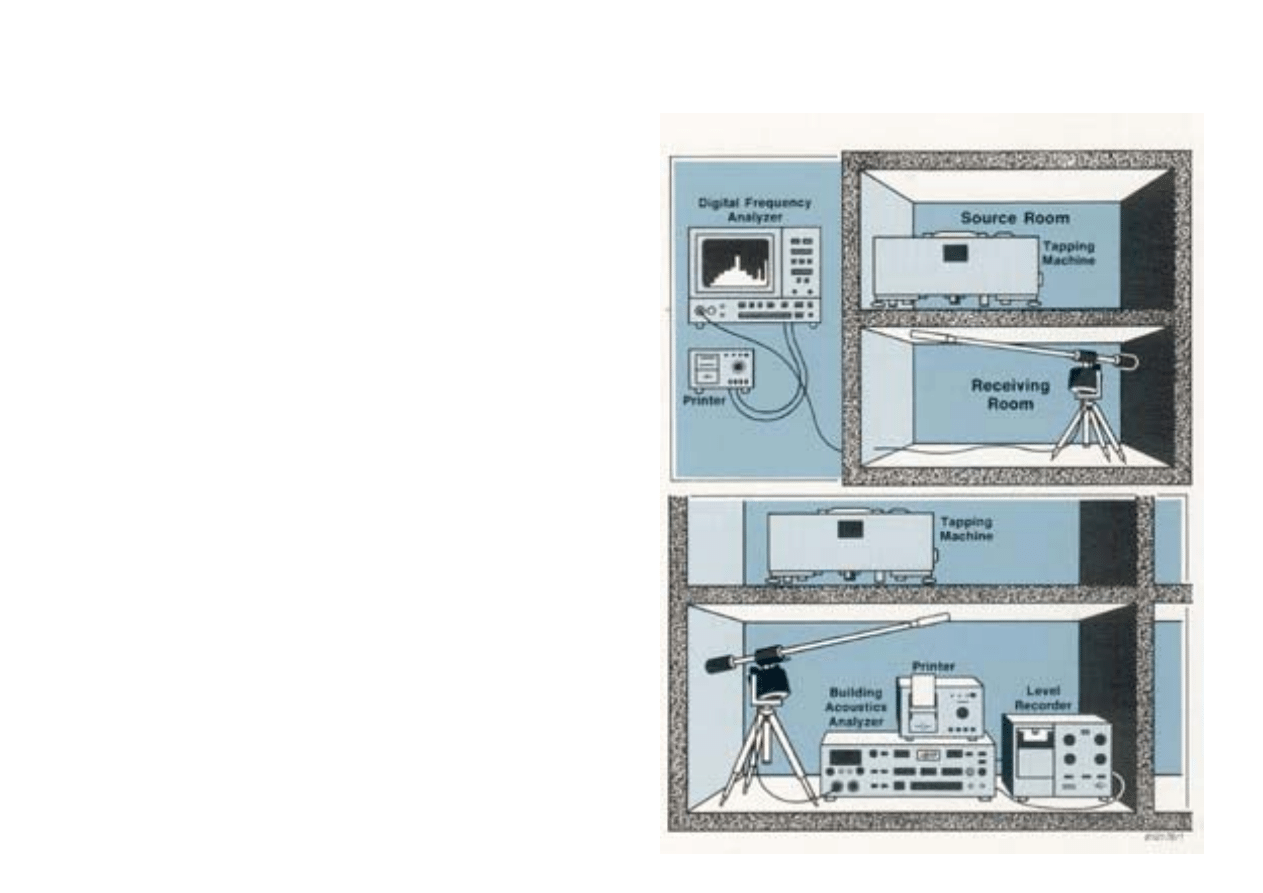
Measuring Impact Sound Insulation
The Sound-Source
Footstep noise is simulated by a standard tapping machine
containing five hammers of 0,5kg each with a free fall of
4cm producing 10 impacts per second. The effect on the
floor is much stronger than the effect of normal footsteps,
but this is necessary to obtain a suitably high sound pres-
sure level in the receiving room. Standards specify that
measurements should be carried out with several positions
of the tapping machine in the source room.
The Receiving Section
Measurements in buildings assume that the sound-field is
diffuse, but this is not generally the case. In practice, the
sound pressure levels in the receiving room have to be av-
eraged by measuring at several microphone positions or by
using a microphone at the end of a slowly rotating boom.
The received signal is filtered in octave or 1/3 octave bands.
Results obtained with an 1/1 octave filter are 5dB higher
than with a 1/3 octave filter (10 log 3 = 5). The filter type
should therefore always be specified on the measured
curve.
On a real-time analyzer the averaging is performed auto-
matically. Any change in the spectrum when various resil-
ient layers are being tested, for example, can be seen im-
mediately. A Building Acoustics Analyzer will also perform
the averaging automatically and furthermore display directly
the Standardized and the Normalized Impact Sound Levels.
31
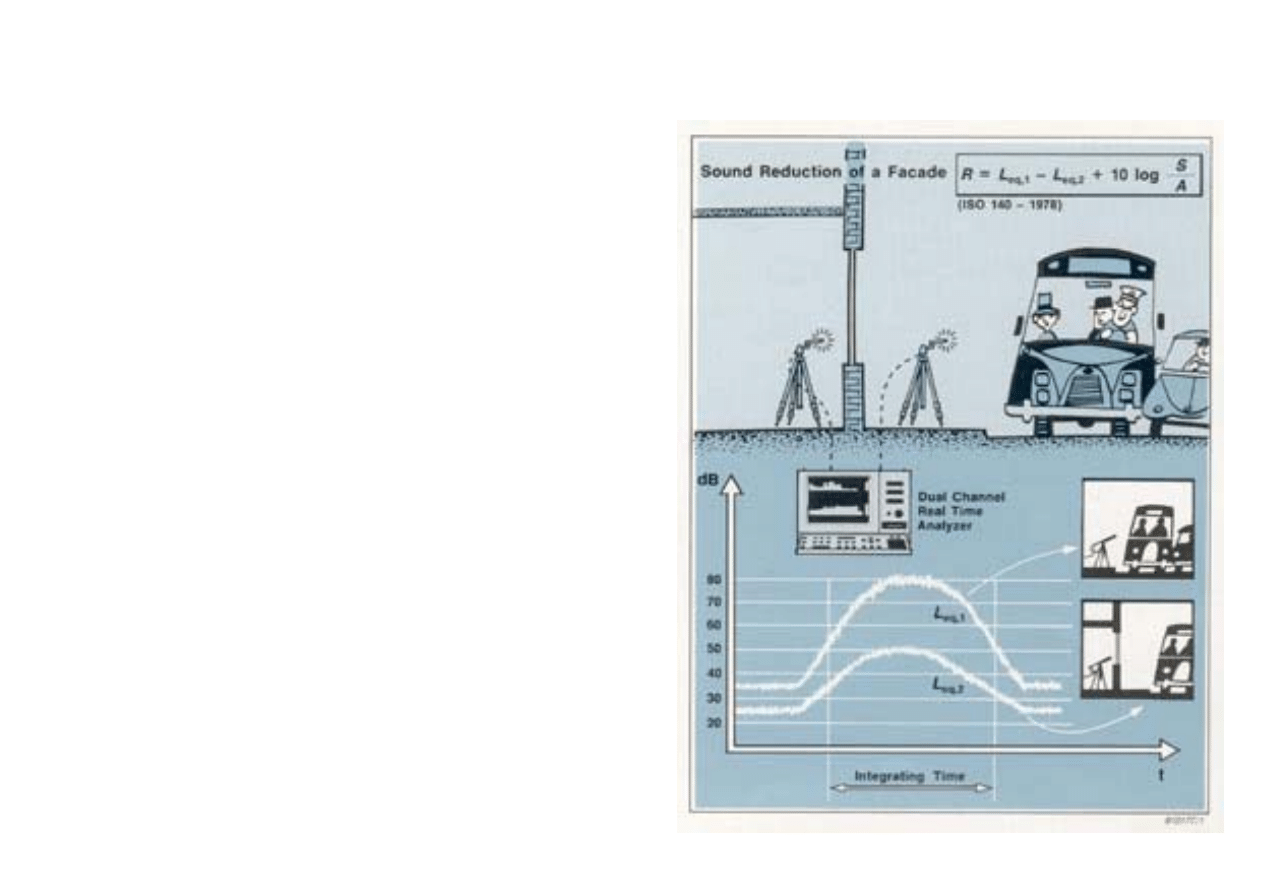
Outdoor - Indoor Noise Insulation
Sound Insulation of a Facade by Using Traffic Noise
Measuring the insulation afforded by a building against ex-
ternal noise must be viewed in a different light from the
insulation between different parts of a building. In the latter,
the sound-field is assumed to be diffuse and steady during
measurements, while in the former the external sound-field
is almost never diffuse or steady. The noise may arrive
from various angles of incidence and often varies greatly in
amplitude, e.g. traffic noise. The insulation of a facade is
more a question of determining the noise level inside a
building from the knowledge of the noise environment out-
side rather than of calculating an absolute figure from the
knowledge of the reduction index of the different facade
elements. The sound insulation of a facade is therefore ex-
pressed by the difference between the equivalent continu-
ous levels in front of the facade and in the receiving room,
both being measured over the same length of time. The
equivalent continuous level, or L
eq
, is the sound pressure
level averaged for a relatively long measuring period on the
basis of the energy. That is to say that the L
eq
value has the
same energy content as the measured sound of varying
level.
32
Sound Insulation of a Facade by Using
Loudspeaker Noise
In the absence of traffic noise or when the insulation of a
facade or a facade element has to be investigated as func-
tion of the angle of incidence, a loudspeaker may be used
as a sound-source. The loudspeaker emits a random noise
filtered in 1/3 octave bands and the Sound Reduction Index,
R
θ
is calculated for each frequency band from the differ-
ence between the sound pressure levels with and without
the test specimen. The measurements may be repeated for
each value of the angle of incidence,
θ, of interest.
Insulation between Offices —
Influence of Background Noise
The background noise has a great influence on the require-
ments to the efficacy of partitions between offices. Back-
ground noise, either from external traffic or from typewrit-
ers in an office, masks the noise coming through the
partitions and the insulation required is less than in the
presence of a lower background noise.
33
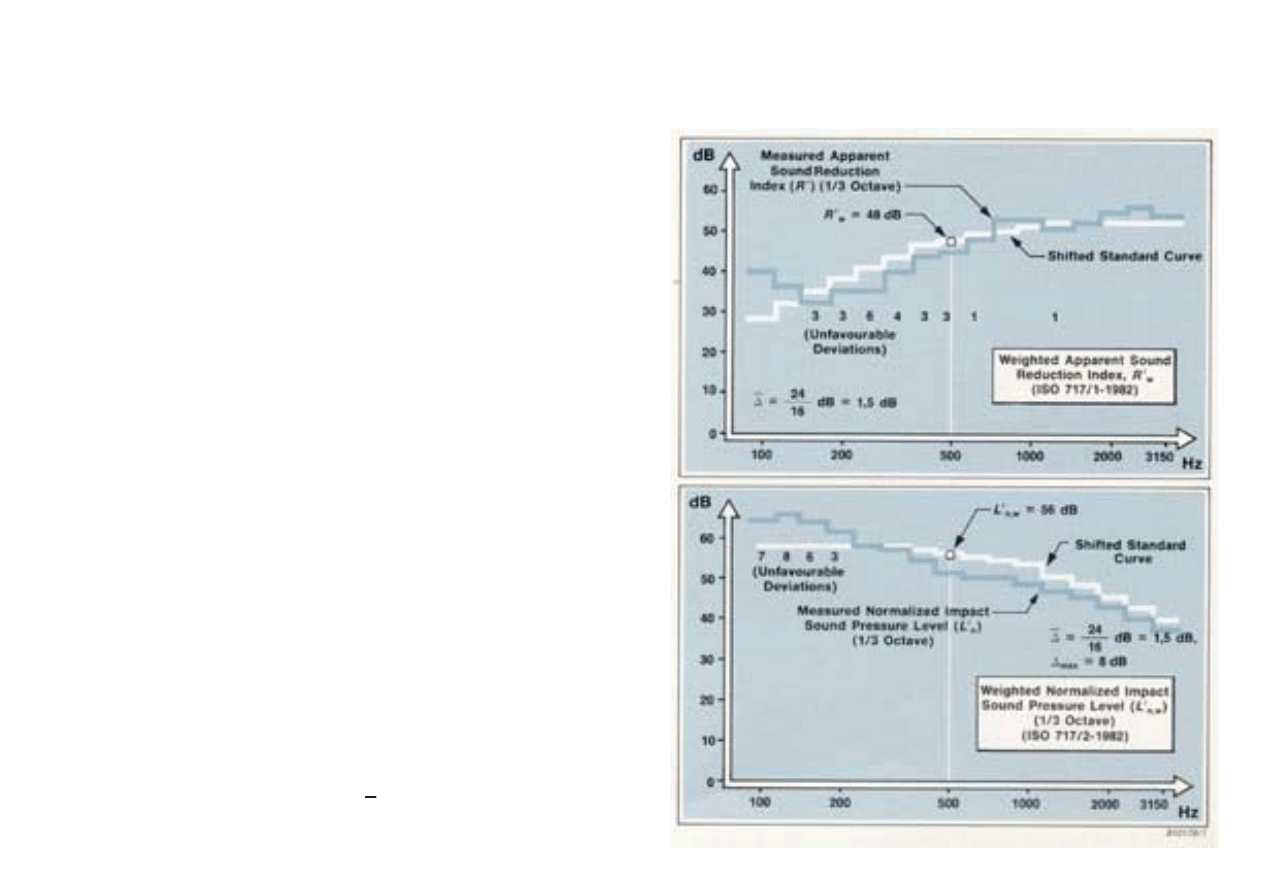
Comparing Results with Requirements
Since the sound insulation is a function of frequency, most
regulations specifying the sound insulation between dwell-
ings require an evaluation of the measurement results by
comparison to reference curves covering the frequency
range from 100 to 3150 Hz.
Single Figure Indices
ISO 717-1982 describes a method for obtaining single fig-
ure indices from the airborne and impact sound insulation
curves measured according to ISO 140.
Weighted Apparent Sound Reduction Index,
R'
w
The airborne sound insulation is characterized by an single
number, R'
w
, which is found by shifting in steps of 1 dB the
reference curve towards the measured curve until the con-
ditions* specified in the ISO standard are satisfied. The
weighted apparent sound reduction index, R'
w
is defined
as the value of the shifted reference curve at 500 Hz.
Weighted Normalized Impact Sound Pressure Level, L’
n,w
L'
n
.w is found in a similar way by shifting the reference
curve towards the measured curve and is the value at
500 Hz of the shifted reference curve.
If a Building Acoustics Analyzer is used to measure the
sound insulation curves, the indices R'
w
and L'
n,w
can be
calculated and displayed directly.
* The mean unfavourable deviation,
∆, should be as large as possible but
not greater than 2 dB. The max. unfavourable deviation,
∆
max
, must be
recorded if it exceeds 8 dB at any frequency.
34
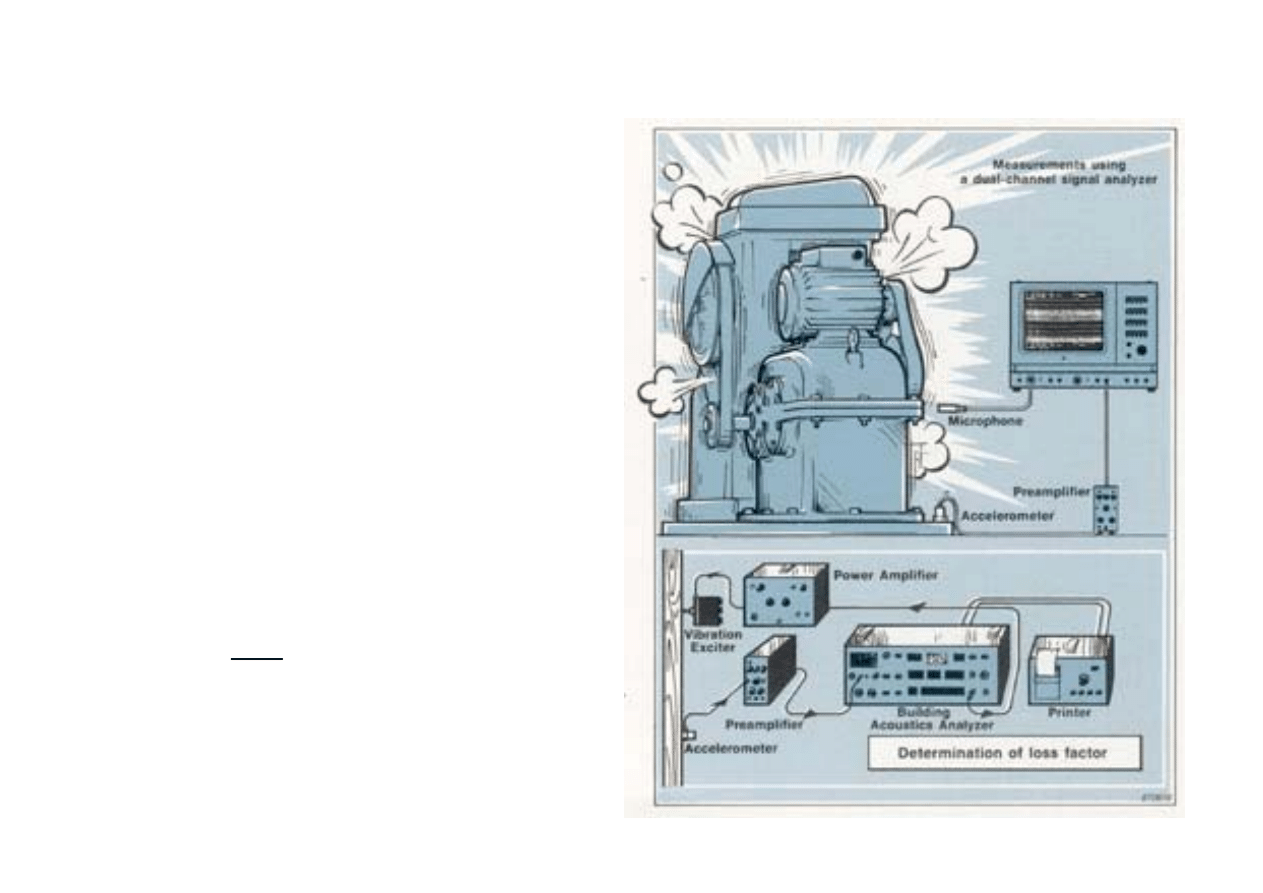
Vibration Measurements
Many installations in a modern building, for example lifts
and washing machines, produce both noise and vibration.
Noise measurements must therefore be complemented by
vibration measurements.
Vibration Isolation Measurements
These are carried out by using small mechanical transduc-
ers called accelerometers, which are attached to the vibrat-
ing structure. The accelerometer is connected to a pream-
plifier which may contain networks allowing the
measurement of vibration velocity and displacement to be
measured as well as acceleration. The output signal is ana-
lyzed by the same type of instrumentation as used for
sound measurements. A frequency analysis of the vibration
signal is often needed for determining the most appropriate
means of damping the troublesome vibrations.
Measuring the Loss Factor of a Partition
The Loss Factor, 77, is determined from the mechanical re-
verberation time of a partition which is excited by a shaker
driven by white noise in 1/3 octave bands. When the parti-
tion has reached a steady level of vibration, the shaker is
abruptly stopped. The reverberation time for each 1/3 oc-
tave band is determined from the decay curves recorded by
an accelerometer, and the Loss Factor,
η, calculated from:
2,2
η =
fT
where f is the centre frequency of the 1/3 octave band and T
the corresponding reverberation time.
35

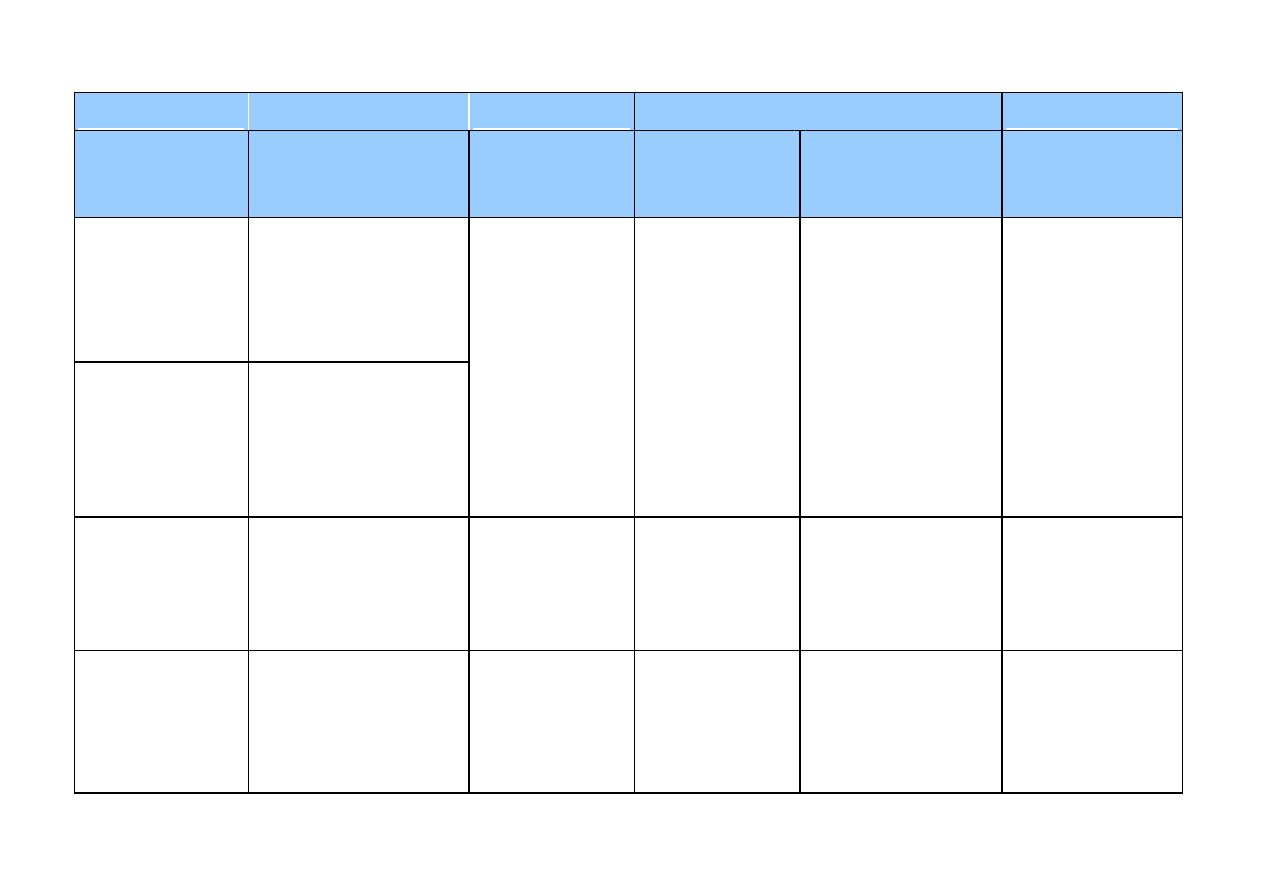
Survey of Building Acoustic Measurements (ISO)
Measurement
Parameter to be determined
International
Standard/
Recommendation
Test Environment
Reverberation time
in auditoria
Reverberation time
ISO 3382-1975
Empty auditorium
Studio- and occupied-
state auditorium
Absorption coefficient
Absorption
0,16 V ( 1 1 )
coefficient
α = —--— —- - —
of a specimen
S ( T
s
T
e
)
ISO 354-1985
Reverberation room
Airborne sound
insulation of
building elements
Sound Reduction Index, R
R = L
1
- L
2
+ 10 log S
A
ISO 140/111-1978
Laboratory suite
(specified in ISO 140/1)
36
Source Room
Receiving Room
Sound/
Vibration
Source
Character of Noise
Measurements
Measurements
Conditions of
measurements
Observations
Non-directional
loudspeakers or
pistol if T > 1,5s
below 1 kHz
Wide-band noise in
oct. or 1/3 oct. bands or
pistol shots. At least
40 dB above back-
ground level in all freq.
bands
Non-directional
loudspeakers or
pistol or orche-
stra (woodwind
and brass instr.
only)
As above
or
pink noise (40 dB
above background
level)
Rev. decays in
1/3 oct. or oct.
(125Hz-4kHz)
At least 3 micro.
positions with
2 records for
each position
(4 records for
pistol shots and
6 records for
music breaks)
—
—
Non-directional
loudspeakers
Cont. freq. spectrum
band-limited noise
with a bandwidth of
at least 1/3 octave
Rev. times at
centre freq.
of 1/3 octave
band series
100 Hz - 5 kHz
—
—
Loudspeaker
Steady, broad-band,
may be filtered in
1/3 oct. bands
Sound Pressure
Level 1/3 oct.
(100Hz - 3,15kHz)
several positions
Sound Pressure
Level
Rev. time
1/3 oct.
(100 Hz-3,15 kHz)
several positions
or moving
microphone
Calculation of
Weighted
Sound
Reduction
Index: R
w
(ISO 717/1-1982)
37
Survey of Building Acoustic Measurements (ISO) — (Cont.)
Measurement
Parameter to be determined
International
Standard/
Recom mendation
Test Environment
Airborne sound
insulation between
rooms
Standardized Level Difference
D
nT
= L
1
– L
2
+10 log
T
0,5
or Apparent Sound Reduction Index, R'
R' = L
1
– L
2
+ 10 log S
A
ISO 140/IV-1978
Field measurements
in buildings
Standardized Level Difference
D
nT
= Leq,
1
- Leq,
2
+ 10 log T
0,5
Sound Reduction Index
R
tr
= L
eq,1
– L
eq, 2
+ 10 log
S
A
Airborne sound
insulation of facade
elements and facades
Sound Reduction Index
R
θ
= L
1”
– L
2
+ 10 log 4 S cos θ
A
ISO 140/V-1978
Field measurements
38

Source Room
Receiving Room
Sound/
Vibration
Source
Character of Noise
Measurements
Measurements
Conditions of
measurements
Observations
Loudspeaker
Steady, broad-band,
may be filtered in
1/3 oct. bands
Sound Pressure
Level
oct. or
1/3 oct.
(100Hz-
3,15kHz)
several
positions
Sound Pressure
Level.
Background
level.
Rev. time
Oct.
(125 Hz-2 kHz) or
1/3 oct.
(100Hz - 3,15kHz)
several positions or
moving microphone
Evaluation of
Weighted
Apparent
Sound
Reduction
Index: R'
w
(ISO R 717/1
1982)
Traffic
noise
Fluctuating
L
eq,1
at 2 m
from the facade.
Oct. or 1/3 oct.
bands
L
eq,2
and
rev. time
Oct.
(125 Hz - 2 kHz) or
1/3 oct.
(100-3,15 kHz)
Several microphones
or several positions
L
eq,1
and L
eq,2
measured
simultaneously
Loudspeaker
incidence
angle
θ = 45°
Steady, broad-band,
may be filtered in
1/3 oct. bands
Sound Pressure
Level oct. or
1/3 oct.
Sound Pressure
Level.
Background
level
Rev. time
Oct.
(125 Hz - 2 kHz) or
1/3 oct.
(100 Hz-3,15 kHz)
several positions or
moving microphone
39
Survey of Building Acoustic Measurements (ISO) — (Cont.)
Measurement
Parameter to be determined
International
Standard/
Recommendation
Test Environment
Impact sound
insulation of floors
Normalized Impact Sound Pressure Level
L
n
= L
i
+ 10 log
A
2
10
ISO 140/VI-1978
Laboratory suite
(specified in ISO 140/1)
Impact sound
insulation of floors
Norm. Impact Sound Pressure Level
L´
n
= L
i
+ 10 log
A
2
10
Standard. Impact Sound Pressure Level
L
nT
= Li – 10 log
T
2
0,5
ISO 140/VII-1978
Field measurements
40

Source Room
Receiving Room
Sound/
Vibration
Source
Character of Noise
Measurements
Measurements
Conditions of
measurements
Observations
Standard
Tapping
Machine
Repetitive impacts in
at least 4 positions
—
Sound Pressure
Level.
Background
level.
Rev. time
Oct.
(125 Hz - 2 kHz) or
1/3 oct.
(100 Hz-3,15 kHz)
several positions or
moving microphone
The use of
oct. or 1/3 oct.
shall be
recorded.
Evaluation of
Weighted
Normalized
Impact Sound
Pressure
Level: L
n,w
(ISO 717/2
1982)
Standard
Tapping
Machine
Repetitive impacts in
at least 4 positions
—
Sound Pressure
Level.
Background
level.
Rev. time
Oct.
(125 Hz - 2 kHz) or
1/3 oct.
(100 Hz-3,15 kHz)
several positions or
moving microphone
As above.
Evaluation of
Weighted
Normalized
Impact Sound
Pressure
Level: L´
n,w
(ISO 717/2
1982)
41
Survey of Building Acoustic Measurements (ISO) — (Cont.)
Measurement
Parameter to be determined
International
Standard/
Recommendation
Test Environment
Reduction of impact
noise by floor covering
on standard floor
Reduction of Impact Sound Pressure Level
∆ L = L
n,0
- L
n
L
n,0
= Norm. Impact Sound Pressure
Level in the absence of
floor covering
ISO 140/VIII
Laboratory suite
(specified in ISO 140/1)
Radiated power, W
k
, from a flanking
element k, area S
k
W
k
=
ρ c S
k
V
k
2
σ
k
V
k
= normal surface velocity
Airborne Sound
ISO 140/111 Annex A
ISO 140/1 V AnnexB
Average Sound Pressure Level, L
k
,
due to a flanking element k
4 S
k
L
k
= L
vk
+ 10 log
A
L
vk
= average surface velocity
Impact Sound
ISO 140/VI AnnexB
ISO 140/VII Annexe
Laboratory and field
measurements
Flanking transmission
Loss Factor
of a partition
Total loss factor
2,2
η
total
=
f T
f = 1/3 oct. centre frequency
T= mechanical rev. time of the partition
ISO 140/111 Annexe
ISO 140/IV Annexe
Laboratory and field
measurements
42

Source Room
Receiving Room
Sound/
Vibration
Source
Character of Noise
Measurements
Measurements
Conditions of
measurements
Observations
Standard
Tapping
Machine
Repetitive impacts in
at least 3 positions on
bare floor and covered
floor
—
Sound Pressure
Level.
Background
level.
Rev. time
Oct.
(125 Hz - 2 kHz) or
1/3 oct.
(100 Hz-3,15 kHz)
several positions or
moving microphone
The bandwidth
used for
measurements
shall be stated
in every graph
or table
Loudspeaker or
Reference
Sound Source
Steady,broad-band
Incident sound
power, Wi
oct. or 1/3 oct.
Normal surface
velocity
Standard
Tapping
Machine
Repetitive impacts
—
As above
Rev. Time
Oct. or 1/3 oct.
several positions
on each flanking
element
Vibration
Exciter
Steady vibration level
White noise generator
in 1/3 oct. bands
Vibration decay
measured in
1/3 oct.
(100Hz - 3,15kHz)
—
—
43

Further Reading
J. ANDERSON & T. JACOBSEN.
"RASTI Measurements in St. Paul's Cathedral, London."
Brüel & Kjær Application Note BO 0116 -11.
BRÜEL& KJÆR PUBLICATIONS
"Sound Intensity" Brüel&Kjær Booklet BR 0476-11.
"Reverberation Time — fast and accurate calculations
with a sound level meter." Brüel&Kjær Application Note
BO 0228-11.
T. R. HORRALL & T. JACOBSEN.
"RASTI Measurements: Demonstration of different ap-
plications." Brüel&Kjær Application Note BO 0123-11.
T. Q. NIELSEN.
"A Powerful Combination for Building Acoustics Mea-
surements." Brüel&Kjær Application Note BO 0113-11.
"Intensity Measurements in Building Acoustics."
Brüel&Kjær Application Note BO 0147-11.
We hope this booklet has answered many of your questions and
will continue to serve as a handy reference guide. If you have other
questions about measurement techniques or instrumentation,
please contact one of our local representatives, or write directly to:
Brüel & Kjær
DK-2850 Nærum
Denmark
44
Document Outline
- Front cover
- Table of contents
- Introduction
- Behaviour of Sound in a Room
- Build-up and Decay of Sound in a Room
- Sabine's Formula for Reverberation Time
- Measuring the Reverberation Time
- Measuring the Sound Absorption
- Measuring the Sound Distribution
- Speech Intelligibility
- How is Speech Intelligibility Quantified?
- Rapid Speech Transmission Index (RASTI)
- Real-Time Analysis in Room Acoustics
- Acoustics of Buildings: What Should be Measured?
- Sound Reduction Index of a Wall
- What is the Coincidence Effect?
- Laboratory and Field Measurements
- Airborne Sound Insulation
- Measuring Airborne Sound Insulation
- Impact Sound Insulation
- Measuring Impact Sound Insulation
- Outdoor - Indoor Noise Insulation
- Insulation between Offices — Influence of Background Noise
- Comparing Results with Requirements
- Vibration Measurements
- Survey of Building Acoustic Measurements (ISO)
- Further Reading
- Back cover
Wyszukiwarka
Podobne podstrony:
Angelo Farina Acoustic Measurements In Opera Houses Comparsion
Summers Measurement of audience seat absorption for use in geometrical acoustics software
New possibilities in room acoustics measuring
LOGO! in Building Automation
Steps in Building a Shed
bruel kjaer
LOGO! in Building Automation
IMPORTANCE OF EARLY ENERGY IN ROOM ACOUSTICS
Force Measurements In A Scanning Force Microscope With Piezoresistive Sensors
Rindel MODELLING IN AUDITORIUM ACOUSTICS Sevilla 2002 Rindel 8p
A translation course in building vocabulary
bruel kjaer
Griesinger D Spaciousness and envelopment in musical acoustics
Lokki T , Gron M , Savioja L , Takala T A Case Study of Auditory Navigation in Virtual Acoustic Env
Claus Lynge Christensen Modelling Large Sound Sources in a Room Acoustical
Bradley Using ISO 3382 measures, and their extensions, to evaluate acoustical conditions in concert
AJA Results of the NPL Study into Comparative Room Acoustic Measurement Techniques Part 1, Reverber
Ouellette J Science and Art Converge in Concert Hall Acoustics
więcej podobnych podstron