143
FAR-INFRARED ENERGY DISTRIBUTIONS OF ACTIVE GALAXIES IN THE LOCAL
UNIVERSE AND BEYOND: FROM ISO TO HSO
Luigi Spinoglio
1
, Paola Andreani
2
, and Matthew A. Malkan
3
1
IFSI-CNR, Via Fosso del Cavaliere 100, I-00133 Roma, Italy
2
Osservatorio Astronomico di Padova, Vicolo dell’Osservatorio, Padova, Italy
3
UCLA Division of Astronomy & Astrophysics, Los Angeles, CA 90095-1562, USA
Abstract
New results of the ISO photometric survey of the 12
micron active galaxy sample are presented. We address
issues on the far-infrared turnover and on the different
overall shape of starburst and Seyfert type 1 and type 2
galaxies. These two latter types of active galaxies have far-
IR energy distributions that can be indeed explained by
different inclinations of an hypothetical obscuring torus.
The energy distributions of active and starburst galax-
ies in the Local Universe as measured by IRAS and ISO are
then used to make predictions on what HSO will be able
to achieve at significant redshifts. We have used the ISO
photometric observations of active and starburst galaxies
of the 12 micron galaxy sample to define average energy
distributions of Seyfert type 1 and type 2, starburst and
normal galaxies. Assuming different galaxy evolution laws,
the derived energy distributions at various redshifts are
then compared with the detection limits of the HSO cam-
era arrays of PACS and SPIRE. Finally, from the mid-IR
luminosity function of the Local Universe, we estimate the
number of galaxies that HSO deep surveys will be able to
detect.
Key words: Galaxies: evolution; active; starburst – Mis-
sions: ISO; HSO
1. Introduction
The 12
µm galaxy sample (Spinoglio & Malkan 1989; Rush,
Malkan & Spinoglio 1993) was selected to provide a com-
plete and largely unbiased sample of local galaxies, not
suffering the strong selection effects of optical-UV and far-
IR surveys. The selection was done at 12
µm because it was
found that this band contains a constant fraction of bolo-
metric flux for both active galaxies (
∼ 1/5) and normal
galaxies (
∼ 1/14). It follows that 12µm selection is equiv-
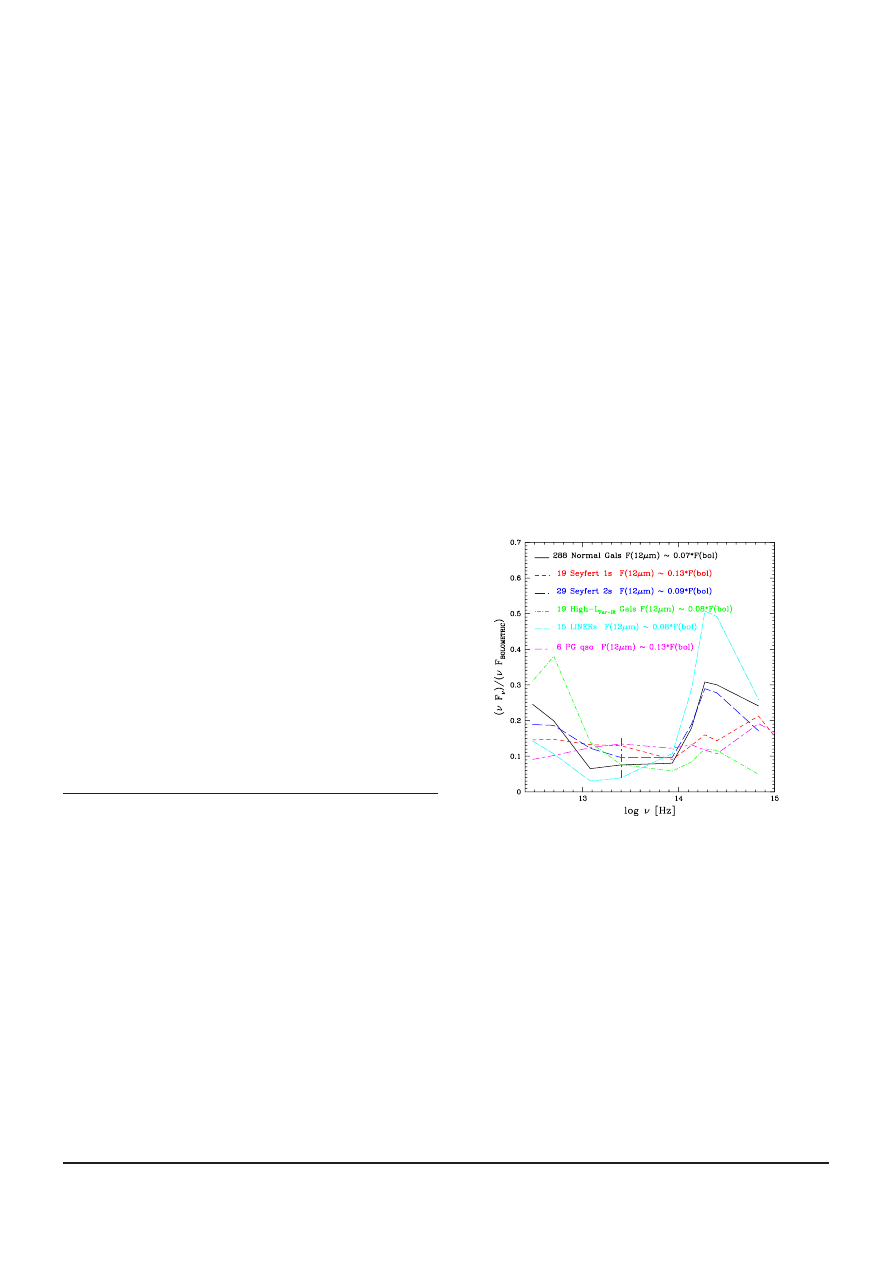
alent to select at a bolometric flux limit. In Figure 1 we
show the energy distributions normalized to the bolomet-
ric flux for each galaxy class (Spinoglio et al. 1995).
We report here few of the results of ISOPHOT (Lemke
et al. 1996) 120-150-170-180-200
µm photometry on 39 ga-
laxies, together with archive data on other 19 and lit-
erature data on 32 galaxies all belonging to the 12
µm
galaxy sample. The sample discussed here of 90 galaxies
(29 Seyfert 1’s, 35 Seyfert 2’s, 12 high luminosity non-
Seyfert’s and 14 normal galaxies) is presently the largest
sample of active galaxies in the Local Universe for which
are available photometric data up to the wavelength of
200
µm. The details of this study will be reported in a
forthcoming article (Spinoglio, Andreani & Malkan 2000).
Based on ISO and IRAS results on these local galaxies,
we make predictions on what luminosities and distances
the HSO photometric arrays will be able to reach in a near
future to study galaxy evolution.
[Spinoglio et al.1995, ApJ 453,616]
Figure 1. Energy distributions of galaxies of the 12µm sample
normalized to the bolometric flux for the various classes. For
each class the fraction of the bolometric flux contained in the
12 µm IRASband is indicated.
2. Few ISO Results
2.1. Far-IR turnover versus 60
µm excess
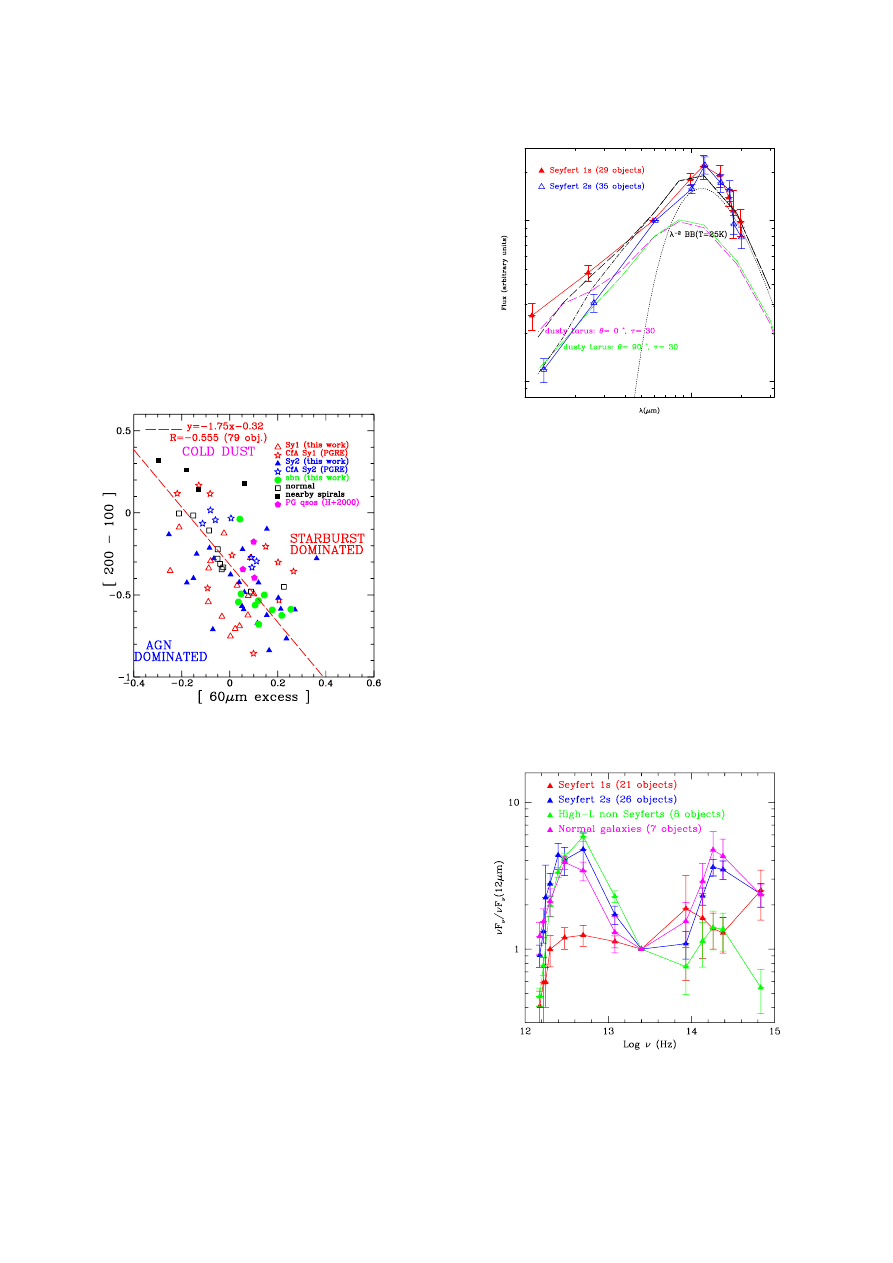
As shown in Figure 2, a correlation is found (P=92.5%) be-
tween the steepness of the far-IR turnover (measured from
the [200-100] color) and the 60
µm excess, which is an indi-
cator of recent enhanced star formation. High-luminosity
non-Seyfert galaxies (that mostly overlap with the opti-
cally classified starburst galaxies) are close to the ULIRGs
(e.g. Arp220, Mk231, Mk273) which have strong 60
µm ex-
Proc. Symposium ‘The Promise of the Herschel Space Observatory’ 12–15 December 2000, Toledo, Spain
ESA SP-460, July 2001, eds. G.L. Pilbratt, J. Cernicharo, A.M. Heras, T. Prusti, & R. Harris
144
Luigi Spinoglio et al.
cess and low [200-100] color, lying in the upper right part
of the diagram. On the contrary, most Seyfert galaxies not
belonging to the CfA sample (Huchra & Burg 1992) have
lower 60
µm excess than the average, lying on the lower left
part of the diagram, while only CfA Seyfert’s lie above the
correlation line, showing that they contain more galactic
light emission and less nuclear emission than the other
infrared selected Seyfert’s.
We suggest that the diagram of the far-IR turnover
versus the 60
µm excess defines a region that we call star-
burst dominated above the correlation line, and another
region AGN dominated below the line.
3C445
M-6-30-15
MK618
E12-G21
N3227
N3516
N4051
N4151
MK766
MK231
N5033
N5548
MK817
N7469
MK938=N34
N7130
N7172
E253-G3
N1320
N262=MK348
N4501
N4922
N6810
ARP220
MK273
IC5063
N1143/44
N3079
N3982
N4388
N5256
N5929
N1068
N7714=MK538
N134
N660
M51
M83
Figure 2. [200-100] color versus the 60µm excess for various
types of galaxies, including the CfA Seyfert galaxies (Perez
Garcia & Rodriguez Espinosa 2000) belonging to the 12µm
sample. For comparison are also included the PG quasars
(Haas et al. 2000).
2.2. Testing unified models of Seyfert 1’s and 2’s
Unified models claim that the observational differences be-
tween type 1 and type 2 Seyfert galaxies can be attributed
to the different orientation of an hypothetical dusty torus.
To qualitatively test this hypothesis, we have fitted in Fig-
ure 3 the average slope of the 12-200
µm far-IR spectral
energy distributions (SED) of Seyfert 1’s and Seyfert 2’s
with the sum of an optically thick dusty torus seen face
and edge on respectively, from the models by Granato &
Danese (1994) and grey-body thermal emission at 25K
with inverse square wavelength dependence of the dust
emissivity. The sum of the torus emission and the cold
dust thermal emission can roughly reproduce the observa-
tions.
10
100
0.1
1
Figure 3. Comparison between the average Seyfert 1’s (red tri-
angles) and 2’s (blue triangles) energy distributions. The green
line shows the edge on model (θ = 90
◦
, τ = 30); the pink line
the face on model θ = 0
◦
, τ = 30) from Granato & Danese
(1994); the dotted line grey-body emission at T=25K.
2.3. Energy distributions from 0.44 to 200
µm
In Figure 4, we show the SED of the different classes of
galaxies normalized to 12
µm. Seyfert 1’s have the flatter
SED, showing the larger power at 0.44 and 3.6
µm. Seyfert
2’s show two peaks: at 100
µm and 1.6µm. High luminosity
non-Seyfert’s show the brightest peaks at 100
µm and the
weakest one at 1.6
µm. Normal galaxies show again two
peaks: at 100
µm and 1.6µm.
Figure 4. Combined energy distributions of active and normal
galaxies of the 12µm sample from 4400˚
A to 200µm.
Far-Infrared Energy Distributions of Active Galaxies in the Local Universe and Beyond: From ISO to HSO
145
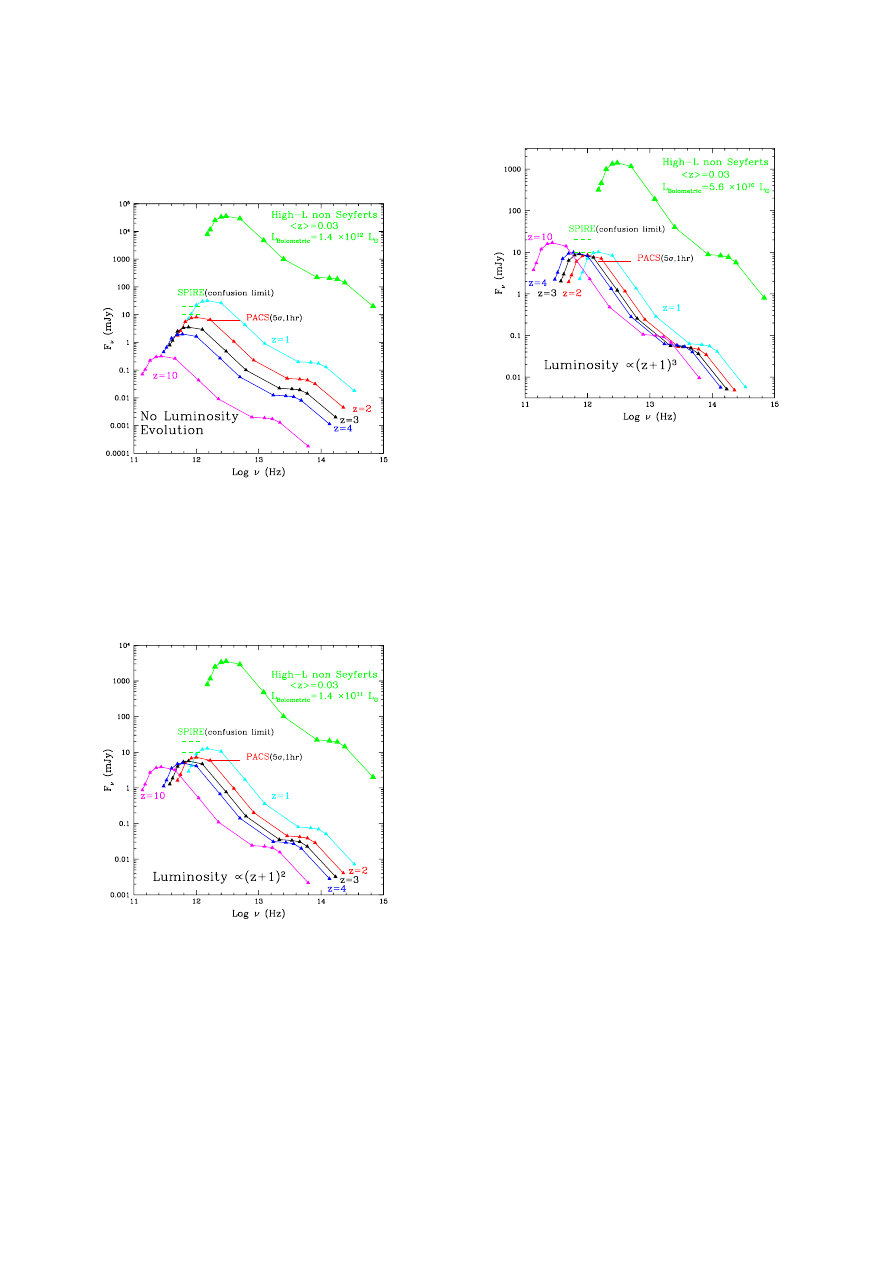
3. What luminosities will HSO detect?
Figure 5. Without luminosity evolution a galaxy of L = 1.4
×
10
12
L can be detected: by PACSin 1 hr at ∼ 50 σ at z=1 and
at
∼ 5σ at z=2; by SPIRE above the confusion limit (assumed
in the range 10
− 20mJy) only at z=1.
Figure 6. With the L(z)
∝ (z + 1)
2
evolution : a galaxy of
L = 1.4 × 10
11
L can be detected: by PACSin 1 hr at ∼ 10
σ at z=1 and at ∼ 5σ at z=2; by SPIRE above the confusion
limit only at z=1.
From the analysis of the local 12
µm galaxy sample we
have derived the following relations between bolometric
flux and 12
µm flux:
– Seyfert type 1:
F
12µm
∼ 0.13F
BOL
– Seyfert type 2:
F
12µm
∼ 0.09F
BOL
Figure 7. With the strong evolution L(z)
∝ (z + 1)
3
a galaxy of
L = 5.6 × 10
10
L can be detected: by PACSin 1 hr at ∼ 10σ
at any z; by SPIRE above the confusion limit at any z.
– High Luminosity non Seyfert’s :
F
12µm
∼ 0.08F
BOL
(starburst galaxies)
– Normal galaxies:
F
12µm
∼ 0.07F
BOL
If we want to focus on the non-AGN population of the
high-luminosity non-Seyfert’s (defined as having
L
F IR
>
1
.6×10
11
L) (corresponding to the starburst population)
and make predictions on their observability with HSO, we
can use the same relation:
L
BOL
∼ 4πD
2
(1/0.08)F
12µm
ν
12µm
× E(z)
where E(z) indicates the redshift dependence of the
assumed luminosity evolution. For different evolutionary
models we computed the luminosities that we can detect
with the photometer arrays of PACS and SPIRE on board
of HSO. Figure 5, 6 and 7 show the flux distribution that
an high luminosity non-Seyfert galaxy of a given luminos-
ity in the Local Universe would have at different redshifts,
assuming different luminosity evolution laws.
4. How many galaxies will HSO detect ?
Taking the Local Luminosity Function e.g. at 12
µm (Rush,
Malkan & Spinoglio 1993; Fang et al. 1998; Xu et al. 1998),
we can derive how many galaxies HSO will see at redshift
of 1 and 2, by adopting an evolutionary model. Following
the review by Franceschini (2000), ISO deep counts can be
interpreted as due to the combination of two source popu-
lations : a non-evolving and a strongly evolving one. Two
models are considered for the strong evolving population:
n[L(z), z] = n
o
(L
o
)
× (1 + z)
4.5
L(z) = L
o
× (1 + z)
2
(A)
n[L(z), z] = n
o
(L
o
)
× (1 + z)
6
L(z) = L
o
× (1 + z)
3
(B)
We report in Table 1 the space density of evolving
galaxies derived from the 12
µm luminosity function of

146
Fang et al. (1998), assuming that the evolving population
is 10% of the total, and the two evolution laws of models
A and B. Finally in Table 2, we give the differential num-
ber of galaxies per unit magnitude for the typical size of
a deep survey ( 1
◦
× 1
◦
) in a slice of ∆
z = 1.0 centered at
z=1 and z=2.
Table 1. Space density of galaxies φ [Mpc
−3
(mag)
−1
], assum-
ing that the evolving population is 10% of the total, compared
to the local luminosity function (LF) (Fang et al. 1998)
Luminosity
Local LF
z
Model A
Model B
(at z=0)
(L
)
10
10.2
6.3
× 10
−5
1.4
× 10
−4
4.0
× 10
−4
10
11
7.8
× 10
−7
1.8
× 10
−6
5.0
× 10
−6
10
12.2
1.3
× 10
−9
2.9
× 10
−9
8.3
× 10
−9
10
10.2
6.3
× 10
−5
8.8
× 10
−4
4.6
× 10
−3
10
11
7.8
× 10
−7
1.1
× 10
−5
5.7
× 10
−5
10
12.2
1.3
× 10
−9
1.8
× 10
−8
9.5
× 10
−8
Table 2. Differential Number of galaxies in 1
◦
× 1
◦
correspond-
ing to 600 PACSbeams (=112.5 SPIRE beams)
Area
z
Luminosity
Model A
Model B
(at z=0)
(L
)
1
◦
× 1
◦
1
10
10.2
301
860
10
11
3.9
10.7
10
12.2
6.2
× 10
−3
1.8
× 10
−2
1
◦
× 1
◦
2
10
10.2
1,927
10,074
10
11
24.1
124.8
10
12.2
3.9
× 10
−2
2.1
× 10
−1
5. Conclusions
The study of the local population of active and starburst
galaxies is a fundamental issue to understand the results
(from ISO, JCMT and COBE) at significant redshift.
In local galaxies, the steepness of the FAR-IR turnover
(measured by the [200-100] color) anti-correlates with the
60
µm excess, showing that a large content of cold dust
cannot survive during enhanced star formation.
In local galaxies the [200-100] color anti-correlates with
redshift and luminosity, showing that more luminous ob-
jects are warmer.
The HSO photometer arrays will be able to detect
galaxies as weak as
L = 0.5 − 1.4 × 10
11
L at z=1 and
z=2 if these galaxies are evolving in luminosity as
L ∝
(
z +1)
2
and at any redshift if there is the strong evolution
L ∝ (z + 1)
3
; if no evolution is present, still galaxies as
weak as
L = 1.4 × 10
12
L at z=1 can be detected.
Density evolution -if existent- will also greatly help in
the detection of distant galaxies.
Acknowledgements
The authors are grateful to the LWS Consortium and the
ISO Staff at VILSPA (Villafranca, Spain) for the work done
for building and operating, respectively, the Long Wavelength
Spectrometer (LWS) onboard ISO. This research was funded
in Italy by the Italian Space Agency (ASI).
References
Granato G.L., Danese L. 1994, MNRAS 268, 235
Fang F., Shupe D.L., Xu C., Hacking P.B. 1998 ApJ 500, 693
Fanti C. et al. 2000, A&A 358, 499
Franceschini, A. 2000, To appear in “Galaxies at High Red-
shift”, I. Perez-Fournon, M. Balcells, F. Moreno-Insertis
and F. Sanchez Eds., Cambridge University Press, astro-
ph/0009121
Haas, M., et al. 2000, A&A 354, 453
Huchra J. & Burg R. 1992, ApJ 393, 90
Lemke D. et al. 1996, A&A 315, L64
P´
erez Garc´ıa A.M. & Rodr´ıguez Espinosa J. M. 2000, astro-
ph/0003349
Rush B., Malkan M.A. & Spinoglio L. 1993, ApJSS 89,1
Spinoglio L. & Malkan M.A. 1989, ApJ 342, 83
Spinoglio L. et al. 1995, ApJ 453, 616.
Spinoglio L., Andreani, P. & Malkan M.A. 2000, in preparation.
van Bemmel I. M., Barthel P. D. de Graauw T. 2000, A&A
359, 523
Xu C. et al. 1998, ApJ 508, 576
Wyszukiwarka
Podobne podstrony:
Antigone Analysis of Greek Ideals in the Play
Low Temperature Differential Stirling Engines(Lots Of Good References In The End)Bushendorf
Formation of heartwood substances in the stemwood of Robinia
Illiad, The Role of Greek Gods in the Novel
A Critique of Socrates Guilt in the Apology
Hippolytus Role of Greek Gods in the Euripedes' Play
Byrd, emergence of village life in the near east
Prywes Mathematics Of Magic A Study In Probability, Statistics, Strategy And Game Theory Fixed
Catalogue of the Collection of Greek Coins In Gold, Silber, Electrum and Bronze
Chizzola GC analysis of essential oils in the rumen fluid after incubation of Thuja orientalis tw
The Grass Is Always Greener the Future of Legal Pot in the US
Erosion of Secular Spaces in the UK
FIDE Trainers Surveys 2013 07 02, Uwe Boensch The system of trainer education in the German Chess F
Chizzola GC analysis of essential oils in the rumen fluid after incubation of Thuja orientalis tw
The Mammoth in the Myths, Ethnography, and Archeology of Northern Eurasia
Nathan J Kelly The Politics of Income Inequality in the United States (2009)
Modanese Paradox of Virtual Dipoles in the Einstein Action (2000)
więcej podobnych podstron