
Biomaterials 23 (2002) 1723–1730
Structure and properties of Ti–7.5Mo–xFe alloys
D.J. Lin, J.H. Chern Lin*, C.P. Ju
Department of Materials Science and Engineering, National Cheng-Kung University, Tainan, Taiwan, ROC
Received 13 March 2001; accepted 22 June 2001
Abstract
The present work is a study of a series of Ti–7.5Mo–xFe alloys, with the focus on the effect of iron addition on the structure and
mechanical properties of the alloys. Experimental results indicate that a
00
phase-dominated binary Ti–7.5Mo alloy exhibited a fine,
acicular martensitic structure. When 1 wt% or more iron was added, the entire alloy became equi-axed b phase structure with a grain
size decreasing with increasing iron content. Athermal o phase was formed in the alloys containing iron of roughly between 0.5 and
3 wt%. The largest quantity of o phase and highest microhardness were found in Ti–7.5Mo–1Fe alloy. The binary Ti–7.5Mo alloy
had a lower microhardness, bending strength and modulus than all iron-containing alloys. The largest bending strength was found
in Ti–7.5Mo–2Fe alloy. The present alloys with iron contents of about 2–5 wt% seem to have a great potential for use as an implant
material. r 2002 Elsevier Science Ltd. All rights reserved.
Keywords:
Titanium–molybdenum–iron alloy; Structure; Mechanical properties
1. Introduction
Titanium and titanium alloys have been used in many
medical applications due to their excellent mechanical
performance and corrosion resistance. The relatively
low strength commercially pure titanium (c.p.Ti) is
currently used in dentistry [1–3], and the higher strength
Ti–6Al–4V alloy is used in a variety of stress-bearing
orthopedic applications [2,4,5]. There has been a
speculation that the release of Al and V ions from the
alloy might cause some long-term health problems [6–8].
More recently, a great deal of effort has been devoted
to the study of b and near-b phase alloys, such as Ti–
15Mo [9], Ti–13Nb–13Zr [10], Ti–11.5Mo–6Zr–2Fe [11],
Ti–Zr–Nb–Ta–Pd and Ti–Sn–Nb–Ta–Pd [12]. Advan-
tages of b/near-b titanium alloys over a; near-a or a þ b
alloys include their lower modulus and better form-
ability [13]. Weiss et al. [14] and Ankem et al. [15] have
shown that the b phase titanium alloys generally can be
processed to higher strength levels and exhibit better
notch properties and toughness than a þ b alloys. The
relatively low modulus of b titanium alloys may also
reduce the ‘‘stress-shielding’’ effect [16–21].
A binary Ti–7.5 wt% Mo alloy with an a
00
phase has
been developed recently in the present authors’ labora-
tory [22]. In the as-cast state, this Ti–7.5Mo alloy had a
bending strength similar to that of Ti–15Mo and Ti–
13Nb–13Zr with a bending modulus even lower than
both alloys. The present work is based on Ti–7.5Mo
system with a focus on the effect of iron addition on the
alloy structure and mechanical properties. The b-
eutectoid iron was selected due to its strengthening
potential [13] and possibly better biocompatibility
compared to other b-stabilizers such as Co, Cr, Ni, etc.
2. Experimental procedure
A series of Ti–7.5 wt% Mo–xFe alloys, with Fe
contents up to 7 wt%, as prepared from raw titanium
(99.5% in purity), molybdenum (99.9% in purity) and
iron (99.5% in purity) using a commercial arc-melting,
vacuum-pressure type casting system (Castmatic, Iwa-
tani Corp., Japan). The melting chamber was first
evacuated and purged with argon. An argon pressure of
1.5 kgf/cm
2
was maintained during melting. Appropriate
amounts of metals were melted in an U-shaped copper
hearth with a tungsten electrode. The ingots were re-
melted three times in order to improve chemical
*Corresponding author. Tel./fax: +886-6-2748086.
E-mail address:
chernlin@mail.ncku.edu.tw (J.H. Chern Lin).
0142-9612/02/$ -see front matter r 2002 Elsevier Science Ltd. All rights reserved.
PII: S 0 1 4 2 - 9 6 1 2 ( 0 1 ) 0 0 2 3 3 - 2
homogeneity. Prior to casting, the ingots were remelted
again in an open-based copper hearth under an argon
pressure of 1.5 kgf/cm
2
. The difference in pressure
between the two chambers allowed the molten alloys
to instantly drop into a graphite mold at room
temperature.
The cast alloys were sectioned using a Buehler Isomet
low speed diamond saw to obtain specimens for various
purposes. Surfaces of the alloys for a microstructural
study were mechanically polished via a standard
metallographic procedure to a final level of 0.3 mm
alumina powder, then etched in a Kroll’s reagent
comprising water, nitric acid, and hydrofluoric acid
(80 : 15 : 5 in volume). Microstructure of the etched
alloys was examined using an optical microscope (Leitz
Labrorlux 12 Pols, Leica Co., Germany). Transmission
electron microscopy (TEM) was performed using a
JEOL JEM-3010 system (Japan) operated at 200 kV.
Thin foils for TEM were prepared using a twin jet
polisher (Tenupol III, Sturers, Denmark) in an electro-
lyte comprising 30 ml per chloric acid (30%), 175 ml n-
butyl alcohol and 300 ml methanol at 401C with a
voltage of 12–15 V.
X-ray diffraction (XRD) for phase analysis was
conducted using a Rigaku diffractometer (Rigaku D-
max IIIV, Rigaku Co., Tokyo, Japan) operated at 30 kV
and 20 mA. An Ni-filtered CuK
a
radiation was used for
the study. A silicon standard was used for the
Fig. 1. XRDpatterns of Ti–7.5Mo and Ti–7.5Mo–xFe alloys.
Fig. 2. Lower scanning speed XRDpatterns of Ti–7.5Mo and Ti–
7.5Mo–xFe alloys.
D.J. Lin et al. / Biomaterials 23 (2002) 1723–1730
1724
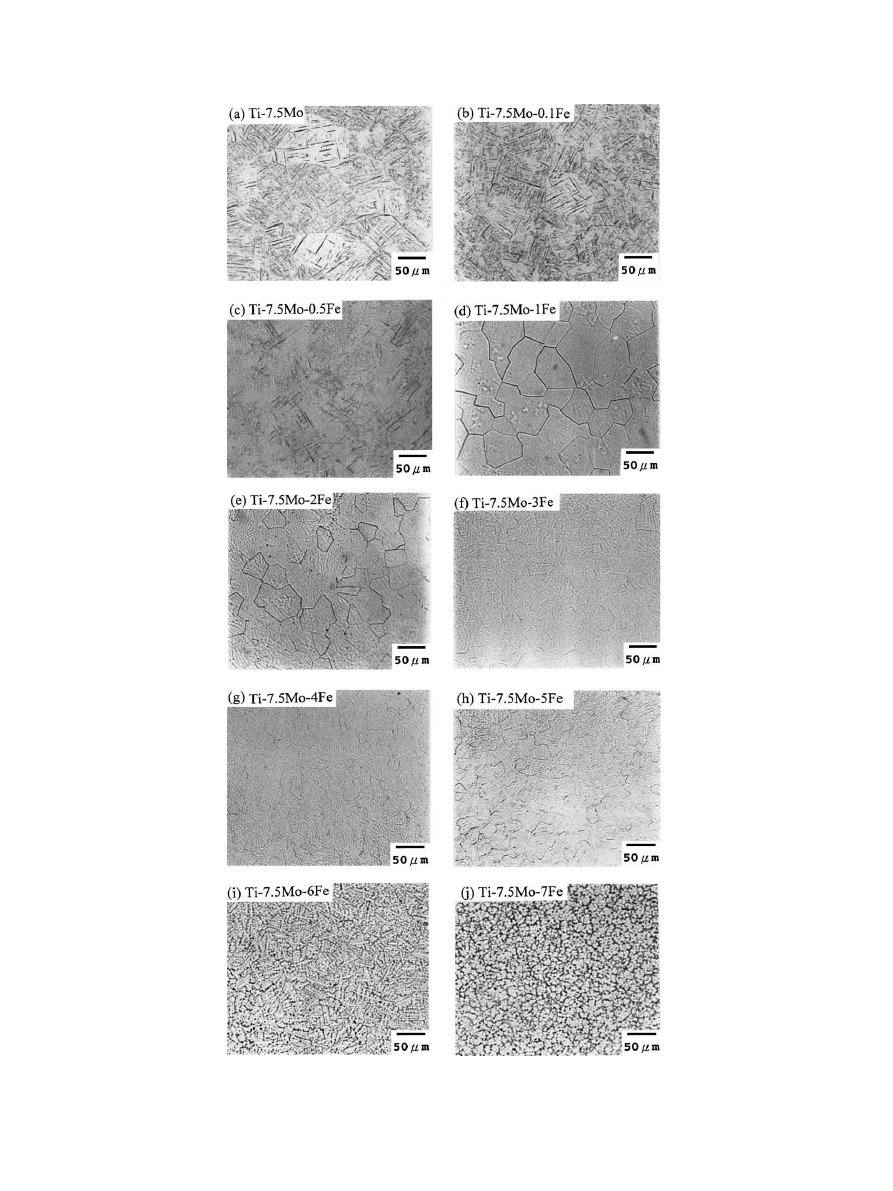
Fig. 3. Light micrographs of Ti–7.5Mo and Ti–7.5Mo–xFe alloys.
D.J. Lin et al. / Biomaterials 23 (2002) 1723–1730
1725

calibration of diffraction angles. Scanning speeds of 11/
min and 0.51/min were both used. The various phases
were identified by matching each characteristic peak in
the diffraction patterns with JCPDS files.
The microhardness of polished alloys was measured
using a Matsuzawa MXT70 microhardness tester at
200 g for 15 s. Average microhardness values were
obtained from at least 15 tests under each condition.
Three-point bending tests were performed using a desk-
top mechanical tester (Shimadzu AGS-500D, Tokyo,
Japan) operated at a crosshead speed of 0.5 mm/s.
Reduced size (36 5 1 mm) specimens were cut from
the castings and polished using sand paper to the #1000
level. The bending strengths were determined using
the equation, s ¼ 3PL=2bh
2
[23], where s is the
bending strength (MPa), P is the load (kg), L is the
span length (mm), b is the specimen width (mm), and
h
is the specimen thickness (mm). The modulus of
elasticity in bending was calculated from the load
increment and the corresponding deflection increment
between the two points on a straight line as far apart as
possible using the equation, E ¼ L
3
DP=4bh
3
Dd; where E
is the modulus of elasticity in bending (Pa), DP is the
load increment as measured from preload (N), and Dd is
the deflection increment at midspan as measured from
preload. The average bending strengths and moduli of
elasticity were taken from at least six tests under each
condition.
3. Results and discussion
3.1. X-ray diffraction
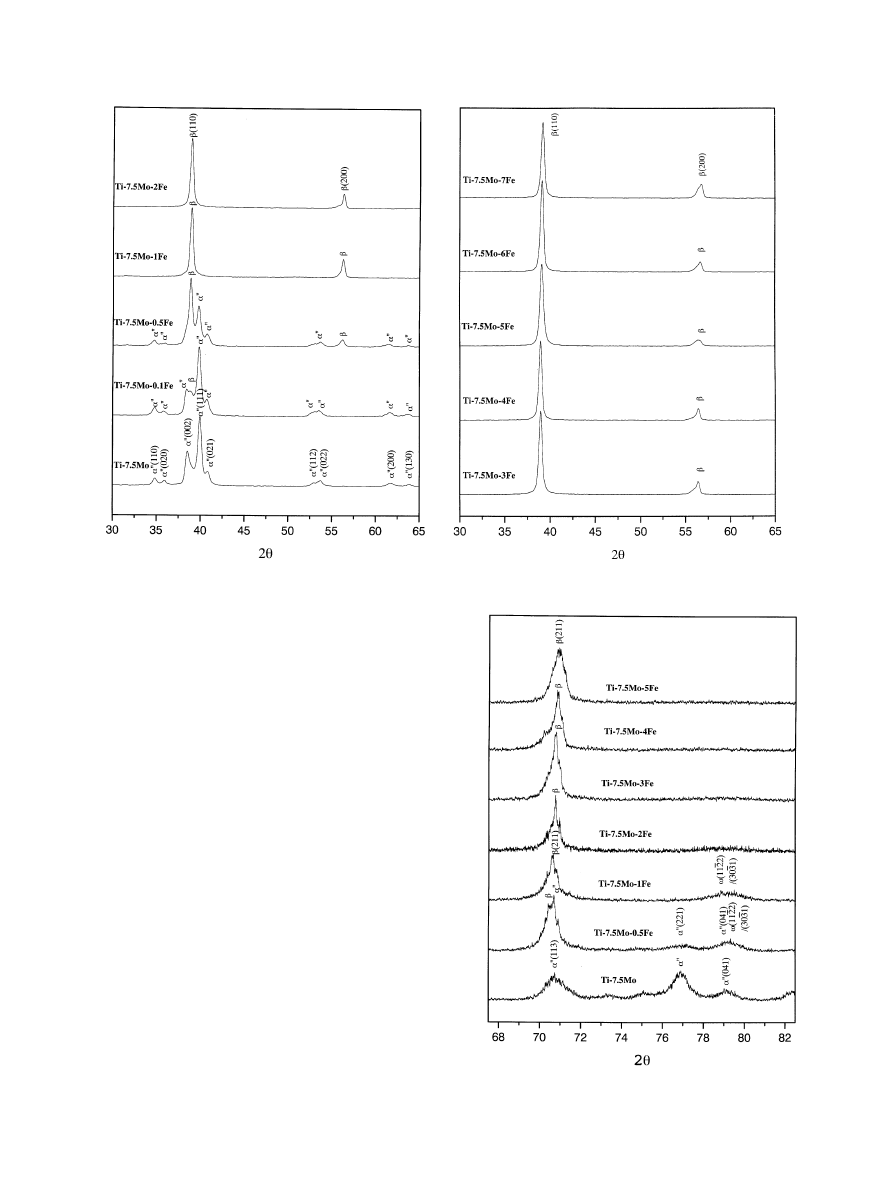
The XRDpatterns of Ti–7.5Mo as well as the series of
Ti–7.5Mo–x alloys are shown in Fig. 1. The binary Ti–
7.5Mo alloy was comprised primarily of metastable a
00
phase, consistent with an earlier report of Ho et al. [22].
This fast cooling-induced athermal orthorhombic struc-
ture was derived from a distorted hexagonal cell in
which the c-axis of the orthorhombic cell corresponds to
the c-axis of the hexagonal cell with a and b
corresponding to the orthogonal axis of the hexagonal
cell [24,25]. Athermal orthorhombic martensite, that can
precipitate on quenching without the assistance of
external stress, has also been reported in other Ti alloy
systems [26].
The effect of iron addition on phase/crystal structure
of the alloy was dramatic. As shown in Fig. 1, with as
little as 0.1 wt% of iron, a significant amount of b phase
was retained. At 1 wt%, the entire alloy became b phase
with a bcc crystal structure. As expected, TiFe
compound was not observed due to the low iron
contents in the alloys [27]. Iron has long been recognized
as a strong b-stabilizing element. In a recent study of a
series of cast binary Ti–Fe alloys, Lin et al. [27] found
that, when iron content was higher than about 5 wt%, b
phase was largely retained.
When the alloy contained iron of roughly between 0.5
and 2 wt%, a metastable o phase was present, as shown
in the lower scanning speed (0.51/min) XRDpatterns
(Fig. 2). The highest o phase intensity appeared in the
Ti–7.5Mo–1Fe alloy.
3.2. Microstructure
A typically etched microstructure under optical
microscope of Ti–7.5Mo and the series of Ti–7.5Mo–
x
Fe alloys are shown in Fig. 3. As shown in Fig. 3(a),
Ti–7.5Mo alloy exhibited a fine, acicular martensitic
structure (identified as a
00
phase by XRD), similar to
that observed by Ho et al. [22]. At 0.1 wt%, the b phase
was co-existent with a
00
phase (Fig. 3(b)). At 0.5 wt% Fe,
the amount of b phase increased and the two-phase
morphology became more obvious (Fig. 3(c)). At 1 wt%
or more iron, the entire alloy turned into an equi-axed b
phase structure (Figs. 3(d)–(j)). In other words, in Ti–
7.5Mo–xFe alloy system, b phase can be entirely
retained upon fast cooling when the iron content is
higher than roughly 1 wt%.
As indicated in Table 1, the b phase grain size
decreased with increasing iron content, possibly due to
an iron-grain boundary interaction that slowed down
the growth of the grain boundaries. The etched granular
structure of high iron alloys became more fuzzy as a
direct result of chemical microsegregation that occurred
during the formation of dendrites [28]. One-way
ANOVA statistical analysis indicates that significant
differences (p
o0:001) in grain size exist among 1, 3, 5
and 7 wt% Fe alloys. In their b phase Ti–14 V alloy,
Ankem and Greene [15] reported that reducing the grain
size reduced the twinning activity, which in turn led to a
reduction in creep strain.
The o phase particles were quite easily resolved by
TEM. Fig. 4 represents a typical microstructure and
selected-area diffraction (SAD) patterns of two selected
alloys, Ti–7.5Mo–1Fe and Ti–7.5Mo–3Fe. According to
Sikka et al. [29] and Collings [30], this o phase may be
defined by a hexgonal lattice with three atoms per unit
cell having coordinates (0 0 0), (1/3 2/3 2/3-z) and (2/3
Table 1
b phase grain sizes of Ti–7.5Mo–xFe alloys
a
Alloys
b grain size (mm)
Ti–7.5Mo–1Fe
46.3
75.8
Ti–7.5Mo–2Fe
40.0
75.6
Ti–7.5Mo–3Fe
23.5
72.5
Ti–7.5Mo–4Fe
22.6
72.4
Ti–7.5Mo–5Fe
19.0
72.9
Ti–7.5Mo–6Fe
13.1
72.1
Ti–7.5Mo–7Fe
13.6
71.0
a
Entries are mean
7standard deviation (NX30).
D.J. Lin et al. / Biomaterials 23 (2002) 1723–1730
1726
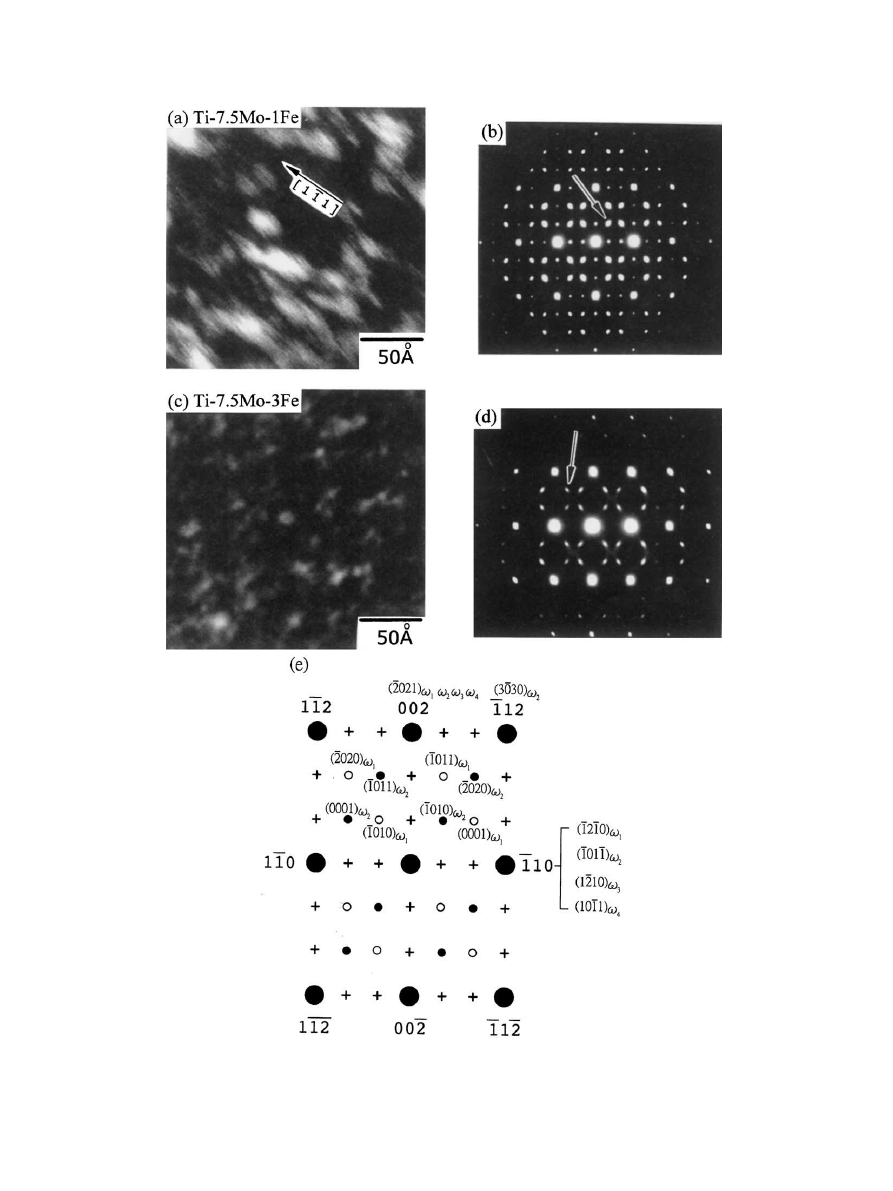
Fig. 4. TEM micrographs and SADpatterns. (a), (b) are, respectively, the dark field image and SADpattern of Ti–7.5Mo–1Fe alloy. (c), (d) are the
dark field image and SADpattern of Ti–7.5Mo–3Fe alloy.
D.J. Lin et al. / Biomaterials 23 (2002) 1723–1730
1727
1/3 1/3-z), wherein z describes the amount of {1 1 1}
b
plane shift along the plane normal and it ranges from 0
to
7(a
b
O3)/12/c
o
=
71/6 for the total collapse of two
neighboring planes. According to Bur
$sı´k’s definition
[32], the present z value was found to be 0.1664 for Ti–
7.5Mo–1Fe alloy and 0.1657 for Ti–7.5Mo–3Fe alloy, in
agreement with the result of Lin et al. [31] that, as solute
content decreased, z increased towards that for an ideal
o phase (1/6).
The overall diffraction patterns of the alloys are
consistent with the report of Sass [33] and indexed in
Fig. 4(e). The extra reflections as marked ‘+’ in Fig. 4(e)
are a result of double diffraction [33]. It was found
that the existence of o phase was always accompanied
with the broadening of diffraction spots as well as
diffuse streaks (diffuse scattering) [34–36] as a result of
an incomplete (1 1 1) plane collapse from b phase. The
fact that more diffuse scattering was found in Ti–
7.5Mo–3Fe than in Ti–7.5Mo–1Fe also indicated
that the hcp o structure was less ideal in the higher
iron alloy [29,37].
3.3. Microhardness
As indicated in Table 2, the a
00
phase-dominated Ti–
7.5Mo alloy had the lowest microhardness (300 HV),
while the alloys having iron contents in the neighbor-
hood of 1 wt% exhibited the highest microhardness level
(435 HV). As described earlier, the alloy comprising
1 wt% iron (Ti–7.5Mo–1Fe) had the largest content of o
phase. This clearly indicates that the o phase is a far
harder phase than a
00
or b phase. When the content of o
phase decreased, the hardness decreased. The slight
increase in hardness for Ti–7.5Mo–7Fe alloy might be
attributed to an increased solution hardening effect. In
lower iron alloys, this solution hardening effect was
probably overshadowed by the strong hardening effect
of o phase.
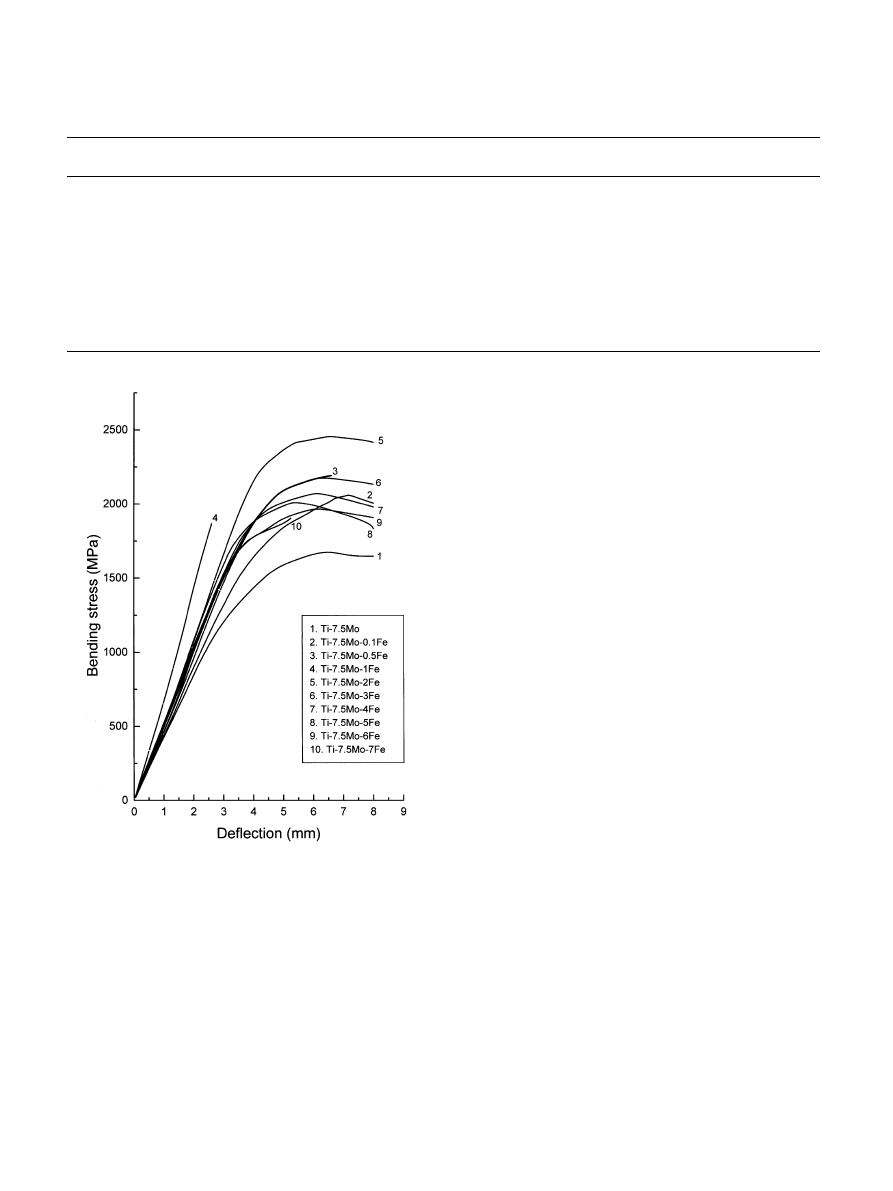
3.4. Bending strength and modulus
Typical bending stress–deflection profiles of the series
of alloys are shown in Fig. 5. The average bending
strengths and moduli of the alloys are compared in
Table 2, respectively. It is interesting to note that,
despite the strong hardening effect of o phase, the
bending strength of the alloy comprising the largest
amount of o phase (Ti–7.5Mo–1Fe) was lower than
those containing less o: This is due to the premature,
brittle fracture that occurred for Ti–7.5Mo–1Fe, but not
for alloys with other compositions (Fig. 5). This
Table 2
Mechanical properties of c.p.Ti, Ti–7.5Mo and Ti–7.5Mo–xFe alloys
Alloys
Hardness (HV)
Bending strength
(MPa)
Bending modulus
(GPa)
Strength/modulus ratio 1000
c.p.Ti
190.0
900
97
9.3
Ti–7.5Mo
300.8
1749
65
26.9
Ti–7.5Mo–0.1Fe
360.1
1990
72
27.6
Ti–7.5Mo–0.5Fe
428.6
2134
97
22
Ti–7.5Mo–1Fe
435.2
1902
111
17.1
Ti–7.5Mo–2Fe
403.1
2453
92
26.7
Ti–7.5Mo–3Fe
382.4
2201
85
25.9
Ti–7.5Mo–4Fe
364.5
2038
85
24.0
Ti–7.5Mo–5Fe
346.8
1994
89
22.4
Ti–7.5Mo–6Fe
348.5
1967
100
19.7
Ti–7.5Mo–7Fe
367.5
1851
98
18.9
Fig. 5. Bending stress–deflection profiles of Ti–7.5Mo and Ti–7.5Mo–
x
Fe alloys.
D.J. Lin et al. / Biomaterials 23 (2002) 1723–1730
1728

o-induced embrittlement of b phase was considered by
Williams et al. [36] as a result of a process of nucleation,
growth and coalescence of microvoids.
The embrittling/weakening effect was very sensitive to
the composition, or to be exact, to the iron content of
the alloy. As shown in Table 2, when the iron content
was only a little higher (Ti–7.5Mo–1.5Fe) or lower (Ti–
7.5Mo–0.5Fe) than 1 wt%, the weakening effect of o
phase largely diminished. Instead, its strengthening
effect prevailed. In this series of alloys the highest
bending strength was found in the alloy with 2 wt% iron
(2453 MPa). Like hardness, the alloy strength decreased
when the content of o phase decreased.
The a
00
phase-dominated binary Ti–7.5Mo alloy had a
bending strength (1749 MPa) and modulus (65 GPa)
lower than all those containing iron. The low modulus
nature of a
00
phase has been discussed in the literature
[22]. The lowest moduli of b-dominated alloys were
found in the alloys comprising roughly 3–4 wt% Fe
(85 GPa). The effect of o phase on modulus was not
influenced by its weakening effect. As shown in Table 2,
the alloy comprising the largest amount of o phase (Ti–
7.5Mo–1Fe)
had
the
highest
bending
modulus
(111 GPa),
despite
its
relatively
low
strength
(1902 MPa). Although the bending strength seems to
slightly decrease with iron content for high (roughly
higher than 5 wt%) iron alloys, their moduli increased
significantly. For example, when iron content increased
to 6 wt%, the modulus of the alloy increased to
100 GPa. These results indicate that, at high iron
contents, modulus is more sensitive to iron content than
strength.
From an engineering point of view, not only an iron
content of 1 wt% should be avoided, but also a uniform
distribution in iron is also important for such an alloy
system. When any process-induced segregation oc-
curred, o-induced embrittlement may occur in any local
regions which happen to have an iron concentration
near 1 wt%. To be practically used as an implant
material, a combination of high strength and low
modulus is often desired. As indicated in Table 2, the
alloys with iron contents from about 2 to 5 wt% seem to
have the greatest potential.
4. Conclusions
1. The a
00
phase-dominated Ti–7.5Mo alloy exhibited a
fine, acicular martensitic structure. When 0.1 wt%
iron was added, a significant amount of b phase was
retained. When 1 wt% or more iron was added, the
entire alloy became equi-axed b phase structure with
a grain size decreasing with increasing iron content.
2. When the alloy contained iron roughly between 0.5
and 2 wt%, an athermal o phase was formed. The
largest quantity of o phase was found in Ti–7.5Mo–
1Fe alloy. Compared to Ti–7.5Mo–1Fe, the Ti–
7.5Mo–3Fe alloy had a smaller amount of o phase
with a smaller particle size and less ideal crystal
structure.
3. Binary Ti–7.5Mo alloy had a lower microhardness,
bending strength and modulus than all iron-contain-
ing alloys. The alloys with iron contents closer to
1 wt% exhibited the highest microhardness level.
Despite the strong hardening effect of o phase, the
bending strength of Ti–7.5Mo–1Fe alloy was rela-
tively low due to its premature, brittle fracture. The
highest bending strength was found in Ti–7.5Mo–2Fe
alloy.
4. The present alloys with iron contents from about 2 to
5 wt% seem to have a great potential for use as an
implant material.
References
[1] Ida K, Tani Y, Tsutsumi S, Togaya T, Nambu T, Suese K,
Kawazoe T, Nakamura M. Clinical application of pure titanium
crown. Dent Mater J 1985;4:191–5.
[2] van Noort R. Titanium: the implant material of today. J Mater
Sci 1987;22:3801–11.
[3] Lautenschlager EP, Monaghan P. Titanium and titanium alloys
as dental materials. Int Dent J 1993;43:245–53.
[4] Huckstep RL. Early mobilization and rehabilitation in orthopae-
dic conditions. Aust NZ J Surg 1977;47(3):344–53.
[5] Imam MA, Fraker AC. Titanium alloys as implant materials. In:
Brown SA, Lemons JE, editors. Medical applications of titanium
and its alloys: the material and biological issues ASTM STP, vol.
1272. West Conshohocken: ASTM, 1996. p. 3–16.
[6] Rao S, Ushida T, Tateishi T, Okazaki Y, Asao S. Effect of Ti, Al,
and V ions on the relative growth rate of fibroblasts (L929) and
osteoblasts (MC3T3-E1) cells. Biomed Mater Eng 1996;6:79–86.
[7] Walker PR, LeBlanc J, Sikorska M. Effects of aluminum and
other cations on the structure of brain and liver chromatin.
Biochemistry 1989;28:3911–5.
[8] Yumoto S, Ohashi H, Nagai H, Kakimi S, Ogawa Y, Iwata Y,
Ishii K. Aluminum neurotoxicity in the rat brain. Int J PIXE
1992;2(4):493–504.
[9] Zardiakas LD, Michell DW, Disegi JA. Characterization of Ti–
15Mo beta titanium alloy for orthopaedic implant applications.
In: Brown SA, Lemons JE, editors. Medical applications of
titanium and its alloys: the material and biological issues, ASTM
STP, vol. 1272. West Conshohocken: ASTM, 1996. p. 60–75.
[10] Mishra AK, Davidson JA, Poggie RA, Kovacs P, FitzGerald TJ.
Mechanical and tribological properties and biocompatibility of
diffusion hardened Ti–13Nb–13Zr
Fa new titanium alloy for
surgical implants. In: Brown SA, Lemons JE, editors. Medical
applications of titanium and its alloys: the material and biological
issues, ASTM STP, vol. 1272. West Conshohocken: ASTM, 1996.
p. 96–113.
[11] Wang KK, Gustavson LJ, Dumbleton JH. Microstructure and
properties of a new beta titanium alloy, Ti–12Mo–6Zr-2Fe,
developed for surgical implants. In: Brown SA, Lemons JE,
editors. Medical applications of titanium and its alloys: the
material and biological issues, ASTM STP, vol. 1272. West
Conshohocken: ASTM, 1996. p. 76–87.
[12] Ito A, Okazaki Y, Tateishi T, Ito Y. In vitro bio-compatibility,
mechanical properties, and corrosion resistance of Ti–Zr–Nb–Ta–
D.J. Lin et al. / Biomaterials 23 (2002) 1723–1730
1729

Pd
and
Ti–Sn–Nb–Ta–Pd
alloys.
J
Biomed
Mater
Res
1995;29:893–900.
[13] Donachie MJ, editor. Titanium: a technical guide, vol. 31. ASM
International: Metal Park, OH, 1989. p. 218.
[14] Weiss I, Semiatin SL. Thermomechanical processing of beta
titanium alloys
Fan overview. Mater Sci Eng A 1998;243:46–65.
[15] Ankem S, Greene SA. Recent developments in microstructure/
property relationships of beta titanium alloys. Mater Sci Eng A
1999;263:127–31.
[16] Sumner DR, Galante JO. Determinants of stress shielding: design
versus materials versus interface. Clin Orthop Relat Res
1992;274:202–12.
[17] Cheal E, Spector M, Hayes W. Role of loads and prosthesis
material properties on the mechanics of the proximal femur after
total hip arthroplasty. J Orthop Res 1992;10:405–22.
[18] Prendergast P, Taylor D. Stress analysis of the proximo-medical
femur after total hip replacement. J Biomed Eng 1990;12:379–82.
[19] Wang K. The use of titanium for medical applications in the
USA. Mater Sci Eng A 1996;213:134–7.
[20] Niinomi M. Mechanical properties of biomedical titanium alloys.
Mater Sci Eng A 1998;243:231–6.
[21] Long M, Rack HJ. Titanium alloys in total joint replacement
Fa
materials science perspective. Biomaterials 1998;19:1621–39.
[22] Ho WF, Ju CP, Chern lin JH. Structure and properties of cast
binary Ti–Mo alloys. Biomaterials 1999;20:2115–22.
[23] Guha A. Metals handbook, 9th ed.,vol. 8, 1985. p. 133–6.
[24] Bagariaskii IA, Nosova GI, Tagunova TV. Factors in the
formation of metastable phase in titanium-based alloys [Engl.
trans.]. Sov Phys Dokl 1959;3:1014–8.
[25] Brown ARG, Clark D, Eastabrook J, Jepson KS. The titanium–
niobium system. Nature 1964;201:914–5.
[26] Baker C. Shape memory effect in a Ti–35Nb alloy. Metal Sci J
1971;5:92–100.
[27] Lin DJ, Ju CP, Chern lin JH. Structure and properties of cast Ti–
Fe alloys. AFS Trans 1999;216:859–64.
[28] Kurz W, Fisher DJ. Fundamentals of solidification, Switzerland,
vol. 13. Trans Tech Publications, 1992.
[29] Sikka SK, Vohra YK, Chidambaram R. Omega phase in material.
Progr Mater Sci 1982;27:245–310.
[30] Collings EW. Physical metallurgy of titanium alloys: revised from
‘‘The physical metallurgy of titanium alloys. (ASM International,
1984)’’ and ‘‘Introduction to titanium alloys design’’ in alloys
(ASM International, 1988). Columbus, OH: Battelle Memorial
Institute, USA. p. 43.
[31] Lin W, Spalt H, Batterman BW. Study of the omega phase in Zr–
Nb alloys by mossbauer and X-ray diffuse scattering. Phys Rev B
1976;13:5158–69.
[32] Bur
$sı´k J, Weatherly GC. Transformation of the b-(Ti,V) phase in
Ti–V–C alloys. Scripta Mater 1999;40:1381–6.
[33] Sass SL. The o phase in a Zr–25 at % Ti alloy. Acta Metall
1969;17:813–20.
[34] Dawson CW, Sass SL. The as-quenched form of the omega phase
in Zr–Nb alloys. Metall Trans 1970;1:2225–33.
[35] Sass SL, Borie B. Symmetry of the structure of the omega phase in
Zr and Ti alloys. J Appl Crytall 1972;5:236–8.
[36] Williams JC, de Fontaine D, Paton NE. The o phase as an
unusual shear transformation. Metall Trans 1973;4:2701–8.
[37] Collings EW, Ho JC, Jaffee RI. Superconducting transition
temperature, lattice instability and electron-to-atom ratio in
transition-metal binary solid solutions. Phys Rev B 1972;
5:4435–49.
D.J. Lin et al. / Biomaterials 23 (2002) 1723–1730
1730
Wyszukiwarka
Podobne podstrony:
Crystal structure and properties of the copper(II) complex of sodium monensin A
Walker The Production, Microstructure, and Properties of Wrought Iron (2002)
Structure and reactivity of alkenes and alkynes
Fibrillar Structure and Mechanical Properties of Collagen
71 1021 1029 Effect of Electron Beam Treatment on the Structure and the Properties of Hard
Guide to the properties and uses of detergents in biology and biochemistry
Modeling of Polymer Processing and Properties
Syntheses, structural and antimicrobial studies of a new N allylamide
Characteristic and adsorption properties of iron coated sand
52 737 754 Relationship Between Microstructure and Mechanical Properts of a 5%Cr Hot Works
32 425 436 Ifluence of Vacuum HT on Microstructure and Mechanical Properties of HSS
Mechanical Properties of Native and Cross linked Type I Collagen Fibrils Yang
Effect of heat treatment on microstructure and mechanical properties of cold rolled C Mn Si TRIP
Guide to the properties and uses of detergents in biology and biochemistry
Modeling of Polymer Processing and Properties
Microstructure and mechanical properties of plasma sprayed H
The Structure and the Unity of Beowulf Arthur G Brodeur
więcej podobnych podstron