Journal of Chromatography A, 1017 (2003) 161–166
Analysis of total propionic acid in feed using headspace
solid-phase microextraction and gas chromatography
夽
Carlos Ibáñez
Analytical Research Department, LUCTA S.A., P.O. Box 1112, 08080 Barcelona, Spain
Received 7 March 2003; received in revised form 9 July 2003; accepted 8 August 2003
Abstract
A method is described to analyze total propionic acid content (free propionic acid
+sodium, ammonium, calcium salts, etc.) in
feed, using headspace solid-phase microextraction (HS-SPME) of a feed suspension in salted and acidified water. Optimization
of the extraction variables was done by simplex method after choosing a polyacrilate fiber to enhance the response of this acid.
Separation was made by capillary gas chromatography (GC), using a special free fatty acid phase (FFAP) column for acids
and a flame ionization detector (FID). Some of the chromatograms were also done, injecting the SPME fiber in a GC–mass
spectrometry (MS) system, working with some specific ions for propionic acid, to be selective enough to avoid confusing
the propionic acid peak with interferences of those complex matrixes. The method was tested for linearity and repeatability.
Detection and quantification limits were also calculated. The method was applied to commercial feed samples, very variable in
composition, quantifying by standard addition method. No major interferences were observed.
© 2003 Elsevier B.V. All rights reserved.
Keywords: Headspace analysis; Propionic acid
1. Introduction
Propionic acid and its salts have been used as
mold inhibitors in feed at doses over 200 mg/kg. The
analysis of total propionic acid content in this matrix
has been traditionally difficult because feed is very
variable in composition, with different proportions of
total fat, protein, starch, etc. Usual ingredients could
be as diverse as: corn, soybean, blood plasma and
夽
Presented at the Second Meeting of the Spanish Society
of Chromatography and Related Techniques, Barcelona, 26–29
November 2002.
∗
Tel.:
+34-93-845-88-88; fax: +34-93-845-98-12.
E-mail address: ibanezc@lucta.es (C. Ib´añez).
fishmeal. These raw materials are prone to generate
interferences when applying chromatographic meth-
ods and could introduce important limitations to ex-
traction procedures. In the literature, methods can be
found based on the Wiegner distillation method or the
gas chromatographic analysis of ethereal or aqueous
solutions
. Also a Japanese Government Food Ad-
ditive Regulation method can be found based on the
gas chromatographic
or the HPLC analysis
the distillate of a feed sample under acidic conditions.
Other methods, can also be found, based on the HPLC
analysis on an ODS column of p-nitrobenzyl deriva-
tive of propionic acid, using strong cation-exchange
columns to separate interferences from the sample
, or capillary electrophoresis of aqueous solutions
0021-9673/$ – see front matter © 2003 Elsevier B.V. All rights reserved.
doi:10.1016/j.chroma.2003.08.017

162
C. Ib´añez / J. Chromatogr. A 1017 (2003) 161–166
deproteinized in basic medium by ultrafiltration
. Recently, a headspace solid-phase extraction
(HS-SPME) method has been applied to the analy-
sis of free propionic acid content of distillers grains,
using a carboxen-polydimethylsiloxane (PDMS) fiber
. Propionates were not considered.
As seen, developed methods to determine the to-
tal quantity of propionic acid in feed, were tedious,
sophisticated or solvent consuming. Then, a simple
analytical method, sensitive enough to detect ppm
quantities and selective enough to avoid confusing the
propionic acid with interferences of these complex
matrices is needed.
A new method is described in this paper that al-
lows us to analyze the total propionic acid content
(free
+ salts) in feed, by capillary gas chromatogra-
phy with flame ionization (FID) or mass spectrometry
(MS) detection, using HS-SPME of a suspension of
feed in hot, salted and acidified water.
Separation was done with a special column for acids
free fatty acid phase (FFAP) to improve the shape of
the propionic acid peak, increasing its detectability
and improving its quantification.
2. Experimental
2.1. Reagents
Propionic acid (analytical-reagent grade; Merck,
Darmstadt, Germany), sodium propionate (Quimi-
droga, Barcelona, Spain), sodium chloride and sul-
furic acid (both analytical-reagent grade; Panreac,
Montcada i Reixach, Spain), acetonitrile (HPLC
grade; Carlo Erba, Rodano, Italy), deionized water
(Laboratorio de agua destilada, Badalona, Spain).
2.2. Samples
The method was developed using a propionic acid
free commercially available standard feed, of known
composition: corn 32, barley 24, pea 18, soya 12,
meal byproducts 8, vitamin corrector 3, added veg-
etable fat 3 (total fat 5%), lysine 0.08, antioxidant
0.01%.
Commercial samples of different European origins
were also used to test the applicability of the method.
Both meal and grain mix were used.
2.3. Instruments
The SPME holder and polyacrylate 85
m fiber
were from Supelco, Bellefonte, PA, USA.
The chromatograph HP-6890, flame ionization
detection system and the mass selective detector
HP-5973 were from Hewlett-Packard, Palo Alto, CA,
USA.
2.4. Material
The chromatographic column (HP-FFAP, 50 m
×
0
.32 mm, 0.52 m) was from Hewlett-Packard. Fur-
ther, stirrer/heater, water bath, centrifuge, balance, stir
bars, pH paper, 120 ml glass vials and butyl/aluminum
caps, beakers 100, 500 ml and centrifuge tubes were
used.
2.5. Standard preparation
Exactly near 0.2 g propionic acid of >98% purity
was weighted in a 100 ml beaker and was made up
with acetonitrile. A 2000 mg/l solution was obtained,
which was used to quantify, using the standard addi-
tion method.
2.6. Chromatographic conditions
2.6.1. Oven
Initial temperature: 60
◦
C, initial time: 0 min, rate:
4
◦
C/min, final temperature: 230
◦
C, final time: 20 min.
Under these conditions, propionic acid was eluted near
21 min.
2.6.2. Injector
Injector pressure 80 kPa (near 1.5 ml/min helium
flow), injection temperature: 250
◦
C, injection type
splitless, purge on 2 min.
2.7. Detection
2.7.1. MS
MS transfer line temperature: 250
◦
C, MS source
temperature: 230
◦
C, MS source quadrupole temper-
ature: 150
◦
C. Ion employed to quantify: 74.1, ions
employed to qualify: 45.1, 73.1.
C. Ib´añez / J. Chromatogr. A 1017 (2003) 161–166
163
2.7.2. FID
Detector temperature: 250
◦
C, hydrogen flow
40 ml/min, air flow 450 ml/min, make-up nitrogen
50 ml/min.
Table 1
Simplex no.
SPME exposition
time (min)
Vial temperature
(
◦
C)
Salt conc.
(%, m/v)
Propionic
acid GC area
1
30
60
20
274967
2
45
80
30
405705
3
60
70
25
356174
4
40
70
40
483076
5
55
80
40
435003
6
30
80
40
499192
7
10
80
40
512495
8
5
80
40
9
1
80
40
347861
a
Optimum.
2.00
4.00
6.00
8.00
10.00
12.00
14.00
16.00
18.00
20.00
22.00
24.00
26.00
28.00
4000
5000
6000
7000
8000
9000
10000
11000
12000
13000
14000
15000
16000
17000
18000
19000
20000
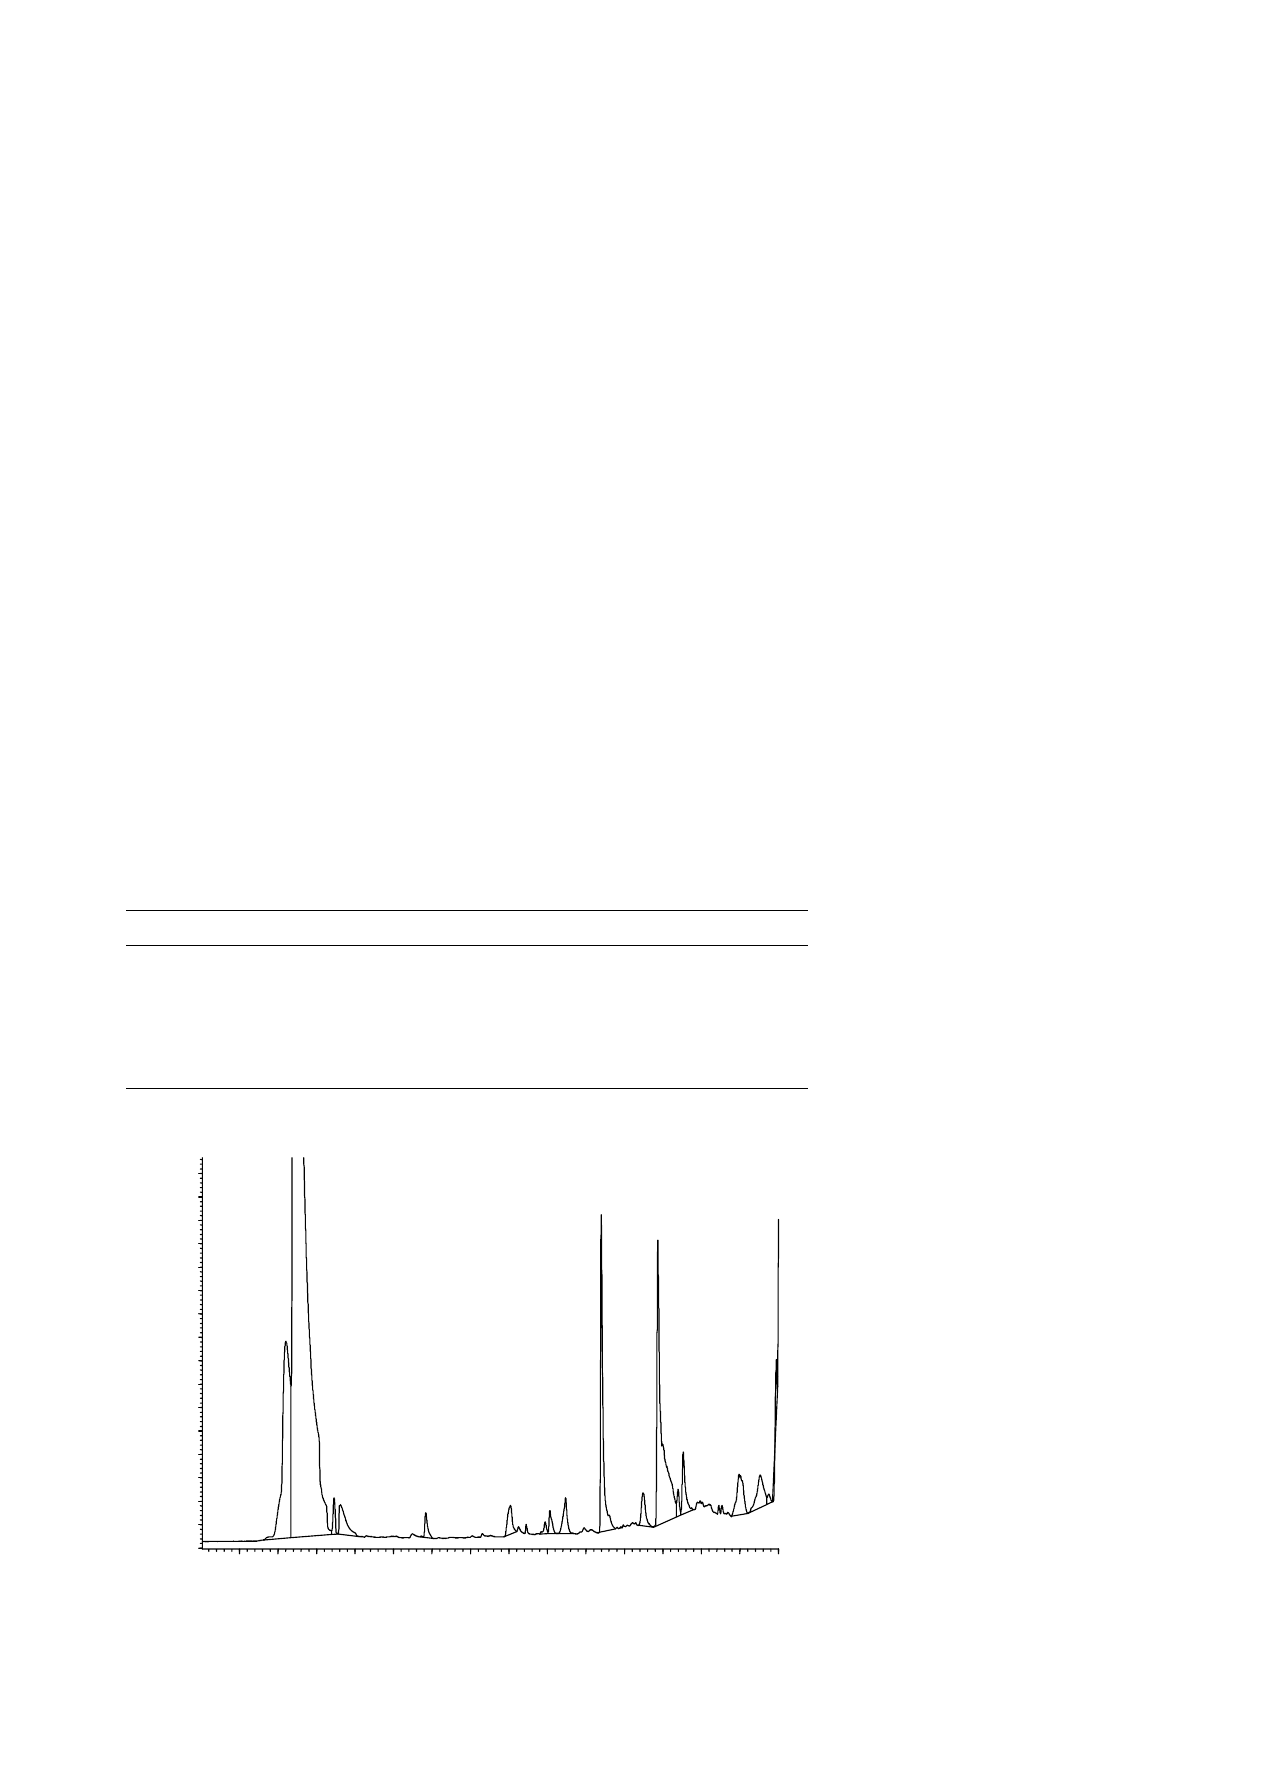
20.79
Propionic acid 1056 ppm
Fig. 1. HS-SPME–GC–FID chromatogram of a meal feed. Time scale in min.
3. Results
The following results were obtained with FID ex-
cept when indicated.
164
C. Ib´añez / J. Chromatogr. A 1017 (2003) 161–166
Some preliminary tests were made with propionic
acid standards in water to be sure the method was
acceptable using all conditions and reagents, except
the matrix and, in this way, evaluating better matrix
interaction.
A first test, to choose the optimum SPME fiber,
was done analyzing a standard propionic acid so-
lution in water with three fibers: PDMS 100
m,
PDMS–carboxen–divinylbenzene (DVB) and poly-
acrylate in the same conditions. Twenty milliliter of
a 20 mg/l standard propionic acid solution in wa-
ter, were taken in a 120 ml glass vial sealed with a
butyl/aluminum cap. Agitation was done by a mag-
netic stir bar. SPME fibers were exposed into the vial
for 30 min at 20
◦
C. Chromatographic areas were in
the order: polyacrylate
> PDMS–carboxen–DVB >
PDMS 100
m. The polyacrylate fiber was chosen
for the rest of the process.
Optimization, via simplex
, of three different
operational conditions: Vial temperature, SPME ex-
traction time and NaCl concentration added, using a
20 mg/l standard propionic acid solution with the rest
2.00
4.00
6.00
8.00 10.00 12.00 14.00 16.00 18.00 20.00 22.00 24.00 26.00 28.00
4000
6000
8000
10000
12000
14000
16000
18000
20000
22000
24000
26000
28000
30000
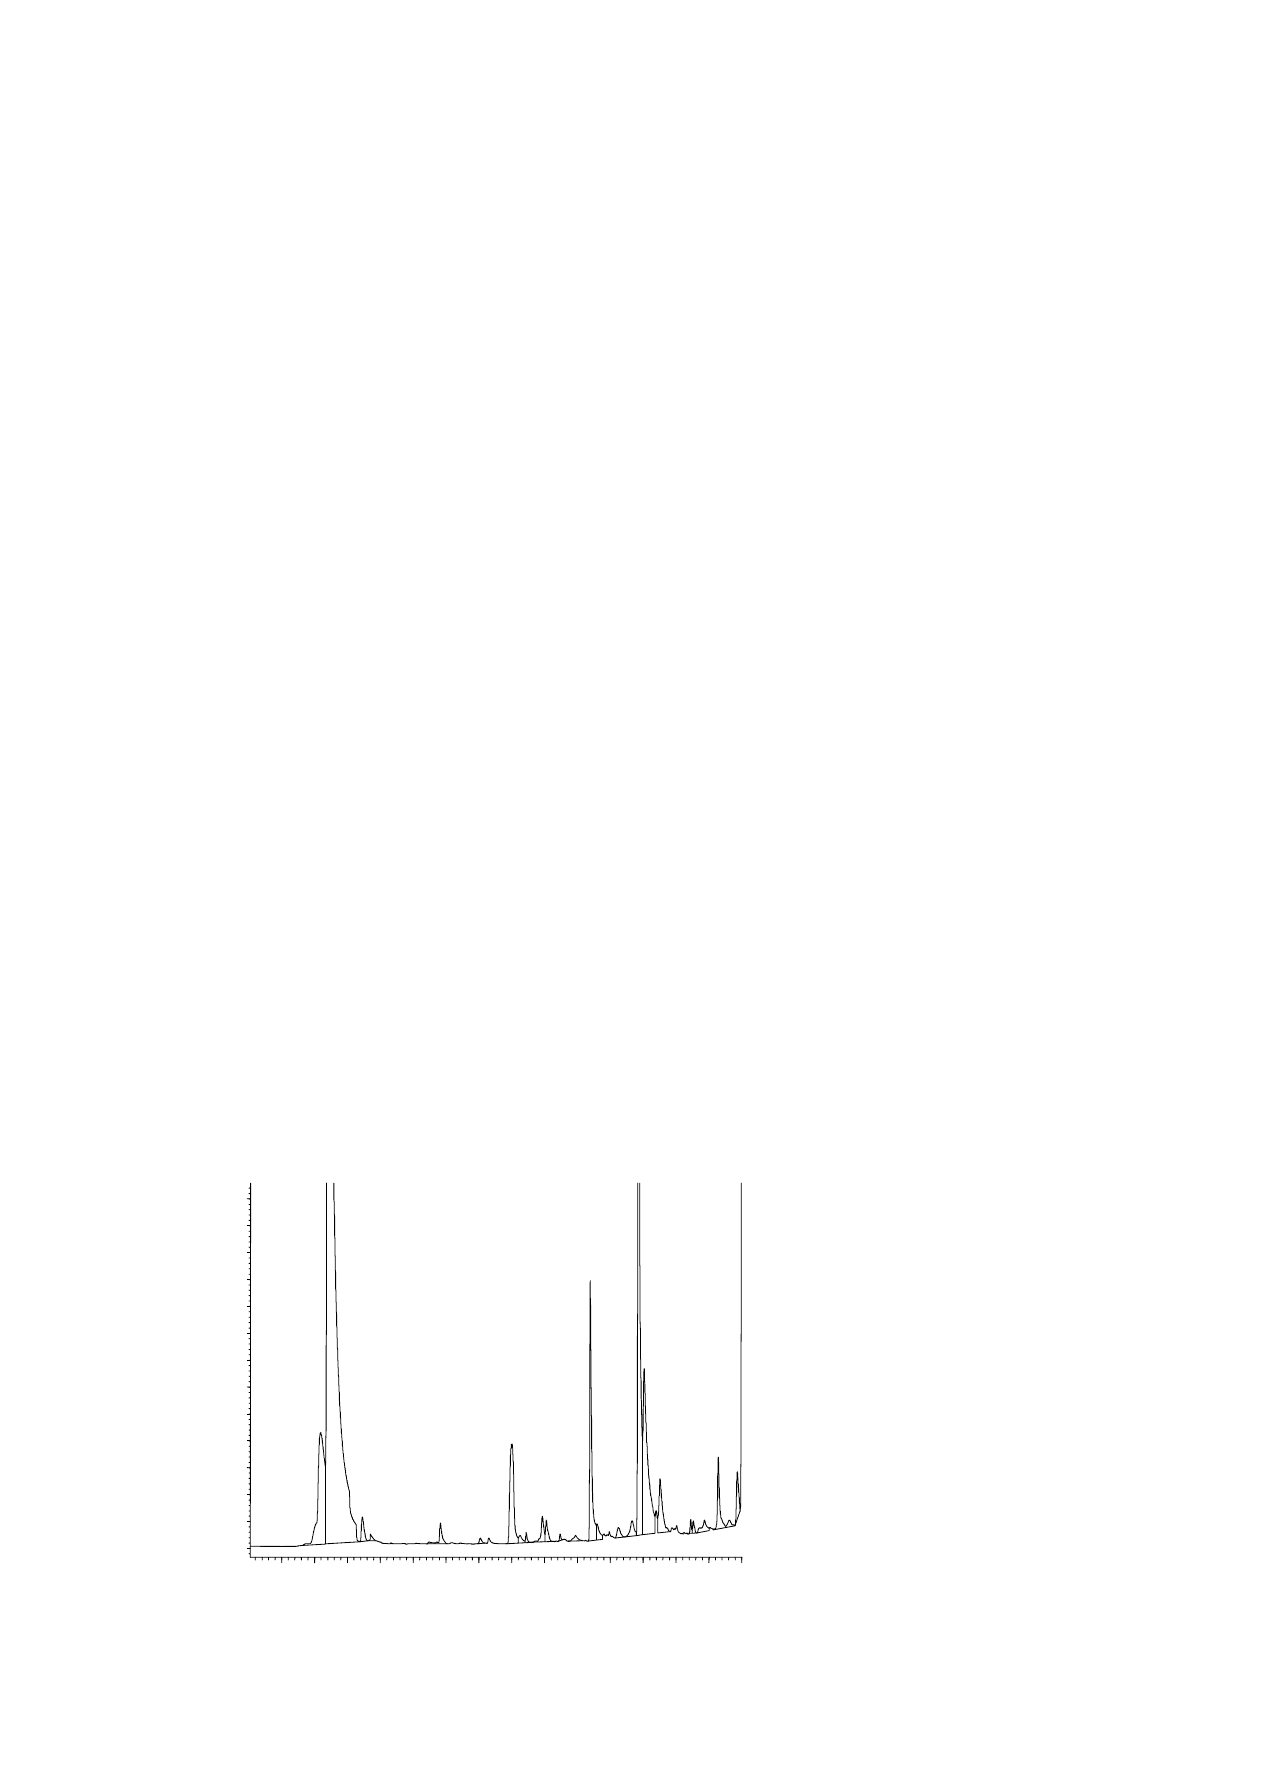
20.78
Propionic acid 1470 ppm
Fig. 2. HS-SPME–GC–FID chromatogram of a grain mix. Time scale in min.
of conditions as mentioned above, is shown in
Criteria for simplex optimization were the combina-
tion of maximum propionic acid area and minimum
SPME extraction time. The best results were obtained
with higher temperature and salt concentrations.
Finally, a maximum vial temperature of 80
◦
C, to
avoid problems with boiling water and vial overpres-
sure, and saturation of salt (near 40% m/v), were
chosen to standardize conditions. A maximum of
chromatographic area was obtained with 5 min of
exposition time under these conditions.
The optimum working method was applied to in-
creasing concentrations of propionic acid standards in
water (2, 20, 200 and 2000 mg/l) to calculate the lin-
earity. A
r
2
= 0.99998 was obtained.
The same working method was applied to three vials
with 20 mg/l propionic acid standard in water each
one, to calculate standard repeatability. A R
.S.D. =
2
.5% of GC area and a R.S.D. = 0.03% of retention
time, were obtained.
The rest of tests were made with the standard feed,
using the following final feed sample preparation
C. Ib´añez / J. Chromatogr. A 1017 (2003) 161–166
165
method: for every experiment exactly near 10 g of
each feed were weighted in a 500 ml beaker. One
hundred gram of water and a magnetic stir bar were
added. Agitation was left for 10 min. Two 10 ml cen-
trifuge tubes were filled with the supernatant and were
centrifuged for 2 min. A 120 ml glass vial was filled
with 20 ml of the supernatant of the two centrifuge
tubes and a magnetic stir bar was added. Some drops
of 10% aqueous H
2
SO
4
were added to be sure that
the pH of the final solution was acid and to let all
propionate salts to be transformed to free propionic
acid. Finally, 8 g (saturation) of NaCl were added
and the vial was capped with an aluminum cap and
a butyl septum. The closed vial was introduced in a
water bath at 80
◦
C, during 10 min with fast agitation
to equilibrate the vial temperature and the headspace
of the sample. A SPME syringe with a polyacrylate
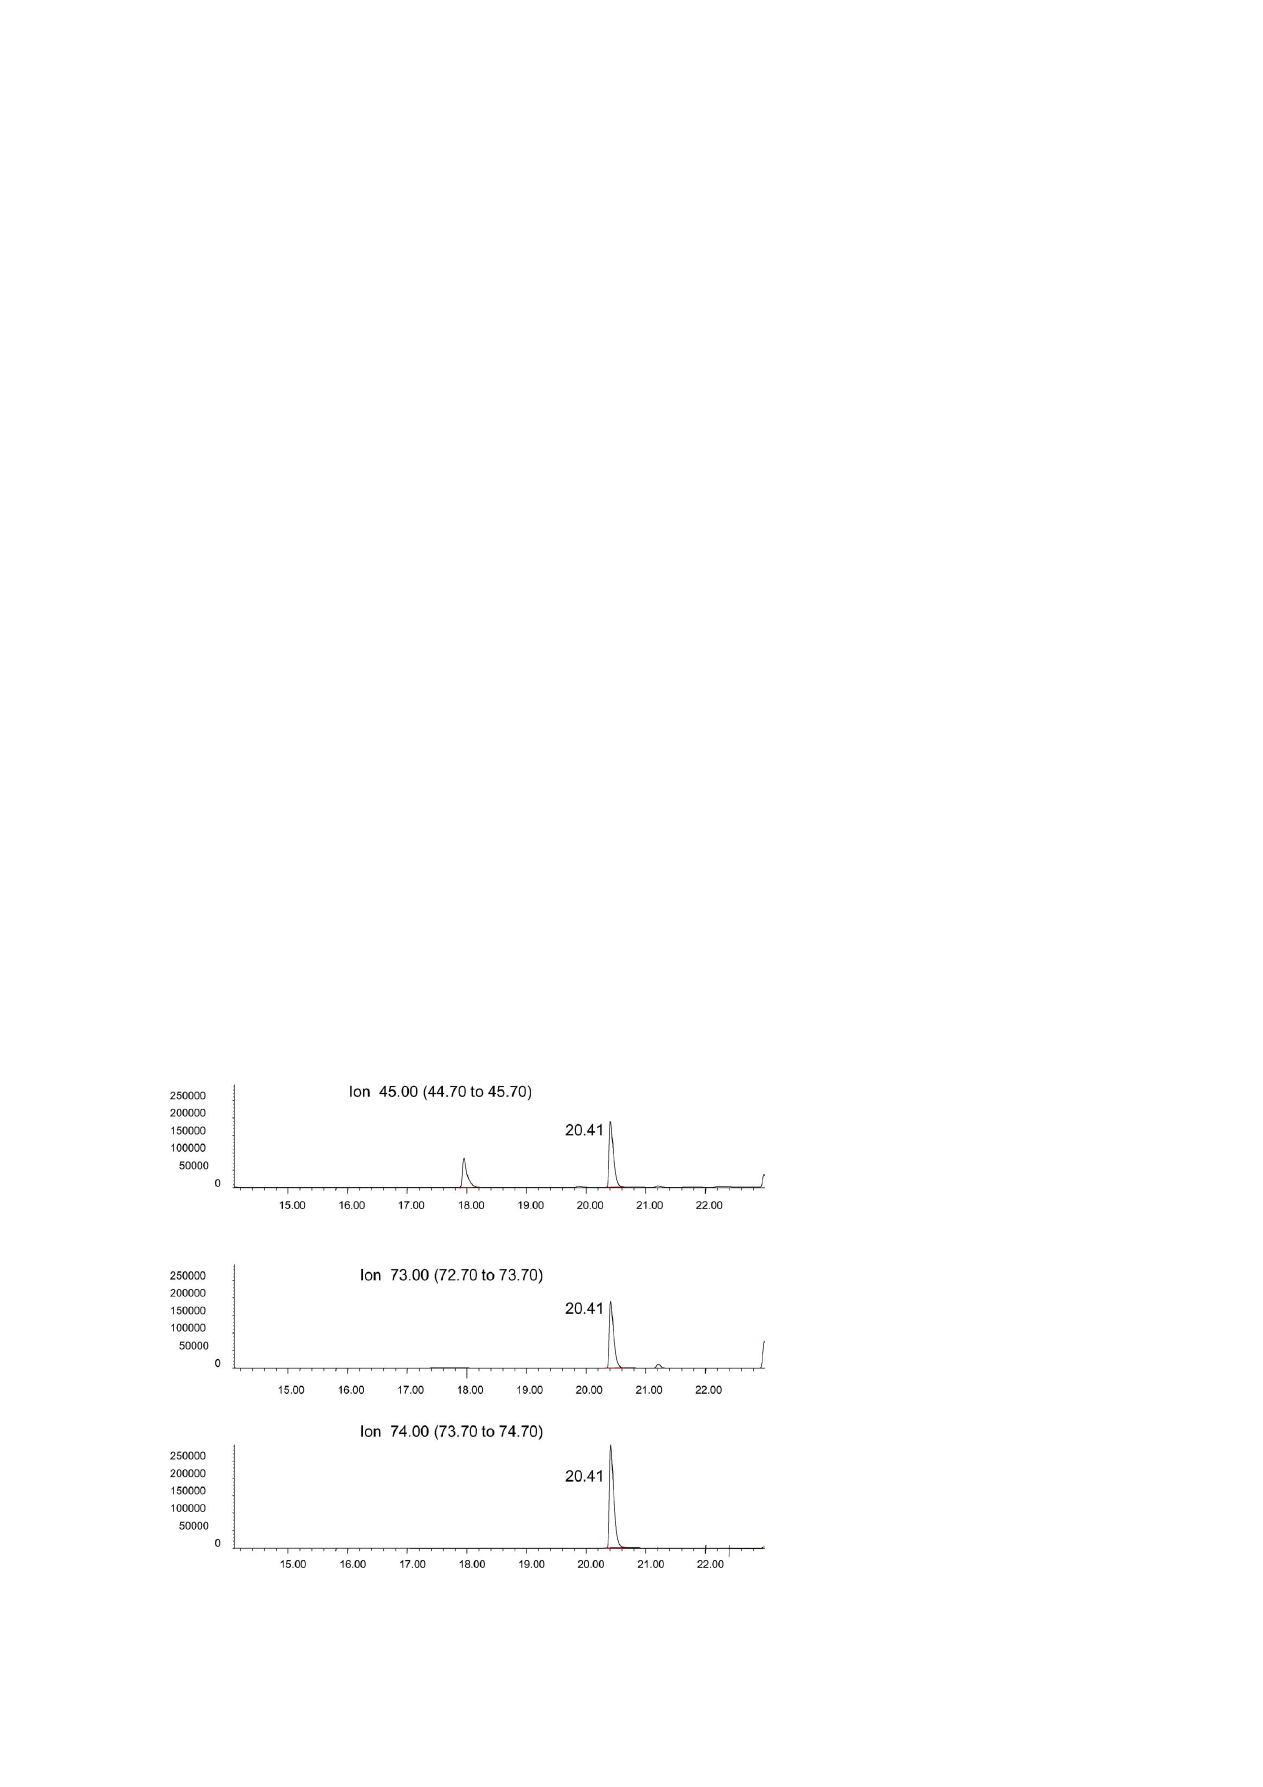
Fig. 3. HS-SPME–GC–MS (selected ion monitoring) chromatogram of a commercial sample feed (meal form) containing 324 mg/l of
propionic acid. Time scale in min.
85
m fiber was inserted in the vial and was ex-
posed for 5 min. The fiber was taken out from the
vial, injected into the port of the chromatograph and
exposed into the injector. Analysis was started and
the syringe was left 30 min into the injector to clean
the fiber for the next extraction avoiding memory
effects.
To calculate linearity, the above final feed sample
preparation was applied to four samples of the same
propionic acid free standard feed, fortified with a total
content of 45, 189, 454 and 1890 mg/l of propionic
acid, added as sodium propionate (to avoid losses by
volatility). A
r
2
= 0.9998 was obtained.
To calculate sample repeatability, the same final
feed sample preparation was applied to three com-
mercial samples (in meal form) containing a mold
inhibitor at total propionic acid doses of 1500 mg/l.

166
C. Ib´añez / J. Chromatogr. A 1017 (2003) 161–166
A R
.S.D. = 7.6% of GC area and a R.S.D. = 0.07%
of retention time were obtained.
To calculate detection and quantification limit, final
feed sample preparation was applied to a sample of the
same propionic acid free standard feed, fortified with
a total content of 3 mg/l of propionic acid, added as
sodium propionate. The height of the propionic acid
peak, and the baseline noise were measured. A detec-
tion limit of 1.5 mg/l (two times baseline noise) and
a quantification limit of 5 mg/l (three times detection
limit) were obtained. Blank tests were made following
the final feed sample preparation procedure without
the addition of feed, using HPLC water, deionized wa-
ter and tap water, giving all of them analogous results
with an interfering peak corresponding to few counts
of area, that was considered.
Recovery was calculated using standard addition
method. The importance of the effect of the matrix
on results was studied using the final feed extraction
procedure but using the mass spectrometer as a detec-
tor. Comparing the GC area obtained with a propionic
acid free standard feed fortified with a total content
of 200 mg/l of total propionic acid, with the GC area
of an aqueous solution of 20 mg/l of the same acid
(the method dilutes sample 10 times) only a 16% of
the chromatographic area of the aqueous solution was
obtained when feed sample was analyzed. A strong
influence of the matrix was shown with the decreas-
ing of the propionic acid area in the headspace of the
feed extract. Then an external standard cannot be used
as quantitation procedure. Standard addition method
is strongly recommended.
The method presented in this paper was applied
to 20 commercial European feed samples of different
origins to quantify the propionic acid added. No ma-
jor interferences were observed in all chromatographic
profiles from components extracted from samples, nei-
ther in meal feed,
, nor in grain mix,
. In
these two figures, propionic acid contents near 1000
and 1500 mg/l were found.
Thinking in future more complex samples, the
same analysis was done injecting the SPME fiber in
GC–MS, working with some specific ions character-
istic of propionic acid, as shown in
Chromatographic profile was cleaner than the pro-
file obtained with FID, and lower detection limits were
expected. More work has to be done in the future with
this configuration.
4. Conclusion
Propionic acid and its salts are used as mold in-
hibitor in feed to prevent the growing of molds. Usual
methods to determine its quantity in feed are tedious
and/or solvent consuming. A method able to analyze
total propionic acid content (free
+ salts) in feed,
using HS-SPME of a suspension of feed in salted
and acidified water was described in this paper. A
polyacrylate fiber was used to extract and enhance
the response of the acid. Separation was done by
capillary gas chromatography with a special column
for acids (FFAP). MS was used, in addition to FID,
to be selective enough to avoid confusing the propi-
onic acid with other interferences of these complex
matrices.
Using this new method, we were able to analyze
ppm quantities of propionic acid with good linear-
ity, repeatability and good detection and quantifica-
tion limits. The method was applied to commercial
samples, very variable in composition, doing the
quantitation by standard addition method. No major
interferences were found.
Acknowledgements
We thank the Lucta Feed Additives Division De-
sign Department for their kind support in the prepa-
ration of standard and commercial feed working
samples, and the Lucta R&D Division and, specially,
the Analytical Research Department for their kind
collaboration on the analytical tasks to develop this
paper.
References
[1] J. Elema, Z. Tierphysiol, Tierernaehr. Futtermittelkd. 21 (1966)
345.
[2] A. Suzuki, Y. Tanaka, Y. Shishido, Shiryo Kenkyu Hokoku
(Tokio Hishiryo Kensasho) 7 (1981) 12.
[3] M. Shibata, K. Fujiwara, T. Yamata, Shiryo Kenkyu Hokoku
(Tokio Hishiryo Kensasho) 24 (1999) 79.
[4] D. Balschukat, E. Kress, Landwirtschaftl. Forsch, 41 (1988)
312.
[5] E. Ishikuro, H. Hibino, T. Soga, H. Yanai, H. Sawada, Shokuhin
Eiseigaku Zasshi 41 (2000) 261.
[6] S. Biswas, C. Staff, Cereal Sci. 33 (2001) 223–229.
[7] J. Tabera, Cromatograf´ıa y Técnicas Afines 10 (1989) 139.
Document Outline
Wyszukiwarka
Podobne podstrony:
Analysis of soil fertility and its anomalies using an objective model
SEISMIC ANALYSIS OF THE SHEAR WALL DOMINANT BUILDING USING CONTINUOUS-DISCRETE APPROACH
„SAMB” Computer system of static analysis of shear wall structures in tall buildings
Analysis of soil fertility and its anomalies using an objective model
A contrastive analysis of English and Arabic in relativization
Analysis of the Different Pedicellariae in Sea Urchins
interactive art vs social interactions analysis of interactive art strategies in the light of erving
A syntactic contrastive analysis of the relative clauses in Arabic and English
Rapid analysis of malathion in blood using head space solid
Rapid analysis of amphetamines in blood using head space sol
Antigone Analysis of Greek Ideals in the Play
Analysis of Police Corruption In Depth Analysis of the Pro
Chizzola GC analysis of essential oils in the rumen fluid after incubation of Thuja orientalis tw
Foresight analysis of wind power in Turkey
Freedom in the United States Analysis of the First Amendme
Quantitative dilatometric analysis of intercritical annealing in a low silicon TRIP steel
[2006] Analysis of a Novel Transverse Flux Generator in direct driven wind turbine
więcej podobnych podstron