
W
ARSAW
S
PRING
2011
From Lisbon to Europe 2020
Lisbon Strategy Implementation in 2010:
Assessments and Prospects
ISBN 978-83-62453-13-9
Report of the Polish Institute of International Affairs
THE POLISH INSTITUTE OF INTERNATIONAL AFFAIRS
POLSKI INSTYTUT SPRAW MIĘDZYNARODOWYCH
PISM
THE POLISH INSTITUTE OF INTERNATIONAL AFFAIRS
POLSKI INSTYTUT SPRAW MIĘDZYNARODOWYCH
PISM
9 7 8 8 3 6 2 4 5 3 1 3 9


THE POLISH INSTITUTE OF INTERNATIONAL AFFAIRS
From Lisbon to Europe 2020
Lisbon Strategy Implementation in 2010:
Assessments and Prospects
Marcin Koczor, Pawe³ Tokarski
Warsaw, Spring 2011

Copy Editors
Brien Barnett, Joanna Sokólska
Technical Editor
Dorota Do³êgowska
© Copyright by Polski Instytut Spraw Miêdzynarodowych, Warszawa 2011
ISBN 978-83-62453-13-9
The Polish Institute of International Affairs
ul. Warecka 1a, 00-950 Warsaw, Poland
tel. (+48) 22 556 80 00, fax (+48) 22 556 80 99
pism@pism.pl, www.pism.pl

CONTENTS
Executive Summary . . . . . . . . . . . . . . . . . . . . . . . . . . . . . . . . . . . . . . . . . . . . . . . . . . 7
Part I
1. Economy (Marcin Koczor) . . . . . . . . . . . . . . . . . . . . . . . . . . . . . . . . . . . . . . . . . . 11
1.1. General Economic Situation . . . . . . . . . . . . . . . . . . . . . . . . . . . . . . . . . . . . . . . . . 11
1.2. Fiscal Situation in the EU . . . . . . . . . . . . . . . . . . . . . . . . . . . . . . . . . . . . . . . . . . . . 15
1.3. Inflation . . . . . . . . . . . . . . . . . . . . . . . . . . . . . . . . . . . . . . . . . . . . . . . . . . . . . . . . 16
1.4. EU Actions in Response to the Sovereign Debt Crisis among Member States in 2010. . 17
1.5. Conclusions . . . . . . . . . . . . . . . . . . . . . . . . . . . . . . . . . . . . . . . . . . . . . . . . . . . . . 19
1.6. Evaluation. . . . . . . . . . . . . . . . . . . . . . . . . . . . . . . . . . . . . . . . . . . . . . . . . . . . . . . 21
1.6.1. Positive . . . . . . . . . . . . . . . . . . . . . . . . . . . . . . . . . . . . . . . . . . . . . . . . . . . 21
1.6.2. Negative. . . . . . . . . . . . . . . . . . . . . . . . . . . . . . . . . . . . . . . . . . . . . . . . . . . 21
1.7. Recommendations . . . . . . . . . . . . . . . . . . . . . . . . . . . . . . . . . . . . . . . . . . . . . . . . 22
2. Entrepreneurship (Marcin Koczor) . . . . . . . . . . . . . . . . . . . . . . . . . . . . . . . . . . . . 22
2.1. Registration of Business Activity . . . . . . . . . . . . . . . . . . . . . . . . . . . . . . . . . . . . . . . 22
2.2. Registration of Property . . . . . . . . . . . . . . . . . . . . . . . . . . . . . . . . . . . . . . . . . . . . . 24
2.3. Taxation System . . . . . . . . . . . . . . . . . . . . . . . . . . . . . . . . . . . . . . . . . . . . . . . . . . 25
2.4. Commercial Judicature . . . . . . . . . . . . . . . . . . . . . . . . . . . . . . . . . . . . . . . . . . . . . 27
2.5. Bankruptcy Proceedings . . . . . . . . . . . . . . . . . . . . . . . . . . . . . . . . . . . . . . . . . . . . 28
2.6. Smart Regulation . . . . . . . . . . . . . . . . . . . . . . . . . . . . . . . . . . . . . . . . . . . . . . . . . 30
2.7. Industrial Policy in the New Decade. . . . . . . . . . . . . . . . . . . . . . . . . . . . . . . . . . . . 31
2.8. Conclusions . . . . . . . . . . . . . . . . . . . . . . . . . . . . . . . . . . . . . . . . . . . . . . . . . . . . . 32
2.9. Evaluation. . . . . . . . . . . . . . . . . . . . . . . . . . . . . . . . . . . . . . . . . . . . . . . . . . . . . . . 33
2.9.1. Positive . . . . . . . . . . . . . . . . . . . . . . . . . . . . . . . . . . . . . . . . . . . . . . . . . . . 33
2.9.2. Negative. . . . . . . . . . . . . . . . . . . . . . . . . . . . . . . . . . . . . . . . . . . . . . . . . . . 33
2.10. Recommendations . . . . . . . . . . . . . . . . . . . . . . . . . . . . . . . . . . . . . . . . . . . . 33
3. Single Market (Marcin Koczor) . . . . . . . . . . . . . . . . . . . . . . . . . . . . . . . . . . . . . . . 33
3.1. Transposition of the Services Directive . . . . . . . . . . . . . . . . . . . . . . . . . . . . . . . . . . 34
3.2. Transposition Deficit . . . . . . . . . . . . . . . . . . . . . . . . . . . . . . . . . . . . . . . . . . . . . . . 35
3.3. State Aid . . . . . . . . . . . . . . . . . . . . . . . . . . . . . . . . . . . . . . . . . . . . . . . . . . . . . . . . 38
3.4. Energy Market . . . . . . . . . . . . . . . . . . . . . . . . . . . . . . . . . . . . . . . . . . . . . . . . . . . . 42
3.5. Telecommunication . . . . . . . . . . . . . . . . . . . . . . . . . . . . . . . . . . . . . . . . . . . . . . . 43

3.6. Railways . . . . . . . . . . . . . . . . . . . . . . . . . . . . . . . . . . . . . . . . . . . . . . . . . . . . . . . . 43
3.7. Future of the Single Market . . . . . . . . . . . . . . . . . . . . . . . . . . . . . . . . . . . . . . . . . . 44
3.8. Conclusions . . . . . . . . . . . . . . . . . . . . . . . . . . . . . . . . . . . . . . . . . . . . . . . . . . . . . 45
3.9. Evaluation. . . . . . . . . . . . . . . . . . . . . . . . . . . . . . . . . . . . . . . . . . . . . . . . . . . . . . . 46
3.9.1. Positive . . . . . . . . . . . . . . . . . . . . . . . . . . . . . . . . . . . . . . . . . . . . . . . . . . . 46
3.9.2. Negative. . . . . . . . . . . . . . . . . . . . . . . . . . . . . . . . . . . . . . . . . . . . . . . . . . . 46
3.10. Recommendations . . . . . . . . . . . . . . . . . . . . . . . . . . . . . . . . . . . . . . . . . . . . . . . 46
4. The Knowledge Triangle (Pawe³ Tokarski). . . . . . . . . . . . . . . . . . . . . . . . . . . . . . . 47
4.1. Lifelong Learning . . . . . . . . . . . . . . . . . . . . . . . . . . . . . . . . . . . . . . . . . . . . . . . . . 47
4.2. Mathematics and Science Literacy . . . . . . . . . . . . . . . . . . . . . . . . . . . . . . . . . . . . . 48
4.3. Development of Higher Education . . . . . . . . . . . . . . . . . . . . . . . . . . . . . . . . . . . . . 49
4.4. R&D Expenditure . . . . . . . . . . . . . . . . . . . . . . . . . . . . . . . . . . . . . . . . . . . . . . . . . 50
4.5. Development of Patent System. . . . . . . . . . . . . . . . . . . . . . . . . . . . . . . . . . . . . . . . 52
4.6. Conclusions . . . . . . . . . . . . . . . . . . . . . . . . . . . . . . . . . . . . . . . . . . . . . . . . . . . . . 53
4.7. Evaluation. . . . . . . . . . . . . . . . . . . . . . . . . . . . . . . . . . . . . . . . . . . . . . . . . . . . . . . 55
4.7.1. Positive . . . . . . . . . . . . . . . . . . . . . . . . . . . . . . . . . . . . . . . . . . . . . . . . . . . 55
4.7.2. Negative. . . . . . . . . . . . . . . . . . . . . . . . . . . . . . . . . . . . . . . . . . . . . . . . . . . 55
4.8. Recommendations . . . . . . . . . . . . . . . . . . . . . . . . . . . . . . . . . . . . . . . . . . . . . . . . 55
5. Information Society (Pawe³ Tokarski) . . . . . . . . . . . . . . . . . . . . . . . . . . . . . . . . . . 56
5.1. General Development Level . . . . . . . . . . . . . . . . . . . . . . . . . . . . . . . . . . . . . . . . . 56
5.2. Internet Users . . . . . . . . . . . . . . . . . . . . . . . . . . . . . . . . . . . . . . . . . . . . . . . . . . . . 57
5.3. e-Government. . . . . . . . . . . . . . . . . . . . . . . . . . . . . . . . . . . . . . . . . . . . . . . . . . . . 59
5.4. Conclusions . . . . . . . . . . . . . . . . . . . . . . . . . . . . . . . . . . . . . . . . . . . . . . . . . . . . . 61
5.5. Evaluation . . . . . . . . . . . . . . . . . . . . . . . . . . . . . . . . . . . . . . . . . . . . . . . . . . . . . . 61
5.5.1. Positive . . . . . . . . . . . . . . . . . . . . . . . . . . . . . . . . . . . . . . . . . . . . . . . . . . . 61
5.5.2. Negative. . . . . . . . . . . . . . . . . . . . . . . . . . . . . . . . . . . . . . . . . . . . . . . . . . . 61
5.6. Recommendations . . . . . . . . . . . . . . . . . . . . . . . . . . . . . . . . . . . . . . . . . . . . . . . . 61
6. Energy and Climate (Pawe³ Tokarski) . . . . . . . . . . . . . . . . . . . . . . . . . . . . . . . . . . 62
6.1. Reduction of Greenhouse Gas Emissions . . . . . . . . . . . . . . . . . . . . . . . . . . . . . . . . 62
6.2. Generating Electricity from Renewable Resources . . . . . . . . . . . . . . . . . . . . . . . . . 65
6.3. Development of Cogeneration . . . . . . . . . . . . . . . . . . . . . . . . . . . . . . . . . . . . . . . . 66
6.4. Conclusions . . . . . . . . . . . . . . . . . . . . . . . . . . . . . . . . . . . . . . . . . . . . . . . . . . . . . 66
6.5. Evaluation. . . . . . . . . . . . . . . . . . . . . . . . . . . . . . . . . . . . . . . . . . . . . . . . . . . . . . . 67
6.5.1. Positive . . . . . . . . . . . . . . . . . . . . . . . . . . . . . . . . . . . . . . . . . . . . . . . . . . . 67
6.5.2. Negative. . . . . . . . . . . . . . . . . . . . . . . . . . . . . . . . . . . . . . . . . . . . . . . . . . . 67
6.6. Recommendations . . . . . . . . . . . . . . . . . . . . . . . . . . . . . . . . . . . . . . . . . . . . . . . . 67
7. Employment and Social Policy (Marcin Koczor, Pawe³ Tokarski) . . . . . . . . . . . . . . 68

7.1. Overall Employment Rate . . . . . . . . . . . . . . . . . . . . . . . . . . . . . . . . . . . . . . . . . . . 68
7.2. Employment Rate for Women . . . . . . . . . . . . . . . . . . . . . . . . . . . . . . . . . . . . . . . . 69
7.3. Employment Rate for Older People . . . . . . . . . . . . . . . . . . . . . . . . . . . . . . . . . . . . 69
7.4. Unemployment Rate . . . . . . . . . . . . . . . . . . . . . . . . . . . . . . . . . . . . . . . . . . . . . . . 70
7.5. Labour Productivity . . . . . . . . . . . . . . . . . . . . . . . . . . . . . . . . . . . . . . . . . . . . . . . . 71
7.6. Social Policy . . . . . . . . . . . . . . . . . . . . . . . . . . . . . . . . . . . . . . . . . . . . . . . . . . . . . 71
7.7. Flagship Initiatives . . . . . . . . . . . . . . . . . . . . . . . . . . . . . . . . . . . . . . . . . . . . . . . . 73
7.8. Conclusions . . . . . . . . . . . . . . . . . . . . . . . . . . . . . . . . . . . . . . . . . . . . . . . . . . . . . 73
7.9. Evaluation. . . . . . . . . . . . . . . . . . . . . . . . . . . . . . . . . . . . . . . . . . . . . . . . . . . . . . . 74
7.9.1. Positive . . . . . . . . . . . . . . . . . . . . . . . . . . . . . . . . . . . . . . . . . . . . . . . . . . . 74
7.9.2. Negative. . . . . . . . . . . . . . . . . . . . . . . . . . . . . . . . . . . . . . . . . . . . . . . . . . . 74
7.10. Recommendations . . . . . . . . . . . . . . . . . . . . . . . . . . . . . . . . . . . . . . . . . . . . 74
Part II
8. Lisbon Strategy: Overview and Assessment (Pawe³ Tokarski) . . . . . . . . . . . . . . . . . 77
8.1. Lisbon Strategy History in a Nutshell . . . . . . . . . . . . . . . . . . . . . . . . . . . . . . . . . . . 77
8.2. Objectives and Indicators . . . . . . . . . . . . . . . . . . . . . . . . . . . . . . . . . . . . . . . . . . . 79
8.3. General Performance . . . . . . . . . . . . . . . . . . . . . . . . . . . . . . . . . . . . . . . . . . . . . . 80
8.4. Overall Assessment of LS Implementation . . . . . . . . . . . . . . . . . . . . . . . . . . . . . . . 82
8.5. Conclusions . . . . . . . . . . . . . . . . . . . . . . . . . . . . . . . . . . . . . . . . . . . . . . . . . . . . . 84
Part III
9. Europe 2020 in the Context of Economic Governance Reform (Marcin Koczor) . . . 89
9.1. Introduction . . . . . . . . . . . . . . . . . . . . . . . . . . . . . . . . . . . . . . . . . . . . . . . . . . . . . 89
9.2. Governance of Europe 2020 in the Context of Economic Governance Reform . . . . . . . 89
9.2.1. Main Differences with Lisbon Strategy . . . . . . . . . . . . . . . . . . . . . . . . . . . . . 89
9.2.2. Governance Elements of Europe 2020 . . . . . . . . . . . . . . . . . . . . . . . . . . . . . 90
9.3. Reinforcing EU Economic Policy Coordination . . . . . . . . . . . . . . . . . . . . . . . . . . . . 92
9.3.1. Context of the Reform and Progress Achieved in 2010 . . . . . . . . . . . . . . . . . 92
9.3.2. Fiscal Surveillance . . . . . . . . . . . . . . . . . . . . . . . . . . . . . . . . . . . . . . . . . . . 94
9.3.3. Non-fiscal Surveillance . . . . . . . . . . . . . . . . . . . . . . . . . . . . . . . . . . . . . . . . 97
9.3.4. European Semester . . . . . . . . . . . . . . . . . . . . . . . . . . . . . . . . . . . . . . . . . . . 97
9.4. Prospects . . . . . . . . . . . . . . . . . . . . . . . . . . . . . . . . . . . . . . . . . . . . . . . . . . . . . . . 98
9.5. Conclusions . . . . . . . . . . . . . . . . . . . . . . . . . . . . . . . . . . . . . . . . . . . . . . . . . . . . 100
Part IV
General Conclusions and Recommendations (Marcin Koczor, Pawe³ Tokarski) . . . . 103


Executive Summary
1. This Report presents Member States’ performances in fulfilling the Lisbon
Strategy objectives in 2010—the last year of its implementation (Part I of the
report). This third survey ends the cycle of annual reports prepared by the
Polish Institute of International Affairs. The end of the Lisbon Strategy
provided not only a good opportunity to carry out an overall assessment
(contained in Part II of the report) but also a focus on more forward-looking
issues concerning the new economic governance architecture that includes
governance of the Europe 2020 strategy (Part III of the survey). The methodology
of the report remains unchanged compared to previous editions.
1
2. The EU has still been struggling with the effects of the financial and economic
crisis, which
initiated
serious fiscal problems
in
Member
States.
Macroeconomic data for 2010 showed a visible gap between Member States
with respect to the pace of recovery and the fiscal situation. Recovery in some
Member States has been fragile and does not provide a strong framework to
conduct the harsh budgetary consolidation required.
3. There was no substantial progress with respect to entrepreneurship in 2010.
The key problems (effectiveness of commercial judicature and bankruptcy
proceedings) have not been tackled effectively. The EU is on the right track to
achieve targets concerning a reduction of administrative burdens.
4. The Lisbon progress referring to the single market was rather limited in 2010.
Transposition of the Services Directive was not completed. Key bottlenecks
remain in many segments of the market, such as energy, telecommunication
and railways. A positive element is that the EU effectively managed to control
state aid granted to the financial sector during the crisis.
5. The Knowledge Triangle assessment indicates stagnation in lifelong learning,
higher education development and R&D spending, which is far below the
goal of 3% of GDP. Mathematics and science literacy shows that there is no
real distinction between EU-12 and EU-15. Progress was observed in the
development of patent issue during the Belgian presidency.
6. The rates of Internet users and fixed and mobile broadband penetration are
gradually increasing. The e-government services availability represents a
mixed picture as there are large differences between the Member States, with
a group of laggards that have difficulty closing the gap with the other EU
members.
7. As far as energy and climate change are concerned, the EU-15 will probably
meet the Kyoto targets. The figures show modest progress in generating
electricity from renewable resources and cogeneration.
8. The recent economic and financial crisis has had an adverse effect on
employment and social policy, touching especially young people and groups
at risk of poverty. A difficult fiscal situation makes it problematic to use public
instruments to fight against unemployment or to soften its repercussions.
From Lisbon to Europe 2020
Lisbon
Strategy
7
1
An analysis of the Strategy’s implementation is difficult in the absence of updated and complete
statistical data, especially in such fields as the Knowledge Triangle, social affairs, energy and climate.
Hence it has not been possible to present 2010 statistics in all the segments, and the Report is based on
figures and information last updated in mid-March 2011.

9. The Lisbon Strategy, which is largely considered to have been a failure,
should be assessed taking into account broader economic and political
contexts and different results achieved by the particular Member States.
During the last 10 years, the EU economy experienced two crises, including
the deepest one since the Great Depression. The Strategy suffered from weak
management tools as well as a lack of political interest from most of the
Member States. If Europe 2020 is to score better, lessons from Lisbon must be
taken into account.
10. The strengthening of economic governance, especially in non-fiscal
dimensions, can improve prospects for the successful implementation of
Europe 2020. However, the key condition for a good outcome is in retaining
political ownership of the Strategy at the highest level.
The Polish Institute of International Affairs
8
Lisbon
Strategy

Part I

1. Economy
The recent global economic and financial has crisis affected very seriously the EU
economy. According to the Commission, it wiped out four years of growth in the EU.
2
The EU economy exited from the recession in the third quarter of 2009, but the path of
recovery has been very slow and uneven, exactly as was the case a year ago.
3
In some
respect, this is a part of a global trend for developed economies. The main points of risk
shifted in 2010 from the financial sector to the fiscal situations of the EU Member States,
especially in the euro area. The situation in financial sector is, however, far for stable.
1.1. General Economic Situation
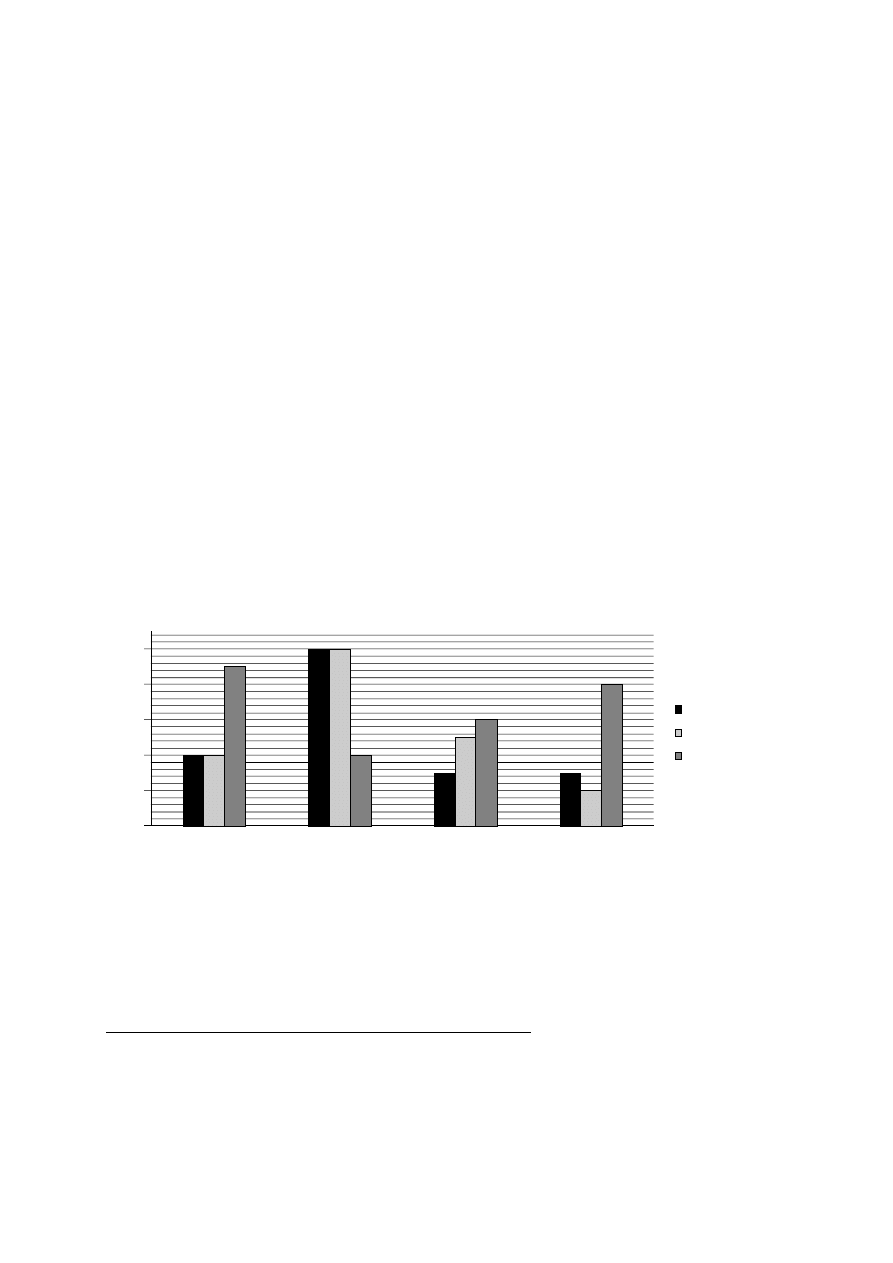
Quarterly GDP growth in the EU peaked in the second quarter of 2010, when
GDP in both the EU and the euro area grew by 1% in comparison to the previous
quarter. GDP growth amounted to 2% in the second quarter (year to year). Such growth
was mainly the result of a strong performance by the German economy, which grew by
2.2% quarter to quarter and by 3.9% year to year. This good economic picture in
Germany was because of a picking up of exports.
4
During the two last quarters, growth
was slower (0.3% quarter to quarter in the euro area in the third and fourth quarters and
0.5% and 0.2%, respectively, in the EU-27).
Chart 1. Quarterly GDP Growth
Source: Eurostat.
The Commission’s estimates for 2010, published last autumn, delivered a slightly
more optimistic picture than those presented in the spring. The GDP in the EU and the
euro area grew respectively by 1.8% and 1.7% (both about 0.8 pp higher than estimated
by the Commission in the spring). Despite the upward revision of estimates, these figures
are lower than world output (5.0%, according to IMF estimates),
5
the U.S. (2.7%) and
Japan (3.5%). The highest rates were predicted for Sweden (4.8%), Slovakia (4.1%),
From Lisbon to Europe 2020
Lisbon
Strategy
11
GDP
0
0,2
0,4
0,6
0,8
1
I quarter
II quarter
III quarter
IV quarter
euro area
EU-27
USA
2
European Commission, Annual Growth Survey, Annex 2: Macro-economic Report, p. 6,
http://ec.europa.eu/europe2020/pdf/2_en_annexe_part1.pdf (accessed on 13 January 2011).
3
See. M. Koczor, Lisbon Strategy Implementation in 2009: An Analysis, pp.13–24, www.pism.pl/
zalaczniki/report_LS_2009.pdf (accessed on 12 December 2010).
4
European Commission, European Economic Forecast 2010, Autumn 2010, p. 76, http://ec.europa.eu/
economy_finance/publications/european_economy/2010/pdf/ee-2010-7_en.pdf (accessed on 1 December 2010).
5
IMF, World Economic Outlook Update, January 2011, p. 2, www.imf.org/external/pubs/ft/
weo/2011/update/01/pdf/0111.pdf (accessed on 30 January 2011).

Germany (3.7%) and Poland (3.5%). A relatively good picture also can be expected in
other Nordic states (estimated growth in Finland and Denmark is, respectively, 2.9% and
2.3%) and Czech Republic (2.4%). The worst situation is in Greece (its GDP may contract
by 4.2%). Others with shrinking economies include Romania (–1.9%), Latvia (–0.4%),
Ireland (–0.2%), Spain (–0.2%) and Bulgaria (–0.1%). This decline is, to a large extent, a
result of huge consolidation efforts undertaken in order to repair public finances.
The main factor that drove growth in the EU and euro area was exports, which
soared by 4% (quarter to quarter) in the second quarter of 2010. In the whole EU,
exports of goods and services grew by 10.2% compared to 2009, though that year
exports declined by 12.5% (in the euro area, 10.7% and -13.2%, for the respective
years). Domestic demand remains subdued and increased only by 1.3% in the EU and
0.9% in the euro area (in 2009, domestic demand fell by 4.1% and 3.5%, respectively).
Private consumption rose slightly, by 0.6%, in the euro area and 0.7% for the EU-27.
Recovery would be stronger if investment fully rebounded. This was not the case.
Total investment dropped by 0.8% in the euro area and 0.6% in the EU. However, the
scale of the decrease is rather limited in comparison to the decrease in 2009.
Financial conditions in the EU improved, and banks eased credit criteria for
households. However, access to credit has still been difficult for enterprises. The
situation in the European financial sector has not yet returned to optimum. A relatively
good picture of bank health that emerged after the results of stress tests had been
published in late July 2010 was not fully convincing as many market analysts and
observers argued that overly optimistic assumptions had been used to conduct the
tests.
6
Some problems in the banking sector (e.g., related to toxic assets) have not been
fully solved. The serious risk for the banking sector would be a wider spread of the
sovereign-debt crisis within the eurozone, because of the banks’ high levels of exposure
to this debt. European banks are seriously exposed to their individual countries’ debts
(i.e., about 226% of Greek banks’ Tier 1 capital is Greek sovereign debt). Sovereign
debt exposures of EU banks are estimated to be more than €1.6 trillion.
7
The total
exposure of European banks to the public and private debts of Greece, Ireland, Italy,
Portugal and Spain amounted to more than $2.5 trillion in the third quarter of 2010.
8
The development of a solution to the EU banking sector‘s involvement in the
sovereign-debt crisis and the effectiveness of consolidation efforts will be crucial for
economic growth in the EU in the short-term. Risks in the euro area are balanced, and there
are some optimistic signals about the expansion of domestic demand and business
investment.
9
The Polish Institute of International Affairs
12
Lisbon
Strategy
6
Stress test was conducted by the Committee of European Banking Supervisors in cooperation
with national supervisors, the European Commission and the ECB. Ninety-one European banks
representing 65% of the European market underwent a scrutiny. The exercise showed that European
banks have sufficient resistance to negative macroeconomic and financial shocks. Eighty-four banks have
their Tier 1 capital ratios above the required level (6%). Among seven banks that did not pass the test are
five Spanish savings banks (Cajas), one Greek bank and one from Germany.
7
This amount refers to the banking book value (securities held by banks that are not traded and held
to maturity). Source: A.Blundell-Wignall and P. Slovik, The EU Stress Test and Sovereign Debt Exposures,
OECD Working Papers on Finance, Insurance and Private Pensions, no. 4, OECD Financial Affairs.
Division, 2010, p. 7, www.oecd.org/dataoecd/17/57/45820698.pdf (accessed on 15 January 2011).
8
Own calculations based on Bank of International Settlements’ data. Exposure to Greece
amounted to $153.6 billon; Ireland, 564.5 billion; Italy, 902 billion; Portugal, 215.9 billion; and Spain,
726.9 billion. Source: M. Stabe, R. Minto, P. Feeney and S. Bernard, “Bank, Exposure: The Eurozone risk,”
Financial Times, 28 January 2011, www.ft.com/cMember States/s/0/9686c004-fca4-11df-bfdd-00144f
eab49a.html#axzz1DfiKpHuW (accessed on 30 January 2011).
9
OECD, Economic Outlook, no. 88, November 2010, p. 88.

Table 1. GDP in 2010
Country
2009
2010 (estimate)
2011 (forecast)
AT
–3.9
2.0
1.7
BE
–2.8
2.0
1.8
BG
–4.9
–0.1
2.6
CY
–1.7
0.5
1.5
CZ
–4.1
2.4
2.3
DE
–4.7
3.7
2.2
DK
–5.2
2.3
1.9
EE
–13.9
2.4
4.4
EL
–2.3
–4.2
–3.0
ES
–3.7
–0.2
0.7
FI
–8.0
2.9
2.9
FR
–2.6
1.6
1.6
HU
–6.7
1.1
2.8
IE
–7.6
–0.2
0.9
IT
–5.0
1.1
1.1
LT
–14.7
0.4
2.8
LU
–3.7
3.2
2.8
LV
–18.0
–0.4
3.3
MT
–2.1
3.1
2.0
NL
–3.9
1.7
1.5
PL
1.7
3.5
3.9
PT
–2.6
1.3
–1.0
RO
–7.1
–1.9
1.5
SE
–5.1
4.8
3.3
SI
–8.1
1.1
1.9
SK
–4.8
4.1
3.0
UK
–5.0
1.8
2.2
EU-27
–4.2
1.8
1.7
Euro area
–4.1
1.7
1.5
USA
–2.7
2.7
2.1
Japan
–5.2
3.5
1.3
China
9.1
10.5
9.2
Source: European Commission, European Economic Forecast, Autumn 2010.
From Lisbon to Europe 2020
Lisbon
Strategy
13
EU GDP growth was to some extent the result of stimulus actions, which were
continuing in 2010 under the framework of the European Economic Recovery Plan.
10
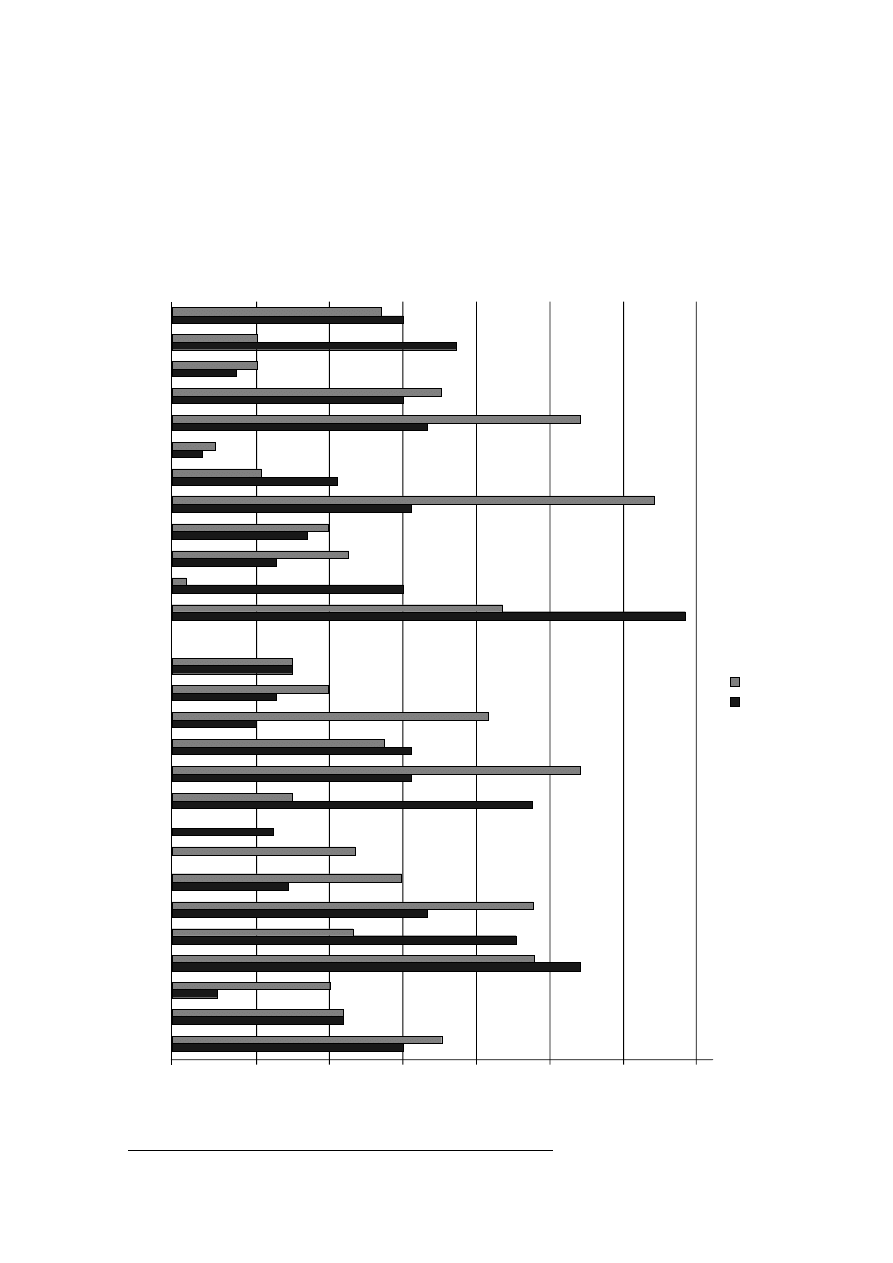
According to the Commission’s data, the value of discretionary stimulus measures was
1.4% of EU GDP in 2010 (1.5% in 2009), and the majority of adopted measures have a
temporary character.
Chart 2. Discretionary Fiscal Stimulus in the EU in 2009–2010 (%GDP)
Source: European Commission, Public finances in EMU 2010.
The Polish Institute of International Affairs
14
Lisbon
Strategy
0
0,5
1
1,5
2
2,5
3
3,5
AT
BE
BG
CY
CZ
DE
DK
EE
EL
ES
FI
FR
HU
IE
IT
LT
LU
LV
MT
NL
PL
PT
RO
SE
SI
SK
UK
EU
2010
2009
10
See: M. Koczor, Lisbon Strategy: Implementation in 2008: An Analysis, p. 23, www.pism.pl/
zalaczniki/raportSL_ang.pdf (accessed on 12 December 2010).

1.2. Fiscal Situation in the EU
The crisis deteriorated public finances across the EU. The Excessive Deficit
Procedure has been opened against all Member States with the exception of Estonia,
Luxembourg and Sweden (according to the Commission, estimates of the public sector
deficits in these states were 1.0%, 1.8% and 0.9%, respectively). The estimated general
government deficit remained roughly unchanged compared to the previous year for
both the EU and the euro area (6.8% and 6.3%, respectively). According to Commission
forecasts, the deficits will begin to fall to 5.1% in the EU-27 and 4.6% in the euro area in
2011, when consolidation efforts will be triggered by many Member States within the
framework of the fiscal exit strategy, which was endorsed by ECOFIN in October 2009.
In Member States grappling with huge deficits, consolidation has been ongoing and
needs to be very tight. The highest level of estimated general government deficit is in
Ireland (32.3% GDP), which has, however, an exceptional character because of the
costs of restructuring the Irish banking sector incurred by the state budget. Estimates of
the amount of public deficit were 10.5% in UK and 9.6% in Greece. A bleak situation in
this respect is also noted in Poland, Slovakia and Spain.
High deficits triggered higher borrowing needs by the Member States. According
to the ECB, borrowing needs in euro area Member States amounted to 26% of GDP in
2010, compared to 14% in 2007.
11
Greater borrowing needs are reflected in rising debt
levels—estimated public debt soared by more than five percentage points in the EU and
euro area (to 79.1% and 84.1%, respectively). According to the Commission’s
projections, public debt in 2011 will rise to 81.8% of GDP in the EU and 86.5% in euro
area. OECD’s estimations concerning debt in the euro area showed similar data: 84% in
2010 and 87% in 2011.
12
The highest debt burdens are noted in Greece (140.2% of GDP), Italy (118.9%),
Belgium (98.6%) and Ireland (97.4%).
Table 2. Fiscal Indicators in the EU
Country
Public deficit/surplus
(general government), % GDP
Public debt
(general government), % GDP
2009
2010
2009
2010
AT
–3.5
–4.3
67.5
70.4
BE
–6.0
–4.8
96.2
98.6
BG
–4.7
–3.8
14.7
18.2
CY
–6.0
–5.9
58.0
62.2
CZ
–5.8
–5.2
35.3
40.0
DE
–3.0
–3.7
73.4
75.7
DK
–2.7
–5.1
41.5
44.9
From Lisbon to Europe 2020
Lisbon
Strategy
15
11
European Central Bank, Financial Stability Review, December 2010, p. 58, www.ecb.int/pub/
pdf/other/financialstabilityreview201012en.pdf?a08d9014dc9765db19857609d29cb19e (accessed on
20 December 2010).
12
OECD, Economic Survey: Euro area, vol. 20, December 2010, Supplement 2, p. 20.

Country
Public deficit/surplus
(general government), % GDP
Public debt
(general government), % GDP
2009
2010
2009
2010
EE
–1.7
–1.0
7.2
8.0
EL
–15.4
–9.6
126.8
140.2
ES
–11.1
–9.3
53.2
64.4
FI
–2.5
–3.1
43.8
49.0
FR
–7.5
–7.7
78.1
83.0
HU
–4.4
–3.8
78.4
78.5
IE
–14.4
–32.3
65.5
97.4
IT
–5.3
–5.0
116
118.9
LT
–9.2
–8.4
29,5
37.4
LU
–0.7
–1.8
14.5
18.2
LV
–10.2
–7.7
36.7
45.7
MT
–3.8
–4.2
68.6
70.4
NL
–5.4
–5.8
60.8
64.8
PL
–7.2
–7.9
50.9
55.5
PT
–9.3
–7.3
76.1
82.8
RO
–8.6
–7.3
23.9
30.4
SE
–0.9
–0.9
41.9
39.9
SI
–5.8
–5.8
35.4
40.7
SK
–7.9
–8.2
35.4
42.1
UK
–11.4
–10.5
68.2
77.8
Euro area
–6.3
–6.3
79.1
84.1
EU-27
–6.8
–6.8
74.0
79.1
Source: European Commission, European Economic Forecast, Autumn 2010.
1.3. Inflation
The risk of inflation was moderated both in the eurozone and in the whole EU for
most of 2010, however it was growing during the last month of the year (HICP inflation
in the euro area was 2.2% in December, which exceeded the ECB’s target). The upward
risks included rising global commodity prices, especially a sharp rise in agricultural
products. These factors are offset by a still weak economic situation in Europe. Inflation
in the euro area was estimated to amount to 1.5% and 2.0% in the EU in 2010.
Deflation was indicated in Ireland (–1.5%) and Latvia (–1.3%). The highest level of
inflation was noted in Romania (6.1%), Hungary (4.7%), and Greece (4.6%).
The Polish Institute of International Affairs
16
Lisbon
Strategy

Table 3. Inflation Rate in EU (HICP) in 2010
EU-27
EA
AT
BE
BG
CY
CZ
DE
DK
EE
2.0
1.5
1.7
2.3
2.9
2.8
1.2
1.1
2.2
2.7
EL
ES
FI
FR
HU
IE
IT
LT
LU
LV
4.6
1.7
1.6
1.7
4.7
–1.5
1.6
1.2
2.8
–1.3
MT
NL
PL
PT
RO
SE
SI
SK
UK
1.9
1.0
2.6
1.4
6.1
1.8
2.1
0.7
3.2
Source: European Commission, European Economic Forecast, Autumn 2010.
1.4. EU Actions in Response to the Sovereign Debt Crisis among Member States
in 2010
The fiscal situation in Greece triggered serious problems in the euro area,
spreading the risk of contagion to other PIIGS states (Portugal, Ireland, Italy, Greece,
Spain). The approval of €110 billion in financial support for Greece by the Eurogroup
on 2 May 2010 was preceded by weeks of uncertainty by market investors concerning
the timing, character and size of such support.
13
Markets were not reassured by political
declarations about the EU readiness to provide support to Greece, but they were
expecting concrete actions. As a result, confusing signals from EU Member States and
institutions had contributed to some extent to increased market turmoil and the risk of
contagion.
14
A further worsening of the situation in late April and early May in the euro
area required serious steps in order to preserve its stability. EU leaders were forced to
adopt far-reaching measures in this respect to prevent investors from panicking. Against
this background, the ECOFIN Council on 9–10 May decided to set up a stabilisation
framework, which has a hybrid character and consists of three elements:
– European Financial Stabilisation Mechanism—the EU instrument based on
Art. 122.2 TFEU. It can provide loans or lines of credit (up to EUR 60 billion),
which originate from loans drawn on financial markets by the Commission (the
EU budget’s own resources as a collateral). A decision about resources granted
through this instrument may be made by a qualified majority of the Council.
– European Financial Stability Facility—it is a Special Purpose Vehicle company
located in Luxembourg whose main task is to issue bonds (up to €440 billion
over three years) that are backed by guarantees from euro area Member States
proportionate to their contribution to ECB capital and voluntarily by other EU
countries (Sweden and Poland declared an initial willingness to participate in
From Lisbon to Europe 2020
Lisbon
Strategy
17
13
On 23 April 2010, a Greek government official requested activation of the financial support
programme. Under an agreement, made by the heads of state or government from the euro area countries
on 25 March 2010, the programme is to consist of two-thirds bilateral loans made by these states and
one-third from resources provided by the IMF. The various Euro area state contributions to the bailout
programme are determined on the basis of their respective shares in the capital of the European Central
Bank (ECB). The programme was based on very broad and detailed conditions. A review of progress is
conducted quarterly by the joint missions of the European Commission ECB and IMF. On the basis of
results of the review, each disbursement is released. Greece received €38 billion (€27.5 billion from rest
of the euro zone members and €10.5 billion from the IMF) through January 2011.
14
J. Carmassi, S.Micossi, The role of politicians in inciting financial markets to attack the
eurozone, EuropEos, no. 4, 21 June 2010.

this mechanism). A decision about the activation of resources from this
mechanism is taken unanimously by the Eurogroup;
– IMF involvement that would amount to half of the European contribution
(€250 billion).
In addition to the measures approved by the ECOFIN Council, the ECB
Governing Council decided to buy eurozone treasury bonds on the secondary market. It
has also initiated additional liquidity operations, including the provision of funds in U.S.
dollars (on the basis of a swap agreement with the U.S. Federal Reserve).
The main goal of establishing the framework was to create a climate in which
using this mechanism would not be necessary. The EU managed to calm tensions in the
markets until autumn 2010. At the end of October, a second wave of market panic
spread across the eurozone after signals that private investors would participate in
a future crisis-resolution framework mechanism. The message was first delivered by
Angela Merkel and Nicolas Sarkozy in their joint declaration from Deauville in mid-
October 2010.
15
Several days later, the European Council agreed that such a stability
mechanism should be set up and that the private sector needed to participate in the new
resolution system. Head of states or governments also agreed that a moderate
modification of the Treaty (TFEU) should be introduced that allowed the creation of this
mechanism. Unfortunately, EU leaders did not correctly predict the negative reactions
of investors. Spreads between Portuguese, Spanish or Irish and German bonds were
quickly going up and euro exchange rate against the U.S. dollar began falling again after
only a few months on the rebound.
These uncertainties were especially painful for Ireland, which began to be
perceived as the weakest part of the euro area. In the meantime, the Irish authorities
were underlining that the country had satisfied its borrowing needs until mid-2011. Still,
many investors were sure that financial support for Ireland would be unavoidable.
Indeed, in November Ireland requested international financial support and the Euro-
group and ECOFIN, in cooperation with the IMF, agreed to provide it €67.5 billion.
16
Investors then shifted their attention towards Portugal and Spain and were wondering
whether these counties would be next in line for support.
In order to calm down market participants, the Eurogroup clarified the main
features of the future permanent resolution mechanism, especially the role of the private
sector. According to Eurogroup’s statement, the European Stability Mechanism (ESM)
will replace EFSM and EFSF after 30 June 2013, and any assistance provided by the new
instrument would be strictly conditional. The participation of private investors will be
based on a case-by-case basis and according to IMF policies. As euro area ministers
underlined “for countries considered solvent (…) the private sector creditors would be
The Polish Institute of International Affairs
18
Lisbon
Strategy
15
Franco-German Declaration, Statement for the France-Germany-Russia Summit Deauville
– Monday, 18 October 2010, www.elysee.fr/president/root/bank_objects/Franco-german_declaration.pdf
(accessed on 1 December 2010).
16
Out of this volume, €22.5 billion are available through the IMF, €22.5 billion from EFSM,
€17.7 billion from EFSF and €4.8 billion is provided from bilateral loans from the UK (€3.8 billion),
Sweden (€600 million) and Denmark (€400 million). These funds will cover the Irish budgetary financial
needs. Under an agreement between Irish authorities and the EU, Ireland contributed (through the
Treasury cash buffer and investments of the National Pension Reserve Fund) €17.5 billion to finance half
the costs related to support for banking sectors, with the remaining part to be covered by external support.
See: Statement by the Eurogroup and ECOFIN Ministers, 28 November 2010, www.consilium.europa.
eu/uedocs/cMember States_data/docs/pressdata/en/ecofin/118051.pdf
.

encouraged to maintain their exposure according to international rules and fully in line
with IMF practices. In the unexpected event that a country would appear to be
insolvent, the Member State has to negotiate a comprehensive restructuring plan with its
private sector creditors, in line with IMF practices with a view to restoring debt
sustainability.” According to the statement, collective action clauses (CACs) will be
enshrined to all euro area bonds from June 2013.
17
The European Council endorsed this
statement in December and agreed on a text of a draft decision concerning Treaty
modification. According to the agreed schedule, this decision should be ratified by all
Member States by the end of 2012 and enter into force on 1 January 2013.
18
In addition
to that decision, euro area leaders stated they were committed to undertaking
comprehensive actions in order to safeguard the euro area. These actions include
among others: strict implementation of fiscal consolidation programmes, adoption of
structural reform, completion of economic governance reform, availability of adequate
financial support through the EFSF and a strengthening of the financial system.
19
On
16 December 2010, the Governing Council of the ECB decided to increase its
subscribed capital from €5.76 billion to €10.76 billion in order to keep a sufficient level
of paid-up capital that should be equal to provisions and reserves.
20
1.5. Conclusions
The EU economy, especially the euro area, in 2010 went through another stage
of the global financial and economic crisis—this time the fiscal crisis. As a result, fiscal
adjustments had to become top priority for a vast majority of Member States; hence,
they sped up exit strategies.
The Commission underlines that a fiscal correction by the standard benchmark of
0.5% may be insufficient in order to reduce public debt to close to 60% by 2030 in
many Member States.
21
A fiscal correction of 1.0% increases the chances of achieving
a credible reduction path through this period.
According to the OECD, the biggest consolidation efforts in order to stabilise the
debt-to-GDP ratio by 2025 are required in Ireland, Poland, Portugal, Slovakia and the
UK.
22
Due to the sovereign debt crisis in the eurozone, the biggest consolidation, apart
from Greece and Ireland, needs to be in Spain and Portugal. All of these countries
From Lisbon to Europe 2020
Lisbon
Strategy
19
17
Statement by the Eurogroup, 28 November 2010, www.consilium.europa.eu/uedocs/cMem
berStates_data/docs/pressdata/en/ecofin/118050.pdf (accessed on 12 December 2010).
18
According to this decision, the following paragraph will be added to Art. 136 TFEU: “The
Member States whose currency is the euro may establish a stability mechanism to be activated if
indispensable to safeguard the stability of the euro area as a whole. The granting of any required financial
assistance under the mechanism will be made subject to strict conditionality.”
19
European Council Conclusions, 16–17 December 2010, annex III, www.consilium.europa.
eu/uedocs/cMember States_data/docs/pressdata/en/ec/118578.pdf (accessed on 18 December 2010).
20
According to this decision, euro area national central banks (NCB) will pay approximately
€3.5 billion in three equal annual installments. The first installment was paid on 29 December. The
non-euro central banks will subscribe to the rest of this amount but their real payments will be minor
(€84 220 on 29 December 2010), source: ECB increases its capital, www.ecb.int/press/pr/
date/2010/html/pr101216_2.pl.html (accessed on 20 December 2010).
21
European Commission, Annual Growth Survey: Macroeconomic Report, p. 11. http://ec.euro
pa.eu/ europe2020/pdf/2_en_annexe_part1.pdf (accessed on 14 January 2011).
22
OECD, Economic Outlook, preliminary version 88, November 2010, p. 220.

already have adopted harsh measures, but they will have to take further actions in order
to calm market tensions.
A reconciliation of consolidation efforts with pro-growth actions can be even
harder to reach than was previously expected. Consolidation in the EU had to begin when
the economy was not yet fully back on the right track. This may negatively affect
economic growth in the EU. However, the impact of consolidation on growth depends on
the character and composition of adopted measures. In the case of expenditure cutting, a
reduction in government investment can hamper GDP more than a reduction of transfers,
which usually contribute to growth only to a limited extent.
23
The effects of consolidation
on the revenue side (mainly by increasing taxes) depends to a large extent on the type of
taxes that are increased. Raising direct income taxes can bring about more negative
implications for growth than an increase in some indirect taxes (such as excise taxes).
According to the Commission, successful consolidation depends on:
– the composition of fiscal adjustment;
– the credibility of the policy strategy;
– strong
fiscal
institutions
that
will
be
responsible
for
the
smooth
implementation of consolidation;
– the adoption of structural reform that will supplement fiscal adjustment; and,
– the minimisation of negative effects of adjustment on social issues.
24
Debt-accumulation can have a negative impact on growth. According to Carmen
M. Reinhart and Kenneth Rogoff, debt level that exceeds 90% of GDP can lead to
a reduction of median growth rates by 1.0%.
25
Among ways by which debt can
influence GDP are: national savings/interest rates, the introduction of distortional taxes
(i.e., labour and property taxation) or impact of risk premiums. The effectiveness of
consolidation in great respect depends on the quality of the national fiscal framework
26
and the determination of the government to implement reforms.
The key conditions for long-term growth prospects in the EU are:
– the repair of public finances;
– a resolution to the problem of external imbalances;
– reinforcement of fiscal and non-fiscal macroeconomic surveillance in the EU;
– the setting up of a permanent crisis resolution mechanism, including a debt
restructuring option; and,
– the strengthening of the banking sector in the EU by e.g. restructuring of banks.
Meeting all these conditions is required in order to ensure that growth in the EU
will not be at risk. In case of a lack of sufficient reform and actions, EU growth prospects
will be very bleak (according to the EC’s projections it could be around 1.5% for the
period 2011–2020). Despite the commitments of leaders to do everything possible to
safeguard the stability of the euro area, strong criticism has risen from many experts and
observers. They state that EU actions are not sufficient in the face of the scale of the crisis
and the EU has failed to deliver effective solutions to tackle existing problems.
The Polish Institute of International Affairs
20
Lisbon
Strategy
23
European Commission, European Economic Forecast, Autumn 2010, p. 37.
24
European Commission, Annual Growth Survey: Macroeconomic Report, p. 13.
25
European Commission, European Economic Forecast, Autumn 2010, p. 34.
26
European Commission, Public Finances in the EMU in 2010, p. 6.

Reaction of the EU to the sovereign-debt crisis in Europe shows a lack of good
communication between markets and the EU. Wolfgang Münchau, columnist for the
Financial Times describes this mechanism as “[T]he EU has a tendency to hype
whatever it agrees. The markets first react with euphoria to the announcement then with
disappointment once they have read the small print.”
27
One of the factors that
contributed to such a situation has been a lack of coherence between leaders about
what needs to be done. Contrary messages that were flowing from EU officials and from
key countries, especially Germany (about the potential involvement of the IMF in the
case of Greece and later about the role of the private sector and euro-bonds) gave wrong
signals to the markets, broadening uncertainty among investors. Despite the above-
mentioned weaknesses, the EU has proven its ability to adopt fast decisions when
needed (as in the case of the stabilisation framework in May and the limited Treaty
change). This fact underpins opinion that the political will to safeguard the euro area is
high.
Among further proposals formulated in response to the crisis are the creation of
euro-bonds, an increase in the amount of the EFSF or the restructuring of debt.
28
The
situation in the euro area is very dynamic and hardly predictable. A logic of
a self-fulfilling prophecy seems to be an important driving force behind investor
decisions. Against this background, the scenario that other countries from the PIIGS
group could require financial support is very realistic.
1.6. Evaluation
1.6.1. Positive
Germany is once again an engine of growth in the European economy. In the
second quarter of 2010, growth in Germany was the highest since the country’s
reunification. Trade returned to its pre-crisis level, and domestic consumption increased.
Germany will start the implementation of fiscal consolidation in 2011. This good
performance improves the economic and political responsibility of Germany to safeguard
the euro area. The largest economy in Europe seems to be built on more sustainable
fundamentals than the rest of the euro area. Germany did not experience a housing
market bubble and it introduced structural reforms before the crisis, which improved
flexibility in the labour market. Clearly, strong growth in Germany has a direct influence
on other economies in the EU via a spill-over effect. According to the Commission, such
effects are substantial for other states in the euro area and the EU as a whole.
29
1.6.2. Negative
The roots of Greek and Irish problems are different, but both are struggling with
similar effects, namely mounting deficit and debt. It seems probable that both these
states, especially Greece, may not avoid a restructuring of their debt.
From Lisbon to Europe 2020
Lisbon
Strategy
21
27
W. Münchau, “Total Überfordert,” Financial Times, 6 December 2010.
28
The proposal of euro-bonds was put forward by Jean-Claude Juncker and Giulio Tremonti
“Issuing E-bonds: A way to overcome the current crisis,” Financial Times, 6 December 2010.
29
European Commission, European Economic Forecast, Autumn 2010, p. 16.

1.7. Recommendations
1. EU Member States need to introduce comprehensive actions in order to get
back on a sustainable track to growth and to restore the health of their public
finances. Reconciliation of these two priorities has remained a real challenge
for the vast majority of Member States. Against this background, the
introduction of the European semester for economic policy coordination can
provide a good framework for implementation of the priorities.
2. Consolidation efforts should be implemented, though better coordinated
between the Member States in order to avoid a negative spill-over effect
across the EU. The framework of the exit strategy adopted by ECOFIN in
October 2009 should be adjusted to take into account the current situation
related to the debt problems in the euro area and growth prospects.
3. According to the December 2010 European Council conclusions, the
adoption of legislative proposals on economic governance should be
completed by summer 2011.
4. Broad discussion about long-term solutions for safeguarding the euro area
(such as euro-bonds) should be conducted, but potential decisions have to be
fully coherent with the ESM framework.
2. Entrepreneurship
An improved climate for running a business in the EU was of one the key goals of
the Lisbon Strategy from the outset. The progress achieved in recent years was not
sufficient to create stable and favourable conditions for entrepreneurship in the EU. The
final year of the implementation of the Lisbon Strategy could not have changed the
overall picture that was shaped in previous years.
2.1. Registration of Business Activity
EU Member States have been paying increased attention to the improvement of
start-up conditions for a few years. However, overall progress still has been uneven
among the Member States. The group of leading countries does not change much
compared to previous PISM reports and includes Belgium, Denmark and Slovenia. The
overall picture of progress is rather bleak. Only in the case of the time required to
complete all registration procedures was small progress indicated (the average number
of days decreased from 15.1 in 2009 to 14.6 in this year’s report). The average number
of required procedures for business registration in the EU remains unchanged (5.9).
Moreover, the costs of business registration went up (from 5.3% to 5.7% of income per
capita). However, according the European Commission, the average cost of registration
of a limited company decreased from €417 in 2009 to €399 in 2010.
30
It is difficult to
find any Member State where registration conditions are tangibly better than one year
ago. Germany, Italy, Lithuania, Luxembourg and the Netherlands achieved progress
with respect to the time it takes to register a business. In some countries, the situation is
The Polish Institute of International Affairs
22
Lisbon
Strategy
30
See: Start-up procedures under the Lisbon Agenda for Growth and Jobs. Actions in 2010,
http://ec.europa.eu/enterprise/policies/sme/business-environment/start-up-procedures/progress-2010/ind
ex_en.htm (accessed on 25 February 2011).

even slightly worse than last year (in the Czech Republic all three indicators show a
less-favourable situation with respect to setting up a business than one year ago). The
worst registration conditions persist in Greece, Poland and Spain.
Table 4. Registration of a Business in the EU
Country
Time (days)
Number of procedures
Costs % GNI
2009
2010
2009
2010
2009
2010
AT
28
28
8
8
5.1
5.1
BE
4
4
3
3
5.3
5.4
BG
18
18
4
4
1.7
1.6
CY
8
8
6
6
13.3
12.6
CZ
15
20
8
9
9.2
9.3
DE
18
15
9
9
4.7
4.8
DK
6
6
4
4
0.0
0.0
EE
7
7
5
5
1.7
1.9
EL
19
19
15
15
10.9
20.7
ES
47
47
10
10
15.0
15.1
FI
14
14
3
3
0.9
1.1
FR
7
7
5
5
0.9
0.9
HU
4
4
4
4
8.0
8.2
IE
13
13
4
4
0.3
0.4
IT
10
6
6
6
17.9
18.5
LT
26
22
7
6
2.4
2.8
LU
24
19
6
6
1.8
2.1
LV
16
16
5
5
2.1
1.5
NL
10
8
6
6
5.6
5.7
PL
32
32
6
6
17.9
17.5
PT
6
6
6
6
6.4
6.5
RO
10
10
6
6
2.9
2.6
SE
15
15
3
3
0.6
0.6
SI
6
6
3
2
0.0
0.0
SK
16
16
6
6
2.0
1.9
UK
13
13
6
6
0.7
0.7
Average EU
15.1
14.6
5.9
5.9
5.3
5.7
USA
6
6
6
6
0.7
1.4
Source: Doing Business 2011: the European Union, http://doingbusiness.org/~/media/FPDKM/Doing
%20Business/Documents/Profiles/Regional/DB2011/DB11-European-Union.pdf; Doing Business
2010: the European Union, http://doingbusiness.org/~/media/FPDKM/Doing%20Business/
Documents/Profiles/Regional/DB2010/DB10-European-Union.pdf.
From Lisbon to Europe 2020
Lisbon
Strategy
23

2.2. Registration of Property
In the analyzed period, progress was achieved only in the case of the time
necessary for property registration in the EU: the average time needed for registration
fell from 51.6 to 35.2 days. Taking into account that the average number of procedures
remained unchanged in comparison to last year’s report (5), it can be assumed that
a speeding up of this process at the administrative level could be a result of more
effective work by public institutions with respect to all the procedures required.
Unfortunately, a faster pace for the registration process was not reflected in the level of
registration costs—they even slightly increased (from 4.6% of property costs to 4.8%).
Portugal is the leader of overall progress and achieved substantial progress in the
reduction of time (from 12 to 1 days) and procedures (from 5 to 1). This improvement
allowed Portugal to become the EU frontrunner in this field. A good picture is seen in
Lithuania (where registration can be completed in three days and in three procedures).
Some progress was achieved, among others, in Denmark (where the number of
procedures fell by three), France (the time of registration decreased by 39 days),
Slovenia (time of registration was reduced from 391 to 113 days), Poland (time of
registration fell by 45 days) and Hungary (costs fell by six percentage points). In Greece,
registration costs went up, and in the Netherlands both the time required and the
number of procedures increased.
Table 5. Registration of Property
Country
Time (days)
The number of procedures
Costs (% property value)
2009
2010
2009
2010
2009
2010
AT
32
21
3
3
4.5
4.5
BE
79
79
7
8
12.7
12.7
BG
15
15
8
8
2.3
3.0
CY
34
34
3
3
10.0
10.0
CZ
78
43
4
4
3.0
3.0
DE
40
40
4
5
5.2
5.1
DK
42
42
6
3
0.6
0.6
EE
18
18
3
3
0.5
0.5
EL
22
22
11
11
4.0
12.7
ES
18
18
4
4
7.2
7.1
FI
14
14
3
3
4.1
4.0
FR
98
59
8
8
6.1
6.1
HU
17
17
4
4
11.0
5.0
IE
38
38
5
5
6.7
6.3
IT
27
27
8
8
4.6
4.5
LT
3
3
2
3
0.5
1.9
LU
29
29
8
8
10.3
10.2
LV
45
42
6
6
2.0
2.0
The Polish Institute of International Affairs
24
Lisbon
Strategy

Country
Time (days)
The number of procedures
Costs (% property value)
2009
2010
2009
2010
2009
2010
NL
5
7
2
5
6.2
6.1
PL
197
152
6
6
0.5
0.4
PT
12
1
5
1
7.4
7.4
RO
48
48
8
8
1.3
1.3
SE
15
7
2
1
3.0
3.0
SI
391
113
6
6
2.0
2.1
SK
17
17
3
3
0.1
0.0
UK
8
8
2
2
4.1
4.1
Average EU
51.6
35.2
5.0
5.0
4.6
4.8
USA
12
12
4
4
0.5
0.5
Source: Doing Business 2011: the European Union, http://doingbusiness.org/~/media/FPDKM/ Doing
%20Business/Documents/Profiles/Regional/DB2011/DB11-European-Union.pdf; Doing Business
2010: the European Union, http://doingbusiness.org/~/media/FPDKM/Doing%20Business/
Documents/Profiles/Regional/DB2010/DB10-European-Union.pdf.
2.3. Taxation System
There is limited progress in terms of the functioning of the taxation system in the
EU compared to last year’s report. All taxation indicators used in this report improved
for the EU average. The average number of payments slightly fell from 18 to 17.5.
A drop in the number of payments also was reflected in the lower amount of time
required to comply with tax procedures (from 231.1 to 221.8 hours), as well as a
decrease in the total tax rate (from 44.5% to 44.2%). Spain, Hungary and Poland
achieved the greatest progress in comparison to last year’s PISM report (in Spain,
registration time dropped from 213 to 197 hours, in Hungary, from 330 to 277 hours,
and in Poland from 395 to 325 hours). Poland is the only Member State where all
taxation indicators improved. As in the previous report, Sweden was characterised as
having the lowest number of tax payments (2). Luxembourg remained the Member State
with the most favourable taxation conditions, because of the shortest period necessary
for tax settlement (59 hours) and the lowest total tax rate level (21.1%).
Table 6. Taxation Procedure
Country
Number of payments
Time (hours)
The total tax rate
2009
2010
2009
2010
2009
2010
AT
22
22
170
170
55.5
55.5
BE
11
11
156
156
57.3
57.0
BG
17
17
616
616
31.4
29.0
CY
27
27
149
149
28.8
23.2
CZ
12
12
613
557
47.2
48.8
DE
16
16
196
215
44.9
48.2
From Lisbon to Europe 2020
Lisbon
Strategy
25

Country
Number of payments
Time (hours)
The total tax rate
2009
2010
2009
2010
2009
2010
DK
9
9
135
135
29.2
29.2
EE
10
7
81
81
49.1
49.6
EL
10
10
224
224
47.4
47.2
ES
8
8
213
197
56.9
56.5
FI
8
8
243
243
47.7
44.6
FR
7
7
132
132
65.8
65.8
HU
14
14
330
277
57.5
53.3
IE
9
9
76
76
26.5
26.5
IT
15
15
334
285
68.4
68.6
LT
12
11
166
175
42.7
38.7
LU
22
22
59
59
20.9
21.1
LV
7
7
279
293
33.0
38.5
NL
9
9
164
134
39.3
40.5
PL
40
29
395
325
42.5
42.3
PT
8
8
328
298
42.9
43.3
RO
113
113
202
222
44.6
44.9
SE
2
2
122
122
54.6
54.6
SI
22
22
260
260
37.5
35.4
SK
31
31
257
257
48.6
48.7
UK
8
8
110
110
35.9
37.3
Average EU
18.0
17.5
231.1
221.8
44.5
44.2
USA
10
11
187
187
46.3
46.8
Source: Doing Business 2011: the European Union, http://doingbusiness.org/~/media/FPDKM/ Doing
%20Business/Documents/Profiles/Regional/DB2011/DB11-European-Union.pdf; Doing Business
2010: the European Union, http://doingbusiness.org/~/media/FPDKM/Doing%20Business/
Documents/Profiles/Regional/DB2010/DB10-European-Union.pdf.
Despite very serious fiscal problems in the EU, along with budgetary
consolidation, the EU Member States remained rather restrained in increasing the
corporate tax. Many governments fear that such a move could weaken their
competitiveness and meet with negative investor reaction.
In comparison to the situation presented in the last PISM report, the CIT rate
increased only in Hungary (from 16% to 19%). Moreover, the CIT rate was reduced in
among others the Czech Republic (from 20% to 19%) and Greece (from 25% to 24%).
The average CIT rate in the EU fell slightly from 23.22 to 23.03%.
The Polish Institute of International Affairs
26
Lisbon
Strategy

Table 7. Corporate Income Tax (CIT) in the EU (as of 1 January 2010)
AT
BE
BG
CY
CZ
DE
DK
EE
EL
ES
25
33.99
10
10
19
29.41
25
21
24
30
FI
FR
HU
IE
IT
LT
LU
LV
MT
NL
26
33,33
19
12.5
31.4
15
28.59
15
35
25.5
PL
PT
RO
SE
SI
SK
UK
Average EU
19
25
16
26.3
20
19
28
23.03
Source: KPMG’s corporate and indirect tax survey.
In contrast to their approach to the corporate tax rate, Member States have shown
far more willingness to increase indirect taxation, for example the Value Added Tax, in
order to improve revenues and reduce public deficits. In comparison to the situation
in previous reports, several Member States decided to increase the VAT tax. A further
increase in indirect taxation as part of consolidation efforts in public finances can be
expected.
2.4. Commercial Judicature
There has been no progress with respect to the effectiveness of commercial
judicature in the EU. The present report again shows that in the EU both the average
duration of contract enforcement is longer (from 547.7 to 548.9 days) and costs higher
(from 20.5% to 20.7%) compared to data from the last PISM report. There is no Member
State that improved. Moreover, for some Member States, the situation is worse than in
2009: Denmark (from 380 to 410 days), Finland (costs increased by 2.9 percentage
points to 13.3%) and Hungary (costs went up from 13% to 15%). The shortest
settlement period remains in Lithuania (275 days), Latvia (309) and Luxembourg
(321 days). This last state is also the leader with respect to the lowest cost of claims
(9.7%). The countries with the worst durations of contract enforcement are Slovenia,
Italy and Poland. The costs of enforcement are highest in the Czech Republic (33% of
a claim).
Table. 8. Functioning of Commercial Judicature
Country
Duration of contract inforcement (days)
Costs (% claim value)
2009
2010
2009
2010
AT
397
397
18.0
18.0
BE
505
505
16.6
16.6
BG
564
564
23.8
23.8
CY
735
735
16.4
16.4
CZ
611
611
33.0
33.0
DE
394
394
14.4
14.4
DK
380
410
23.3
23.3
From Lisbon to Europe 2020
Lisbon
Strategy
27

EE
425
425
26.3
26.3
EL
819
819
14.4
14.4
ES
515
515
17.2
17.2
FI
375
375
10.4
13.3
FR
331
331
17.4
17.4
HU
395
395
13.0
15.0
IE
515
515
26.9
26.9
IT
1 210
1 210
29.9
29.9
LT
275
275
23.6
23.6
LU
321
321
9.7
9.7
LV
309
309
23.1
23.1
NL
514
514
24.4
24.4
PL
830
830
12.0
12.0
PT
547
547
13.0
13.0
RO
512
512
28.9
28.9
SE
508
508
31.2
31.2
SI
1290
1290
12.7
12.7
SK
565
565
30.0
30.0
UK
399
399
23.4
23.4
Average EU
547.7
548.9
20.5
20.7
USA
300
300
14.4
14.4
Source: Doing Business 2011: the European Union, http://doingbusiness.org/~/media/FPDKM/ Doing
%20Business/Documents/Profiles/Regional/DB2011/DB11-European-Union.pdf; Doing Business
2010: the European Union, http://doingbusiness.org/~/media/FPDKM/Doing%20Business/
Documents/Profiles/Regional/DB2010/DB10-European-Union.pdf.
2.5. Bankruptcy Proceedings
Limited progress was indicated with respect to the effectiveness of bankruptcy
proceedings across the EU. The duration of bankruptcy proceedings is shorter than in
2009 (from 2.1 to 1.9 years) and the costs of insolvency are slightly lower (from 10.8% to
10.6% of the estate), but the average progress was a result of improvements in only three
Member States, namely: the Czech Republic (where duration dropped by 3.3 years),
Spain (costs decreased from 15% to 11%) and Slovenia (costs dropped by half). In the rest
of the EU states, the situation remains unchanged. Bankruptcy proceedings remain most
efficient in Belgium, Denmark, Finland, Ireland and the Netherlands. The worst situation
persists in Italy, which has the highest cost of insolvency at 22%, Slovakia, which has the
highest duration at four years, and in Poland.
The Polish Institute of International Affairs
28
Lisbon
Strategy

Table 9. Bankruptcy Proceeding
Country
Duration of bankruptcy proceeding (years)
Proceeding costs (% of property)
2009
2010
2009
2010
AT
1.1
1.1
18.0
18.0
BE
0.9
0.9
4.0
4.0
BG
3.3
3.3
9.0
9.0
CY
1.5
1.5
15.0
15.0
CZ
6.5
3.2
15.0
17.0
DE
1.2
1.2
8.0
8.0
DK
1.1
1.1
4.0
4.0
EE
3.0
3.0
9.0
9.0
EL
2.0
2.0
9.0
9.0
ES
1.0
1.0
15.0
11.0
FI
0.9
0.9
4.0
4.0
FR
1.9
1.9
9.0
9.0
HU
2.0
2.0
15.0
15.0
IE
0.4
0.4
9.0
9.0
IT
1.8
1.8
22.0
22.0
LT
1.5
1.5
7.0
7.0
LU
2.0
2.0
15.0
15.0
LV
3.0
3.0
13.0
13.0
NL
1.1
1.1
4.0
4.0
PL
3.0
3.0
20.0
20.0
PT
2.0
2.0
9.0
9.0
RO
3.3
3.3
11.0
11.0
SE
2.0
2.0
9.0
9.0
SI
2.0
2.0
8.0
4.0
SK
4.0
4.0
18.0
18.0
UK
1.0
1.0
6.0
6.0
Average EU
2.1
1.9
10.8
10.6
USA
1.5
1.5
7.0
7.0
Source: Doing Business 2011: the European Union, http://doingbusiness.org/~/media/FPDKM/ Doing
%20Business/Documents/Profiles/Regional/DB2011/DB11-European-Union.pdf; Doing Business
2010: the European Union, http://doingbusiness.org/~/media/FPDKM/Doing%20Business/
Documents/Profiles/Regional/DB2010/DB10-European-Union.pdf.
From Lisbon to Europe 2020
Lisbon
Strategy
29

2.6. Smart Regulation
So-called smart regulation is strongly promoted by the European Commission as
a new approach towards regulation and was presented in President Barroso’s political
guidelines from September 2009. Barroso stated that “smart regulation should protect
the consumer, deliver effectively on public policy objectives without strangling
economic operators such as SMEs or unduly restricting their ability to compete.”
31
The
smart regulation approach is a concept that is strictly based on better regulation
initiative, so it is not a new idea. The key is that the quality of regulation should be
further improved and benefits that are given by EU legislation should not be limited
only to businesses, but should also spread to citizens or SMEs to a greater extent. The
smart regulation approach encompasses the following main elements:
– an ex-post evaluation of the existing legislation;
– a “fitness check” of pieces of legislation from important areas;
– a “competitiveness proofing” that should be enshrined into the impact
assessment process; and,
– the greater involvement of stakeholders and citizens through a consultation
process.
32
Ex-post evaluation can identify potential burdens and costs deriving from existing
legislation and can be a useful instrument in the context of a reduction in administrative
burdens and a simplification of legislation. The EC wants to use ex-post evaluation
during the review of legislation in different policies. A “fitness check” can be seen as an
element of ex-post evaluations, and has been launched to assess the usefulness and
quality of existing legislation in important areas. The Commission has already started an
inquiry in four areas: environment, transport, employment and social policies, and
industrial policy.
The “competitiveness proofing” will be an element of an ex-ante evaluation in
the framework of the impact-assessment process. The main aim in this respect is to
identify the potential impact of legislative proposals on competitiveness, including cost
and price. An analysis of a proposal’s impact on the competitiveness of EU companies
as well as investment flows has already been foreseen by the Commission’s impact-
assessment guidelines.
33
With regard to the consultation process, the EC decided to
increase the consultation period to 12 weeks starting from 2012 and make a review of
its consultation policy in 2011.
All these actions can improve the quality of regulations, but the main condition for
real progress is to ensure the full engagement of all relevant institutions at the EU level,
especially the Council and Parliament. They do not use impact assessments regularly to
identify the effects of amendments introduced to the Commission’s proposals during the
legislative process. This can lead to a situation in which there is a lack of detailed
The Polish Institute of International Affairs
30
Lisbon
Strategy
31
J. M. Barroso, Political Guidelines for the Next Commissions, p. 29, http://ec.europa.eu/
commission_2010-2014/president/pdf/press_20090903_en.pdf (accessed on 20 November 2010).
32
European Commission, Smart Regulation in the European Union, COM(2010) 543 final,
http://ec.europa.eu/governance/better_regulation/documents/com_2010_0543_en.pdf
(accessed
on
10 December 2010).
33
M. Ka³u¿yñska, “Inicjatywa Better Regulation” in: Wybrane aspekty konkurencyjnoœci euro-
pejskiej – stan debaty, Department of Analyses and Strategies, Office of the Committee for European
Integration, December 2005, p. 111.

knowledge about the potential impact of regulations that are finally adopted by the
Council and Parliament, which puts into question the credibility and sense of the whole
impact-assessment process. Within the framework of the smart regulation approach, great
attention is also paid to improving the implementation of the EU legislation.
A reduction of administrative burdens has been ongoing at the EU level, and its
progress is clearly visible. According to the Commission, the EU is on track to achieve
the 25% reduction target by 2012. The burdens reduction has already reached the
21.8% level and may even exceed the target if the Commission’s proposals are fully
adopted. It could ultimately reach 32.9%. The EU has so far adopted 70 administrative
reduction measures that decrease burdens by more than €26 billion. Adoption of all the
proposals could cut the burdens by more than €40 billion.
Table 10. Adopted Reduction Burdens in the Relevant Sectors
Sector
Mln euro
Agriculture
–1 907.6
Annual Accounts/Company Law
–1 362.9
Cohesion Policy
–179.9
Environment
–58.15
Financial Services
–141.5
Fisheries
–25.9
Food Safety
–24.6
Pharmaceutical Legislation
–40.1
Public Procurement
–12.5
Statistics
–328.3
Taxation/customs
–21 936.9
Transport
–748.3
Working Environment/Employment Relations
–232.5
Source: European Commission, Reducing administrative burdens: context and overview of achievements
and examples, MEMO/10/654, Brussels, 7 December 2010.
2.7. Industrial Policy in the New Decade
The smart regulation approach is promoted also in the context of one of the
flagship initiatives of the Europe 2020 framework—“an Integrated Industrial Policy for
the Globalisation Era”
34
—that was presented in late October 2010. The main goal of this
initiative is to deliver actions that can improve the competitiveness of European
enterprises, especially SME. The other important elements are:
– improving access to finance for businesses, especially for SME (e.g., the
Commission wants to put forward legislation that would ensure that financial
From Lisbon to Europe 2020
Lisbon
Strategy
31
34
European Commission, An Integrated Industrial Policy for the Globalisation Era: Putting
Competitiveness and Sustainability at Centre Stage, COM(2010) 614, http://ec.europa.eu/enterprise/
policies/industrial-competitiveness/industrial-policy/files/communication_on_industrial_policy_en.pdf
(accessed on 20 November 2010).

markets do not jeopardize the financial needs of the real economy during a
crisis);
35
– developing a single market and enforcing intellectual property rights;
– improving energy, transport, communications services infrastructure;
– paying more attention to innovation;
– improving access to external markets, especially for SME;
– speeding the standardisation process of products; and,
– promoting carbon efficiency, sustainable development and ensuring better
access to natural resources.
Some of the actions mentioned above are delivered within the framework of
other flagship initiatives, such as the “Innovation Union,” or will be part of broader
actions foreseen under the Single Market Act or the new external trade strategy, which
was put forward by the Commission in November 2010.
2.8. Conclusions
The overall identified progress made in the field of entrepreneurship is rather
limited when compared to the previous PISM report. The main bottlenecks indicated in
last year’s report, namely the effectiveness of bankruptcy procedures and commercial
judicature, were not tackled effectively. Unless the situation in these areas improves,
conditions for running a business in Europe cannot be seen as fully favourable.
Unfortunately, the Europe 2020 strategy insufficiently underlines the importance of
these two issues, and therefore it is hard to foresee that this situation will change rapidly
in the coming period.
There are no tangible changes between the group of leaders and laggards with
respect to conditions for running a business. Taking into account the aggregate data
from the “Doing business report” published in November 2010, the former group
includes UK, Denmark, Ireland and Finland, while the latter encompasses Greece, Italy,
Poland and Czech Republic.
The smart regulation approach is a step in the right direction, but real effects can
be achieved only when these issues will be put higher on the political agenda of the
Union. The fact that President Barroso took over this agenda in the Commission can be
perceived as a move in the right direction. However, the key challenges are to improve
the involvement of the Council, the European Parliament and the national governments
and parliaments. This is a multiannual task that requires the ownership of this issue by
all these institutions.
Undoubtedly, the new flagship initiative “Industrial Policy” from the Europe
2020 framework does not bring a new EU approach to enterprise and industry.
Nevertheless, implementation of all these initiatives is necessary in order to create a
favourable framework for the long-term development of European industry.
The Polish Institute of International Affairs
32
Lisbon
Strategy
35
Ibidem, p. 9.

2.9. Evaluation
2.9.1. Positive
The United Kingdom maintained its position as the European leader in the
“Doing business” ranking. Portugal should be appreciated for progress made in
registration of property.
2.9.2. Negative
Greece remained the laggard with respect to conditions for doing business in the EU.
2.10. Recommendations
1. In the context of the Europe 2020 strategy, more attention should be paid to
the main bottlenecks that remain in the area of entrepreneurship (especially
conditions for SME functioning, effectiveness of the courts and bankruptcy
proceedings).
2. Further action for easing financial conditions for SME should be taken at the
EU and national level. All initiatives in this respect proposed by the
Commission in the review of the Small Business Act (e.g. facilitate access to
venture capital, the EU funding programmes and other financial instruments)
should be adopted.
36
More attention should be paid to the promotion of
initiatives for the improvement of skills by young entrepreneurs.
3. The better/smart-regulation approach should be promoted further by Member
States. They should continue efforts to reduce administrative burdens and
improve the quality of national law.
4. The EU should focus more on the facilitation of access to external markets by
European companies, mainly through its trade policy strategy for 2010–2015.
In this context, particular efforts need to be done to smooth implementation
of the new EU investment policy (after the Lisbon Treaty had come into force,
foreign direct investment became one of the areas of the common
commercial policy that is the exclusive competence of the EU).
37
3. Single Market
The single market has been also affected by the crisis. Apart from short-term
problems deriving from the economic and financial downturn, many bottlenecks still
exist within the market. The Lisbon Strategy provided the framework for removing many
burdens that impede its proper functioning. The general priorities for the market
From Lisbon to Europe 2020
Lisbon
Strategy
33
36
European Commission, The Review of the “Small Business Act“ for Europe, COM(2011)
78 final, pp. 8–11, http://ec.europa.eu/enterprise/policies/sme/small-business-act/files/sba_review_en.pdf
(accessed on 25 February 2011).
37
See: European Commission, Towards a comprehensive European international investment
policy, COM (2010) 343 final, http://trade.ec.europa.eu/doclib/docs/2010/july/tradoc_146307.pdf
(accessed on 20 November 2010).

remained valid for 10 years and some of them are still relevant in the context of Europe
2020.
3.1. Transposition of the Services Directive
The deadline for the transposition of the Services Directive expired 28 December
2009. Over one year later, this crucial directive has not been fully implemented by all
Member States. So far, the states have adopted more than a thousand implementing
measures, yet further efforts are needed in this respect and progress until now has been
highly uneven. According to BusinessEurope’s report, screening of national law was
satisfactory in most states. Only in the case of Poland was the screening assessed as
disappointing.
38
Twenty three Member States have so far adopted horizontal legislation, thus
implementing the directive. Germany and France have been transposing the directive
by several acts. Austria and Luxembourg continuously note delays with horizontal
implementation.
The successful transposition of the directive requires making changes in various
pieces of legislation. Such modifications were accomplished by 19 Member States.
Serious delays still exist in Austria, Greece, Ireland, Luxembourg and Slovenia. In order
to speed up this process, the EU issued reasoned opinions to states which did not adopt
the required changes (among others Greece, France, Germany, Ireland, Slovenia).
39
As regards points of single contact (PSC), the situation is not far better. With the
exception of Greece, Italy, Romania, Slovakia and Slovenia, Member States set up
single-contact structures that are to provide information and support to entrepreneurs. In
14 states the PSCs are run as physical offices (among others Austria, Belgium, Czech
Republic, Finland). However, there are many differences between national PSCs in the
levels of their advancement and operation. The most advanced PSCs can be found in
Austria, Denmark, Germany, Estonia, the Netherlands, Sweden and the UK (in these
countries many procedures can be conducted online). Basic procedures are offered by
the PSCs in Finland, France, Hungary, Lithuania, Latvia, Luxembourg, Poland and
Portugal.
A report by Eurochambres states that 14 PSCs provide information in other
languages. Businesseurope’s survey gave a better picture, indicating that 23 states offer
basic information in English.
40
These include, among others, Belgium, Cyprus,
Denmark, Finland, the Netherlands, Sweden and the UK.
The Polish Institute of International Affairs
34
Lisbon
Strategy
38
BusinessEurope, Unleashing Cross-Border Services: Report on implementation of services
directive. January 2011, p. 7, www.businesseurope.eu/Content/Default.asp?PageID=568&DocID=
27946 (accessed on 31 January 2011).
39
European Commission, Services Directive: good progress on implementation, but more needs
to be done, 24 June 2010, IP/10/821.
40
Business Europe, Unleashing Cross-Border Services, op. cit., p. 11.

Table 11. Implementation of the Services Directive in Member States
Type of adopted actions
Member States
Adoption of horizontal legislation
BE, BG,CY, CZ, DK, EE, EL, ES, FI, HU, IE, IT, LT, LV, MT,
NL, PL, PT, RO, SE, SI, SK, UK
Adoption of specific legislation
BG, CY, CZ, DK, EE, ES, FI, HU, IT, LT, LV, MT, NL, PL, PT,
RO, SE, SK, UK
Setting up points of single contacts
AT, BE, BG, CY, CZ, DE, DK, EE, ES, FI, FR, HU, IE, LT, LU,
LV, MT, NL, PL, PT, SE, UK
Source: Information note from the Commission submitted to the Competitiveness Council, 10 December
2010.
The pace and quality of the implementation of the Services Directive in Member
States is reviewed by a so-called “mutual evaluation process.” This is a new instrument
of peer review, whereby Member States, in cooperation with the European
Commission, can assess each other in progress made in transposition of the Directive.
On the basis of Art. 39.4 of the Directive, the Commission was obliged to submit a
report about the results of the “mutual evaluation process” to the Council and the
Parliament.
41
This process consisted of three steps. After a general assessment or review
of the legislation, Member States worked in small groups (clusters) to discuss the
situation of transposition.
42
Six groups of clusters were set up.
43
The final stage included
plenary discussion between Member States. As party to this process, the Commission in
June initiated a consultation process for stakeholders in order to get feedback about the
assessments of the transposition process at the national level.
44
The mutual evaluation
process found 34,000 different requirements for service providers among the states. The
biggest number of requirements was noted in Austria, Germany, the Netherlands and
Spain. The lowest number of requirements was indicated in Bulgaria, Cyprus, Malta,
Latvia and Luxembourg. The number of requirements depends on many factors, such as
administrative structures or legislative techniques.
45
3.2. Transposition Deficit
A process to reduce non-implemented directives has been continuing in the right
direction. However, large differences between states persist. The number of countries
From Lisbon to Europe 2020
Lisbon
Strategy
35
41
The European Parliament adopted the report on implementation of the Services Directive on
15 February 2011, www.europarl.europa.eu/sides/getDoc.do?pubRef=-//EP//NONSGML+REPORT+
A7-2011-0012+0+DOC+PDF+V0//EN (accessed on 16 February 2011).
42
Service directive: Presidency report on the mutual evaluation process, Presidency report on the
mutual evaluation under article 39 of the Services Directive, 9327/10.
43
Iceland, Liechtenstein, Norway participated in the Mutual Evaluation Process, Cluster 1: AT,
CZ, HU, SI, SK; Cluster 2: BE, FR, LI, LU, NL; Cluster 3: BG, ES, IT, MT, PT; Cluster 4: CY, EL, IE, RO, UK;
Cluster 5: DK, DE, IS, NO, PL; Cluster 6: EE, FI, LV, LT, SE.
44
European Commission, Mutual Evaluation Foreseen by the Service Directive—stakeholders’
consultation, http://ec.europa.eu/internal_market/consultations/2010/services_directive_en.htm (accessed on
20 December 2010).
45
European Commission, Towards a better functioning Single Market for services – building on
the results of the mutual evaluation process of the Services Directive, Commission Staff Working
Document, SEC(2011) 102, p. 9, http://eur-lex.europa.eu/LexUriServ/LexUriServ.do?uri=SEC:2011:01
02:FIN:EN:PDF (accessed on 31 January 2011).

that achieved the 1% target remained unchanged compared to last year’s PISM report
(18 states). The average deficit in the EU was 0.9% (as of May 2010). Denmark and
Malta kept their leadership as the countries with the lowest level of deficit (at 0.2%
each). These states were followed by Slovakia (0.3%) and Finland (0.4%). The group of
laggards also remained unchanged: Greece (2.4%), Portugal (2.1%) and Poland (1.8%).
Between December 2009 and May 2010 the general situation for transposition slightly
worsened. The number of outstanding directives increased in 18 countries in this
period. Particularly worrying is the fact that the highest increase was noted in Greece
and Portugal. Only in Belgium, Denmark, Finland, Ireland, Italy, Slovakia and the UK
did the number of non-implemented directives drop.
46
Nine countries have not managed to meet the “zero deficit” target that refers to
long-overdue directives (more than two years). Greece leads the list with five directives
whose date of transposition passed at least two years ago, followed by Ireland (4),
Luxembourg (4), Austria (4) and Portugal (2). This totals 13 overdue directives. Among
them is Directive 2006/24/EC, concerning publicly available electronic communications
services and public communications networks/retention of data, which encountered
the biggest problems and is not yet transposed in five states (Austria, Greece, Ireland,
Luxembourg and Sweden).
Table 12. Categorisation of States with Respect to EU Directive Transposition Levels
Threshold
Countries
The attained level of 1% deficit
BE,BG, DE, DK, EE, ES, FI, HU, IE, LT, LV, MT, NL, RO, SE,
SI, SK, UK
The attained level of 1.5% deficit
AT,CY, CZ, FR,IT,LU
Above 1.5%
EL,PL,PT
Source: European Commission, Internal Market Scoreboard no 21, September 2010.
A positive trend has been continuing with respect to the number of infringement
procedures that were initiated by the European Commission against the Member States.
Between May 2009 and May 2010, the number of proceedings dropped from 1,271 to
1,229. The average number of infringement cases per state was 46. This confirms
a longer-term trend that shows the number of cases dropped by 11% between
1 November 2007 and 1 May 2010. The highest increases in this period were noted in
Belgium and Slovakia (68% and 32%, respectively). Belgium replaced Italy as the
country with the highest number of pending cases (111, as of 1 May 2010). The number
of proceedings against Greece amounted to 94, 92 against Italy and 86 against Spain.
The most tangible progress was achieved by Finland, Malta and Cyprus, where the
number of infringement proceedings fell by 51%, 47% and 38%, respectively. The
lowest number of proceedings was against Cyprus (13), Slovenia (17) and Latvia (17).
The Polish Institute of International Affairs
36
Lisbon
Strategy
46
European Commission, Internal Market Scoreboard no 21, September 2010, http://ec.europa.eu/
internal_market/score/docs/score21_en.pdf (accessed on 20 December 2010).

Table 13. Internal Market Directive Transposition in Member States
Country
The number of not
notified directives*
Directives
transposition deficit
The number of not transposed directives
whose implementation deadline elapsed
more than two years ago
AT
16
1.1
4
BE
10
0.7
0
BG
9
0.6
0
CY
18
1.2
0
CZ
23
1.5
0
DE
13
0.9
0
DK
3
0.2
0
EE
14
0.9
0
EL
36
2.4
5
ES
10
0.7
0
FI
6
0.4
0
FR
18
1.2
1
HU
10
0.7
0
IE
14
0.9
4
IT
17
1.1
0
LT
8
0.5
0
LU
23
1.5
4
LV
8
0.5
0
MT
3
0.2
0
NL
9
0.6
0
PL
27
1.8
1
PT
31
2.1
2
RO
10
0.7
0
SE
12
0.8
1
SI
8
0.5
0
SK
5
0.3
0
UK
10
0.7
1
* Number of directives about which the European Commission received no information about transposition.
Source: European Commission, Internal Market Scoreboard no 21, September 2010.
From Lisbon to Europe 2020
Lisbon
Strategy
37

A vast majority of infringement cases refer to directives (72%), while the
remaining part embraces violations of treaties, regulations or decisions.
The Commission’s September 2010 Internal Market Scoreboard (IMS) shows
enforcement constructed on the basis of all indicators used in IMS. This indicates the
general performance with respect to the compliance, implementation and application
of internal market rules. According to the IMS, the best aggregated results were
achieved by Latvia, Malta and Slovenia.
47
3.3. State Aid
Total state aid amounted to €427.2 billion (3.6% of GDP) in 2009.
48
It is higher
than in 2008, but this figure is an effect of support granted to the financial sector and the
real economy. The total volume of crisis measures adopted by Member States was
€353.9 billion (3% of GDP). Excluding crisis measures, total state aid amounted to
€73.2 billion (around 0.62% of GDP). As in the previous year, Bulgaria, Malta and
Hungary granted the biggest amount of total state aid (minus railways and crisis
measures) in relation to their national GDPs (2.1%, 2.0% and 1.5%, respectively). The
general trend of granting less, but better-targeted state aid was maintained in 2009.
Out of the total volume of aid (without crisis support and railways), €58.1 billion
was granted to services and industry (79.3%), €11.6 billion to agriculture (15.9%),
€0.2 billion to fisheries (0.3%) and €3.3 billion for transport (4.5%). Aid to the railways
sector amounted to about €33 billion. As for the other sectors: €2.7 billion was granted
to the coal sector, €606 million to shipyards and €338 million (the average
for 2007–2013) to aviation. In 2009, €399 million were earmarked for rescue and
restructuring aid (without aid granted to the financial sector).
Table 14. State Aid in 2009 (excluding crisis support and railways)
Country
As percentage
of GDP
Amount
(billion euro)
Share of horizontal aid in total aid granted
for industry and service sector
AT
0.6
1.7
99
BE
0.6
2.0
100
BG
2.1
0.7
100
CY
1.0
0.2
95
CZ
0.7
0.9
88
DE
0.7
16.7
86
DK
1.0
2.1
97
EE
0.3
0.04
100
EL
0.8
2.0
87
The Polish Institute of International Affairs
38
Lisbon
Strategy
47
European Commission, Internal Market Scoreboard no 21, op. cit., p. 24.
48
Source for all data used in this subparagraph: European Commission, State aid scoreboard,
Autumn 2010 Update-, SEC (2010)1462, http://ec.europa.eu/competition/state_aid/studies_reports/
annex_2010_autumn_en.pdf (accessed on 20 December 2010).

Country
As percentage
of GDP
Amount
(billion euro)
Share of horizontal aid in total aid granted
for industry and service sector
ES
0.5
5.7
80
FI
1.2
2.1
99
FR
0.8
14.7
79
HU
1.5
1.4
76
IE
0.9
1.5
89
IT
0.4
5.7
84
LT
0.8
0.2
100
LU
0.3
0.1
100
LV
1.0
0.2
100
MT
2.0
0.1
23
NL
0.4
2.4
99
PL
0.9
2.9
71
PT
1.0
1.6
19
RO
0.7
0.8
50
SE
0.9
2.6
100
SI
0.9
0.3
91
SK
0.5
0.3
90
UK
0.3
4.0
91
EU-27
0.6
73.2
84
Source: European Commission, State aid scoreboard, Autumn 2010 Update-, SEC (2010)1462.
Of aid directed to the service industry, 84% was granted to horizontal objectives
in 2009 (88% in 2008). Similar to 2008, the largest part of horizontal aid was earmarked
to regional development (24% or €13.9 billion), environment (23% or €13 billion),
Research and Development and Innovations (19% or €10.6 billion). This breakdown of
horizontal aid is similar to that in 2008; however, more aid was spent on RD&I and
slightly less on regional development.
Over 22% of horizontal aid (€10.8 billion) was granted under block exemption
rules (BER) or general block exemption rules (GBER) in 2009.
49
The biggest share of
exempted aid in horizontal areas was to training (88% of total aid earmarked to this
area), support of SME (53%), and employment (42%).
From Lisbon to Europe 2020
Lisbon
Strategy
39
49
For More about GBER information, see: M. Koczor, Lisbon Strategy Implementation in 2008,
op. cit., pp. 52–53.

Chart 3. Breakdown of Horizontal Aid in 2009
Source: European Commission, State aid scoreboard, Autumn 2010 Update- SEC(2010)1462.
Fifteen Member States granted at least 90% of their state aid (directed to industry
and service) to horizontal objectives (17 in 2008). Belgium, Bulgaria, Estonia, Latvia,
Lithuania, Luxembourg and Sweden granted all their financial support to horizontal
goals. The lowest share of granted aid to horizontal objectives remains in Portugal
(19%), Malta (23%) and Romania (50%).
Excluding crisis measures, the most often used instruments of aid for industry and
service were grants (51% of all cases) and tax exemptions (42%). Other instruments
have marginal roles and include soft loans (4%), guarantees (2%) and equity
participation (1%).
State Aid to the Financial Sector and the Real Economy During the Crisis in 2009
Support earmarked for the financial sector by Member States has been a core
element of anti-crisis actions in the EU. It was used to resuscitate the European banking
system. Between 1 October 2008 and 1 October 2010 the Commission approved
measures amounting to almost €4,559 billion (39% of GDP). The vast majority of aid
(€3,478.96 billion) was adopted as a general scheme for the sector. Individual support
measures approved by the Commission amounted to €1,109.94 billion. Approved
measures include guarantees (schemes plus ad hoc intervention) at €3,485.25 billion,
recapitalisation at €546.08 billion, impaired assets intervention at €401.79 billion and
liquidity instruments at €155.77 billion. The nominal value of aid (the amount actually
used) was €1,106.54 billion (9.3% of GDP), and the real aid element in 2009 was
€351.68 billion.
50
The greatest share of granted aid as a percentage of GDP was
earmarked by Belgium (9.57%), UK (7.65%) and Ireland (6.74%).
The Polish Institute of International Affairs
40
Lisbon
Strategy
24%
23%
19%
7%
4%
3%
Regional development
Environment and energy saving
R&D&I
SME
Employment
Culture and heritage
50
According to the Commission’s explanation, real aid elements “express monetary advantage
granted to individual banks either through schemes or ad hoc interventions. The exact volume of the aid
element depends on the case and the aid instrument.” See: European Commission, State aid scoreboard,
Autumn 2010 Update-, SEC (2010)1462), p. 48.

Table 15. State Aid to Financial Sector During the Crisis in the EU
State
Total volume approved
until October 2010
Nominal value in
2009
Aid granted
in 2009
Aid granted as percentage
of GDP in 2009
AT
91.70
30.94
9.35
3.37
BE
328.59
120.43
32.29
9.57
CY
3.00
2.23
0.23
1.36
DE
592.23
262.68
100.00
4.15
DK
599.66
14.44
8.03
3.60
EL
78.00
25.12
12.18
5.13
ES
334.27
60.31
7.32
0.70
FI
54.0
0
0
–
FR
351.10
129.48
26.75
1.40
HU
10.33
2.57
0.35
0.38
IE
723.31
11.29
11.03
6.74
IT
20.0
4.05
4.05
0.27
LU
11.59
2.72
0.88
2.33
LT
1.74
0.0
0.0
–
LV
8.78
0.86
0.86
4.62
NL
323.60
75.0
9.70
1.70
PL
9.24
0
0
–
PT
20.45
0.65
0.07
0.04
SI
12.0
2.0
0.2
0.57
SE
161.56
79.39
8.50
2.90
SK
3.46
0.00
0.00
–
UK
850.30
282.41
119.91
7.65
EU-27
4 588.90
1106.54
351.68
Source: European Commission, State aid scoreboard, Autumn 2010 Update-, SEC (2010)1462.
Between December 2008 and October 2010, the Commission also approved
73 schemes of state aid for the real economy. The approval of such measures was
allowed by the Temporary Framework from December 2008.
51
This support included
aid up to €500,000 per company, guarantees, subsidised interest on loans, risk capital,
reduced-interest loans and export-credit schemes. The total volume amounted to
€81.3 billion, and aid elements were €2.2 billion.
Taking into account the economic situation and existing weaknesses in the
financial system, the Commission decided to prolong the crisis framework directed to
the financial sector and the real economy until the end of 2011.
52
From Lisbon to Europe 2020
Lisbon
Strategy
41
51
More about Temporary Framework: M. Koczor, Lisbon Strategy Implementation in 2009,
op. cit., p. 53.
52
European Commission, State aid: Commission prolongs crisis framework with stricter
conditions, IP/10/1636, 01.12.2010, http://europa.eu/rapid/pressReleasesAction.do?reference=IP/10/
1636&format=HTML&aged=0&language=EN&guiLanguage=en (accessed on 20 December 2010).

3.4. Energy Market
Ensuring the proper functioning of the energy market
53
in the EU remains a
challenge. The main problems regarding the timely and correct transposition and
application of EU legislation still have not been resolved. In June 2010, the European
Commission formulated a reasoned opinion addressed to 20 states due to their failures
to properly apply legislation under the second energy package. This is the second stage
of the infringement procedure and was kicked off in June 2009 once the Commission
issued the letter of formal notice to 25 states.
54
Only Denmark, Estonia, Finland,
Lithuania and Latvia managed to eliminate the violations. The remaining states have
been grappling with the following problems:
– a lack of cooperation and coordination between electricity systems operators
and national authorities;
– a weakness in effective enforcement of rules by regulators;
– a lack of an adequate settlement procedure; and,
– an inadequate network capacity allocation system.
55
The level of concentration of energy markets in the EU still is high; however
some progress in this respect was noted, especially in Slovenia. The electricity market is
very highly concentrated in Belgium, France, Greece, Latvia, Luxembourg and
Slovakia. Moderated concentration is reported in Austria, Finland, Poland and the UK.
56
As the Commission noted, in 14 Member States the three largest companies cover more
than 80% of the retail electricity market (among others Czech Republic, Estonia, France,
Lithuania, Latvia and Portugal).
57
In the gas market, concentration also remains high.
Electricity and gas prices are still regulated in some countries.
Table 16. Regulation of Energy Prices in the Member States
Consumers
Industry
Regulation of electricity and
gas prices
BG, DK, EE, EL, ES, FR, HU,
IE, IT, LT, NL, PL, PT, RO, SK
BG, DK, EE, EL, FR, HU, IE,LT,
NL, PT, RO
Regulation of gas prices
–
PL
Regulation of electricity prices
CY, LV
CY, ES, IT
Source: European Commission, Report on progress in creating the internal gas and electricity market,
Technical Annex to the Communication from the Commission to the Council and the European
Parliament.
The Polish Institute of International Affairs
42
Lisbon
Strategy
53
More information about energy can be found in Chapter 6.
54
See M. Koczor, Lisbon Strategy Implementation in 2009, op. cit., p. 49.
55
European Commission, Commission requests 20 Member States implement and apply Single
Market rules without delay, http://europa.eu/rapid/pressReleasesAction.do?reference=IP/10/836&
format=HTML&aged=1&language=EN&guiLanguage=en (accessed on 20 December 2010).
56
European Commission, Report on progress in creating the internal gas and electricity market,
Technical Annex to the Communication from the Commission to the Council and the European
Parliament, SEC(2010) 251 final, p. 12.
57
Data from 2008. There is a lack of data about the market situation in Belgium, Denmark, The
Netherlands, Sweden and the UK.

3.5. Telecommunication
On 1 July 2010, another stage in the reduction of the prices for roaming was
introduced on the basis of a 2007 regulation. Since then, the costs of receiving a call
have dropped from 19 eurocents to 15 cents and making a roaming call costs 39 cents,
down from 43 cents. Also from 1 July, mobile operators were required to introduce a
default cut-off for data roaming devices that are taken abroad in order to minimise the
shocking cost of bills. Operators also have to send a warning when a customer exceeds
the limit of €50.
The functioning of the telecommunication markets in the EU varies between the
Member States. According to the ECTA scorecard, the best in this respect is the
Netherlands, UK and Denmark.
58
Also getting good marks were France and Ireland. The
group of leaders did not change compared to the previous ECTA ranking from 2008.
Progress was made in Belgium. A worse situation was reported in Germany, Austria,
Italy and Slovenia. The bleakest picture of the market situation was in Bulgaria and
Czech Republic.
The overall situation with respect to the regulatory and institutional framework
differs a lot. Key divergences according to the ECTA scorecard include:
– different scope of powers for National Regulatory Authorities (NRA) in
Member States. In a majority of member countries, the NRAs do not have full
powers to enforce rules. This is partially a result of their limited independence,
the limited power of NRAs to impose fines on companies that violate rules,
– different levels of transparency and effectiveness between NRAs—while some
NRAs have problems with identification of violations of rules in markets; and,
– differences in market liberalisation and competition, for example, the most
competitive conditions for mobile and wireless services are in Austria, UK and
the Nordic states, while the Netherlands, Portugal, France and the UK have the
most friendly competition environment for business services.
3.6. Railways
Railway markets in the EU struggle with similar problems as in the case of energy
and telecommunications. The main weaknesses include:
– inadequate levels of competition (obstacles to access to the market for
newcomers, including access to stations for international passenger trains that
compete with national operators);
– the weak positions of national regulatory authorities in Member States (their
unsatisfactory independence, powers, resources to conduct effective controls);
and,
– insufficient levels of public and private investments in infrastructure.
These weaknesses are to a great extent a result of the incorrect implementation of
EU directives. Although all Member States adopted the first package of railways directives
From Lisbon to Europe 2020
Lisbon
Strategy
43
58
The ECTA scorecard presents the situation in 22 European states (19 EU states) with respect to
five main indicators: the general institutional environment, market entry enablers, National Regulatory
Authorities’ regulatory processes, the application of regulation by the NRAs and regulatory and market
outcome. Information was provided by NRAs, the European Commission and stakeholders. See: ECTA.
Regulatory scorecard 2009, www.ectaportal.com/en/upload/Scorecards/Regulatory%20Scorecard%20
2009/ECTA%20Regulatory%20Scorecard%20Report%202009.pdf (accessed on 18 January 2011).

from 2001,
59
the general quality of transposition and application of these acts varied
between states. The Commission referred 13 Member States (Austria, Czech Republic,
Germany, Greece, France, Hungary, Ireland, Italy, Luxembourg, Poland, Portugal,
Slovenia and Spain) to the European Court of Justice for failing to properly transpose the
first package. These countries did not eliminate imperfections that were indicated by the
Commission in reasoned opinions issued in October 2009, or earlier in letters of formal
notice from 2008 (the main problems concern the independence of regulatory authorities
and difficulties in access to infrastructure).
60
Violations were correctly eliminated by eight
states (Belgium, Denmark, Estonia, Latvia, Lithuania, Romania, Slovakia and Sweden). In
November 2010, the Commission reduced the scope of infringements against Austria,
France and Portugal, because of improvements made there.
In order to tackle the problems mentioned above, the Commission decided to
recast directives from the first package with the aim to simplify and consolidate them.
Such a move should lead to an improved institutional and regulatory framework of rail
markets, by easing access to rail-related services for freight and passenger trains, setting
up rules about conflict of interest and discriminatory practices, improving independence
and extending the competences of national regulators and requiring more precise and
smarter infrastructure charging rules.
61
3.7. Future of the Single Market
At the end of October 2010, the European Commission published the
Communication “Towards a Single Market Act (SMA)” that included 50 initiatives in
order to improve the functioning of the single market.
62
Content of the SMA was largely
based on conclusions and recommendations presented in the report titled “The new
strategy for the single market,” prepared by Mario Monti at the request of President
Barroso.
63
Both the act and the report should be analyzed in the context of actions that
have been already adopted in the framework of the single market review.
64
In his report, Monti pointed out that there is no good climate for deepening the
single market because of “market fatigue” closely related to the broader tendency of
“integration fatigue.” According to the report, single market issues do not draw the
attention of political elites and societies. Changing this behaviour is the main condition
The Polish Institute of International Affairs
44
Lisbon
Strategy
59
European Commission, Second report on monitoring development of the rail market, COM
(2009) 676 final, p. 3, http://eur-lex.europa.eu/LexUriServ/LexUriServ.do?uri=COM:2009:0676:REV1:
EN:PDF (accessed on 18 January 2011).
60
European Commission, Rail services: Commission legal action against 13 Member States for
failing to fully implement first railway package, 24 June 2010, IP/10/807, http://europa.eu/rapid/press
ReleasesAction.do?reference=IP/10/807&format=HTML&aged=1&language=EN&guiLanguage=fr
(accessed on 20 December 2010).
61
European Commission, Commission sets out measures to improve rail services, 17/09/2010,
IP/10/1139, http://europa.eu/rapid/pressReleasesAction.do?reference=IP/10/1139&format=HTML& aged
=0&language=en (accessed on 20 December 2010).
62
European Commission, Towards a Single Market Act. For a highly competitive social market
economy. 50 proposals for improving our work, business and exchanges with one another, COM (2010)
608 final/2, http://eur-lex.europa.eu/LexUriServ/LexUriServ.do?uri=COM:2010:0608:REV1:EN:PDF#
page=2 (accessed on 20 December 2010).
63
M. Monti, A new strategy for the single market: At the service of Europe’s economy and society,
Report to the President of the European Commission, http://ec.europa.eu/internal_market/strategy/index_
en.htm (accessed on 20 December 2010).
64
See M. Koczor, Lisbon Strategy Implementation in 2008, op. cit., p. 44.

for moving forward with the single market agenda. Monti’s report distinguished three
main groups of actions that should be launched:
– initiatives to build a stronger market;
– initiatives to build consensus on a stronger market; and,
– initiatives to deliver a stronger single market.
Among the report’s main proposals are:
– creating a single digital market;
– improving the functioning of the market for citizens;
– increasing the potential of the single market in support of green growth;
– ensuring labour mobility in the single market;
– deepening the market of services and goods; and,
– improving the “physical” infrastructure in order to support the single market.
“Towards a Single Market Act” is a framework document that embraces
proposals that will be implemented to a large extent under the flagship initiatives
(Innovation Union, Digital Agenda and Integrated Industrial Policy for Europe). The
most important proposals are:
With respect to the digital agenda: putting forward a proposal for a framework
Directive on the management of copyrights, and adopting an action plan against
counterfeiting and piracy while developing electronic commerce.
With respect to SME: stepping up the action plan for improving SME access to
capital markets in 2011, reviewing the accounting directives to simplify financial
reporting obligations and reducing the administrative burdens.
Regarding the finance of investments in a single market: the creation of project
bonds to finance the European project and the greater involvement of private investors
in support of the Europe 2020 strategy.
Regarding a business friendly environment: adopting a new VAT strategy in 2011.
Referring to public services: presenting a Communication and series of measures
of service to general interests and communication on energy priorities in 2020–2030.
With respect to labour and social issues: adopting a legislative proposal aimed at
improving the implementation of the Posting of Workers Directive, putting forward
proposals concerning pensions systems based on a Green Paper from 2010, creating
legislation to reform the recognition of professional qualifications.
With respect to consumers: preparing a multiannual action plan for the
development of European market surveillance, putting across a legislative initiative on
access to certain basic banking services at the start of 2011.
Referring to monitoring and evaluation: frequent use of a “mutual evaluation”
instrument, better enforcement of the EU law and improving consultation and dialogue.
3.8. Conclusions
The single market has remained one of the leading areas in the Lisbon Strategy
implementation, but recent progress is rather limited. The picture is mixed due to the
disappointing pace and quality of transposition of the Services Directive, as well as
problems with proper transposition and application of the directives referring to
From Lisbon to Europe 2020
Lisbon
Strategy
45

network markets. Many flaws still exist in the entire transposition process, and,
unfortunately, this problem was not sufficiently addressed in the SMA.
The Commission managed to control state aid granted to the financial sector and
real economy, and proved its flexibility when deciding to prolong the temporary crisis
framework. The successful implementation of the exit strategy for the financial sector will
be a key challenge in the short term. Too early a withdrawal of support could damage the
situation in the banking sector. In 2011, the priority will be on the continuation of
financial support for the restructuring of the banking sector across the EU.
Due to tangible fiscal problems, a reduction of state aid support directed to
horizontal goals can be a probable scenario in some states. Such a move could impede
achieving national targets under the Europe 2020 strategy, especially in such areas as
energy and climate, RD&I or employment, where public support is essential for
reaching sustainable progress.
As regards the future of the single market proposal by Mario Monti to adopt a
package deal with respect to sensitive issues like tax coordination, social issues or
model of industrial policies, it should be seriously considered in the context of the
coming anniversary of the creation of the single market. Such an arrangement agreed to
at the highest political level could become a reliable pillar for the implementation of the
SMA in the new decade. However, there is little chance that such an agreement can be
adopted in the upcoming period.
3.9. Evaluation
3.9.1. Positive
Denmark performs very well with regard to the transposition of directives, and is
among frontrunners with respect to the implementation of the Service Directive.
3.9.2. Negative
Greece, Poland and Portugal are the laggards in the transposition of directives.
3.10. Recommendations
1. The EU should set up new transposition deficit target and pay more attention
to the quality of implementation and application of the EU law.
2. The Commission should have a strict approach to all poor performers with
regard to incorrect transposition and the poor application of directives that do
not achieve credible progress. A stronger position by the European
Commission as a guardian of the EU rules is necessary to better develop
initiatives in the single market. The “name and shame” approach should be
renewed.
3. The Commission should further develop the mutual evaluation approach for
all new directives that have a particular importance for the functioning of
markets.
The Polish Institute of International Affairs
46
Lisbon
Strategy

4. A review of state aid policy should be considered in the context of the
implementation of the Single Market Act. It should aim at an adjustment of
this policy to the post-crisis economic and financial environment in the EU.
5. The European Council should endorse commitments concerning the timely
and smooth implementation of the SMA. As the Commission pointed out in
the Annual Growth Survey, special attention should be paid to removing
restrictions in professional services, liberalizing e-commerce services and the
reduction of cross-border tax burdens.
65
4. The Knowledge Triangle
The Knowledge Triangle
66
as a part of the Lisbon Strategy consists of increasing
the interlinkage between three key drivers of knowledge-based society and economy:
education, research and innovation. This very broad area needs to develop fast, as it
constitutes a core element of the EU’s competitiveness in relation to other economic
forces. The role of knowledge is so important that it is often called the “fifth freedom”
alongside the four classic freedoms of the individual, capital, goods and services.
The Knowledge Triangle also played a crucial role in the Lisbon Strategy aimed at
developing a knowledge-based economy in the EU. The Strategy sets general
guidelines, but it is up to the Member States to draft their own plans to develop the
Knowledge Triangle taking into account their specific needs. The international
economic and financial crisis and the subsequent consolidation of national budgets
meant more obstacles to the development of education, research and innovation, but
the global challenges faced by the EU cannot be addressed successfully without a
dynamic development of the Knowledge Triangle.
4.1. Lifelong Learning
According to statistics, lifelong learning visibly lacks momentum, as its
development has lately been exceptionally slow. The most recent data from Eurostat
67
shows that the overall EU-27 percentage of the population aged 25–64 participating in
lifelong learning in 2009 amounted to 9.3%. This is still far from the 12.5% objective,
which, most probably, will not be achieved. The highest participation in lifelong
learning process is observed in the Nordic countries, with Denmark ahead (31.6%, up
1.6 pp) followed by Finland (22.1%, down by 1.0 pp) and Sweden (22.2%, unchanged).
A relatively high level of participation was noted in the UK (20.1%, up 0.2 pp). The
figures for 2009 show that the lowest participation rate was noted in Romania (1.5%,
unchanged), Bulgaria (1.4, unchanged), Slovakia (2.8%, down 0.5 pp) and Greece
(3.3%, an increase by 0.4 pp). The data indicates that no effective measures have been
From Lisbon to Europe 2020
Lisbon
Strategy
47
65
European Commission, Annual Growth Survey: advancing the EU’s comprehensive response
to the crisis, p. 8, COM(2011) 11/2
.
66
The most recent data concerning early drop-outs (for 2009) was presented in last year’s edition
of the report. The same problem concerns the percentage of persons who completed at least upper
secondary education, as the newest data available (for 2008) can be found in: M. Koczor, Lisbon Strategy
Implementation in 2009, op. cit., Table 20, p. 55. A new edition of the EC’s report Progress Towards the
Lisbon Objectives in Education and Training: Indicators and Benchmarks has not been issued for 2010 at
the time of preparing this report.
67
The most recent data is for 2009.
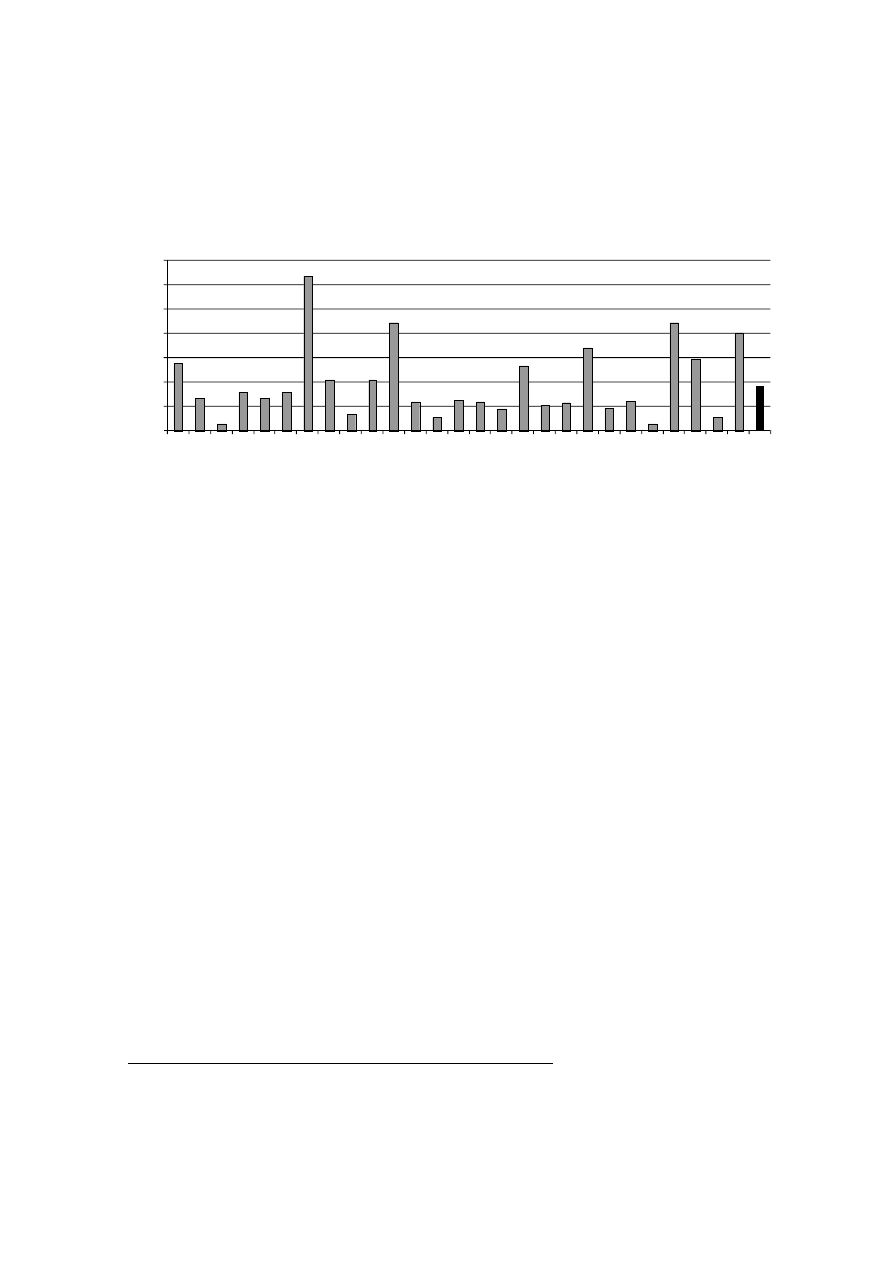
taken in those countries to promote lifelong learning. A stagnation in lifelong learning
was also observed in Poland, where participation stands at 4.7%, with no progress
noted in 2009.
68
Chart 4. Percentage of Population Aged 25–64 Participating in Lifelong Learning in 2009
Source: Eurostat, http://epp.eurostat.ec.europa.eu/portal/page/portal/education/data/database.
4.2. Mathematics and Science Literacy
The most detailed and comprehensive measurements in this field are provided
by the OECD, which conducts research on 15-year-old teenagers in the framework of
PISA (Programme for International Student Assessment). This study evaluates the
quality, equity and efficiency of school systems in some 70 countries that account for
90% of the world economy.
69
The study aims at answering the question about how the
young people are prepared for future challenges in terms of their analytical, reasoning
and communication skills.
In mathematics, the highest score was reserved for students from Finland (541),
who ranked third in the rankings, behind the Koreans (546) and the Taiwanese (543).
The best EU countries in the ranking were: the Netherlands (526), Belgium (515),
Germany (513). The EU Member States with the lowest ranking were: Greece (466),
Bulgaria (428) and Romania (427).
70
By far the largest share of the best students in terms of mathematical skills is
characteristic of Finland (3.3%), which also boasts the lowest number of pupils with the
poorest results. A low rate of weak pupils is recorded in Estonia (8.3%). In natural
sciences, the best result in Europe is also recorded Finland (554 points), followed by
Estonia (528), the Netherlands (522) and Germany (520).
71
The PISA report also provides an interesting insight into gender differences.
In science, the largest gender differences in the EU in favour of the boys are observed in
Denmark (12 points), the UK, Spain and Luxembourg. On the other hand, girls perform
The Polish Institute of International Affairs
48
Lisbon
Strategy
0.0
5.0
10.0
15.0
20.0
25.0
30.0
35.0
EU-27
AT
BE
BG
CY
CZ
DE
DK
EE
EL
ES
FI
FR
HU
IE
IT
LT
LV
MT
NL
PL
PT
RO
SE
SI
SK
UK
LU
68
Eurostat, http://epp.eurostat.ec.europa.eu/portal/page/portal/education/data/database.
69
OECD, PISA 2009 Results: What Students Know and Can Do. Student Performance in Reading,
Mathematics and Science, vol. I, p. 3; http://browse.oecdbookshop.org/oecd/pdfs/browseit/981007
1E.PDF (accessed on 10 December 2010).
70
Ibidem, p. 134.
71
Ibidem, p. 148.

better in Finland, Slovenia, Greece and Poland.
72
In mathematics, the most significant
differences in the EU can be observed in Belgium and in the United Kingdom, where the
boys score better by more than 20 points. In mathematics, no measurable differences
between the sexes can be observed in the following counties: the Czech Republic,
Slovakia, Poland, Finland, Slovenia, Sweden, Romania and Bulgaria.
73
4.3. Development of Higher Education
Since the early 1980s, when the first consumer-oriented university rankings were
published in the U.S., this tool has become an important measure of the educational
position of different universities, despite its methodological limitations and
simplifications.
The position of EU universities did not change significantly in the new edition of
the the ARWU ranking,
74
and it comes as no surprise that U.S. universities dominate in
the top 500. As in earlier years, the top-ranked EU universities are in the UK: Cambridge
and Oxford (5
th
and 10
th
place), with others representing France: Paris 6 and Paris 11
Universities (39
th
and 45
th
place); Denmark: Copenhagen and Aarhus Universities (40
th
and 98
th
); and Sweden: Karolinska and Uppsala Universities (42
nd
and 66
th
). The
remaining universities are located in the Netherlands: Utrecht and Leiden (50
th
and
70
th
); Germany: Munich University and Technical University of Munich (52
nd
and 56
th
);
Finland: Helsinki (72
nd
); and Belgium: Ghent (90
th
). Except for the Karolinska Institute in
Stockholm, which moved up 8 places in the ranking, there are no significant changes on
the list compared to the preceding year. The UK remains the unquestionable leader in
the EU with 11 universities among the top 100 against Germany’s five, France’s three,
Sweden’s three and two from Denmark. The place of Polish universities in the ranking is
relatively low, just as in last year’s study, with only the Jagiellonian University and the
Warsaw University included (in the fourth hundred of the ranking).
The U.S. dominates the ARWU ranking with 17 universities in the top 20. The
best American universities are using largely private funding to provide business
oriented research and they are very successful in attracting talents from all over the
world. In this regard their European counterparts still have a lot to learn.
From Lisbon to Europe 2020
Lisbon
Strategy
49
72
Ibidem, p. 154.
73
Ibidem, p. 137.
74
For the purpose of this study, as in the previous editions, we have relied on the Academic
Ranking of World Universities (ARWU), also known as the Shanghai ranking, which is considered by
many to be the most objective, Academic Ranking of World Universities 2010, www.arwu.org, (accessed
on 12 January 2011). The ARWU classifies 1,000 world academic institutions and shows the best 500 on
its website. There are also many other institutions preparing world university rankings, with one of the
most interesting examples provided on the http://webometrics.info website, where the ranking is based
solely on the Internet activity (volume and visibility) of the institutions presented (accessed on
10 December 2010).

Table 17. Best Universities according to Shanghai Ranking in 2009 and 2010
Academic Institution
Position in Shanghai
ranking in 2009
Position in Shanghai
ranking in 2010
Position in the EU (based
on the Shanghai ranking)
University of Cambridge
4
5
1
University of Oxford
10
10
2
University College
London
21
21
3
The Imperial College of
Science, Technology and
Medicine
26
26
4
Pierre and Marie Curie
University (Paris VI)
40
39
5
University of
Copenhagen
43
40
6
Karolinska Institute
Stockholm
50
42
7
University of Manchester
41
44
8
University of Paris Sud
(Paris XI)
43
45
9
Utrecht University
52
50
10
Source: ARWU.
4.4. R&D Expenditure
The increase in spending levels for research and development was one of the
most important quantitative targets of the Lisbon Strategy. The final target for the EU-27
of an increase to 3% GDP (1% from public sources and 2% from private sources) will
not be achieved, as the general level of spending in 2009 for the EU-27 reached
2.01%.
75
This is a slight increase over the preceding year (1.9%).
76
The EU countries with the highest R&D spending (over 3% of their GDP) include:
Finland (3.96 %), Sweden (3.6%) and Denmark (3.02%). The Member States with the
lowest rate are Cyprus (0.46 %), Latvia (0.46%), Romania (0.47%), Slovakia (0.48%),
Bulgaria (0.53%) and Greece (0.58%).
The business sector accounts for the highest share in the R&D investment
structure. Among the biggest R&D spenders in the world listed in the EU Industrial R&D
Investment Scoreboard 2010, Toyota holds the number one place despite a drop in
sales; it is followed by the Swiss company Roche (€6.4 billion
)
.
77
Among the top 10
The Polish Institute of International Affairs
50
Lisbon
Strategy
75
Gross domestic expenditure on R&D, Eurostat, http://epp.eurostat.ec.europa.eu/tgm/refreshTable
Action.do?tab=table&plugin=1&pcode=t2020_20&languagen.
76
M. Koczor, Lisbon Strategy Implementation in 2009, op. cit., p. 62.
77
Monitoring Industrial Research: The 2010 EU Industrial R&D Investment Scoreboard, Joint
Research Centre, Directorate General Research, European Commission, p. 6, http://iri.jrc.ec.europa.eu/
research/scoreboard_2010.htm (accessed on 26 January 2011).
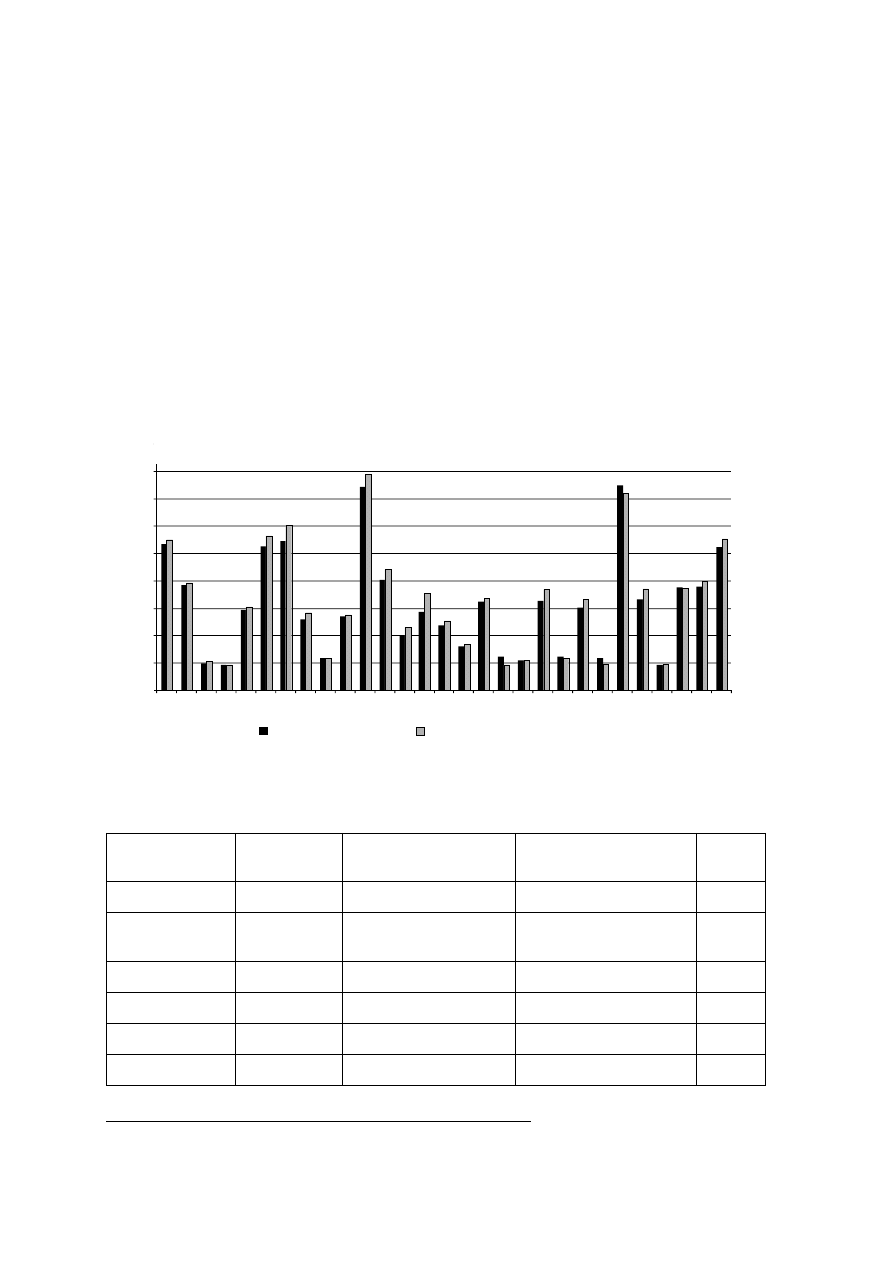
three companies from the EU are listed in this ranking, with 16 among the top 50. The
largest EU R&D investor is Volkswagen (third place in the ranking), which spent €5.79
billion in 2009, followed by Nokia (€5 billion) and Sanofi-Aventis (€4.57 billion).
78
In
geographical terms, companies from Germany, France and the UK account for more
than two thirds of the total R&D investment of the EU. The trend observed in The 2010
EU Indvestment Scoreboard 2010 indicates a slow rise in the Asian companies’ position
and a slight drop of those based in the U.S., although the latter still dominate in the
ranking in terms of the number of companies listed (504 out of 1,400), against 400
located in the EU and only 21 from China.
79
The dominant position of U.S. companies is
even more overwhelming in terms of the sums invested, as U.S. firms invested almost
five times more than those from the EU in semiconductors and eight times more in
biotechnology.
80
Chart 5. R&D Expenditure in 2009 (in % GDP, U.S. – 2008, EL – 2007)
Source: Eurostat.
Table 18. Biggest EU R&D Investors in 2009
Name
Investment
(in mln euro)
Change in % compared
to 2008
Sector
Country
Volkswagen
5.790
–2.3
Automotive
DE
Nokia
4.997
–6.1
Telecommunications
equipment
FI
Sanofi-Aventis
4.569
0.2
Pharmaceutical
FR
Siemens
4.282
1.9
Electrical components
DE
Dailmer
4.164
–6.2
Automotive
DE
GlaxoSmithKline
4.084
9.5
Pharmaceutical
UK
From Lisbon to Europe 2020
Lisbon
Strategy
51
0
0.5
1
1.5
2
2.5
3
3.5
4
Total (GERD) in 2008
Total (GERD) in 2009
EU-27
AT
BE
BG
CY
CZ
DE
DK
EE
EL
ES
FI
FR
HU
IE
IT
LT
LV
MT
NL
PL
PT
RO
SE
SI
SK
UK
LU
USA
78
Ibidem, p. 23.
79
Ibidem, p. 15.
80
Ibidem.
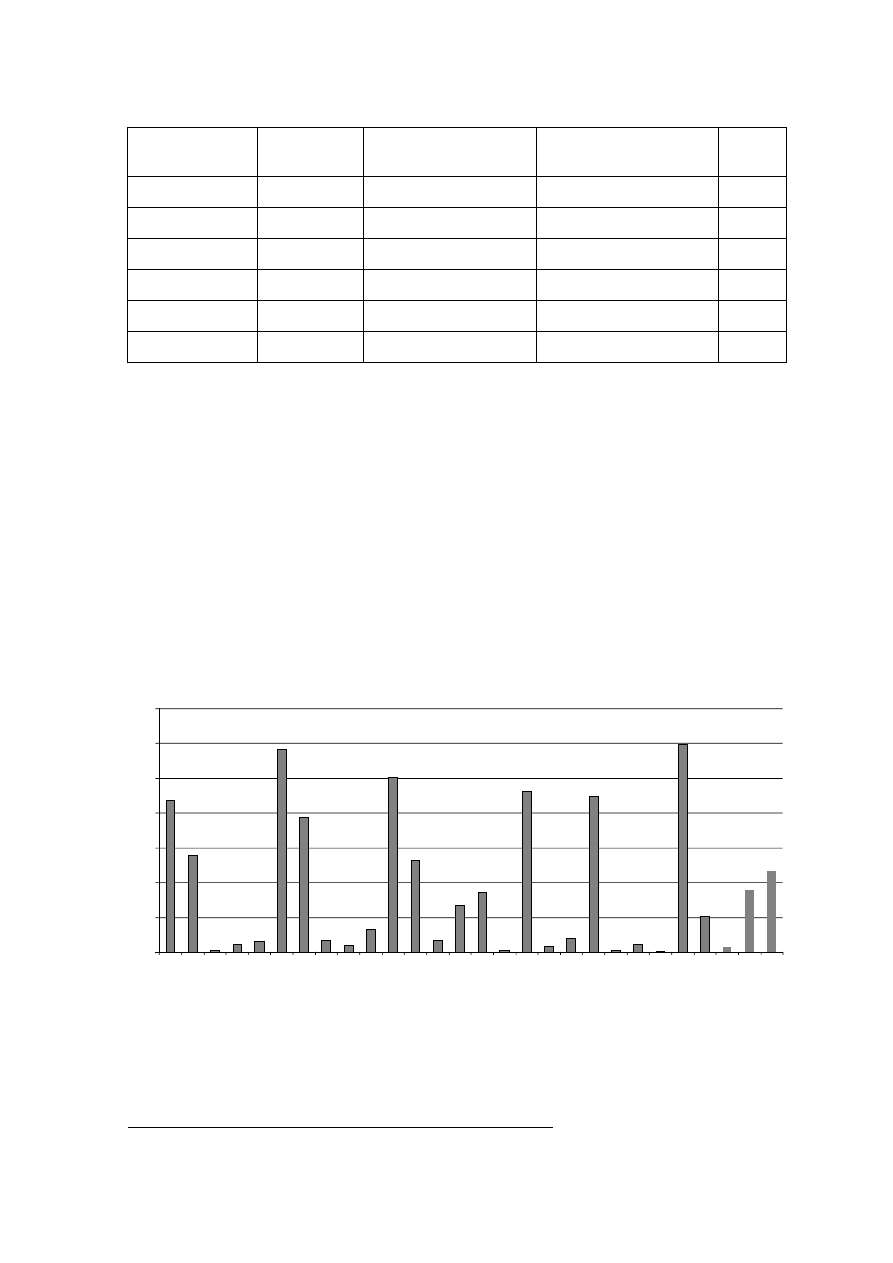
Name
Investment
(in mln euro)
Change in % compared
to 2008
Sector
Country
Robert Bosch
3.578
–8.6
Automotive/Parts
DE
AstraZeneca
3.090
–12.0
Pharmaceutical
UK
Bayer
2.964
8.8
Pharmaceutical
DE
EADS
2.878
4.4
Aerospace/Defence
NL
Alcatel-Lucent
2.714
–14.3
Telecommunications
FR
BMW
2.448
–14.5
Automotive
DE
Source: European Commission, Monitoring Industrial Research: The 2010 EU Investment R&D
Investment Scoreboard 2010
.
4.5. Development of Patent System
According to most recent data, in 2008 the number of patents presented to the
European Patent Office (EPO) amounted to 146,150, which means a slight rise in
applicants (by 3.8%) between 2007 and 2008. The data available for 2009 shows a
substantial drop (by 7.9%) between 2008 and 2009, the first one since 2002.
81
The
highest number of applications in the EU was submitted in Germany (135,748), France
(47,597) and the United Kingdom (42,296).
82
The number of applicants in Japan stood
at 502,054 and in the U.S. at 400,769.
Chart 6. Number of Applications to EPO (per 1 million inhabitants) in 2007
Source: Eurostat,http://epp.eurostat.ec.europa.eu/portal/page/portal/product_details/datase t?p_product
_code=TSIIR060.
With respect to the number of applications to EPO per one million residents, the
highest ratio was recorded in Sweden and Germany (almost 300), followed by Finland,
The Polish Institute of International Affairs
52
Lisbon
Strategy
0
50
100
150
200
250
300
350
EU-27
AT
BE
BG
CY
CZ
DE
DK
EE
EL
ES
FI
FR
HU
IE
IT
LT
LV
MT
NL
PL
PT
RO
SE
SI
SK
UK
LU
81
WIPO, World Intellectual Property Indicators 2010, p. 9, www.wipo.int/export/sites/www/ips
tats/en/statistics/patents/pdf/941_2010.pdf, p. 40 (accessed on 7 January 2011).
82
Ibidem.

Luxembourg, the Netherlands and Austria (between 200 and 250). The poorest
proportion was noted in Romania (0.98), Lithuania (2.41), Bulgaria (3.78) and Poland
(3.82).
83
In 2007 the EU average was 116 (114 in 2006).
An improvement of intellectual property rights in the EU, and especially the
patent system, was a key element of the renewed Lisbon Strategy. As underlined in the
last EC communication “Innovation Union,” the development of the EU patent system
has an enormous significance for innovation investments and in fact it is a “symbol for
Europe’s failure on innovation.”
84
The cost of registering a patent and its legal protection
for all 27 Member States is at least 15 times higher than in the U.S. due to various legal
and administrative fees.
85
The Commission assesses that the establishment of the EU
patent system would allow business to save €250 million a year.
86
In 2010 some progress in the discussion on creating an EU patent was observed,
especially during the Belgian presidency of the EU Council, which declared its
engagement in finding a solution to the deadlock over the language dispute and
proposed a non-paper before the informal Competitiveness Council meeting on
29 September. The main bone of contention, as before, were the languages that would
be used to register patents. The use of English, French, German in the patent system was
contested by Spain and Italy. In the absence of a compromise, 11 Member States, with
the support of the EC, declared their readiness to start the enhanced cooperation
procedure.
87
In 2011 the Commission is planning to issue further proposals for a
European knowledge market for patents and licensing.
4.6. Conclusions
The Knowledge Triangle remained a weak part of the Lisbon. Lack of substantial
progress is partially due to the complexity of Knowledge Triangle issues, which are
interlinked and their improvement depends on actions at different governance levels.
Additionally, the EU has only limited competences in this area and can work only
through the Open Method of Coordination, whose efficiency remains problematic. The
overlapping competences of the EU and MS make it difficult to apply proper policy
measures.
Achieving positive results in the area of the Knowledge Triangle requires the
adoption of comprehensive long-term national programs gradually implemented by
successive governments, which is hard to achieve in most EU countries.
From Lisbon to Europe 2020
Lisbon
Strategy
53
83
Eurostat, http://epp.eurostat.ec.europa.eu/portal/page/portal/product_details/dataset?p_product_
code=TSIIR060.
84
Communication from the Commission to the European Parliament, the Council, the European
Economic and Social Committee and the Committee of the Regions, Europe 2020 Flagship Initiative
Innovation Union, COM(2010) 546 final, SEC(2010) 1161, 6 October 2010, http://ec.europa.eu/
research/innovation-union/pdf/innovation-union-communication_en.pdf#view=fit&pagemode=none
(accessed on 18 December 2010), p. 15.
85
B. van Pottelsberghe, J. Danguy, Economic Cost-Benefits Analysis of the Community Patent,
7 April 2009, final version submitted to the EC DG Internal Market, p. 14.
86
Ibidem.
87
V. Pop, “Eleven states to move on single EU patent,” EU Observer, 10 December 2010,
http://euobserver.com/9/31479 (accessed on 18 December 2010).

There is much room for improvement. Participation in the lifelong learning
process is not increasing and it is still far from the 12.5% objective. Interesting
conclusions can be drawn from the new PISA survey. The figures show that in the area
of mathematics and science education the division into EU-15 and EU-12 does not hold.
The differences within the two groups depend on the different national educational
models, especially of primary and secondary education.
The general academic position of most universities located in the EU is relatively
low. There are only 27 universities from the EU among the top 100. The best
educational institutions are located in the UK, the Nordic countries, Germany and
France.
Research and development spending remains below the 3% objective in most
Member States. R&D Investment level from the business sector decreased among the
top-ranked companies as a result of the economic and financial crisis. The distance
to the U.S. and Japan is remarkable.
In an attempt to improve the assessment of university-based research, the
European Commission launched several projects, such as the European University Data
Collection, a project examining EU data collection in education, research and
innovation, or a pilot project European Multidimensional University Ranking System,
which is expected to publish the first results in the first half of 2011.
88
The strategy Europe 2020 sets new benchmarks in the field of education. One of
its flagship initiatives, “Innovation Union,” is fully devoted to developing one of the
core component of the Knowledge Triangle: innovations. It embraces over 30 action
points, introduces the use of public procurement budgets to finance innovations, sets
the Innovation Scoreboard based on 25 indicators and promotes numerous initiatives in
the field of education and research (e.g. the completion of the European Research Area).
On 1 February 2011 the European Commission published the first evaluation of
“Innovation Union” implementation based on 25 indicators. The main conclusions of
the document were that the EU Member States can be divided into four performance
groups. Denmark, Finland, Germany and Sweden were called the innovation leaders,
followed by Austria, Belgium, Cyprus, Estonia, France, Ireland, Luxembourg, the
Netherlands, Slovenia and the UK as the innovation followers. Other countries: the
Czech Republic, Greece, Hungary, Italy, Malta, Poland, Portugal, Slovakia and Spain
are below the EU average, being moderate innovators, while the poorest performers
(modest innovators) include Bulgaria, Latvia, Lithuania and Romania.
89
The report
concludes that there is a steady convergence among the Member States
90
and PISM’s
report presents a similar picture of the Member States’ performance in respect of
innovation.
The Polish Institute of International Affairs
54
Lisbon
Strategy
88
Assessing Europe’s University-Based Research, Expert Group on Assessment of University-
Based Research, European Commission, p. 19, http://ec.europa.eu/research/era/docs/en/areas-of-actions-
universities-assessing-europe-university-based-research-2010-en.pdf (accessed on 1 February 2011).
89
Maastricht Economic and Social Research and Training Centre on Innovation and Technology
(UNU-MERIT), DG JRC G3 of the European Commission, Innovation Union Scoreboard 2010,
The Innovation Union’s Performance Scoreboard for Research and Innovation, 1 February 2011,
http://ec.europa.eu/enterprise/policies/innovation/files/ius-2010_en.pdf (accessed on 1 February 2011).
90
Ibidem.

4.7. Evaluation
4.7.1. Positive
In general the Nordic countries: Denmark, Sweden and Finland should be very
positively assessed due to their achievements and position in the Knowledge Triangle
area. Germany is worth mentioning for the level of private R&D and the number of
patent applications per capita. The British model of higher education should be an
example for the other Member States.
4.7.2. Negative
Greece, Bulgaria, Romania are holding the poorest position in almost all the
rankings. Slovakia is performing poorly in lifelong learning and R&D expenditure. The
gap is unlikely to be diminished and in some areas it is growing.
4.8. Recommendations
1. The Member States should insert ambitious measures into their National
Reform Programmes in order to achieve their national targets in R&D and
education. Governments should try to avoid a reduction of expenditures
relevant to the Knowledge Triangle during the implementation of fiscal exit
strategies. As the European Council underlined in February 2011, Member
States should give priority to growth-friendly spending in conducting fiscal
consolidation.
91
2. An effective solution of the EU patent issue is of a great importance and will
lead to an effective patent litigation cost reduction, which would have a
positive impact on innovation development in the EU.
3. EU universities’ research and educational programs should be much more
oriented to promoting innovation, entrepreneurial spirit and links with the
business sector. The EU public sector should be more open to innovation in
services and public procurement procedures should take innovation into
account.
4. National higher education institutions in the EU should be reformed.
Financing should be increased and the recruitment of academic staff based on
merit alone and open competitions. The system of tuition fees should be
accompanied by the availability of student loans guaranteed by states.
5. The EU should speed up actions towards improving the legal and financial
framework for innovation, taking into account the conclusions of the
European Council of February 2011. Such a strong framework is a
prerequisite for creating the “fifth freedom.”
From Lisbon to Europe 2020
Lisbon
Strategy
55
91
European Council Conclusions, 4 February 2011, www.consilium.europa.eu/uedocs/c
MemberStates_data/docs/pressdata/en/ec/119175.pdf (accessed on 5 February 2011).

5. Information Society
The development of information society has been one of the key objectives of
Lisbon Strategy from the very outset. The economic and financial crisis did not provide a
favourable framework for actions in this field, but, as mentioned in last year’s PISM
report, progress here depends not only on government actions, but is also a result of
broader technological and social changes.
5.1. General Development Level
In the 2010 edition of the digital economy ranking prepared by the Economist
Intelligence Unit,
92
the best performing country was Sweden, which overtook Denmark
(2
nd
) and Finland (4
th
), whose position improved considerably compared to 2009. The
most significant drop in the ranking was observed in the Netherlands, Lithuania,
Slovakia and France (five places down). Among the 20 best performing countries nine
are EU members. The lowest positions in the rankings are held by Poland, Bulgaria and
Romania. The latter two improved their positions slightly compared to 2009, but they
nonetheless face a huge gap in the field of digital economy. The exceptions for the
EU-12 are Estonia and Malta, which hold a relative high position, performing better than
Greece, Italy or Portugal.
93
Table 19. Ranking of EU Countries’ Digital Development (without Cyprus and Luxembourg) in 2010
Country
Position in the ranking in 2010
Position in the ranking in 2009
Score (max. 10)
SE
1
2
8.49
DK
2
1
8.41
FI
4
10
8.36
NL
5
3
8.36
UK
14
13
7.89
AT
15
14
7.88
IE
17
18
7.82
DE
18
17
7.80
FR
20
15
7.67
BE
21
20
7.52
MT
23
23
7.32
ES
24
25
7.31
EE
25
24
7.06
The Polish Institute of International Affairs
56
Lisbon
Strategy
92
The Digital economy rankings: Beyond e-Readiness prepared every year by the Economist
Intelligence Unit in cooperation with the IBM institute of Business Value is one of the most reliable
sources on digital development. The ranking examines different dimensions of the e-readiness, including
technology infrastructure, business, social, legal and cultural environment, government actions as well as
consumer and business ICT use in 70 countries.
93
Economist Intelligence Unit, Digital economy rankings 2010. Beyond e-readiness, 2010, p. 4,
http://graphics.eiu.com/upload/EIU_Digital_economy_rankings_2010_FINAL_WEB.pdf (accessed
on
21 January 2011).

Country
Position in the ranking in 2010
Position in the ranking in 2009
Score (max. 10)
IT
27
26
6.92
PT
28
28
6.90
SI
29
29
6.81
CZ
31
31
6.29
EL
33
33
6.20
LT
34
32
6.14
HU
35
35
6.06
LV
37
37
5.79
SK
38
36
5.78
PL
39
39
5.70
BG
45
47
5.05
RO
47
48
5.04
Source: Digital economy rankings 2010. Beyond e-readiness, Economist Intelligence Unit, 2010.
5.2. Internet Users
The increase in the number of Internet users in the EU Member States is a stable
tendency observed in recent years. According to Eurostat, in 2004 the percentage of
regular Internet users (at least once a week on average) stood at 36%. In 2010 it reached
65%, a 5 pp increase from the preceding year.
94
Statistics show that the Member States
with the highest share of Internet use include: Sweden (88%, up 2 pp compared to
2009), the Netherlands (88%, up by 2 pp), Luxembourg (86%, up by 3 pp), Denmark
(86%, up by 4 pp) and Finland (83%, up by 4 pp). The worst performers are: Italy (48%,
up by 6 pp compared to 2009), Portugal (47%, up by 5 pp), Bulgaria (42%, up by 2 pp),
Greece (41%, up by 3 pp) and Romania (34%, up by 3 pp); the latter has considerably
low Internet use (only a third of the population) and is well behind the second-worst
performing country, Greece (7 pp).
As for the speed of broadband lines, these are considerably faster than the year
before. According to the Communication Committee (CoCom) working document of
July 2010, the fastest fixed broadband lines in the EU (10 megabits per second or higher)
accounted for 29% of all broadbands. This was an increase by 15% from the preceding
year.
95
Progress was also noted in access to broadband Internet, which went up from
23.9% (per 100 inhabitants in July 2009) to 25.6% in July 2010, although growth was
the slowest since 2003, when the data collection had begun.
96
The Netherlands and
Denmark have the highest level of access, respectively at 38.7% and 38.2%. The worst
From Lisbon to Europe 2020
Lisbon
Strategy
57
94
H. Seybert, A. LOOF, Internet usage in 2010: Households and Individuals, Eurostat Data in
Focus 50/2010, http://epp.eurostat.ec.europa.eu/cache/ITY_OFFPUB/KS-QA-10-050/EN/KS-QA-10-050-
EN.PDF (accessed on 21 January 2011).
95
Broadband access in the EU: situation at 1 July 2010, Brussels, 21 November 2010, p. 22,
http://ec.europa.eu/information_society/newsroom/cf/item-detail-dae.cfm?item_id=6502&language=
default (accessed on 21 January 2011).
96
Ibidem, p. 11.
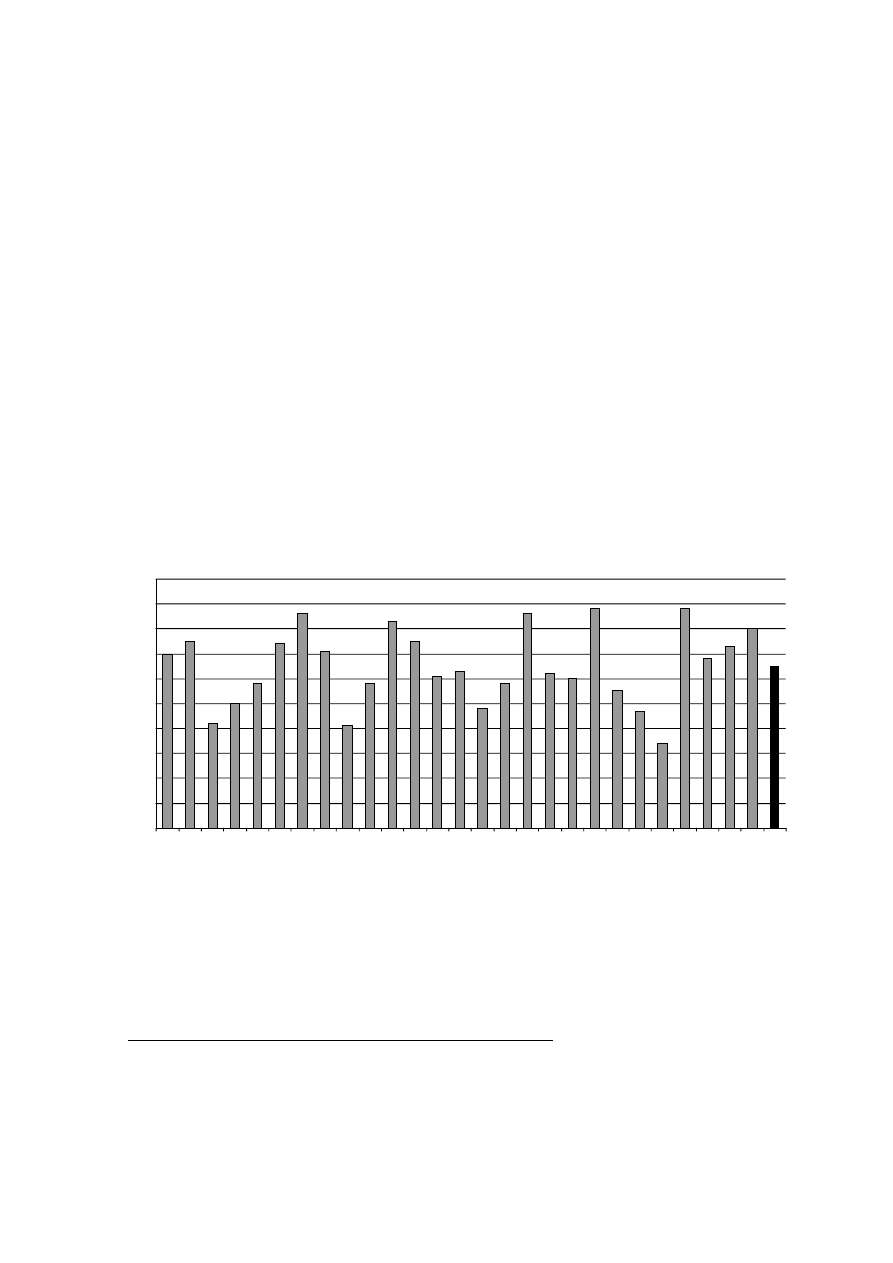
performers are Slovakia (15.5%), Poland (14.9%), Bulgaria (13.9%) and Romania
(13.7%).
97
The CoCom report indicates that the distance between the best and the worst
performing countries decreased slightly due to lower penetration growth in the best
performing countries.
98
The Communications Committee working document indicates
the differences between the Member States, revealing that the ones with a lower
penetration rate are not catching up sufficiently (Slovakia), while countries with
a relatively high penetration rate, such as Luxembourg, Germany or France, continue
boosting their performance.
99
The CoCom working document shows a very swift
growth of the mobile broadband market, which rose by 30% in take-ups between July
2009 and 2010, but its share remains relatively low (6%). In 2010 the EU fixed
broadband market, with its 128,356,776 lines, was the largest in the world. As for
mobile broadband connections, the penetration rate grew from 5.2% in January 2010 to
6.1% in July 2010, but it is expected to slow down in the coming months.
100
This
dynamic market reached 500 mln connected devices in 2010 and is expected to double
in 2011. Most of the connections will come from the Asia-Pacific region (400 mln) and
more than 200 mln each from North America and Europe.
101
Chart 7. Internet Use by Individuals
(% of individuals using the Internet at least once a week on average)
Source: H. Seybert, A. LOOF, Internet usage in 2010 – Households and Individuals, Eurostat Data in
Focus 50/2010, http://epp.eurostat.ec.europa.eu/cache/ITY_OFFPUB/KS-QA-10-050/EN/KS-Q
A-10-050-EN.PDF.
The Polish Institute of International Affairs
58
Lisbon
Strategy
EU-27
AT
BE
BG
CY
CZ
DE
DK
EE
EL
ES
FI
FR
HU
IE
IT
LT
LV
MT
NL
PL
PT
RO
SE
SI
SK
UK
LU
0
10
20
30
40
50
60
70
80
90
100
97
Ibidem, p. 5.
98
Ibidem, p. 5.
99
Ibidem, p.10.
100
Ibidem, p.10.
101
T. Constanza, Mobile broadband subscriptions to bypass 1bn in 2011—report, Silicon
Republic, www.siliconrepublic.com/comMemberStates/item/19891-mobile-broadband-subscripti/ (accessed
on 15 February 2011).

Chart 8. Fixed Broadband Penetration Rate (% of population, July 2010)
Source: European Commission, Information Society, http://ec.europa.eu/information_society/newsroom/
cf/item-detail-dae.cfm?item_id=6502&language=default.
5.3. e-Government
The term e-government refers to use of the ICT technologies not only by the
government but also by the entire public sector in order to deliver better services to
citizens and businesses.
The 2010 United Nations e-government survey Leveraging e-government at
a time of financial and economic crisis examined the development of e-government.
Among the 20 best performers there are 10 EU Member States: the United Kingdom, the
Netherlands, Denmark, Spain, France, Sweden, Germany, Belgium, Finland and
Estonia.
102
The countries at the top of the list are: the Republic of Korea, the United
States and Canada. As far as the e-government participation ratio is concerned in the top
20 countries in the survey, also 10 EU countries are represented: Spain, the UK, Estonia,
Denmark, Germany, France, the Netherlands, Belgium, Lithuania and Slovenia.
103
According to the Commission, the delivery of public online services in all 27 Member
States increased considerably, from 21% in 2000 to 71% in 2009,
104
although the
number of citizens using public services online is estimated at 32% of the EU
population.
105
As far as e-government usage by individuals in EU-27 is concerned, the
figures for 2010 indicate a growth of 2 pp compared to 2009. The Member States with
the highest e-government use are Denmark (72%) and Sweden (62%). Poland, with
21% of e-government users is, similarly to the preceding year, among the worst
performing Member States, followed by: Italy (17%), Bulgaria (15%), Greece (13%) and
Romania (7%). The three poorest performers in e-government are even below the
performance of a candidate country: Croatia (16%).
106
According to Eurostat data,
From Lisbon to Europe 2020
Lisbon
Strategy
59
EU-27
AT
BE
BG
CY
CZ
DE
DK
EE
EL
SE
FI
FR
HU
IE
IT
LT
LV
MT
NL
PL
PT
RO
ES
SI
SK
UK
LU
0.0%
5.0%
10.0%
15.0%
20.0%
25.0%
30.0%
35.0%
40.0%
45.0%
102
UN Global eGovernment Survey 2010, Leveraging e-government at a time of financial and
economic crisis, www2.unpan.org/egovkb/global_reports/10report.htm (accessed on 1 February 2011).
103
Ibidem.
104
Digital Agenda: eGovernment Action Plan - what would it do for me? Europa Press Release,
Brussels, 15 December 2010, http://europa.eu/rapid/pressReleasesAction.do?reference=MEMO/10/681
&format=HTML&aged=0&language=EN&guiLanguage=en (accessed on 10 February 2011).
105
Ibidem.
106
Eurostat, http://appsso.eurostat.ec.europa.eu/nui/show.do?dataset=isoc_si_igov&lang=en
(accessed on 10 December 2010.
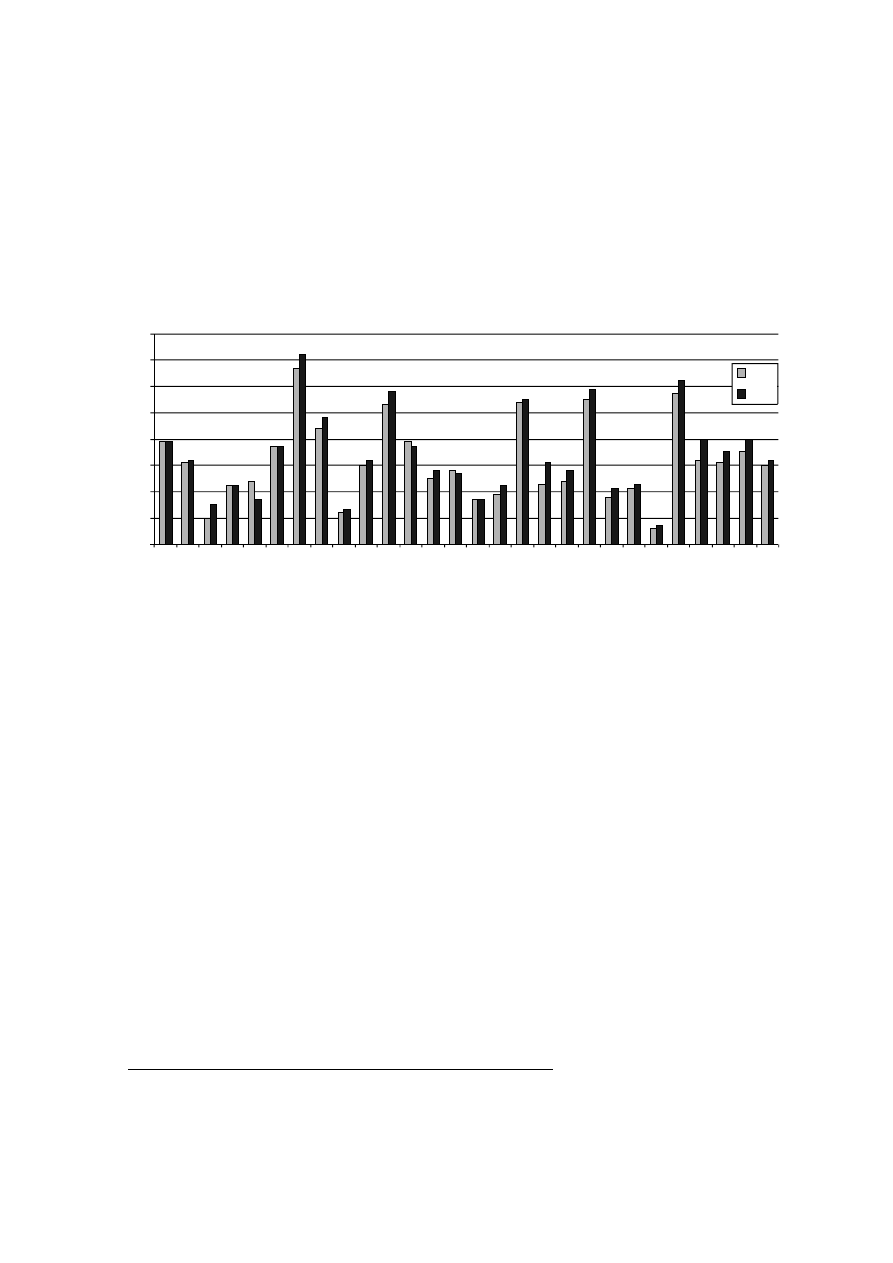
the highest growth was in Slovenia (by 8 pp to 40%) and Latvia (by 8 pp to 31%); the
most significant decrease was recorded in the Czech Republic (by 7 pp to 17%). Estonia
(48%) and Slovenia (40%) rank relatively high among the Member States and the
percentage of e-government users there is growing rapidly.
107
During work on this study
data on online availability of public services and Internet users for enterprises in 2010
was not available.
Chart 9. % of e-Government Usage by Individuals in the Last Three Months (demand side)
in 2009 and 2010
Source: Eurostat, http://appsso.eurostat.ec.europa.eu/nui/show.do?dataset=isoc_si_igov&lang=en.
In December 2010 the European Commission presented a five-year
e-government Action Plan aimed at developing availability and take-up of online public
services to citizens and business by increasing the efficiency and cost effectiveness of
e-government services.
The new EU economic strategy, Europe 2020, is largely focused on the
development of digital society. One of its seven flagship initiatives, “Digital Agenda For
Europe,” deals directly with this area and aims at extensive use of the Information and
Communication Technologies (ICT) potential for all the fields of activity: business,
leisure, communication and supplying information. One of the main goals of the
Agenda is to enhance innovation, economic growth and competitiveness through the
development and extensive use of the ICT, e.g. by boosting the use of e-government
services by citizens to 50% and by business to 80% by 2015.
108
The Commission
estimates that the ICT sector generates 5% of the European GDP for a market value of
€660 billion annually. The ICT sector also exerts a meaningful social impact on more
than 250 million daily Internet users in the EU.
109
The Polish Institute of International Affairs
60
Lisbon
Strategy
0
10
20
30
40
50
60
70
80
2009
2010
EU-27
AT
BE
BG
CY
CZ
DE
DK
EE
EL
ES
FI
FR
HU
IE
IT
LT
LV
MT
NL
PL
PT
RO
SE
SI
SK
UK
LU
107
Ibidem.
108
Communication from the Commission to the European Parliament, the Council, the European
Economic and Social Committee and the Committee of the Regions, A Digital Agenda for Europe,
http://eur-lex.europa.eu/LexUriServ/LexUriServ.do?uri=CELEX:52010DC0245(01):EN:NOT (accessed on
10 February 2011).
109
Ibidem.

5.4. Conclusions
Information society is developing gradually despite the last global economic and
financial crisis, but progress in the EU Member States represents a mixed picture. This is
reflected in digital economy rankings. Some EU countries enjoy a high level of
development (Sweden, Denmark and Finland), with three laggards on the opposite side of
the spectrum: Poland, Bulgaria and Romania; all three have a problem with bridging the
gap to other EU countries. This long negligence necessitates efforts to support the
development of such information society elements as Internet infrastructure or availability
and accessibility of online public services. The number of Internet users is growing rapidly,
and progress is also observed in broadband connections and e-government use.
5.5. Evaluation
5.5.1. Positive
As can be seen from statistics, Sweden, Finland, the Netherlands and Denmark
are at the top of all rankings and hence can be set as examples for the other Member
States. A relatively high position of Estonia can also be an example, especially for the
new Member States.
5.5.2. Negative
In most rankings on the development of digital society, Greece, Romania and
Bulgaria are the worst performing countries. Their modest improvements are not
sufficient to bridge the digital gap to the other EU countries. It has to be pointed out that
Poland’s position remains very low in most rankings.
5.6. Recommendations
1. The Europe 2020 strategy’s flagship “Digital Agenda for Europe” initiative
aims at boosting use of the ICT. It should be implemented smoothly at the EU
level. A special emphasis should be placed on opening markets for online
content and copyrights protection issues.
2. Cooperation of the public and private sector in Public-Private Partnership
(PPP) for investment in infrastructure (especially telecommunications
infrastructure) should be enhanced. The Member States should also use the
regulations governing EU state aid (e.g. 2009 guidelines concerning the swift
deployment of broadband networks) to support investments in these fields.
3. The complex and interdisciplinary nature of information society issues
requires reinforced interplay of the different policies not only at the EU level,
but also at the national and regional levels. Strong ownership at all levels is a
prerequisite for achieving progress in this area.
4. The fight against digital exclusion, especially in the Member States with the
lowest rate of regular Internet users and poor availability of e-government
services, should be continued with the support of the European Commission.
From Lisbon to Europe 2020
Lisbon
Strategy
61

6. Energy and Climate
Energy and climate change are key issues for the EU and constitute elements of its
strategic economic interests. They were also important components of the Lisbon Agenda.
Since almost all greenhouse gas (GHG) emissions are a side-effect of energy production, the
two areas are closely connected, and they are also linked closely with the external aspect of
EU actions, because the GHG issue can only be solved globally by all the largest GHG
producers. Hence energy and climate are an important part of the EU’s external policy,
especially in global climate negotiations and external aspects of energy policy.
6.1. Reduction of Greenhouse Gas Emissions
According to the European Environment Agency (EEA), between 1990 and 2008
emissions in the EU-15 decreased by 6.5% despite the GDP rise by almost 45%. The
latest data available is for 2008, when the EU-15 GHG emissions fell by 1.9% against
the year before. For the EU-27, the emissions went down by 2% in 2008. According to
the Commission’s provisional data for 2009, EU-15 and EU-27 GHG emissions were
down by 6.9% compared to 2008, and 2009 emissions in the EU-27 are estimated at
17.3% below the 1990 level.
110
One third of the GHG came from Germany and the United Kingdom, which
managed to reduce their emissions remarkably (Germany—22%, the UK—18.5% in
1990–2008), exerting a significant impact on the EU-27 performance. In Germany, the
reduction was due to efficiency improvements in power and heating plants, combined
heat and power generation and restructuring efforts in the former East German Länder.
In the UK the reductions were mostly due to liberalisation of the energy markets and
a switch from oil and coal to gas. Poland, the sixth producer of GHG (8% for EU-27),
decreased its emissions between 1988 (the base year) and 2008 by 29.8% through
economic restructuring resulting in heavy industry downfall and improvements in
energy efficiency.
111
In 2008 the level of emissions in eight Member States was still
above base year levels, while in 17 others it was below.
112
EEA projections show that the EU-15 will reach the Kyoto target despite a
possible short-term rise in emissions resulting from economic recovery after the crisis.
113
The Commission report indicates that only two EU Member States (Austria and Italy)
may have difficulties with meeting their targets. The EEA analysis also suggests shortfalls
The Polish Institute of International Affairs
62
Lisbon
Strategy
110
European Commission, Progress Towards Achieving the Kyoto Objectives, Report from the
Commission to the European Parliament and the Council, (required under Art. 5 of Decision 280/2004/EC
of the European Parliament and of the Council concerning a mechanism for monitoring Community
greenhouse gas emissions and for implementing the Kyoto Protocol), SEC(2010) 1204, Brussels,
12.10.2010, http://epp.eurostat.ec.europa.eu/tgm/table.do?tab=table&init=1&plugin=1& language=
en&pcode=tsien010 (accessed on 22 January 2011).
111
Ibidem, pp. 5–6.
112
These countries were: Austria, Denmark, Ireland, Italy, Luxembourg, Portugal, Slovenia and
Spain, (Cyprus and Malta had no Kyoto commitments); Tracking progress towards Kyoto and 2020 targets
in Europe, European Environment Agency Report 7/2010, Copenhagen, 2010, www.eea.europa.eu/
publications/progress-towards-kyoto, p. 7 (accessed on 23 January 2011).
113
Ibidem, p. 7.

in Denmark, and these three countries should increase their efforts to achieve further
emissions reductions.
114
Among the EU-12, nine countries will most probably meet the Kyoto targets, but
this is unlikely to undermine the efforts of the EU-27 to meet the Kyoto obligations.
Some of the Member States will exceed their targets and thus compensate for the poor
performers. The Commission indicates that in 2008, EU-27 emissions were 14.3%
below base year’s levels.
In 2009 the EU adopted a climate and energy package that sets a series of
provisions to address climate change until 2020 and beyond. One of the main targets
was GHG reduction by 20% or more before 2020 compared to the 1990 level. The
package was approved by the European Parliament and Council in December 2008 and
became law in June 2009. The EEA assesses that the 20% reduction target is feasible if
the Member States fully implement the package.
115
The 20% GHG reduction below the 1990 levels is one of the chief targets of the
package and an element of the Europe 2020 adopted by the European Council in June
2010. One of its flagship projects, “Smarter use of scarce resources,” establishes energy
efficiency as the main principle for various EU policies, such as energy, transport,
climate change or industry. The initiative is aimed at enhancing cooperation between
those policies, settings new EU objectives, including a reduction of European
greenhouse gas emissions by 80–95% by 2050.
116
After the fiasco of negotiations during the COP-15 summit in Copenhagen in 2009,
the EU continued its engagement to reach a binding climate agreement with external
partners. The Union’s position adopted by the Environment Council on 14 October 2010
and then endorsed at the European Council summit on 28–29 October 2010, underlined
the need to speed up negotiations on ways to establish legally-binding, ambitious,
post-2012 regimes to fight climate change. In line with the conclusions, the new agreement
would be based on the Kyoto Protocol and use the political guidance of the Copenhagen
Conference.
117
The EU also reaffirmed its conditional proposal to move by 2020 to a 30%
reduction target compared to 1990, provided that this was an element of the new post-2012
agreement. The 16
th
Conference of the Parties to the UN Framework Convention on
Climate Change was held in Cancún, Mexico, from 29 November to 10 December 2010.
The negotiating parties agreed to keep the target below two degrees Centigrade of global
warming. Special measurement, reporting and verification (MRV) rules concerning emission
reductions were also endorsed and a Global Green Fund with a budget of $100 billion was
set up to help the developing countries fight against climate change. Progress was noted on
the way to establishing a plan for reducing emissions from deforestation and degradation
From Lisbon to Europe 2020
Lisbon
Strategy
63
114
Ibidem.
115
Tracking Progress Towards Kyoto…, op. cit., p. 30.
116
A resource-efficient Europe—Flagship initiative under the Europe 2020 Strategy, Brussels,
26 January 2011, COM(2011) 21, http://ec.europa.eu/resource-efficient-europe/pdf/resource_efficient_
europe_en.pdf (accessed on 26 January 2011).
117
Preparation for the 16th Conference of the Parties to the UN Framework Convention on
Climate Change, Cancún, 29 November to 10 December 2010, Council Conclusions, Luxembourg,
14 October 2010, www.consilium.europa.eu/uedocs/cMemberStates_data/docs/pressdata/en/envir/
117096.pdf (accessed on 23 January 2011).
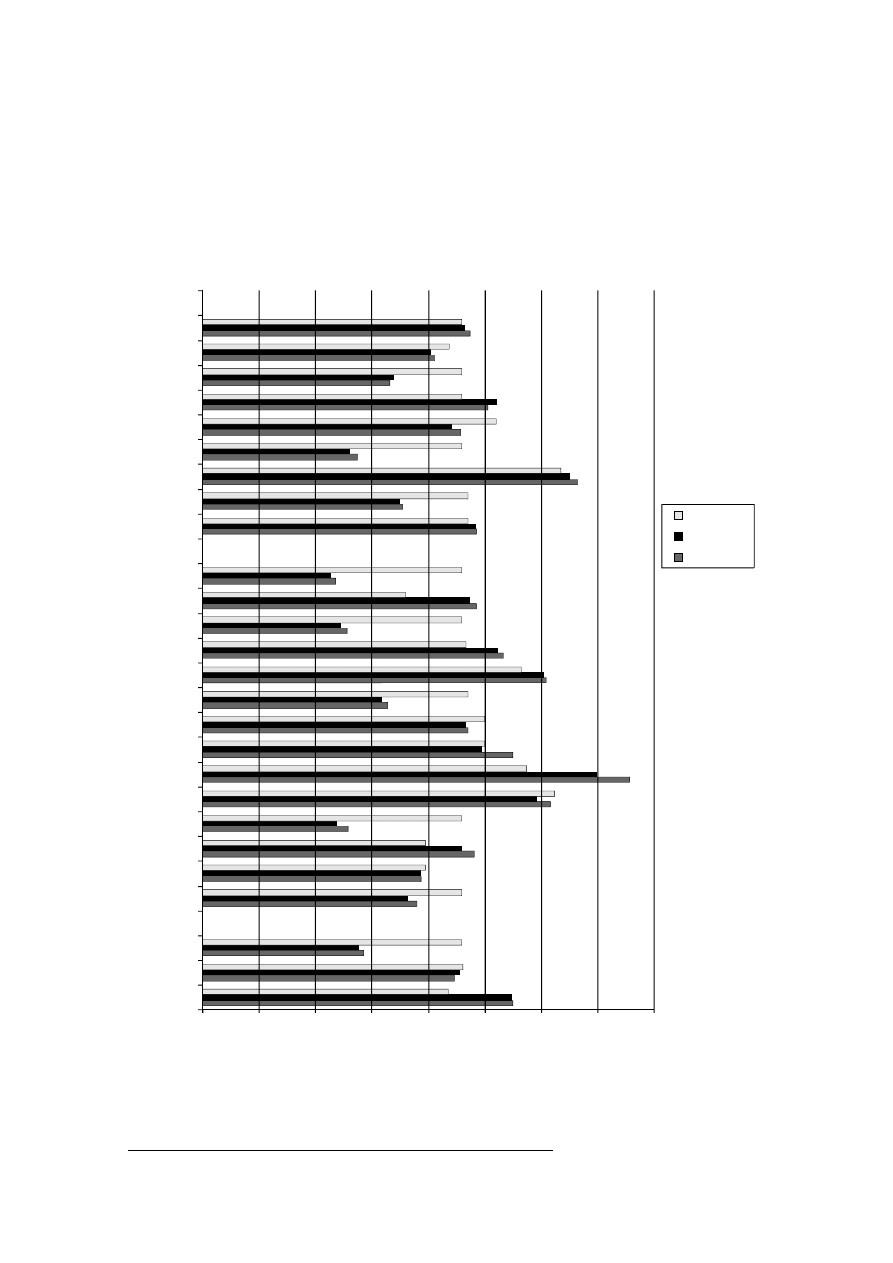
(REDD) with a view to hampering deforestation in Indonesia and Brazil.
118
The progress in
negotiations can be seen as a success for the EU, which played an important role in bringing
climate change issues back onto the international agenda. Nevertheless, the negotiating
parties are still far from concluding a post-2012 agreement.
Chart 10. Greenhouse Gas Emissions in 2007 and 2008, Kyoto Baseyeal
(Actual Base Year = 100, Malta and Cyprus have no Kyoto targets)
Source: Eurostat, http://epp.eurostat.ec.europa.eu/tgm/table.do?tab=table&init=1&plugin=1&language
=en&p code=tsien010.
The Polish Institute of International Affairs
64
Lisbon
Strategy
0
20
40
60
80
100
120
140
160
AT
BE
BG
CY
CZ
DE
DK
EE
EL
ES
FI
FR
HU
IE
IT
LT
LU
LV
MT
NL
PL
PT
RO
SE
SI
SK
UK
EU-15
EU-27
Kyoto target
2008
2007
118
A. Willis, “Cancun climate deal restores faith in UN process,” EU Observer,
http://euobserver.com/885/31482, (accessed on 23 January 2011).
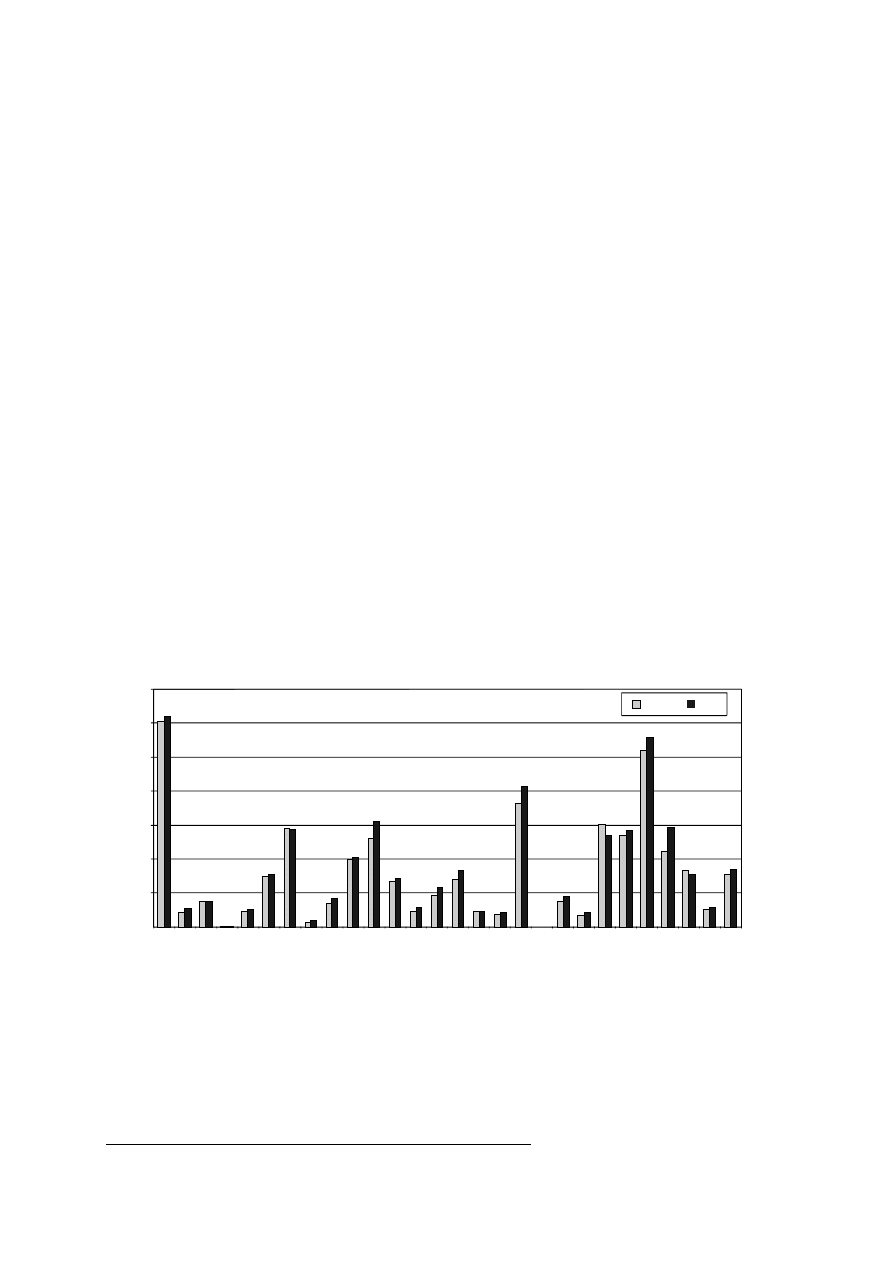
6.2. Generating Electricity from Renewable Resources
Higher electricity generation from renewable resources was one of the Lisbon
objectives, with the 21% target also set by Directive 2001/77/EC. The 2010 EU
Industrial Scoreboard indicates that the alternative energy sector has been growing
dynamically over the past three years. The figures show that 15 companies (13 based in
the EU) invested €500 million into R&D in clean energy technologies, accounting for an
increase of 28.7% against the preceding year
.
119
As for the share of renewable resources in generating energy, the most recent
data available (for 2008) shows that the progress remained modest that year. Despite the
overall EU-27 increase from 15.5% in 2007 to 16.7% in 2008, the 21% target for 2010
is unlikely to be met. The only Member States currently meeting their national
objectives are Germany (15.4%, target 12.5%) and Hungary (5.6%, target 3.6%). The
EU members very close to their national targets and likely to meet the 2010 objective
include: Denmark (28.7%, target 29%), Finland (31%, target 31.5%) and Slovenia
(29.1%, target 31%), with the remaining EU countries unlikely to achieve the 2010
objective. Compared to 2007, high growth was recorded in Slovenia (by 7 pp), Finland
(5 pp) and Latvia (4.8 pp), with a considerable drop noted in Portugal (by -3.2 pp),
Slovakia (-1.1 pp) and Denmark (-0.3 pp). Austria (62%) and Sweden (55.5%) are the EU
Member States with the highest level of renewable energy resources, with the latter’s
share in electricity production the lowest among others in Luxembourg (4.1%, up by
0.4 pp), Lithuania (4.6%, unchanged) and Belgium (5.3%, up by 1.1 pp).
120
Chart 11. Percentage of Renewable Resources in Generating Electricity in 2007 and 2008
(for Malta this indicator is 0)
Source: Eurostat, http://epp.eurostat.ec.europa.eu/portal/page/portal/energy/data/database.
The 2020 climate and energy targets included a challenging task to increase to
20% the consumption of EU energy obtained from renewable resources, which would
more than double the 2006 level of 9.2%. This objective is ambitious but may be
difficult to achieve, as the most recent rate available for EU-27 is 10.3% for 2008. On
the basis of the Renewable Energy Directive 2009/28/EC, the Member States submitted
From Lisbon to Europe 2020
Lisbon
Strategy
65
0.0
10.0
20.0
30.0
40.0
50.0
60.0
70.0
2007
2008
EU-27
AT
BE
BG
CY
CZ
DE
DK
EE
EL
ES
FI
FR
HU
IE
IT
LT
LV
MT
NL
PL
PT
RO
SE
SI
SK
UK
LU
119
The 2010 EU Industrial R&D Investment Scoreboard 2010…, op. cit., p. 7.
120
Source: Eurostat, http://epp.eurostat.ec.europa.eu/portal/page/portal/energy/data/database.
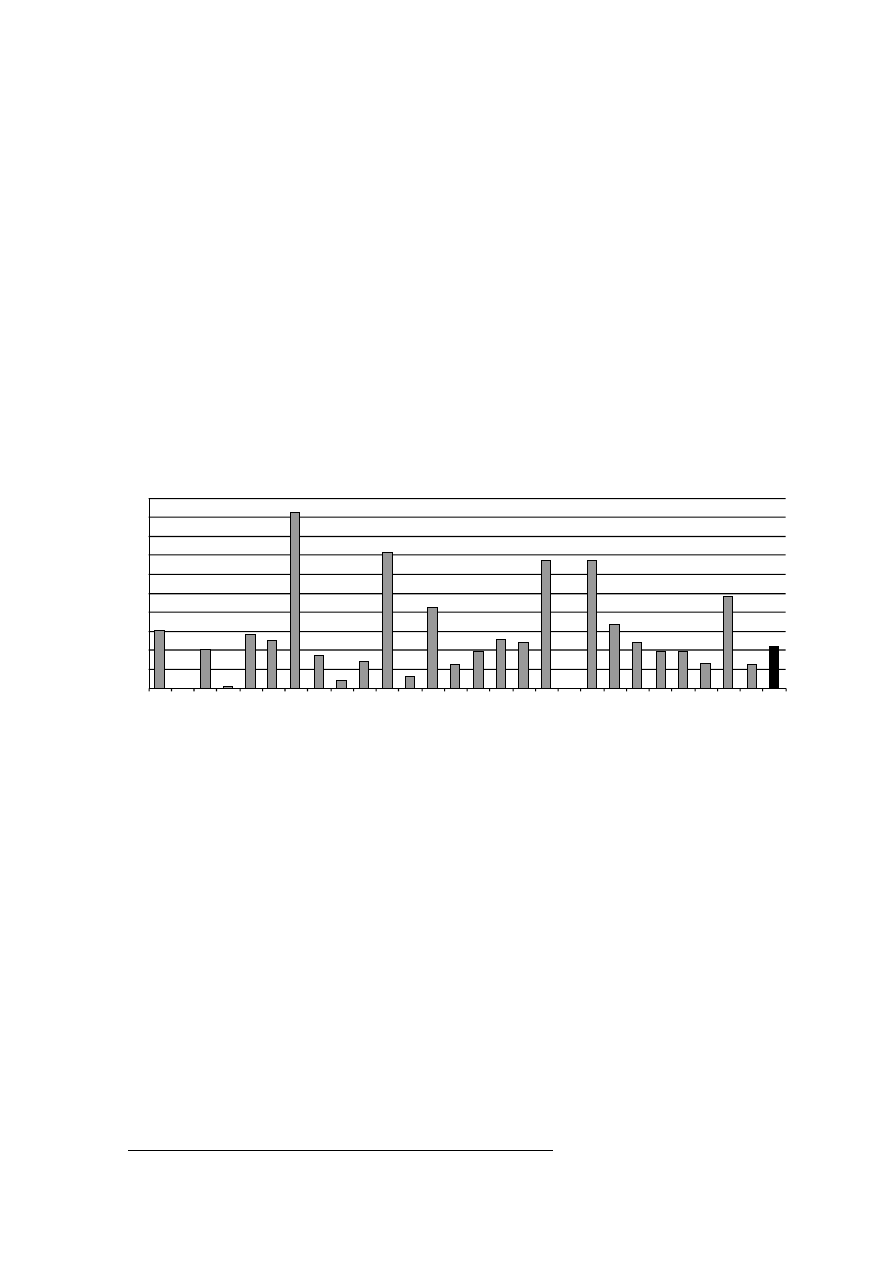
national renewable energy action plans, which outline how each of them expects to
reach the 2020 targets.
121
6.3. Development of Cogeneration
Only a minor increase was recorded in statistics on the use of heat engines or
power stations to generate both electricity and heat at the same time (cogeneration). The
most recent data available (for 2008) puts this use at 11%, only a 0.1 pp higher than in
2007. The highest share of cogeneration in energy production is recorded in Denmark
(46.1%), where growth was also noted in 2008 (3.3 pp). Next came Finland (35.6%),
the Netherlands (33.6%) and Latvia (33.6%) where the share fell sharply (by 7.3 pp).
In Poland cogeneration accounted for 16.9% of electricity production in 2008 following a
slight drop (by 0.4 pp) compared to 2007.
Chart 12. Percentage of Electricity Generated from Cogeneration in 2008
(for Malta the indicator is 0, no data for Belgium)
Source: Eurostat, http://epp.eurostat.ec.europa.eu/portal/page/portal/energy/data/main_tables.
6.4. Conclusions
The climate and energy issue will remain vital in the EU’s internal and external
policies. The economic and financial crisis exerted an impact on GHG reductions, but
its influence on Kyoto objectives’ attainment is minor. The main polluting countries
(Germany and the United Kingdom) managed to diminish their GHG emissions, and the
EEA suggests that the performance of the Member States exceeding their targets might
compensate for the poorest performers.
The alternative energy market continues to grow dynamically, although the
EU-27 target of a 21% share will not be met, with cogeneration development remaining
marginal.
Energy and climate change issues are linked with other problems, such as new
technologies’ development or a further liberalisation of the internal market, so they
cannot be examined in isolation. The fulfilment of the objectives of the climate and
The Polish Institute of International Affairs
66
Lisbon
Strategy
EU-27
AT
BE
BG
CY
CZ
DE
DK
EE
EL
ES
FI
FR
HU
IE
IT
LT
LV
MT
NL
PL
PT
RO
SE
SI
SK
UK
LU
0
5
10
15
20
25
30
35
40
45
50
121
European Commission, Renewable Energy, Transparency Platform, http://ec.europa.eu/energy/
renewables/transparency_platform/transparency_platform_en.htm (accessed on 23 January 2011).

energy package will require reinforced cooperation with private partners and higher
investment in green technologies. The latter may be a problem, as most Member States
are continuing efforts to consolidate their public finances. The private sector will also be
reluctant to finance new and risky technologies when the global economic situation is
still far from stable and economic growth in the developed economies remains sluggish.
The question also arises whether or not the EU will be able to assure proper financial
resources for the development of green technologies in the new Multiannual Financial
Framework 2014–2020. The EU needs to encourage innovations in the green energy
sector in order to meet the growing competition from China and the U.S.
Higher investment is important, although the regulatory sphere and tariffs will
remain the key issues in the EU.
6.5. Evaluation
6.5.1. Positive
Slovenia recorded the greatest progress in the renewable energy sector, while
Denmark registered the further rise in cogeneration use and remained the
unquestionable leader in this respect.
6.5.2. Negative
Austria and Italy had problems achieving the Kyoto GHG emission reduction
targets, while Lithuania experienced difficulties with developing the alternative energy
sector.
6.6. Recommendations
1.
The development of green technologies should be a crucial objective for the
Member States. The PPP’s role should be reinforced in this respect, especially
in the field of innovation in the alternative energy sector and higher energy
efficiency. The Member States should improve the legal and business
environment to boost cooperation in the PPP framework.
2.
Energy and climate is a sphere touching upon other sectors as well, including
the single market, research and development or employment. Consequently,
successful implementation of objectives requires close cooperation between
different sectors of governance, also within the European Commission
(Energy, Enterprise and Industry, Environment, Climate Action, Research and
Internal Market).
3.
As the climate change issue requires coordinated action, the EU should
implement a coherent negotiation strategy with the largest GHG emitters in
the UNFCCC framework, using such international fora as the G20 to promote
its vision and interests in the climate change arena.
4.
The EU needs to draft an overall comprehensive strategy for financing all
aspects of the 20/20/20 goals, a strategy based on reliable assumptions
(e.g. regarding emission reduction costs) and taking into consideration the
current budgetary condition of the Member States. The Union should also
From Lisbon to Europe 2020
Lisbon
Strategy
67

consider how to better use the existing financial instruments, such as the EU
budget or EIB, to support green goals.
7. Employment and Social Policy
The global downturn of 2008–2010 wrecked the pre-crisis efforts to boost
employment. The crisis reversed the situation on the labour markets in the EU Member
States, and job protection became one of the top priorities on the economic agenda of
Union members. The Lisbon Strategy provided a sound framework for launching
anti-crisis measures directed at the labour market.
7.1. Overall Employment Rate
The overall employment rate (in the 15–64 age group) dropped from 65.9% in
2008 to 64.6% in 2009, indicating that the achievement of the Lisbon target was
unfeasible. This decrease was slower than in the U.S., where employment fell by more
than 3 pp (to 67.6% in 2009). Only five countries (against eight mentioned in last year’s
PISM report) managed to reach their targets: (Austria: 71.6%, Germany: 70.9%,
Denmark: 75.7%, the Netherlands: 77%, and Sweden: 72.2%). Employment rates in
Cyprus and the UK were slightly below the target. The lowest rates were registered in
Malta (54.9%), Hungary (55.4%) and Italy (57.5%), with the drop in employment rates
in 2008–2009 most profound in Latvia (–7.7 pp), Estonia (–6.3 pp) and Ireland
(–5.7 pp). The only states recording rising employment in 2009 were: Luxembourg
(1.8 pp) Germany (about 0.2 pp) and Poland (0.1 pp).
Table 20. Employment Rates in the EU (age: 15–64)
Member States
Total
Women
Older people
AT
71.6
66.4
41.1
BE
61.6
56.0
35.3
BG
62.6
58.3
46.1
CY
69.9
62.5
56.0
CZ
65.4
56.7
46.8
DE
70.9
66.2
56.2
DK
75.7
73.1
57.5
EE
63.5
63.0
60.4
EL
61.2
48.9
42.2
ES
59.8
52.8
44.1
FI
68.7
67.9
55.5
FR
64.2
60.1
38.9
HU
55.4
49.9
32.8
IE
61.8
57.4
51.0
IT
57.5
46.4
35.7
The Polish Institute of International Affairs
68
Lisbon
Strategy

Member States
Total
Women
Older people
LT
60.1
60.7
51.6
LU
65.2
57.0
38.2
LV
60.9
60.9
53.2
MT
54.9
37.7
28.1
NL
77.0
71.5
55.1
PL
59.3
52.8
32.3
PT
66.3
61.6
49.7
RO
58.6
52.0
42.6
SE
72.2
70.2
70.0
SI
67.5
63.8
35.6
SK
60.2
52.8
39.5
UK
69.9
65.0
57.5
EU-27
64.6
58.6
46.0
Source: European Commission, Employment in Europe 2010.
The economic activity rate in the EU stood at 71%, with the highest rate recorded
in Denmark (81%), and the lowest observed in countries with the lowest employment
rates, i.e. Malta, Hungary, Italy, Poland.
122
7.2. Employment Rate for Women
The employment rate for women went down from 59.1% in 2008 in the EU-27 to
58.6% in 2009 (1.4 pp below target). Fourteen Member States managed to attain their
goals. The highest level was registered in Denmark (73.1%), the Netherlands (71.5%)
and Sweden (70.2%). Malta (37.7%), Italy (46.4%) and Greece (48.9%) in turn were the
states with the lowest employment among women. The highest drop was reported in
Latvia (–4.6 pp), Estonia (–3.3 pp) and Ireland (–2.8 pp), with positive growth noted
in Luxembourg (1.8 pp), Germany (0.8 pp), Austria (0.6 pp), the Netherlands, Poland
(both 0.4 pp), Greece and Malta (0.2 pp each).
7.3. Employment Rate for Older People
In contrast to the above two indicators, the number of older people employed
rose by 0.4 pp in 2009, and as many as 11 states were able to attain the 50% target. The
highest rates were noted in Sweden (70%), Estonia (60.4%), Denmark and the UK
(57.5% each), against the lowest persisting in Malta (28.1%), Poland (32.3%) and
Hungary (32.8%). The biggest drop in the employment rate was recorded in Latvia
(–6.2 pp), with the highest growth registered in Luxembourg (4.1 pp).
From Lisbon to Europe 2020
Lisbon
Strategy
69
122
European Commission, Employment in Europe 2010, p. 69.

7.4. Unemployment Rate
Seasonally-adjusted unemployment amounted to 23.2 million and remained
stable in the EU.
123
According to the EC’s estimates, the unemployment rate stood at
9.6% (up from 8.9% in 2009). In the euro area unemployment exceed 10% (up from
9.5%). The lowest unemployment was noted in Austria (4.4%) and the Netherlands
(4.5%), with the highest in Spain (20.1%), Latvia (19.3%) and Lithuania (17.8%, the
highest increase in the EU—by 4.1 pp). A drop in the unemployment rate was registered
in 2010 in Austria, Malta and Germany only.
Unemployment grew faster among men than among women. Between the
second quarter of 2008 and second quarter of 2010, the rise in unemployment for men
accounted for two-thirds of the increase.
124
Most strongly affected were males aged
35–44, young male adults (25–34) and male youth (15–24). With respect to age, young
adults (25–34) were affected most, as statistics show that in this group unemployment
went up by 30% between the second quarter of 2008 and the second quarter of 2010,
with the situation in this respect especially alarming in Spain, France and the UK.
Table 21. Unemployment Rates in the EU
Member State
2009
2010
Member State
2009
2010
AT
4.8
4.4
LT
13.7
17.8
BE
7.9
8.6
LU
5.1
5.5
BG
6.8
9.8
LV
17.1
19.3
CY
5.3
6.8
MT
7.0
6.6
CZ
6.7
7.3
NL
3.7
4.5
DE
7.5
7.3
PL
8.2
9.5
DK
6.0
6.9
PT
9.6
10.5
EE
13.8
17.5
RO
6.9
7.5
EL
9.5
12.5
SE
8.3
8.3
ES
18.0
20.1
SI
5.9
7.2
FI
8.2
8.3
SK
12.0
14.5
FR
9.5
9.6
UK
7.6
7.8
HU
10.0
11.1
Euro area
9.5
10.1
IE
11.9
13.7
EU-27
8.9
9.6
IT
7.8
8.4
USA
9.3
9.6
Source: European Commission, European Economic Forecast, Autumn 2010.
The Polish Institute of International Affairs
70
Lisbon
Strategy
123
European Commission, EU employment situation and social outlook: Monthly monitoring,
January 2011, p. 5.
124
European Commission, Employment in Europe 2010, p. 56.
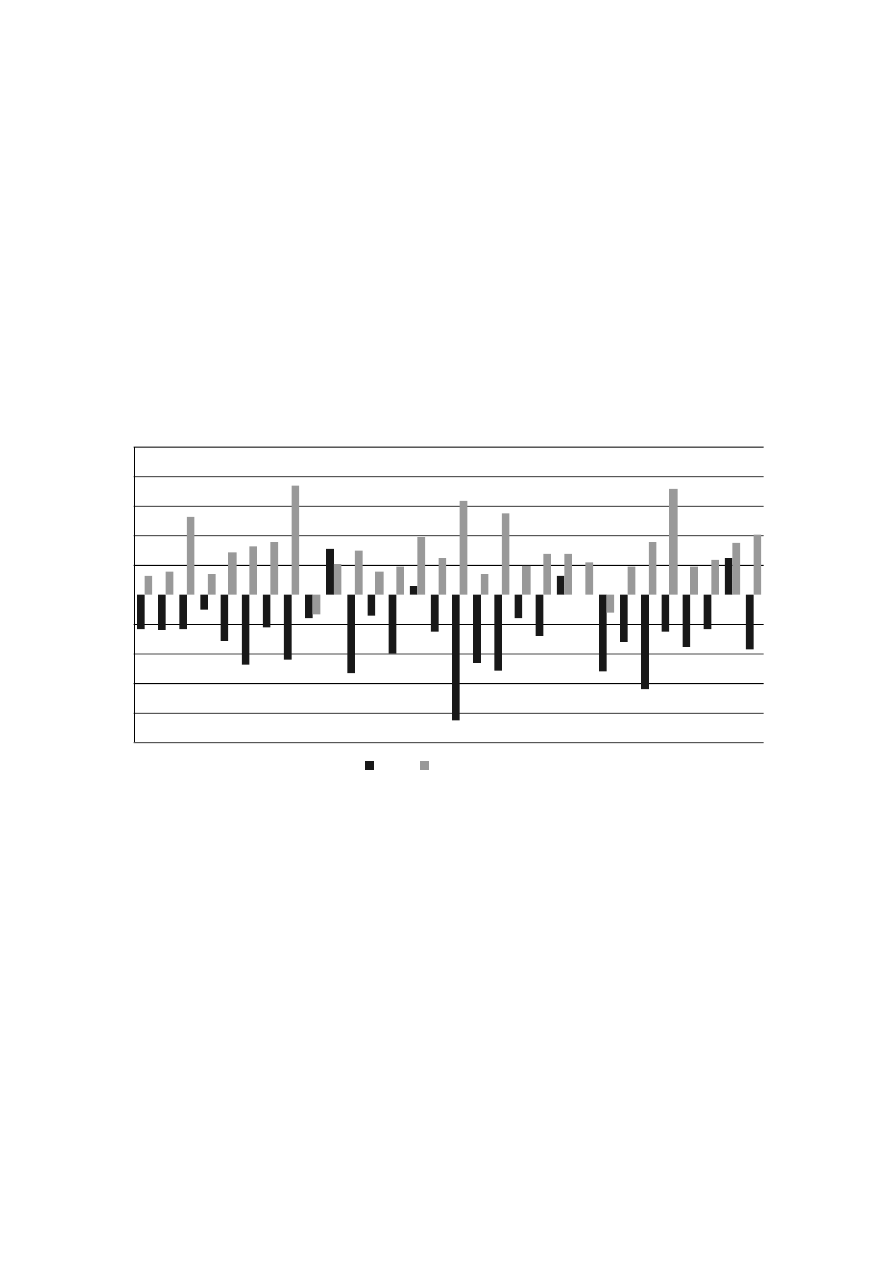
7.5. Labour Productivity
The economic and financial crisis caused a sharp decrease in labour productivity
in the EU countries and in Japan. As can be seen from the chart, the most dramatic drop
in 2009 was noted in Lithuania (–8.5%), Slovenia (–6.4%), Romania (–5.2%), Latvia
(–5.1%) and Finland (–5.3%). The European Commission’s forecasts for 2010 are
optimistic, as labour productivity should grow fast in almost all the EU-27 countries in
comparison with 2009. The highest growth was expected in Estonia (7.4%), Slovakia
(7.2%) and Lithuania (6.4%). Poland, together with Ireland and Spain, succeeded in
avoiding a productivity drop and its growth is expected to continue in 2010 (by 2.8%).
In 2009 average EU-27 productivity fell by 2.3% against 2008, but a rise by 2.4% is
predicted in 2010.
Chart 13. Labour Productivity in 2009 and 2010 (percentage change on preceding year)
Source: European Commission, European Economic Forecast, Autumn 2010.
7.6. Social Policy
The economic and financial crisis was expected to exert a negative impact on the
situation of the social groups most at risk of poverty, but the most recent data available
(for 2009) does not show any major changes in this regard. As for the share of persons at
risk of poverty, a comparison between 2008 and 2009 indicates that this group
decreased slightly (by 0.5 pp) to 23.1%, with this group especially big in Bulgaria
(46.2%, up by 1.4 pp), Romania (43.1%, down by 1.1 pp) and Latvia (37.4%, up by
3.6 pp). Figures also show a relatively high share of people at risk of poverty in
Lithuania, Hungary, Poland and Greece (almost 30%). The lowest indicator is in the
Czech Republic (14%, down by 1.3 pp), the Netherlands (15.1%, up by 0.2 pp) and
Sweden (15.9%, up by 1.0 pp).
According to the most recent statistics (2008), the average level of social
expenditure in the EU-27 amounted to 25.2% following an increase by 0.6 pp in
comparison to the preceding year. The highest share of social expenditure among the
Member States was recorded in France (29.3%, up by 0.3 pp), Denmark (28.9%, up by
From Lisbon to Europe 2020
Lisbon
Strategy
71
–10
–8
–6
–4
–2
0
2
4
6
8
10
2009
2010 (forecast)
EU-27
BE
BG
CY
CZ
DE
DK
EE
EL
ES
FI
FR
HU
IE
IT
LT
LV
MT
NL
PL
PT
RO
SE
SI
SK
UK
LU
USA
Japan
AT
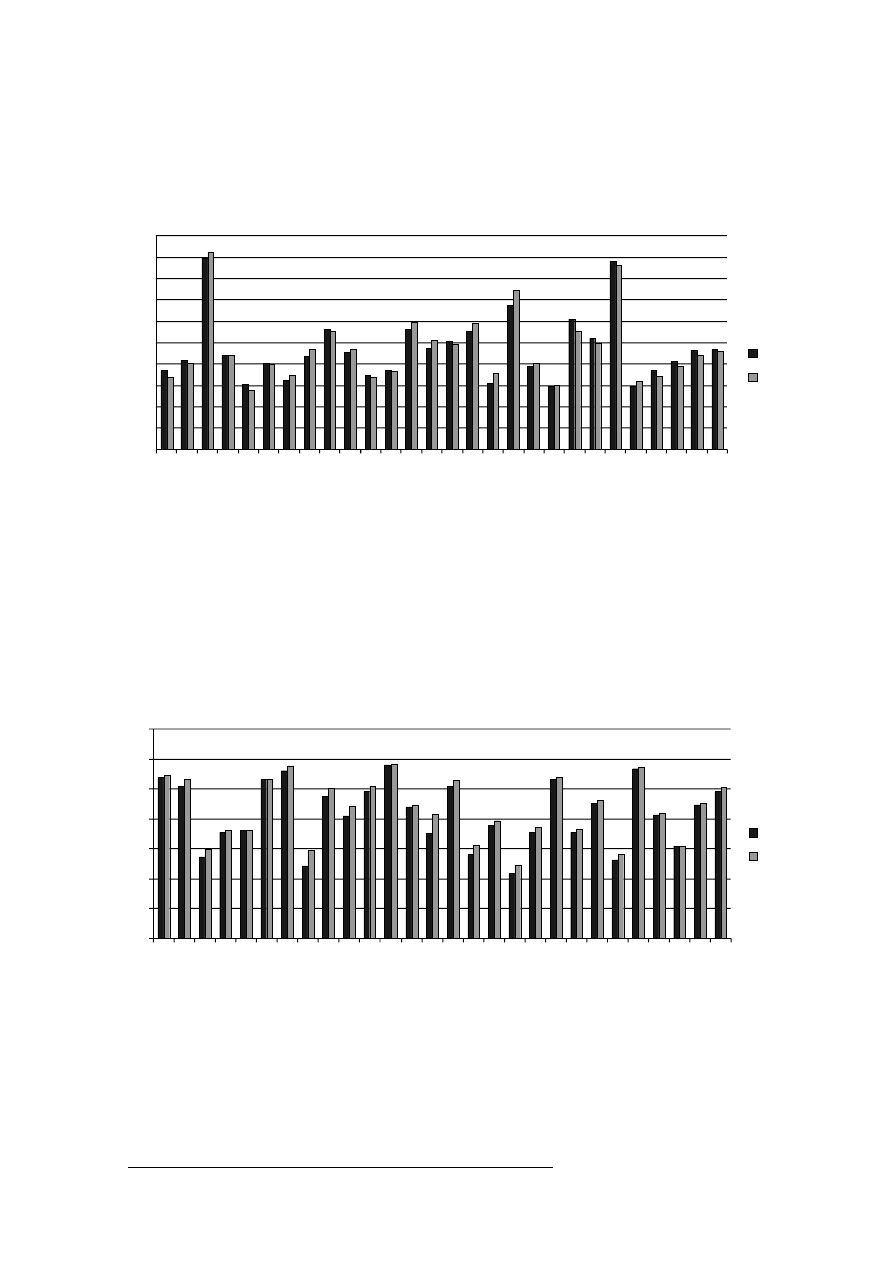
0.8 pp) and Sweden (28.7, up by 0.3), compared to the lowest in Latvia (12.4%, up by
1.4 pp), Romania (14%, up by 0.9 pp) and Estonia (14.9, up by 2.7 pp).
125
Chart 14. Percentage of Persons at Risk of Poverty after Social Transfers in 2008 and 2009
Source: Eurostat, http://epp.eurostat.ec.europa.eu/tgm/table.do?tab=table&init=1&plugin=1&language
=en&pcode=t2020_50.
The fight against the negative social effects of the global economic and financial
crisis is easier in countries with a higher share of social spending in their GDPs, so the
situation was especially difficult in states with large-scale unemployment but limited
tools to fight it.
Chart 15. Overall Social Expenditure in 2007 and 2008 (% GDP)
Source: Eurostat, http://appsso.eurostat.ec.europa.eu/nui/show.do?dataset=spr_exp_gdp&lang=en.
According to the Commission, there are around 80 million people in the EU still
living at the risk of poverty, one-fourth of them being children, with the crisis
additionally highlighting the problem.
The Polish Institute of International Affairs
72
Lisbon
Strategy
EU-27
AT
BE
BG
CY
CZ
DE
DK
EE
EL
ES
FI
FR
HU
IE
IT
LT
LV
MT
NL
PL
PT
RO
SE
SI
SK
UK
LU
0.0
5.0
10.0
15.0
20.0
25.0
30.0
35.0
40.0
45.0
50.0
2008
2009
0
5
10
15
20
25
30
35
EU-27
AT
BE
BG
CY
CZ
DE
DK
EE
EL
ES
FI
FR
HU
IE
IT
LT
LV
MT
NL
PL
PT
RO
SE
SI
SK
UK
LU
2008
2009
125
Source: Eurostat, http://appsso.eurostat.ec.europa.eu/nui/show.do?dataset=spr_exp_gdp&lang=en.

7.7. Flagship Initiatives
There are two flagship initiatives of the Europe 2020 strategy that are relevant to
employment: “An Agenda for New Skills and Jobs” and “Young on the Move.” The first
is derived from a concept introduced by the Commission in late 2008. The goals of the
new initiative include: improving the functioning of the labour market, enhancing the
skills of the workforce, strengthening job quality and promoting job creation and
demand.
126
A central point of this initiative is flexicurity, which the Lisbon Strategy
promoted. The Commission points out that in the context of the new strategy this
approach should be based on four elements:
– flexible and reliable contractual arrangements (reducing labour market
segmentation, greater emphasis on internal flexibility);
– developing lifelong learning (strategies for more vulnerable workers,
enhanced stakeholders’ involvement and social dialogue, effective incentives
for increased workers’ participation);
– adopting an active labour market policy (improving such measures as individual
job counselling, job search assistance, enhancing skills and employability);
– modern social security systems (reforming unemployment benefits, improving
coverage for risk of unemployment, reforming the pensions systems).
In the framework of “Young on the Move” actions devoted to employment mobility
(including the creation of a “European Vacancy Monitor” indicating employment
opportunities for young people in the EU), easier access to the labour market will be
promoted and support offered to young groups and young entrepreneurs.
127
To observe the year 2010 as the “European Year against Poverty and Social
Exclusion,” European leaders resolved to set new targets, including a reduction of
poverty and social exclusion by 20 million before 2020. “The European Platform
against Poverty and Social Exclusion,” one of the seven flagship initiatives of the Europe
2020 strategy, will be a guideline for the MS on how to achieve progress at the national
level in the field of social policy. The “European Platform” is closely connected with the
other six flagship initiatives of Europe 2020, especially those concerning employment,
education, skills and innovation, as its key projects embrace: promoting innovation in
social policy; use of the available tools, such us the European Social Fund, to increase
social inclusion; and enhanced effectiveness and flexibility of social services to respond
actively to new challenges resulting from the global economic and financial crisis.
7.8. Conclusions
The EU Member States have been struggling with serious problems in labour
markets. Temporary workers and young people have been especially hard hit by the
crisis. The governments adopted several measures in order to mitigate the negative
implication of the crisis for employment. According to the European Commission,
labour market stimuli accounted for 0.2% and 0.3% of the GDP in 2009 and 2010
respectively.
128
Governments launched many actions in order to create jobs
From Lisbon to Europe 2020
Lisbon
Strategy
73
126
European Commission, An Agenda for new skills and jobs: A European contribution towards
full employment, COM (2010) 682 final, 23.11.2010, http://europa.eu/rapid/pressReleasesAction.do?
reference=IP/10/1541& (accessed on 15 January 2011).
127
European Commission, Young on the move, COM(2010) 477 final, http://ec.europa.eu/edu
cation/yom/com_pl.pdf (accessed on 15 January 2011).
128
European Commission, Public finance In the EMU 2010, p. 20.

(e.g. reducing the non-wage labour costs), but their effects differ between states,
depending on the situation there. The main differences on labour markets focus on the
level of protection, barriers to geographical mobility, and problems connected with
undeclared work.
Restructuring processes conducted in many sectors of the economy have had a
detrimental impact on jobs. According to European Restructuring Monitoring (ERM),
the 345 restructuring cases examined led to 144,000 job losses in 2010, which meant
an improvement on 2009, when 1,650 cases were recorded and 652,000 jobs lost.
129
EU unemployment is disturbing, especially with regard to young people, and
prospects for the future are not too optimistic. In 2011 unemployment is expected to
decrease by a mere 0.1 pp, both throughout the EU and in the euro area, but in Spain it
may not start to fall until 2012. Turning the situation in employment around would
require a relevant pace of economic growth in the EU. Against this background fragile
growth prospects can derail recovery in labour markets. The potential negative
implications of fiscal adjustment for growth can additionally exert an unfavourable
impact on employment.
7.9. Evaluation
7.9.1. Positive
As in the preceding year, the Netherlands remained the EU leader in respect of
the overall labour market situation.
7.9.2. Negative
Lithuania, Latvia and Spain were states with the bleakest picture in the sphere of
employment.
7.10. Recommendations
1. The Member States should implement actions indicated as priorities in the
Annual Growth Survey, namely:
– speed up flexible working arrangements;
– introduce a temporary reduction of social security contributions;
– reform unemployment benefit systems;
– increase participation of old workers;
– modify wage policies.
130
2. Pension reforms should be accelerated in the Member States, and their
impact on public finances should be taken into account by the Commission
and the Council in conducting fiscal surveillance in the framework of the
Stability and Growth Pact.
3. In the context of the Europe 2020 strategy, particular attention should be
given to tackling the problem of unemployment among young people.
The Polish Institute of International Affairs
74
Lisbon
Strategy
129
Eurofound, Extending flexicurity: The potential of short-time working shemes, p. 26,
www.eurofound.europa.eu/pubdocs/2010/71/en/1/EF1071EN.pdf (accessed on 15 January 2011).
130
European Commission, Draft Joint Employment Report, pp. 11–12.

Part II


8. Lisbon Strategy: Overview and Assessment
8.1. Lisbon Strategy History in a Nutshell
On 31 December 2010 Lisbon Strategy came to an end, in silence, with no
media coverage or official EU ceremonies. The most common perception is that the
Strategy has been a total fiasco, not only because it did not succeed in transforming the
EU into the most competitive economic area as planned, but also because it did not
meet most of its objectives. Nevertheless, an assessment of the Strategy should be more
balanced and take into account not only the EU’s purely economic performance but
also a broader political and economic context.
In recent decades we have seen new challenges for the world of globalisation
and increasing competition from other economies, particularly China. At the same time,
the EU economies countries have been a subject of mounting structural obstacles
slowing the pace of growth and generating high unemployment. All these processes led
to the launch of a broad debate on the need for a new program of economic reforms in
the EU, since the measures taken by the national governments had clearly been
inadequate. Hence the need for a complex economic program that would encourage
the Member States to undertake the necessary reforms halting negative trends and
safeguarding against the EU’s global marginalisation. During the European Council
meeting in Lisbon on 23–24 March 2000, the new strategy was adopted, becoming the
European Union’s socio-economic program for the next ten years.
132
The Strategy’s main objective quoted extensively in academic debates and the
media was to create the most dynamic and competitive knowledge-based economy in
the world, an economy capable of sustainable economic growth, with more and better
jobs, greater social cohesion and respect for the environment. Developed at subsequent
meetings of the European Council, the Strategy was based on three pillars:
– the economic pillar focused on transition towards a knowledge-based
economy and information society;
– the social pillar aimed at modernizing the European social model;
– the environmental pillar, added during the European Council meeting in
Göteborg in June 2001, based on the assumption that economic growth
should be decoupled from the use of natural resources.
In March 2004, the European Council decided to prepare a mid-term review of
the Lisbon process to be presented in March 2005. A special team of experts was set up,
chaired by former Dutch Prime Minister Wim Kok, a man experienced in assessing the
Lisbon Strategy. The report was published in November 2004.
133
According to experts,
the disappointing effects of the Lisbon Strategy resulted from its overloaded agenda,
poor coordination and conflicting priorities. The report stressed also that the main
impediment to achieving the objectives of the Strategy was an absence of political will
From Lisbon to Europe 2020
Lisbon
Strategy
77
132
Presidency Conclusions, Lisbon European Council, 23–24 March 2000, http://www.consilium.
europa.eu/ueDocs/cMember States_Data/docs/pressData/en/ec/00100-r1.en0.htm.
133
Facing the challenge. The Lisbon strategy for growth and employment, Report by High Level
Group chaired by Wim Kok, European Communities, November 2004, http://ec.europa.eu/research/
evaluations/pdf/archive/fp6-evidence-base/evaluation_studies_and_reports/evaluation_studies_and_rep
orts_2004/the_lisbon_strategy_for_growth_and_employment__report_from_the_high_level_group.pdf
(accessed on 31 January 2011).

to reform.
134
Kok’s High Level Group reiterated that the EU had not shortened its
distance to the United States or Asia. On the contrary, the EU had become weaker in
terms of competitiveness. The experts recommended urgent action in five policy areas,
action that was and remains crucial to the EU’s economic future:
– knowledge-based society: promoting knowledge, innovation and ICT use;
– completion of the internal market;
– improving the business climate through a reduction of administrative burdens
in the EU;
– fostering growth and employment based on social cohesion;
– promoting sustainable development.
135
On the basis of the Kok Report, the European Council relaunched the Lisbon
Strategy in March 2005, focusing on economic growth and job creation. The coordination
process was also modified through drafting Integrated Guidelines embracing Broad
Economic Policy Guidelines (BEPG) and Employment Policy Guidelines (EG); these
were approved for the period of three years (2005–2008).
136
The relaunch of the
Strategy was accompanied by the introduction of two new instruments: National
Reform Programmes (NRP), established in line with the Integrated Guidelines for
Growth and Jobs and Community Lisbon Programme (CLP). Their objective was to
define the role of the Member States and EU institutions in the Strategy’s
implementation. The first CLP was presented by the Commission in July 2005 and
consisted of several initiatives grouped in three main areas: supporting knowledge and
innovation; making Europe a more attractive place to invest and work; creating more
and better jobs.
137
The first annual progress report of the new Lisbon cycle stated that the Member
States still had difficulties with achieving the Strategy’s objectives. The Commission
identified four priority areas where action was necessary: education and research,
support for SMEs and employment, plus an additional objective: the need for a common
energy policy of the EU. In December 2007 the Commission published an in-depth
review report that covered the entire implementation cycle of Lisbon and proposed a
prolongation of Integrated Guidelines for 2008–2010. Following this publication, the
European Council launched a new cycle of the Strategy during the summit on 13 and
14 March 2008.
138
Acting in response to growing public concern over climate change,
population aging and social exclusion, the European leaders decided to put more
The Polish Institute of International Affairs
78
Lisbon
Strategy
134
Ibidem. p. 6.
135
Ibidem.
136
“The Lisbon Strategy or a Lisbon Tragedy?” EU Observer, 19 May 2005, http://euobserver.
com/?aid=19088; Growth and Jobs: Relaunch of the Lisbon strategy, www.euractiv.com/en/innovation/
growth-jobs-relaunch-lisbon-strategy/article-131891 (accessed on 18 August 2010).
137
Communication from the Commission to the Council and to the European Parliament,
Common actions for growth and employment: The Community Lisbon Programme, Brussels,
20.07.2005, COM(2005) 330 final.
138
European Commission, Communication from the Commission to the European Council,
Strategic Report on the renewed Lisbon Strategy for growth and jobs: launching the new cycle
(2008–2010, companion document COM/2007/0803 final.

emphasis on environmental and social objectives.
139
The economic and financial crisis
has made further progress on the way to the Lisbon objectives very problematic.
8.2. Objectives and Indicators
In order to measure the progress on the way to the Lisbon objectives, a number of
targets were adopted: GDP level per capita, labour productivity per person employed,
youth education, gross domestic expenditure on R&D, comparative price levels,
business investment, employment rate, risk of poverty, unemployment rates,
greenhouse gas emissions, energy intensity of the economy and volume of freight
transport in relation to GDP.
140
The Lisbon objectives were adopted during subsequent
European Council summits, with their classification shown in the tables below.
Table 22. The “Ultimate” Figure-based Objectives to be Met by 2010 as Set Out by the Spring
European Councils
Subject
Figure-based objective
European Council Summit
Growth rate
3% per year
Lisbon 2000
Employment rate
70% of the economically active
population
60% of the economically active
female population
50% of older workers
Lisbon 2000
Lisbon 2000
Stockholm 2001
Greenhouse gas emission rate
8% reduction compared to the
1990 level (to apply the Kyoto
protocol)
Barcelona 2002
Source: L. Cohen-Tanugi, Beyond Lisbon. A European Strategy For Globalization, Brussels, 2008.
Table 23. The “Intermediate Objectives” of the Lisbon Strategy
Subject
Figure-based objective
European Council Summit
Education
85% of each class group up to
Baccalaureate level
Lisbon 2000
Stability and Growth Pact
Public deficit lower than 3% of
GDP, public debt lower than
60% of GDP
Stockholm 2001
Internal market
98.5% of directives transposed
before deadline; overall reduction
of state aid as percentage of GDP
by 2003
Stockholm 2001
R&D expenditure
3% of GDP, including two-thirds
private expenditure
Barcelona 2002
From Lisbon to Europe 2020
Lisbon
Strategy
79
139
“EU ‘Lisbon Agenda’ gets social makeover,” Euractive, 18 March 2008, http://www.euractiv.
com/en/innovation/eu-lisbon-agenda-gets-social-makeover/article-171013 (accessed on 10 January 2011).
140
These indicatiors are listed on the Eurostat website: http://epp.eurostat.ec.europa.eu/portal/
page/portal/structural_indicators/indicators/short_list.

Subject
Figure-based objective
European Council Summit
Effective retirement age
To be raised by approximately
5 years
Barcelona 2002
Subsidised reception centres
for children
90% of children between 3 years
of age and compulsory school
age; 33% of children under 3
Barcelona 2002
Youth unemployment
(18–24 years of age)
Education drop-out rate lower
than 10%; offer of employment,
training or work experience
placement within a maximum
period of 4 months
Brussels 2006
Source: L. Cohen-Tanugi, Beyond Lisbon. A European Strategy for Globalization, Brussels, 2008.
Table 24. The New Objectives for the Renewed Lisbon Strategy 2008–2010 as Set Out by the March
2007 European Council
Subject
Objective
Strengthening of the internal
market and increasing
competitiveness
Transposition deficit target: to reduce this deficit progressively
to 1% by 2009 at the latest, while stressing the importance of
adopting appropriate transposition deadlines
Business regulatory
environment
To reduce administrative burdens arising from EU legislation
by 25% by 2012; to set national objectives
Energy and environment
Objective 20/20/20; increasing bio-fuels consumption to 10%
Based on: L. Cohen-Tanugi, Beyond Lisbon. A European Strategy For Globalization, Brussels, 2008;
Presidency Conclusions, Brussels European Council, 8–9 March 2007, Council of the European
Union, Brussels, 2 May 2007.
Due to the fact that most of the objectives of the Strategy have remained within
the domain of the Member States, a special management tool was introduced: the Open
Method of Coordination (OMC) based on voluntary cooperation of the Member States
and their assessment, sometimes on the “name and shame” basis. The OMC is applied
in areas under mixed and exclusive competence of the Member States,
e.g. employment, social protection, social inclusion, education and training. The
governance of the Strategy is focused on identifying and defining objectives to be
achieved and establishing common measuring instruments and benchmarking,
i.e. a comparison of the performance of the Member States. Indicators describing the
implementation of the Strategy have been regularly assessed by the European
Commission, with its results also discussed at European Council meetings.
8.3. General Performance
Figures show that in most cases the Lisbon objectives have not been met. The
Strategy was aimed at boosting technological development by increasing investment in
research as the chief engine of growth. Hence a rise in investments in research and
development to 3% of the GDP was the main objectives to be achieved by 2010, but
Chart 16 clearly shows that during the entire period R&D spending remained
unchanged well below the target set. Only three Member States succeeded in achieving
the objective: Finland (3.96%), Sweden (3.6%) and Denmark (3.02%), so the main
The Polish Institute of International Affairs
80
Lisbon
Strategy

Lisbon indicator remained substantially below the desired level, with the ultimate
objective not met.
Chart 16. Expenditure on R&D
Source: Eurostat, http://epp.eurostat.ec.europa.eu/portal/page/portal/europe_2020_indicators/headline
_indicators.
Another important indicator was the GDP growth rate. The Strategy set an
objective of 3% GDP growth, which was rather modest compared to Chinese or Indian
rates. The 3% objective was briefly achieved only twice, in 2000 and in 2006. Failure in
this respect is to a large extent due to the fluctuations of the world economy. The
Strategy had been launched in the middle of a growing dot-com bubble and its burst
resulted in recession, making the implementation of Lisbon objectives extremely
difficult. The highest GDP growth in the EU was reported in 2005–2007, while the
global financial and economic crisis affected economic growth adversely and hindered
the achievement of other targets.
Chart 17. Real GDP Growth Rate (in % on preceding year; forecast for 2010)
Source: Eurostat, http://epp.eurostat.ec.europa.eu/tgm/table.do?tab=table&plugin=1&language=en&
pcode=tsieb020.
From Lisbon to Europe 2020
Lisbon
Strategy
81
2000
2001
2002
2003
2004
2005
2006
2007
2008
2009
EU-27
1.86
1.86
1.87
1.86
1.83
1.82
1.85
1.85
1.92
2.01
EU- 15
1.92
1.92
1.93
1.93
1.89
1.89
1.92
1.93
2.01
2.1
3
3
3
3
3
3
3
3
3
3
0
0,5
1
1,5
2
2,5
3
3,5
EU Target=3% of GDP
EU-27
EU-15
Lisbon objective
2000
2001
2002
2003
2004
2005
2006
2007
2008
2009
2010
3.9
2
1.2
1.3
2.5
2
3.2
3
0.5
–4.2
1.8
3.9
1.9
1.2
1.2
2.3
1.8
3
2.8
0.2
–4.3
1.8
3
3
3
3
3
3
3
3
3
3
3
-5
-4
-3
-2
-1
0
1
2
3
4
5
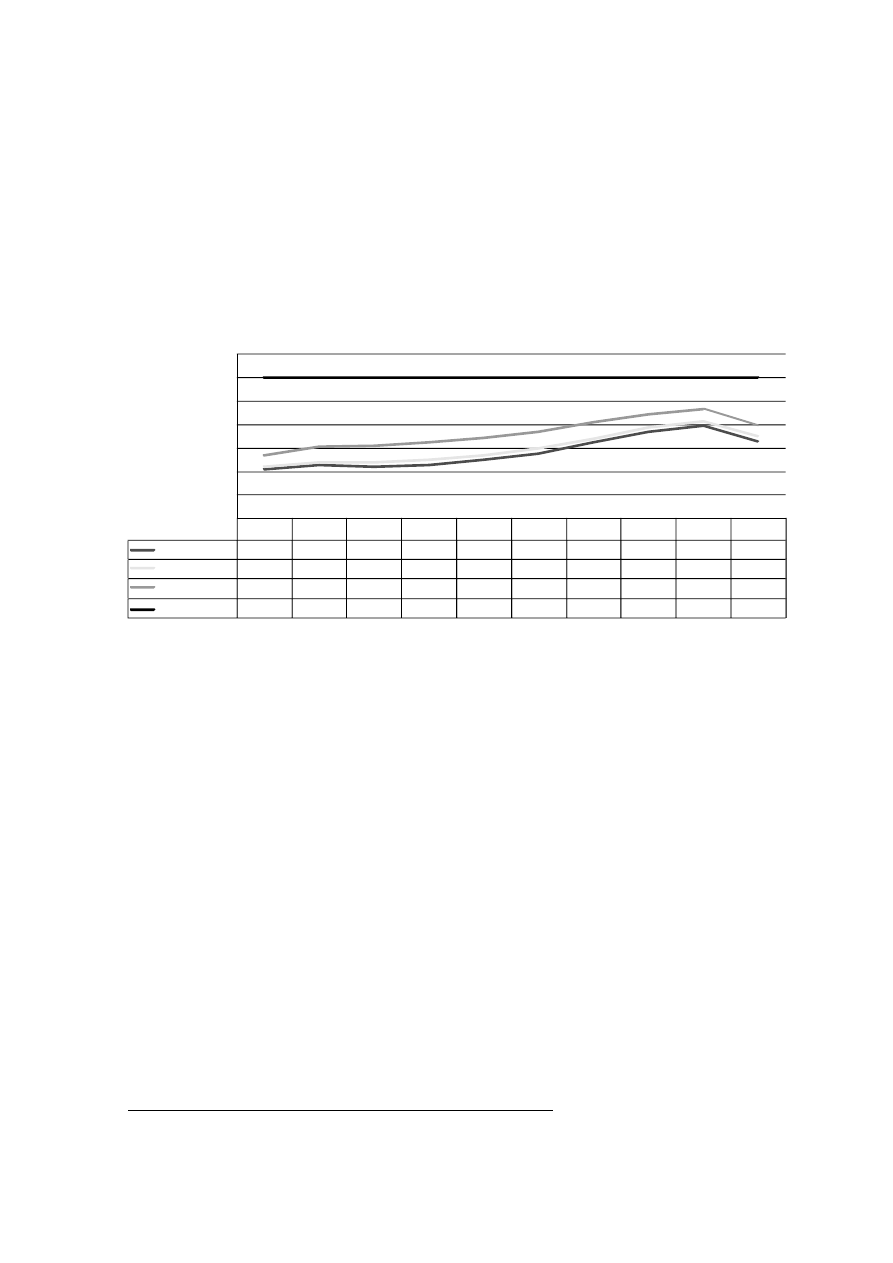
An analysis of the EU employment rate between 2000 and 2010 also brings clear
conclusions. The employment rate rose from 62% in 2000 to almost 66% in 2008, but
dropped again due to the international economic and financial crisis. The total
employment rate for persons aged 15–64 in the EU-27 had been rising steadily from
62.4% in 2002 to 65.9% in 2008, but fell to 64.6% in 2009 and remained below the
Lisbon objective of 70%, although some of the Member States managed to achieve the
Lisbon employment target: the Netherlands, Denmark, Austria, Sweden, and Germany.
141
Chart 18. Employment Rate in the EU (in %, group 15–64 years old)
Source: Eurostat, http://epp.eurostat.ec.europa.eu/portal/page/portal/structural_indicators/indicators/ short_lis.
Despite failure in achieving most of the Lisbon goals, an evaluation of the
Strategy represents a mixed picture. Firstly, not all comprehensive statistical data is
available at the time of writing this study. A final evaluation of macro and micro
objectives will be possible in the second half of 2011, once all statistics are published,
because at the moment some data is still fragmentary (education, climate, energy).
Secondly, for some areas a final assessment will never be possible, as it is difficult to
measure the real impact of the Strategy on the Member States’ performance, which rests
upon specific public policies or external factors. Thirdly, the difficulty in assessing the
Strategy also results from the fact that the 27 EU Member States differ substantially with
respect to their performance in implementing Lisbon Strategy targets.
8.4. Overall Assessment of LS Implementation
In February 2010 the European Commission published a report assessing the
Lisbon Strategy.
142
The document was brief and concise. In the evaluation, the
Commission underlined the objective factors, which had largely determined the
implementation of the Strategy, such as successive enlargements from EU-15 to EU-27,
The Polish Institute of International Affairs
82
Lisbon
Strategy
EU-27
EU-25
EU-15
EU Target=70%
2000
2001
2002
2003
2004
2005
2006
2007
2008
2009
62.2
62.6
62.4
62.6
63
63.5
64.5
65.4
65.9
64.6
62.4
62.8
62.8
63
63.4
64
64.8
65.8
66.3
65
63.4
64.1
64.2
64.5
64.9
65.4
66.2
66.9
67.3
65.9
70
70
70
70
70
70
70
70
70
70
58
60
62
64
66
68
70
72
141
European Commission, Employment in Europe 2010.
142
European Commission, Lisbon Strategy evaluation document, Commission Staff Working
Document, European Commission, Brussels, 2 February 2010, http://ec.europa.eu/europe2020/pdf/
lisbon_strategy_evaluation_en.pdf (accessed on 10 January 2011).

enlargement of the eurozone or the impact of the economic crisis.
143
The EU has failed
to reduce the productivity gap dividing it from the leading economies.
144
It is difficult to judge to what extent, if any, the Strategy has exerted a positive
impact. The Commission concluded that it would be too simplistic to observe that the
Strategy failed because its targets had not been met, since its chief role was to promote
joint actions in tackling the biggest challenges of the Union. One of them is the area of
research and innovation, where the Commission has no jurisdiction over the Member
States.
The Strategy has brought many positive elements. For the first time the EU
succeeded in adopting a number of common principles of economic policy in force for
ten years. The quantitative indicators adopted measured real progress towards
achieving the objectives. Professor Maria Joao Rodrigues, one of the authors of the
Lisbon Agenda, stressed that the Strategy itself could be called a success, because it
introduced new long-term strategic thinking in the EU, and succeeded in some areas
despite the difficulties.
145
On the other hand, there are many fierce critics of the Strategy, such as Professor
Charles Wyplosz, who called it a “predictable and predicted” failure, leading to the
accumulation of a new bureaucracy, both within the administration of each country and
within the Commission.
146
Professor Wyplosz assesses that peer pressure, one of ideas
behind the OMC, has turned into mutual congratulations, but nonetheless points to
some good concepts brought about by the Strategy as well, including first and foremost
its role in the removal of barriers to the freedom to provide services, which account for
70% of the European GDP.
147
A more balanced assessment is provided in the report The Lisbon Scorecard X
prepared by the Centre for the European Reform (CER). The authors underline that the
Strategy represents a mixed picture due to the differing performance of the Member
States. According to the report, the best performing five embrace the Nordic countries,
Austria and the Netherlands. At the other end of the spectrum the laggards include some
new Member States, Portugal, Greece and Italy.
148
The authors of the report suggest that
in order to make the new strategy more successful, the EU needs to improve the
governance method, give new momentum to the internal market, improve the human
capital, increase innovation but going beyond the R&D quantitative assessment, reform
the financial sector and promote broader understanding of sustainable growth,
including a new consensus concerning future social privileges.
149
The CER report notes
From Lisbon to Europe 2020
Lisbon
Strategy
83
143
Ibidem, p. 3.
144
Lisbon Strategy evaluation document…, op. cit., p. 3 ; see also: The 2010 Productivity Brief:
Productivity, Employment, and Growth in the World’s Economies, The Conference Board, January 2010.
145
EBS 2009, interview with Prof. Dr. Maria Joao Rodrigues, http://dare-and-care.blogactiv.eu/
tag/prof-dr-maria-joao-rodrigues (accessed on 15 August 2010).
146
Ch. Wyplosz, The failure of the Lisbon Strategy, 12 January 2010, www.voxeu.org/index.
php?q=node/4478 (accessed on 20 January 2011).
147
Ch. Wyplosz, What Next for Europe? Project Syndicate, 13 December 2005, www.project
syndicate.org/commentary/wyplosz4/English; Ch. Wyplosz, The failure of the Lisbon Strategy, 12 January
2010, www.voxeu.org/index.php?q=node/4478 (accessed on 20 January 2011).
148
S. Tilford, P. Whyte, The Lisbon Scorecard X: The road to 2020, Centre For European Reform,
2010, pp. 5–6.
149
Ibidem.

that social solidarity need not rule out competitiveness, as is confirmed by the EU
Nordic states, which have been able to maintain a high level of competitiveness along
with the lowest rate of poverty and inequality, in contrast to the EU countries with the
poorest social and market performance: Greece, Italy and Portugal.
150
Another interesting evaluation of the Lisbon Strategy was prepared by the World
Economic Forum (WEF) on the basis of a survey carried out among CEOs and top
executives in each of the assessed countries, which means that it represents the business
community’s perspective. The report underlines the development differences between
the MS, differences which were further increased by the 2004 enlargement. The
Executive Opinion Survey prepared by WEF researchers ranked Sweden, Finland and
Denmark as the top three. The best new Member State was classified in 12
th
place, with
the poorest performers including Poland, Italy, Romania and Bulgaria. The results show
major differences in performance among the Member States;
151
the authors point to
progress in some areas (information society, innovation and sustainable development),
while in other areas (network industries, development of financial services and social
inclusion) progress is less visible. In general, the MS failed to engage the business
community in the pursuit of the Lisbon objectives.
152
The overall picture presented in the above reports does not differ substantially
from the one depicted in the annual reports drafted by PISM.
8.5. Conclusions
While attempting to sum up the impact of the Strategy on the Member States,
some general conclusions can be drawn:
– In evaluating the Strategy it needs to be borne in mind that it is very difficult to
find empirical correlation between the objectives set and their practical
realisation, and especially to define to what extent the economic data had
actually been influenced by the Strategy itself.
– The objectives set in the Strategy were correct and indicated the right direction
for the Member States, especially taking into account the emphasis on
knowledge-based economy and information society, which are the most
important factors determining the competitiveness of modern economies. The
question arises, however, if these objectives, set at a time of economic
prosperity, could ever be achieved in the present internal and external
situation, factoring in such elements as the differences between the Member
States or global recession.
– Analysing the objectives set and the main goal to be achieved (“the most
competitive economy” in the world by 2010), the Lisbon Strategy has to be
described as a fiasco, although it is worth noting that some of the Member
States succeeded in performing above the Lisbon targets (e.g. the EU Nordic
countries’ spending on R&D), or well above the average for the other Member
States (e.g. the higher education system in the UK). Hence these countries
should set the example for the other EU members.
The Polish Institute of International Affairs
84
Lisbon
Strategy
150
The Lisbon Scorecard X…, op. cit., pp. 79–80.
151
J. Blanke, S. Kinnock, The Lisbon Review 2010: Towards a More Competitive Europe? World
Economic Forum, 2010, p. 15.
152
Ibidem, p. 15.

– Governance was also a problem in the pursuit of the Lisbon objectives. Most
crucial areas of the Strategy (e.g. Research and Development) were covered by
mixed or exclusive competence of the Member States, so they had to be
managed through the Open Method of Coordination, which turned out to be
ineffective.
– Critics of the Strategy should take into account the broader economic and
political context. Within the EU framework there is little hope for any major
changes in the institutional system, so the goals and evaluation of the Lisbon
Agenda and its successor, the Europe 2020 strategy, can only be examined
with the tools available, taking into account the political and legal situation of
the EU.
– Lack of progress in several areas of the Lisbon Agenda is seen by many as
resulting from too many objectives pursued. The common feeling is also that
the Agenda has suffered from an absence of strong political ownership.
– Progress towards the Europe 2020 objectives will be determined by the EU’s
ability to overcome the Lisbon shortcomings. But in the nearest future, in order
to get closer to the Europe 2020 objectives and to resist competition from Asia,
the EU will have to find strategic solutions to its demographic, social,
economic and environmental challenges. The worst performing MS will have
to launch serious steps to bridge the gap to the other EU members.
From Lisbon to Europe 2020
Lisbon
Strategy
85


Part III


9. Europe 2020 in the Context of Economic Governance Reform
9.1. Introduction
The Lisbon Strategy was concluded in 2010. One of the weakest elements of the
Strategy was its governance scheme, which was largely based on soft coordination
instruments. A lack of adequate governance of the Lisbon Strategy, both at the EU and
national levels, was one of the main reasons of Lisbon’s general failure.
153
Hence
postulates for improvements in governance strategy were formulated and met with
broad support of the Member States during discussion about the new economic
strategy. The timing of the adoption of the Europe 2020 strategy (the formal
endorsement took place during the European Council meeting in June 2010) coincided
with work on enhancing economic coordination in the EU.
154
Consequently, details
concerning the governance cycle of Europe 2020 were hammered out in close
connection with discussions about reinforcing economic coordination in the EU.
9.2. Governance of Europe 2020 in the Context of Economic Governance Reform
9.2.1. Main Differences with Lisbon Strategy
During the ten-year period of the Strategy, its governance system went through
important modifications. At the relaunch of the Strategy in 2005, a clear distinction
between national and community levels was introduced.
155
Governance of the Lisbon
Strategy after 2005 became more strictly linked with a system of economic coordination
and fiscal surveillance under the Stability and Growth Pact. In the case of the new
strategy, this interrelation was improved in order to ensure more coherence between
different dimensions of economic policies.
In comparison to the relaunched Lisbon Strategy, there are some important
differences with respect to Europe 2020 governance.
From Lisbon to Europe 2020
Lisbon
Strategy
89
153
See: European Commission, Lisbon Strategy Evaluation Document, SEC (2010) 114 final,
2.02.2010, p. 7.
154
The strategy is based on the “3–5–7” concept: three priorities, five quantitative targets, seven
flagship initiatives. These priorities are: smart, sustainable and inclusive growth. The five quantitative
targets include: 75% of the population aged 20–64 should be employed; 3% of the EU’s GDP should be
invested in R&D; the “20/20/20" climate/energy targets should be met (including an increase to 30% of
emissions reduction if the conditions are right); improving education levels, in particular by aiming to
reduce school drop-out rates to less than 10% and by increasing the share of 30–34 years old having
completed tertiary or equivalent education to at least 40%; promoting social inclusion, in particular
through the reduction of poverty, by aiming to lift at least 20 million people out of the risk of poverty and
exclusion. States had different opinions about the selection of the targets, especially concerning
education and social cohesion. Poland was rather skeptical about the inclusion of the “20/20/20” target.
The seven flagship initiatives are: “Innovation Union,” “Youth on the move,” “A digital agenda for
Europe,” “Resource efficient Europe,” “An industrial policy for the globalisation era,” “An agenda for new
skills and jobs,” and “European platform against poverty.” These initiatives are the pillars of the European
level of “Europe 2020,” and all but one have been adopted by the European Commission in 2010. The
effectiveness of implementation of Europe 2020 relies to a great extent on three levers of the strategy: the
EU budget, the single market and external trade policy.
155
See part II of the Report, p. 80.

First, there no longer will there be one single action plan document at the EU
level, as was the case with the Community Lisbon Programme, adopted twice for three-
year periods: 2005–2007 and 2008–2010. In the case of Europe 2020, actions made at
the EU level are conducted through flagship initiatives with different Directorate-
Generals (DGs) of the Commission responsible for them.
Second, a new Strategy does not envisage retaining the function of national
coordinators of implementation of the agenda (the so-called Mr. or Ms. Lisbon) that
were introduced in 2005. National Lisbon Coordinators (NLCs) had very limited
impact on the implementation process in a majority of Member States. To some extent
this was due to a relatively low real commitment of those who held these functions (in
some cases, the functions were in the hands of ministers of economy, while in others
the officials were in the prime minister’s office). Meetings of the NLCs were
usually held twice a year (during each presidency) but were largely fruitless, mainly
because there were distinct limits to the influence NLCs had with their respective
administrations.
National Reform Programmes (NRPs) remain basic documents for the
implementation of targets at the national level, as they are prepared on the basis of
Integrated Guidelines. The three-year programming cycle for a new strategy was not
explicitly specified, but the Integrated Guidelines will remain in force until 2014, so in
practice such a cycle can be retained.
9.2.2. Governance Elements of Europe 2020
The system of governance of Europe 2020 reflects the need to ensure
consistency and coherence between macroeconomic (both fiscal and non-fiscal)
policy and structural adjustments, and especially the need to bring together actions
serving to reduce the deficit and public debt in the framework of fiscal consolidation
while reaching the Europe 2020 targets. Such an approach was also attempted under
the relaunched Lisbon Strategy post-2005. The coherence of all dimensions of the
strategy is particularly necessary in the context of the current fiscal problems in the
Member States.
NRPs are prepared on the basis of the Integrated Guidelines that include the
Broad Economic Policy Guidelines (BEPGs, Art. 121.2 TFEU) and Employment
Guidelines (EGs, Art. 148.2 TFEU). Both guidelines were merged into a singe document
in 2005.
156
Most recently, the BEPGs and the EGs were adopted by the Council as
The Polish Institute of International Affairs
90
Lisbon
Strategy
156
The Broad Economic Policy Guidelines are a central pillar of the coordination of non-fiscal
aspects of the economic policy. The first BEPGs were published in 1993. Country-specific
recommendations were for the first time issued in the BEPGs adopted in 1999. In 2001, the BEPGs for the
first time included a reference to the euro area in recommendations referring to each euro-area Member
States and during 2003–2005 the guidelines also started to contain specific recommendations directed to
the euro-area as a whole. The BEPGs were merged with the EGs into a single document in 2005 and
adopted on three-year periods. In 2008 they were prolonged until the next cycle of the Lisbon Strategy.
See: European Commission, EMU@10-Successes and challenges after ten years of Economic and
Monetary Union, European Economy, 2/2008, p.139, http://ec.europa.eu/economy_finance/publications/
publication12682_en.pdf (accessed on 12 January 2011).

ECOFIN in July 2010 and EPSCO in October 2010, respectively.
157
The Integrated
Guidelines for the Europe 2020 strategy consist of 10 recommendations, a number
which is significantly lower in comparison to the situation between 2005 and 2010,
when 24 guidelines were in force.
The current BEPGs include:
– Guideline 1: Ensuring the quality and sustainability of public finances
(introducing “growth friendly” consolidation strategies in 2011 at the latest,
including the implementation of necessary action in order to reduce the public
deficit and debt under the Excessive Deficit Procedure and under the
preventative arm of the Stability and Growth Pact);
– Guideline 2: Addressing macroeconomic imbalances (avoiding macro-
economic imbalances and increasing competitiveness by reforms of the
product, financial and labour markets, including wage issues);
– Guideline 3: Reducing imbalances in the euro area (introducing urgent action
for reducing imbalances, especially in cases where countries have persistent
current accounts deficits);
– Guideline 4: Optimising support for Research, Development and Innovation,
strengthening the Knowledge Triangle and unleashing the potential of the
digital economy (reviewing national innovation systems, promoting the
Knowledge Triangle and the more effective allocation of spending on RD&I);
– Guideline 5: Improving resource efficiency and reducing greenhouse gas
emissions by decoupling economic growth from resource use; developing
a low-carbon economy by using different instruments, including financial,
market-based and regulatory tools; investing in energy infrastructure;
and, Guideline 6: Improving the business and consumer environments and
modernising the industrial base (improve the functioning of the market and
build a low-carbon and industrial base).
The Employment Guidelines contain the following points:
– Guideline 7: Increasing labour market participation and reducing structural
unemployment (the development of flexicurity, effective use of EU funds and
combating segmentation in the labour market);
– Guideline 8: Developing a skilled workforce responsive to labour market
needs, promoting job quality and lifelong learning (promoting productivity
and employability, developing a system that recognises professional
qualifications, removing barriers to worker mobility, increasing employment
of older workers and improving access to training);
– Guideline 9: Improving the performance of education and training systems at
all levels, and increasing participation in tertiary education (improving lifelong
learning, developing national education systems and reinforcing higher-
education systems); and,
From Lisbon to Europe 2020
Lisbon
Strategy
91
157
Recommendation for a Council Recommendation on broad guidelines for the economic
policies of the Member States and of the Union, Brussels, 7 July 2010 (OR. en) 11646/10,
http://register.consilium.europa.eu/pdf/en/10/st11/st11646.en10.pdf (accessed on 12 January 2011);
Council decision on guidelines for the employment policies of the Member States, Brussels, 12 October
2010 (OR. en), 14338/10, http://register.consilium.europa.eu/pdf/en/10/st14/st14338.en10.pdf (accessed on
12 January 2011).

– Guideline 10: Promoting social inclusion and combating poverty (improving
public services, promoting labour market participation, reforming health and
protection systems).
The NRPs as prepared by Member States should contain three parts, namely:
– A macroeconomic scenario that directly refers to fiscal issues under SGP;
– A macroeconomic surveillance block that tackles Guidelines 1–3; and,
– Thematic coordination that should focus on the actions recommended in
Guidelines 4–10.
The NRPs should include a concrete measure for achieving headline targets
under thematic coordination.
158
Information about internal ownership and coordination
should also be included in the reform programme.
Macroeconomic surveillance and thematic coordination form the backbone of
Europe 2020 governance. These elements will be accompanied by fiscal surveillance in
the framework of the SGP. In contrast to the NRPs prepared under the renewed Lisbon
Strategy, there is no clear distinction between the macroeconomic, microeconomic and
employment parts, but the modified format of the NRPs reflects the strict interrelations
and coherence of all dimensions.
9.3. Reinforcing EU Economic Policy Coordination
9.3.1. Context of the Reform and Progress Achieved in 2010
Reinforcing macroeconomic surveillance is vitally important from any perspective
for the implementation of the Europe 2020 strategy. Despite postulates for stronger
coordination of economic policy formulated during the discussion about the Europe 2020
strategy (especially by Spain, which held the presidency in the first half of 2010), there
was no serious debate concerning this issue at the beginning of 2010.
159
The Greek crisis
and its implications for the euro area were key factors that stimulated this debate, leading
in March 2010 to the creation of a task force chaired by Herman van Rompuy, the
permanent president of the European Council. The task force gathered representatives
from all Member States (mainly, ministers of finance), the European Commission
(Commissioner Olli Rehn), European Central Bank (President Jean-Claude Trichet) and
the Eurogroup (Jean-Claude Juncker). It worked between May and October.
160
Important
contributions to this discussion were provided by the European Commission, which
presented two communications (in May and in June)
161
and put forward legislative
The Polish Institute of International Affairs
92
Lisbon
Strategy
158
European Commission, Governance, tools and policy cycle of Europe 2020, p. 5, http://ec.euro pa.eu/
europe2020/pdf/annex_swd_implementation_last_version_15-07-2010.pdf (accessed on 5 January 2011)
.
159
European Commission, Europe 2020 – public consultation overview of responses
http://register.consilium.europa.eu/pdf/en/10/st07/st07508.en10.pdf p.8 (accessed on 5 January 2011).
160
Van Rompuy’ task force met six times (21 May, 7 June, 12 July, 6 September, 27 September
and 18 October). Preparatory work was done by a special Sherpa committee that had seven meetings. The
final report was dated 21 October.
161
See: European Commission, Reinforcing economic policy coordination, Brussels, 12 May 2010
COM (2010) 250 final, http://eur-lex.europa.eu/LexUriServ/LexUriServ.do?uri=COM:2010:0250:FIN:EN:
PDF (12 01 2011); European Commission, Enhancing economic policy coordination for stability, growth and
jobs – Tools for stronger EU economic governance, Brussels, 30 June 2010 COM (2010) 367 final,
http://eur-lex.europa.eu/LexUriServ/LexUriServ.do?uri=COM:2010:0367:FIN:EN:PDF (accessed on 12 January
2011).

proposals (five regulations and one directive) concerning this issues on 29 September.
Substantial value was added to this work by the European Central Bank.
162
The task force’s
report was endorsed by the European Council in October 2010.
163
The main elements of reform are:
– Strengthening fiscal surveillance within the Stability and Growth Pact;
– Deepening non-fiscal macroeconomic surveillance;
– Setting up a cycle of economic policy coordination in the EU; and,
– Creating a permanent crisis-resolution mechanism.
The task force concentrated its discussions mainly on the first three points. The
problem of a crisis-resolution mechanism was de facto given less attention by the task
force, because in short term perspective this problem was partly solved by setting up
EFSM and EFSF. However, after the Deauville French-German declaration, this issue
became top priority in the context of economic governance. The whole process of the
finalisation of economic governance reforms has been proceeding via two tracks. The
first one deals with the adoption of the legislative package, and has proceeded since
September 2010 under ordinary legislative procedure. It should conclude by the
deadline of June 2011. This work goes on in the Council, and in Parliament.
164
Table 25. Key Stages in EU Economic Governance Reform in 2010
March
2010
The European Council set up a task force on economic governance under the
chairmanship of Herman Van Rompuy.
May 2010
The European Commission presented its first communication “Reinforcing economic
policy coordination.”
Van Rompuy’s task force started work.
June 2010
The European Council endorsed the Europe 2020 strategy.
The Commission published a second communication, “Enhancing economic policy
coordination for stability, growth and jobs: Tools for stronger EU economic governance.”
The European Central Bank put forward its proposals concerning reinforcing economic
governance in the euro area.
From Lisbon to Europe 2020
Lisbon
Strategy
93
162
The president of the ECB, Jean-Claude Trichet, did not agree with all the recommendations of
the task force, underlining that they are not ambitious enough. The ECB postulated far-reaching solutions
and a “quantum leap” to improve the whole system of economic governance. Among its main proposals
were: introducing quasi-automatic sanctions that should be applied earlier, broadening the scope of
sanctions, and quasi-automatic actions of EDP procedure, the establishment of an independent EU fiscal
agency, improving the position of the EC in surveillance, establishing a detailed system of
competitiveness surveillance and creating a crisis resolution framework. See: European Central Bank,
Reinforcing economic governance in the euro area, 10 June 2010.
163
Strengthening economic governance in the EU, Report of the task force to the European
Council, Brussels, 21 October 2010, www.consilium.europa.eu/uedocs/cMember States_data/docs/press
data/en/ec/117236.pdf (accessed on 12 January 2011).
164
A proposal for a Council Regulation amending (EC) no 1467/97 on the speeding up and
clarification of the implementation of the excessive deficit procedure and proposals for a Directive on
requirements for budgetary frameworks will be adopted by the Council, after consultation with the
European Parliament. The rest of the proposals will be adopted through ordinary legislative procedure.
For proposals referring to an enforcement mechanism in the euro zone, a decision in the Council will be
adopted only by euro area Member States.

July 2010
The ECOFIN Council agreed to implement the “European Semester” from the
beginning of 2011.
September
2010
The Commission published its legislative proposals on economic governance.*
October
2010
Germany and France agreed on key features of economic governance reform and
proposed to set up a permanent crisis resolution mechanism.
The task force adopted its report, which was endorsed by the European Council.
Head of states and governments agreed that a permanent crisis-resolution mechanism
should be established and that limited Treaty changes were necessary.
November
2010
An ad hoc working group in the Council to deal with the legislative package was
established. A special sub-working group for the euro area also was set up.
The Eurogroup specified the key features of the European Stability Mechanism.
December
2010
The European Council adopted a draft decision related to a Treaty change in Art. 136
TFEU. The European Council called for adoption of the legislative package by June
2011.
* The package includes the following proposals:
– a Council Regulation amending (EC) 1467/97 on the speeding up and clarification of the
implementation of the excessive deficit procedure, COM (2010) 522 final;
– a Regulation amending Regulation (EC) no 1466/97 on the strengthening of the surveillance of
budgetary positions and the surveillance and coordination of economic policy, COM (2010) 526 final;
– a Regulation on the prevention and correction of macroeconomic imbalances, COM (2010) 527 final;
– a Regulation on the effective enforcement of budgetary surveillance in the euro area, COM (2010) 524
final;
– a Regulation on enforcement measures to correct excessive macroeconomic imbalances in the euro
area, COM (2010) 524 final;
– a Directive on requirements for budgetary frameworks for Member States, COM(2010) 523 final.
Source: Prepared by the authors.
The second track is to adopt treaty changes under a simplified revision procedure
according to Art. 48.6 TEU. It is supposed to set an intergovernmental agreement for
establishing the European Stability Mechanism. The key players are the European
Council, Eurogroup and the European Commission.
165
The most relevant elements of economic governance for Europe 2020 include
fiscal surveillance, non-fiscal surveillance as well as the European Semester.
9.3.2. Fiscal Surveillance
All states agreed that preventive and corrective parts of the Stability and Growth
Pact should be improved both in prevention and correction. The preventive part of the
Pact (Regulation 1466/97) provides the framework for the surveillance of budgetary
policies in Member States and is based on the Stability and Convergence programmes.
The corrective part of the Pact specifies details for implementing of the Excessive Deficit
Procedure (Regulation 1467/97). Among the accepted proposals for the preventive part
is a more detailed monitoring of Member States as to whether they achieve their
The Polish Institute of International Affairs
94
Lisbon
Strategy
165
More details about the creation of the ESM can be found in Chapter 1.4.

Medium Term Objective
166
(MTO), which is enshrined in the Stability or Convergence
programme (SCP). The Commission proposed the introduction of the principle
of prudent fiscal policy-making, which will provide that annual growth of budget
expenditures should not exceed the medium-term rate of growth of GDP, and should be
below this threshold if the MTO has not been achieved, unless the MTO was
overachieved or this growth was offset by more revenues. In case of deviations from
prudent fiscal policy making, the concerned Member States would be warned by the
Commission and, at a later stage, the Council could issue a recommendation on
the basis of Art. 121.4 TFEU. Finally the European Commission proposed that the
enforcement mechanism—an interest-bearing deposit amounting to 0.2% GDP—would
be imposed against a euro area Member State that remains in noncompliance with the
recommendation.
Among the accepted proposals for the corrective part are
– Putting more emphasis on debt sustainability. Debt criterion will be taken
into consideration during the initiation of the Excessive Deficit Procedure
(EDP). In case of deviation from the reduction path away from debt exceeding
60% (the pace of reduction should comply with a specified numerical
benchmark of 1/20 per year over three previous years) and existing negative
factors referring to development of debt, EDP will be opened even when the
deficit is kept below 3%. Following this logic, a reduction of the deficit below
3% would not be sufficient to abrogate EDP in case of a failure to reduce
excessive debt;
– Reinforcing sanctions under the Excessive Deficit Procedure. Van Rompuy’s
task force agreed that new sanctions should be, in the first stage, related only to
euro area Member States and that there should be non-interest-bearing
deposits (0.2% of GDP) and fines. According to the Commission’s proposal,
the sanction of 0.2% of GDP in a non-interest-bearing deposit would be
imposed immediately after the opening of the EDP (Art. 126.6 TFEU).
However, the task force decided that such a sanction should only be applied
once a Member State has failed to take effective action within a time period
specified by the Council (in the case of particularly serious situations,
sanctions could be applied immediately). In case a Member State was
punished under the framework of the preventive part of the SGP, an
interest-bearing deposit would be transformed into a non-interest-bearing
deposit. In case of non-compliance with the recommendations adopted by the
Council, the fine (the Commission-proposed 0.2% of GDP) would be applied
on the basis of Art. 126.8 TFEU. These new sanctions will supplement existing
enforcement measures
167
provided for in Art. 126.11 TFEU for euro area
members. At the second stage, a broad system of sanctions will cover all
Member States (with the exemption of the United Kingdom because of
From Lisbon to Europe 2020
Lisbon
Strategy
95
166
The medium-term objective is a specified target of public deficit that is inserted into
Stability/Convergence programmes adopted by Member States.
167
Sanctions include: a requirement of Member States to publish additional information specified
by the Council about public finances before issuing bonds and securities; invitation a European
Investment Bank to reconsider its lending policy towards the Member States concerned, requirement of
the Member State concerned to make a non-interest-bearing deposit of an appropriate size with the Union
until the excessive deficit has, in the view of the Council, been corrected, and to impose fines of an
appropriate size.

Protocol 15 of the Treaties).
168
Among Member States, general consent has
emerged for sanctions to be extended to all states and to include restrictions on
transfers from the EU budget. However, they have not yet agreed about the
scope of budgetary sanctions. The Commission proposed the establishment of
a two-stage system for suspending transfers from the EU budget (applicable to
the structural and agricultural funds and the fisheries fund). In stage one, we
could see the suspension of budgetary EU commitments as a result of the
opening of an EDP, but no automatic suspension of payments would follow. A
state’s failure to take effective deficit-reducing measures would result in stage
two, the cancellation of commitments, i.e., the loss of payments. In the case of
funds targeted at agriculture and fisheries, the loss would concern transfers to
the national budget, while, under the European Commission’s proposal, it
would not affect funds channelled to the end beneficiaries. The task force
recommended to introduce a conditionally rule on compliance with the Pact
rules into new regulations of structural, agricultural and fisheries funds
prepared in the context of the future Multiannual Financial Framework; a
transfer from the EU could be suspended in case of persistent breach of the
Pact rules.
– Pension reforms in EDP. The task force underlined that special attention
should be paid to the impact of pension reforms in the implementation of the
SGP. Nine Member States, including Poland, proposed that the cost of reforms
should be reflected in the methodology of measurements of debt. Such an
approach was not supported by other partners or by the Commission, but in
its legislative proposal for amending Council Regulation 1467/97 the
Commission stated that the impact of reform on debt should be taken into
consideration in the transition period.
169
In a report to the European Council in
December 2010, ECOFIN supported this approach and stressed that features
of the pension system in certain states should be analysed (as to whether it
promoted long-term sustainability) when it came to an assessment of their
fiscal positions in the framework of preventive and corrective parts of the
SGP.
170
– Applying sanctions in a more automatic manner. According to the task force
report, decisions related to the imposition of new sanctions should be made
following a reverse qualified majority vote. After the Commission issues its
proposal, sanction shall be applied unless qualified majority of Member States
in the Council vote against. This application of semi-automatic sanctions
increases the prospects that the entire procedure would be less discretionary.
The Polish Institute of International Affairs
96
Lisbon
Strategy
168
This protocol provides a British „opt-out“ from participation in the third stage of the EMU.
169
In Art. 1.2e of the 29 September 2010 Commission proposal for amending Council
Regulation 1467/97, the Commission stated, that “Commission and the Council shall also consider the
cost of the reform to the publicly managed pillar when assessing developments in EDP deficit and debt
figures. In cases where the debt ratio exceeds the reference value, the cost of the reform shall be
considered only if the deficit remains close to the reference value. For that purpose, for a period of five
years starting from the date of entry into force of such a reform, consideration shall be given to its net cost
as reflected in deficit and debt developments on the basis of a linear degressive scale. Additionally,
irrespective of the date of entry into force of the reform, its net cost as reflected in debt developments shall
be given consideration for a transitional period of five years from [date of entry into force of this
Regulation, to be inserted] on the basis of the same linear degressive scale.”
170
Preparation for the European Council of 16 and 17 December 2010, Council Report on the
treatment of systemic pension reform under the Stability and Growth Pact, 17618/10.

– Improving fiscal framework and statistics. The task force also concluded that
reinforcing surveillance at the EU should be accompanied by the introduction
of a strong fiscal framework at the national level. In this context, the European
Commission proposed a directive on requirements for national fiscal
frameworks. Other essential recommended action is to strengthen the quality
of national statistics. Some progress in this respect has already been made,
namely the regulation the Council adopted in July 2010 that increased the
audit power of Eurostat, which obtained the right to carry out methodological
visits in Member States and a wider scope of access to national statistics.
171
9.3.3. Non-fiscal Surveillance
The deepening of non-fiscal surveillance was a key task during the work of Van
Rompuy’s group. The task force recommended a new surveillance mechanism, which
will be used for monitoring macroeconomic imbalances and competitiveness within
the EU, especially in the euro area. The new framework will be based on Art. 121 TFEU
(in the case of the euro area, also on Art. 136) and includes preventive and corrective
measures.
On the preventive side, the key instrument will be an alert mechanism that will
be based on a scoreboard of indicators (such as currents accounts deficit, external debt,
real effective exchange rate and private and public sector debts). If the indicators reveal
distressing imbalance trends in a given state, it will come under in-depth review. If
serious problems are identified, the Council may act based on Art. 121.4 TFEU and
open the corrective part, which is underpinned by an “excessive imbalance procedure”
providing for close surveillance and regular reporting to the Council. Member States in
question will be required to submit a corrective action plan (CAP), which will be
assessed by the Council within two months. The Commission will then monitor
the progress of implementation of the CAP and carry out surveillance missions in the
country. If there’s a lack of progress, a revised recommendation can be adopted by
the Council. Persistent failure to tackle the imbalances by a euro area Member State can
lead to the imposition of a fine amounting to 0.1% of GDP (still semi-automatic, based
on the reversed majority vote). The European Systemic Risk Board (ESRB)—a new
supervisory body that will provide assessments of macro-financial situations in the EU
and Member States—can provide important input into this process. ESRB can be seen as
an interface between financial supervision and macroeconomic surveillance.
172
9.3.4. European Semester
The introduction of an integrated cycle of economic policy coordination was the
first concrete result of economic governance reform. Governance of the Europe 2020 is
a core element of this cycle.
European Semester was started in January 2011 with the publication the Annual
Growth Survey (AGS) by the European Commission. It attempts to assess the economic
From Lisbon to Europe 2020
Lisbon
Strategy
97
171
See: Council Regulation (EU) 679/2010 of 26 July 2010 amending Regulation (EC) 479/2009
as regards the quality of statistical data in the context of the excessive deficit procedure.
172
M. Buti, M. Larch, Stronger EU economic governance: A response to the critics, VoxEU
25 October 2010, www.voxeu.com/index.php?q=node/5709 (accessed on 12 January 2011).

situation in the euro area and in the whole EU, and the related challenges. This survey
contains both a review and a look forward. The first AGS consists of four elements:
– a communication from the Commission about the “Annual Growth Survey;”
– a progress report on the Europe 2020 implementation;
– a macroeconomic report; and,
– a Joint Employment Report.
The AGS has been followed by a debate in Parliament and the Council, and the
first phase of the semester will be completed with the adoption of strategic guidance by
the European Council. Conclusions of European Council meetings are to be taken into
account during the preparation of the SCPs and NRPs by the Member States. Thereafter,
both programmes will be submitted to the European Commission by the end of April
each year. SCPs are to contain, among other things, basic information on budget plans,
including macroeconomic projections, revenue and expenditure forecasts for the next
year (Y+1) as well as a description of the main components thereof.
Based on a Commission proposal, the Council will issue country-specific
recommendations (CSR) concerning non-fiscal issues. These recommendations will be
based on Art. 121 TFEU. Council opinions about the SCPs will be issued at the same
time. This will end the entire cycle.
In the transition period until the full introduction of the European Semester, the
Commission consulted the content of their NRPs with the Member States and they were
requested to submit their drafts in November 2010. The process of consultation
between Member States and the Commission was continued after the adoption of the
AGS.
9.4. Prospects
Setting up the Europe 2020 governance system will be fully completed once the
legislative package on economic governance is adopted. Among the Member States
there is very strong political commitment to finalise the legislative work of the whole
package by June 2011; hence chances to meet this deadline are very high. Missing this
deadline would be a very bad signal in general as well as for financial market
participants.
The conditions for effective governance of the new strategy are:
– strong ownership of the strategy by the European Council;
– the political determination to carry out reforms in the framework of NRPs;
– a strong and assertive position by the European Commission in the process of
the economic coordination cycle; and,
– an active role for the Eurogroup in the process of fiscal and non-fiscal
surveillance in the euro area.
The effectiveness of the Europe 2020 governance will strictly depend on the
whole process of economic governance in the EU. In contrast to budgetary surveillance,
non-fiscal surveillance will be largely based on soft instruments, with the exemption of
an enforcement mechanism for failure to tackle imbalances, envisaged for euro area
members. This lack of hard measures applied to all members can affect the effectiveness
of surveillance, which will to large extent hinge on the credibility of political
commitments endorsed by the European Council. The political will of national leaders
The Polish Institute of International Affairs
98
Lisbon
Strategy

to implement reforms is a critical condition for the success of the whole process
of non-fiscal coordination. Without strong political determination, an the entire system
of governance will become a failure.
The central role attributed to the European Council in the cycle of economic
policy has long been clear given the Lisbon experiences, as well as the recent situation
in the euro area—all required the extraordinary involvement of the leaders. The agenda
of the European Council has largely been dominated by economic issues after the
outbreak of the financial and economic crisis. Herman Van Rompuy personally put
great emphasis on the further “economisation” of summit agendas. His idea to arrange
thematic summits focusing on particular aspects of the Europe 2020 strategy (as
innovations, RD&I and energy) has been met with rather positive feedback from
national leaders. However, the necessity to react to extraordinary situations in the euro
area overshadowed other issues during the summits in 2010.
173
Of course, there is a risk
that the European Council would lose attention to this process and that the “business as
usual approach” would dominate, as was the case with the Lisbon Strategy, where
spring summits were usually unproductive (with the exception of 2005).
From the perspective of non-euro area members it is vitally important to preserve
the inclusion of all Member States in the decision-making process regarding economic
coordination at the highest level. Any form of the institutionalisation of meetings of euro
area leaders would be unfavourable and unacceptable for Member States outside of
euro area.
The role of the Eurogroup in the surveillance process, and especially regarding
macroeconomic imbalances, should be improved. Until now, some general surveillance
of competiveness was conducted during meetings of euro area finance ministers, but it
was a rather informal discussion with a lack of strong recommendations. With the Lisbon
Treaty in force, the Eurogroup obtained a stronger position that will be further reinforced
after the adoption of economic governance reform. Against this background, it is vital to
ensure good communication between the Eurogroup and the ECOFIN Council.
It is also certain that the European Commission plays a primary role in the entire
process of economic governance. The Lisbon Treaty gave a Commission a new
instrument, namely the opportunity (on the basis of Art. 121.4 TFEU) to issue warnings
to states that do not comply with BEPGs. The frequency of the use of this new instrument
will be perceived as an indicator of the Commission’s real political weight.
The Commission should improve its internal coordination in relation to the
European Semester cycle, especially between the Secretariat General, the Directorate
General for Economic and Financial Affairs (DG ECFIN) and the Directorate General for
Employment, Social Issues and Inclusion (DG EMPL). With respect to macroeconomic
policy surveillance, the key responsibility lies with DG ECFIN, whose position needs to
be strengthened. Against this background, a right step in this direction was taken by
President Barroso to separate work on analytical and political parts of recommendations
that are delivered to the Council in the framework of the EDP and to increase staff level
in this DG. The number of staff in SG and DG EMPL should also increase. All analytical
From Lisbon to Europe 2020
Lisbon
Strategy
99
173
The first thematic meeting of the European Council was focused on relations with strategic
partners and held on 16 September 2010. The European Council was to discuss innovations in October
2010. A very busy Council agenda provoked its postponement onto the February 2011 summit.

instruments that can help gauge progress in the framework of thematic coordination
should be further developed and used in daily work by the Commission.
174
As regards Europe 2020 implementation, cooperation between various
commissioners in the framework of relevant “commissioners groups” should be
strengthened.
175
9.5. Conclusions
Better coordination of economic policy, especially in its non-fiscal dimension,
increases the prospects for a more successful delivery of an economic strategy for this
decade. From this point of view, there was no better time to launch a reform of the
economic governance system than in the year preceding the start of the new strategy. The
national dimension of the Strategy provides a framework for structural reforms, including
actions for tackling the problem of macroeconomic imbalances. Effective implementation
of structural actions, especially leading to a reduction of imbalances and an increase in
competiveness, would be the desired outcome of economic governance reform.
The real question is to what extent the new governance framework will properly
provide solutions to the key problems the EU faces, e.g., macroeconomic imbalances.
Of course, in practice the framework will reveal how the situation in this respect can
evolve. Some critics argue that the new framework for the monitoring of imbalances
will be ineffective, because it does not properly reflect the nature of imbalances that
cannot be tackled in the short-term.
The priority of Member States is to prepare and implement politically credible
and ambitious NRPs and SCPs. At the EU level, the key priority is to adopt the legislative
package on economic governance as fast as possible.
It needs to be underlined that even the most sophisticated governance
mechanisms will not bring far-reaching progress in case of insufficient political will to
implement necessary actions. It seems that in many states political will is stronger than in
the past because of the current crisis, but such a determination cannot be taken for
granted. The main challenge is to avoid the situation of, quoting Jean Pisani-Ferry,
“Brussels talking to Brussels”
176
so that that entire coordination process does not attract
sufficient attention of the Member States and is de facto limited to EU institutions. In this
context, the building of strong ownership of the reforms at the national level is necessary.
The Polish Institute of International Affairs
100
Lisbon
Strategy
174
With respect to the monitoring of employment policy, in the framework of non-fiscal surveillance,
the Commission, in cooperation with the Employment Committee (EMCO) and the Social Protection
Committee (SPC), proposed to create a special analytical instrument—the Joint Assessment Framework
(JAF)—that would help identify the progress of implementation of Employment guidelines and headline
targets. Another useful analytical instrument is the LAF (Lime Assessment Framework), which was specified in
2007 as a tool to identify policies that are relevant for raising growth potential. See: European Commission,
http://ec.europa.eu/economy_finance/db_indicators/laf/index_en.htm (accessed on 12 January 2011).
175
President Barroso decided to establish in the present term of the College the following groups
commissioners: external relations, innovation, internal market, industrial policy, digital agenda, climate
change, pensions, budget and financial perspectives. During the term 2004–2009, a “group of Lisbon
commissioners” under the chairmanship of Barroso focused on all aspects related to the Lisbon Strategy.
Source: Commissioners groups, Information note from the President, SEC(2010) 475 final, 22 April 2010.
176
J. Pisani-Ferry, “Only One Bed for Two Dreams: A Critical Retrospective on the Debate over
the Economic Governance of the Euro Area,” Journal of Common Market Studies, 2006, vol. 44, no. 4.
pp. 823–844.

Part IV


General Conclusions and Recommendations:
1. After ten years of Lisbon Strategy implementation there is no clear picture of
the overall process. This year’s report, like previous ones, confirmed that
progress is very uneven between sectors and Member States. All factors that
have shaped such a conclusion were pointed out in previous PISM reports
and remain valid. In current circumstances, the Lisbon performance of the
Member States is to a large extent perceived via their ability to tackle the
effects of the global crisis. From this point of view, Germany can be seen as a
Member State that deserves distinction for its macroeconomic results and
strong recovery in 2010. Good macroeconomic performances in Sweden,
Denmark and Finland proved that their economies were built on a sustainable
basis, which augurs well for further leadership on Lisbon issues. From the
opposite side, the situation in Greece only confirmed the weak results of the
Lisbon implementation in that country. An assessment of Ireland is much
more complicated. Ireland performs relatively well in some sectors of Lisbon,
especially in entrepreneurship and the internal market, but its current
macro-financial situation is the effect of serious mistakes and flaws in its
economic policy for many years. The current macro-financial position of
Ireland negatively affected the assessment of the Irish performance in Lisbon
Strategy in 2010. The positions of other states did not change much in
comparison to the preceding year. The group of medium-performers on
Lisbon includes the majority of Member States.
2. In leading Lisbon sectors, such as entrepreneurship and the single market, the
problems that were indicated in previous PISM reports remain valid. Recent
progress in these areas has been weak and insufficient. Many bottlenecks still
exist in these fields. As a result, business potential in Europe cannot be fully
unleashed. Hence, further actions are needed in order to reap the greater benefits
of the functioning of the market in the EU, especially for SME and consumers. A
particular role in this respect can be attributed to the regulatory policy of the EU.
A “smart regulation” approach should be the first pillar of this policy. The EU
should consider setting up new reduction targets concerning administrative
burdens, as was suggested by the UK government.
177
The single market issues are
not high on the current political agenda of the EU and this should change. The
lack of strong ownership at the EU and national levels hinders progress, e.g.,
the liberalisation of some sectors of the markets and better transposition of
directives. Proper implementation of the Single Market Act can be only possible
when there is full political will at the EU and national level.
3. The Knowledge Triangle remains an area that needs substantial improvement
in the EU. Member States should increase the quantity or quality of RD&I
spending, which is considerably lower than in the U.S., Japan or South Korea.
Greater importance should be attached to an increase in business RD&I
spending through such measures as tax incentives and PPP encouragement. In
the field of education, EU Member States should improve their strategies for
lifelong learning. Some educational systems, especially in Greece, Romania
and Bulgaria, need to be urgently reformed in order to increase the quality of
education. The academic quality of the universities in the EU needs to be
From Lisbon to Europe 2020
Lisbon
Strategy
103
177
See “A confident future of Europe,” speech of Prime Minister David Cameron at the World
Economic Forum in Davos, 28 January 2011.

improved, especially in most of the new Member States, Greece and Italy. This
should be done through the financial reforms, improvements in the quality of
the academic staff through cooperation with foreign partners and the
introduction of public competitions for academic posts, and greater openness
to the market. British universities could be examples. Due to the difficult fiscal
situation in most of the Member States they could introduce a system of tuition
and fees connected to an EU-wide system of student loans. In this regard, the
EU budget and EIB funding could be used. Any new sources of higher-
education financing should be strictly related to thorough management reform
of the universities in most of the Member States, e.g., the introduction of open
competitions for academic posts based on academic performance. EU Member
States should adopt ambitious NRPs in order to fulfil the objectives of the
Europe 2020 flagship initiatives. The Commission should pay special attention
to countries that have serious problems catching up with other Member States.
Quick progress in the field of innovations cannot be achieved without a final
positive solution to the patent issue. Information society is an area that should
be treated in conjunction with other areas, such as the Knowledge Triangle,
and develop steadily despite the global economic and financial crisis, though it
will vary among the Member States. Poland, Bulgaria and Romania should pay
special attention to the Information Society and Knowledge Triangle sectors in
order to diminish the gap to the other Member States. The overall number of
Internet users is growing rapidly, and the share of broadband connections and
e-governance availability is increasing. The ICT sector should be treated as the
highest priority as it is a core element of competition in the global market. The
new strategy is well-focused on Information Society issues, but Member States’
efforts are necessary in order to move closer to the objectives, using PPP
cooperation and linking different policy areas at the EU, national and regional
levels.
4. Energy and climate change is one of the core areas of EU activity in the internal
and external sphere. The EU should increase efforts to build a more complex
binding international agreement on climate change issues. In some areas, the
EU performance is not sufficient, especially concerning the investment and
development of the alternative energy sector, cogeneration and the general
ability to achieve 20/20/20 objectives. The energy sector liberalisation
deadlock should be overcome in order to enhance competition in this market
and boost investments in green technologies. The new Multiannual Financial
Frameworks should be better adjusted to investments in low-carbon energy if
the EU wants to continue to play a major role in this sector.
The Energy and Climate sector is closely correlated with others, such as the
single market, research and development or employment, therefore the
successful implementation of objectives depends to a large extent on
cooperation between these sectors.
5. The situation in the EU labour market remains worrying, especially with
respect to young people and temporary workers. Unemployment problems
have been undermining the social situation. According to the Commission,
about 80 million people in the EU are still living at risk of poverty and a
quarter of them are children. The recent economic and financial crisis,
followed by a radical fiscal consolidation of some national budgets, resulted
in a wave of unemployment of young people and temporary workers.
Decreasing national social security budgets will require an effective use of the
remaining social policy tools. The EU is also facing dramatic demographic
The Polish Institute of International Affairs
104
Lisbon
Strategy

trends that will undermine the structure of pension schemes, which have to
be modified while taking into account the aging population. In order to
prevent the collapse of the pension schemes, the retirement age should be
raised in most EU Member States and the employment rate among the
professionally-active population should be increased. Pension system
reforms should be conducted in many Member States in the coming years.
The EU should develop a common approach towards pension reforms based
on features underlined in the Commission’s Green Paper of July 2010
(securing the adequacy of retirement income and ensuring sustainability of
public financing and the sustainability between time spent at work and in
retirement) and should improve mutual learning and sharing experiences
between EU states concerning the preparation and implementation of
pension reforms.
178
The EU also needs to be open to migration from third
countries in order to tackle labour shortages in the future. The governments
should make more efforts to ensure greater cross-border labour mobility
between Member States, followed by mounting compatibility of the social
security and pension systems.
6. The fiscal crisis that spread across the EU can be detrimental to growth, and
weaken the prospect for a successful implementation of the Europe 2020
agenda. For countries that have been facing the most serious fiscal troubles,
implementation of the strategy may be a very difficult challenge. “Friendly
consolidation” is not a possible option for the most deficit and debt-laden
states. The harsh fiscal consolidation required in these states can entail a
reduction of spending in areas that are relevant for the new strategy and
would, therefore, derail actions aimed at achieving headline targets at the
national level. The main challenge for the EU in the coming years is to
combine consolidation efforts with the implementation of the NRPs. The new
Multiannual Financial Framework (2014–2020), and cohesion policy should
be more oriented to the Europe 2020 objectives. Links between cohesion and
competitiveness should be better reflected in the new MFF.
7. Although the general outcome of Lisbon implementation is disappointing, it
allowed improvements in the strategic-oriented programming of economic
policy at the EU and national levels. The value added by the Lisbon Strategy
consisted of creating a link between different dimensions of economic
policies (macroeconomic, microeconomic and employment). The weak
governance of the Strategy hindered smooth implementation of this coherent
approach to economic policy. From this point of view, effective governance
of the Europe 2020 strategy, both at the EU and the national levels, is one of
the key conditions of its success. The full engagement of all EU institutions,
especially the European Council, is necessary in order to deliver concrete
results. At the national level, the implementation process of the new strategy
should become a pillar of economic policy programming. The EU and
Member States have to improve communication strategy referring to Europe
2020 in order to attract greater public interest and strengthen the awareness of
the need to conduct reforms.
From Lisbon to Europe 2020
Lisbon
Strategy
105
178
European Commission, Towards adequate, sustainable and safe European pension systems in
Member States, Green Paper, COM (2010) 365 final, http://eur-lex.europa.eu/LexUriServ/LexUriServ.
do?uri=COM:2010:0365:FIN:EN:PDF (accessed on 2 February 2011).

W
ARSAW
S
PRING
2011
From Lisbon to Europe 2020
Lisbon Strategy Implementation in 2010:
Assessments and Prospects
ISBN 978-83-62453-13-9
Report of the Polish Institute of International Affairs
THE POLISH INSTITUTE OF INTERNATIONAL AFFAIRS
POLSKI INSTYTUT SPRAW MIĘDZYNARODOWYCH
PISM
THE POLISH INSTITUTE OF INTERNATIONAL AFFAIRS
POLSKI INSTYTUT SPRAW MIĘDZYNARODOWYCH
PISM
9 7 8 8 3 6 2 4 5 3 1 3 9
Wyszukiwarka
Podobne podstrony:
Selected Secondary Sources Rituals and ceremonies from late medieval Europe to early America
Progressing from imitative to creative exercises
opow from rags to riches
Least squares estimation from Gauss to Kalman H W Sorenson
Complex Numbers from Geometry to Astronomy 98 Wieting p34
From empire to community
FROM COMMODITY TO
Idea of God from Prehistory to the Middle Ages
Manovich, Lev The Engineering of Vision from Constructivism to Computers
European Commission Report Convergence
Adaptive Filters in MATLAB From Novice to Expert
From dictatorship to democracy a conceptual framework for liberation
Notto R Thelle Buddhism and Christianity in Japan From Conflict to Dialogue, 1854 1899, 1987
Zizek From politics to Biopolitics and back
From Sunrise to Sundown
From Village to City
Create Oracle Linked Server to Query?ta from Oracle to SQL Server
lecture 16 from SPC to APC
więcej podobnych podstron