
EN
EN
EUROPEAN COMMISSION
Brussels, 7.6.2011
SEC(2011) 729 final
COMMISSION STAFF WORKING PAPER
Assessment of the 2011 national reform programme and convergence programme for
POLAND
Accompanying the document
Recommmendation for a
COUNCIL RECOMMENDATION
on the National Reform Programme 2011 of Poland and delivering a Council Opinion
on the updated convergence programme of Poland, 2011-2014
{SEC(2011) 824 final}

1
1.
I
NTRODUCTION
Poland was the only EU Member State that managed to avoid a recession during the crisis.
But this came at the cost of a rapidly deteriorating fiscal position. In response, the government
has started a fiscal consolidation programme and has introduced structural reforms to tackle
long-standing challenges in the labour and product markets. The reform plans of the
government are confirmed in the National Reform Programme (NRP) and the Convergence
Programme (CP) submitted to the Commission on 29 and 27 April 2011. These documents
also reflect the short-term commitments that the Polish government presented on 28 April
2011 under the Euro Plus Pact.
2.
E
CONOMIC
S
ITUATION
2.1. R
ECENT
E
CONOMIC
D
EVELOPMENTS
Poland experienced strong growth before the crisis. Driven by domestic demand, increasing
interlinkages with global trade networks, foreign capital inflows and credit growth, annual
real GDP growth averaged 5.2 % between 2003 and 2008. Domestic demand thrived on robust
job creation, credit growth and EU funds that helped boost investment and private
consumption. The turnaround in the labour market (unemployment fell by 12.8 pps between
2002 and 2008) was brought about by accelerating foreign direct investment inflows and a
strong export performance by Polish industry, spurred by EU accession and improvements in
price- and non-price competitiveness.
After a period of successful disinflation in the mid-2000s, Polish inflation stabilised at a
remarkably moderate level in 2005-2007. Throughout much of the remainder of the decade,
energy and food prices were the major driving force of inflation, whereas inflation in services
was broadly contained. Consumer price inflation surpassed 4 % in 2008-2009 on the back of
emerging capacity constraints, surging commodity prices and higher import prices (also
reflecting the zloty’s depreciation against the euro by almost 35 % between July 2008 and
February 2009). In 2010, inflation fell to around 2 % by mid-year amid muted domestic
demand before picking up to just below 3 % by end of the year on the back of higher
commodity prices.
The global financial crisis led to a decline in the growth rate of real GDP, but Poland avoided
recession. Real GDP increased by 1.7 % in 2009, down from 5.1 % in 2008. The resilience of
the Polish economy during the crisis reflects the interplay of several factors, including the
absence of large macroeconomic imbalances, relatively low trade openness, a favourable
export structure and a timely monetary and fiscal policy response. Sharp currency
depreciation helped mitigate the impact of collapsing export markets and weak domestic
demand for domestic production. As a result, the current account deficit narrowed to around
2 % of GDP in 2009.
The labour market adjusted through wages and sectoral reallocation of labour from industry to
services. Unemployment rose to 9.6 % in 2010, up from 7.1 % in 2008, despite increasing
employment (by 0.7 % in 2009-2010). Nominal wage growth slowed down in 2009-2010 and
real wages remained broadly stable during this period.
The banking sector also weathered the financial crisis well. The support scheme for financial
institutions included mostly government guarantees. It served as a safety net but was never

2
used by any financial intermediary. The National Bank of Poland also took some non-
conventional measures to support both the financial sector and the real economy.
In 2010, real GDP is estimated to have grown by 3.8 %. Rebounding external demand fuelled
the domestic manufacturing sector and reduced inventories. Capital inflows picked up as
ample global liquidity, reduced risk aversion and a growing interest rate disparity led to
renewed interest in Polish portfolio assets. As a result, foreign investment in sovereign bonds
grew substantially in 2010, while yields remained stable. Moreover, re-emerging inflationary
pressure led the central bank to start raising interest rates in January 2011.
2.2. O
UTLOOK
Economic activity is projected to increase by 4 % in 2011 and 3.7 % in 2012, as domestic
demand strengthens. The improving labour market situation and robust wage growth are
likely to stimulate household demand with an additional boost from the Euro 2012 football
championship
1
. The manufacturing sector is expected to gain from growing external demand,
while services will benefit from increased domestic spending. Construction activity, which
grew during the crisis on the back of sizeable investment in infrastructure, is likely to expand
as an easing off in public investment will be progressively compensated by growing demand
for housing. After deteriorating significantly over the last few years, public finances are
expected to improve in the years to come, driven by an ambitious consolidation package
aiming to reduce the general government deficit to below 3 % of GDP by 2012.
The rate of potential growth is expected to be lower than before the crisis, though the dip
appears to be relatively limited compared to that in the peer countries. Losses to capital stock
have been much more limited than in other countries, as shown by the lower level of
bankruptcies, not least due to moderate expansion of the construction and financial sectors in
the pre-crisis period. The labour market is more flexible than during the previous slowdown,
which limits hysteresis, and labour supply benefited from recent reforms (to reduce the tax
wedge and abolish special early pensions and pension reform). Lastly, increased public
investment in underdeveloped infrastructure network should increase private returns and total
factor productivity (TFP).
In the absence of adverse financial and external developments, GDP growth could average
some 3.5% in 2013-2015. Unemployment would fall further to around 8.25% at the end of the
period. However, after 2015, unfavourable demographics will kick in and the GDP growth
rate is expected to drop again to below 3 % in 2020.
3.
M
ONITORING
,
PROCEDURAL ISSUES AND
G
OVERNANCE
Poland has ensured that its National Reform Programme and Convergence Programme are
consistent. The two documents outline in an integrated manner the fiscal consolidation efforts
and key structural reforms and reforms underpinning macro-economic stabilisation. The
National Reform programme was adopted by the Council of Ministers on 26 April 2011 after
a consultation with social partners. The Convergence Programme, adopted on the same day by
the government, is expected to be subsequently discussed by the parliamentary commission.
1
The Euro 2012 football championship is estimated to add around 0.2 percentage point to real GDP growth in
2012.

3
In the National Reform Programme, Poland also set national targets for employment, R&D,
education, energy and climate change and poverty reduction for the year 2020. These targets
set out the longer-term development trajectory to modernise the Polish economy and put
imminent reform priorities in a broader context. In addition, the National Reform Programme
describes Poland’s proposed measures in relation to the Euro Plus Pact.
Table 1: Polish national 2020 targets
Europe 2020 targets
Current situation in Poland
2
Polish Europe 2020 target in
the NRP
R&D investment (% of GDP)
0.68 %
1.7 %
Employment rate (%)
64.6 % (2010)
71 %
Early school leaving (%)
5.3 %
4.5 %
Tertiary education attainment
(%)
32.8 %
45 %
Reduction of number of people
in or at risk of poverty or
exclusion
10 .4 million
- 1.5 million
Energy efficiency – reduction of
energy consumption in Mtoe
3
Reduction in primary energy
consumption: 14 Mtoe (16 % of
the primary energy consumption
in 2005)
Reduction in greenhouse gas
emissions (from sources not
covered
by
the
Emissions
Trading system)
+4 %
4
+14 %
5
Renewable energy (% of total
energy use)
9.60 %
15.48 %
4.
P
OLICY CHALLENGES
,
AGENDA AND ASSESSMENT
4.1. C
HALLENGES
The consolidation of public finances is fundamental to maintaining the confidence of financial
markets and reining in unsustainable debt. This presents a number of challenges. High
headline and structural deficits are the result of structural weaknesses on the expenditure side
and expansionary fiscal policy during the boom phase. Even though it is below the 60 %
threshold, Poland’s debt has increased, relative to GDP, by 7.9 pps in 2008-2010. Poland’s
fiscal framework has been strengthened recently but some challenges remain. The binding
character of the debt rule is contingent on keeping the definition of public debt unchanged,
but the latter can be adjusted by amending the Public Finance Act. There are problems with
monitoring the implementation of the general government budget throughout the year and this
has resulted in recurrent slippages on the expenditure side, though the new expenditure rule is
2
Source: Eurostat 2009 unless stated
3
As estimated by the Commission. Mtoe = Million tonnes of oil equivalent
4
This corresponds to the 2005-2008 trend in the emissions not covered by the EU Emissions Trading System.
As the scope of the Emissions Trading System changed between 2005 and 2008, these emissions are
estimated on the basis of the main relevant UNFCCC source categories (as opposed to the difference
between total emissions and EU ETS verified emissions).
5 The national emissions limitation target defined in Decision 2009/406/EC (or ‘Effort Sharing Decision’)
concerns the emissions not covered by the EU Emissions Trading System. It is expressed as the minimum
relative decrease (if negative) or the maximum relative increase (if positive) compared to 2005 levels.

4
expected to improve budget execution somewhat. Lastly, a lack of coordination between
various tiers of government in the annual and multi-annual budgetary planning compromises
the efficiency of the process. In particular, the annual Budget Laws and the Multiannual
Financial Plans adopted by the central government do not cover the budgets of local
government sector entities, which set up separate, largely independent financial plans.
The increased foreign portfolio capital inflows to Poland need to be carefully monitored,
particularly in an environment of rising interest rate differentials and abundant global
liquidity. Further fiscal consolidation would support the task of monetary policy in preserving
price stability, thereby helping to limit potentially excessive and harmful short-term inflows
driven by interest-rate differentials.
The increase in overall employment has been reversed and the rates for young and older
workers still lag behind the EU averages. Structural barriers prevent full employment of these
groups. Mismatches between skills and qualifications provided by the secondary and tertiary
education system and actual labour market needs limit the employability of young people and
serious weaknesses persist in the vocational education system. The range of alternative routes
to early retirement available to older workers significantly lowers the effective retirement age
and their employment rate. Moreover, the level of involvement of older workers in training
remains very low (0.7 % in 2009). Lastly, the employment rate of women is increasing but
remains considerably below the EU average. The frequent cause of women being out of work
or in part-time work is the lack of suitable child and dependent care services.
Regional labour mobility is low. It is the result of a lack of affordable housing in fast-growing
urban areas, insufficient transport infrastructure and a relatively more generous social security
system for farmers, dissuading people from moving from rural to urban regions. Low labour
productivity in Polish agriculture is due to unfinished restructuring in agriculture and the
important role of subsistence agriculture. Moreover, the limited shift to the non-agricultural
sector is due to low levels of education and investment in human capital as well as scarce jobs
in rural areas.
In recent years, Poland has significantly reduced the number of people facing poverty and
exclusion measured by all indicators except for the at-risk-of poverty indicator. Children are
particularly affected by the risk of exclusion as poverty amongst this group started to rise
again, reaching 23 % in 2009. In addition, poverty amongst older people sharply increased
between 2007 and 2009. Access to work remains only a partial remedy, as the level of in-
work-poverty is high.
Poland faces a number of challenges related to infrastructure development, energy generation
and the environmental impact of both. The economic crisis has not reduced greenhouse gas
emissions to bring them into line with the 2020 national target.
C
ompetition among current
electricity providers is limited and there are only a few interconnections with other Member
States, which increases energy costs. Moreover, the energy generation capacity is ageing
(45 % of capacity is more than 30 years old and 77 % is more than 20 years) and reaching its
limits. Furthermore, Poland’s underdeveloped transport infrastructure continues to be a major
bottleneck to growth. Investment appears to be driven by the short-term availability of
structural funds and the policy is focused mainly on road construction. Neglecting other
modes of transport, including railways, also indicates a lack of focus on environmental
sustainability.
The low level of public R&D, which reached only 0.48 % of GDP in 2009, is the result of
insufficient long-term financial commitment to increase public funding for research and

5
innovation. Linkages between science and industry are very weak, mainly due to the relatively
poor absorption capacity of Polish firms and the disconnection between public research
outputs and private technological needs. Another major challenge is the severe
underinvestment in research and innovation of the private sector that has led to a weak
innovative capacity.
The quality of business environment and the efficiency of public administration are low in
Poland. In World Bank cross-country comparisons, Poland performs particularly poorly in the
areas of paying taxes, starting up and closing down a business, enforcing contracts and
registering property. Companies are hindered by lengthy licensing and permit procedures (e.g.
the average time to obtain a construction permit is 311 days, compared to an average of 166
days in the OECD countries). As regards judicial and other legal actions, such as contract
enforcement and registration of property, the duration of procedures (it takes an average of
830 days to enforce a contract through the courts in Poland compared to 517 days in the
OECD countries) and the number of procedures are relatively high. In addition, Polish small
and medium size enterprises (SME) trade with non-EU countries much less than their peers
due to lengthy import and export procedures.
Box 1. Euro Plus Pact
On 24/25 March 2011, Poland decided to join the Euro Plus Pact. The national commitments/actions
were communicated in a letter from Prime Minister Tusk to the President of the European Council
Van Rompuy on 28 April 2011. Measures presented by the Polish government within the framework
of the Euro Plus Pact contribute to the four objectives of the Pact and form part of the reform agenda
presented in the National Reform Programme and the Convergence Programme.
Measures to foster competitiveness presented by the government focus on education and science (i.e.
implementation of the reform of the science system; support to young scientists; transfer of knowledge
into economy and implementation of the reform of the higher education system), infrastructure
development (i.e. creation of modern road, rail, energy and digital networks) and the business
environment (i.e. reductions in red tape, easier access to bank loans, a pay freeze in the public sector).
Measures to foster employment focus on labour market participation (provision of better care facilities
for children under three, preservation of lower disability pension contributions) and education (getting
business involved in education). Measures to further improve public finance sustainability include
enforcement of the existing debt rule, temporary expenditure rule (CPI + 1 %), new regulations
limiting deficit ratios of local governments and a permanent expenditure rule. Measures to reinforce
financial stability
aim for more efficient regulation and supervision of the banking sector (i.e. new
regulations for bank resolution funds and support for the activities of the ESRB).
The measures listed in the letter largely reflect the reform agenda presented in the NRP but they do not
go substantially beyond the NRP. Several important policy challenges remain unaddressed (e.g. low
participation rate of older workers) or are only touched upon (e.g. improvement of business
administration). Given the significance of the challenges ahead, further action will be required to boost
domestic sources of growth.
4.2. A
SSESSMENT OF THE
P
OLICY
A
GENDA
4.2.1.
Macroeconomic policies

6
4.2.1.1 Public finances
The macroeconomic outlook underlying the convergence programme, which is the same as
the outlook underpinning the national reform programme, expects real GDP growth to
stabilise at 4 % in 2011 and 2012 on the back of rebounding private investment and stable
private consumption. Real GDP growth is expected to ease to slightly below 4 % in 2013 and
2014. According to the programme, over 2011-2014 the economy should be mainly driven by
domestic demand. The contribution of external trade is expected to turn slightly negative,
reflecting stronger imports driven by a recovery in investment.
Real GDP growth assumptions in the programme for 2011-2012 are in line with the
Commission services' spring 2011 forecast of 4 % in 2011 and 3.7 % in 2012. The programme
expects private consumption to grow by around 3.2 % in 2011 and to accelerate to somewhat
below 4 % in 2012 and beyond. This is in line with the Commission services' forecast, which
predicts 3.3 % and 3.7 % growth of private consumption in 2011 and 2012, respectively. The
programme’s projections of real GDP growth in 2013 and 2014 are broadly in line with the
Commission services' potential growth assumptions.
While the projected fall in unemployment from 9.7 % in 2010 to 8.8 % in 2012 matches the
Commission services' forecasts, the programme’s forecast for employment growth in both
2011 and 2012 are slightly more favourable than the Commission services'. Moreover, the
programme assumes somewhat faster growth in employee compensation and in total
compensation of employees than does the Commission services' forecast.
The programme’s projections for consumer price inflation, showing an increase to 3.5 % in
2011 on the back of rising commodity prices and a gradual decline to 2.8 % in 2012, are
slightly below the Spring 2011 forecast (3.8 % in 2011 and 3.2 % in 2012). The
macroeconomic scenario is broadly consistent with monetary and exchange rate assumptions.
The output gap as recalculated by the Commission based on the information in the
programme following the commonly agreed methodology is forecast to remain stable at -1 %
over 2010-2012, before decreasing temporarily to -1.1 % in 2013 and rising again to 1 % in
2014.
6
The recalculated negative output gap in the programme is slightly smaller than that
estimated in the Commission’s Spring 2011 forecast (-1.1 %, -1.2 % and -1.4 % of potential
output in 2010, 2011 and 2012, respectively).
Overall, the programme is based on plausible growth assumptions over the programme
timeframe, but the employment and wage growth assumptions may be considered as
favourable.
The economic crisis has taken a heavy toll on public finances. The general government deficit
rose steadily from 3.7 % of GDP in 2008 to 7.3 % of GDP in 2009 and 7.9 % of GDP in 2010
despite a modest consolidation package enacted in 2010. The 2010 budgetary outcome
significantly exceeded the 6.9 % deficit targeted in the previous (February 2010) update of the
programme. Budgetary slippage was due mainly to lower-than-expected revenues from taxes
on income and wealth (-0.8 pp. difference), taxes on production and imports (-0.3 pp.) and
property income (-0.2 pp.). Meanwhile, expenditure was slightly lower than projected, driven
mainly by lower investment expenditure (-0.8 pp.), and despite one-off expenditure related to
two waves of severe floods in the first half of 2010.
6
The output gaps presented in the programme are significantly higher than the programme’s recalculated
output gaps, and amount to -0.2 %, -0.1 %, -0.2 % and -0.2 % of potential output in 2011, 2012, 2013 and
2014, respectively.

7
For 2011, the difference between the deficit projected by the February 2010 update of the
programme and the Spring 2011 forecast amounts to 0.1 pp. The similar aggregate outcome
hides more diverging views on development of revenues and expenditures. While the previous
programme projected a small increase (0.7 pp.) in the revenue ratio and a slow reduction (0.3
pp.) in the expenditure ratio as compared to 2010, the Spring 2011 forecast expects revenues
to increase by a much faster 2.1 % of GDP and expenditure also to grow, albeit marginally, by
0.1 % of GDP. On the revenue side, the difference is mainly due to higher social contributions
and revenues from taxes on production and imports projected by the Commission, partially
offset by a lower starting position in 2010. At the same time, the Commission forecast a
somewhat slower increase in expenditure than the national authorities, which is more than
offset by a considerable base effect.
The main goal of the programme’s medium term budgetary strategy is to reduce the general
government deficit to below 3 % of GDP by 2012, thus confirming the commitment to
meeting the deadline set by the Council under the Excessive Deficit Procedure. From 2013
on, the main goal is to achieve long-term sustainability of the public finances. The programme
does not anticipate achieving the Medium-Term Objective (-1 % of GDP) within the
programme period. However, expenditure projections seem to ensure an appropriate
adjustment path towards the MTO, when assessed against the projected rate of medium term
potential output growth.
Although the adjustment path has remained broadly similar to that presented in the previous
update of the programme, the composition of the planned consolidation has been substantially
revised. Revenues are now assumed to be more buoyant than previously, projected current
spending is higher than in the previous update of the programme, and public investment plans
have been revised downwards. Moreover, the planned consolidation is slightly back loaded.
Box 2. Main measures
The projected consolidation is a combination of a number of policy measures implemented in 2011
and planned to be enacted in 2012, supported by the economic rebound and its strong impact on tax
revenues. Discretionary measures, mostly of a structural nature, address expenditure and revenue. On
the revenue side, the main budgetary impact in 2011 and 2012 is expected to come from the amending
pension reform resulting in a redirection of contributions to the public pension pillar, increase in VAT
and excise duty rates and abolition of some tax exemptions. On the expenditure side, a rule expected to
limit nominal growth in discretionary expenditure and all newly enacted spending items to 1 % over
the inflation rate is accompanied by the abolition of early retirement schemes and cuts in social
spending. Moreover, a fiscal rule limiting the deficit of local government entities is planned for 2012.

8
Main budgetary measures (% of GDP)
Revenue
Expenditure
2011
• Amendment of the pension reform (0.64 %)
• Increase in VAT rates by 1 pp. (0.41 %)
• Nominal freeze of PIT thresholds (0.09 %)
• Expenditure rule (including nominal freeze
in wage fund) (0.46 %)
• Cuts in spending on active labour market
policies (0.28 %)
• Replacement of early retirement by
‘bridge’ pensions (0.36 %)
2012
• Amendment of the pension reform (0.53 %
of GDP)
• Nominal freeze of PIT thresholds (0.1 %)
• Expenditure rule (including nominal freeze
in wage fund) (0.60 %)
• Deficit rule for local governments (0.40 %)
• Replacement of early retirement by
‘bridge’ pensions (0.39 %)
Note: The budgetary impact in the table is the impact reported in the programme, i.e. by the national authorities.
A positive sign implies that revenue / expenditure increases/decreases as a consequence of this measure.
The projected consolidation is subject to a number of risks, which may jeopardise the
achievement of the 3 % GDP deficit target. First, the elasticity of tax revenue with respect to
the tax base may be lower than the optimistic assumptions underlying the government’s
projections, leading to lower revenue. Second, changes to the current spending plans, also
beyond the direct control of the government, and potential delays in implementing the deficit-
reducing measures could result in a slippage in budgetary outcome. In particular, expenditure
cuts based on the newly enacted expenditure rule and the yet-to-be-enacted deficit rule for
local and regional governments may fall short of the ambitious plans underlying projections
presented in the Programme, due to the lack of transparency and resulting room for discretion
in their implementation. Third, capital transfers to Poland may be lower than projected due to
the insufficient capability of central and local governments to co-finance EU-funded projects.
On the upside, inflation rate and GDP growth may be higher than assumed leading to a faster
increase in revenue.
The Commission has taken into account the potential risks to the budgetary consolidation
process in the Spring 2011 forecast. Significantly lower revenue growth and minor differences
in the estimates of the budgetary effect of the expenditure-reducing reforms (in particular the
newly enacted fiscal rules) result in a gap of 0.2 pp. in 2011 and 0.7 pp. in 2012 in the
projected general government deficit ratio.
Given that growth over the programme period is projected to be close to potential and the
budgetary consolidation is driven mainly by measures classified as structural, the planned
fiscal effort is in line with the reduction in the headline deficit. For the period 2011-2012, the
average annual fiscal effort in the programme, taken at face value, amounts to 2.4 % of GDP.
It is, however, subject to risks related to implementation of the enacted measures, mainly on
the expenditure side, where the new fiscal rules may prevent consolidation reaching the
expected size. It should be noted though that amending the pension reform — reducing the
structural budget deficit by 0.7 % in 2011 and a further 0.5 % of GDP in 2012 — does not
improve the underlying budgetary situation as it increases long-term liabilities
correspondingly.

9
Although the programme does not expect to reach the Medium-Term Objective within the
programme period, the expenditure projections seem to chart an appropriate adjustment path
towards the MTO, when assessed against the projected rate of medium-term potential output
growth.
The general government gross debt has been increasing constantly since 2005, with the
exception of 2007 when a sharp reduction in deficit enabled debt to temporarily contract to
45 % of GDP. Since then it has increased gradually and reached 55% of GDP in 2010.
According to the Programme, this trend is expected to be reversed, and debt relative to GDP
to fall gradually over the programme period to reach 50.8 % of GDP in 2014. It will therefore
remain clearly below the Treaty threshold. The downward trend projected in the Programme
is a combined effect of fast-falling deficit, a newly implemented liquidity management reform
and optimistic assumptions on stock-flow adjustments including the proceeds of privatisation
and favourable assumptions on exchange rate fluctuations. The path presented in the
programme differs somewhat from that of the Commission’s Spring 2011 forecast, which
projects debt to increase by 0.4 pp in 2011 and fall back to the level of 2010 in 2012. The gap
stems from less of a reduction in the deficit and less optimistic assumptions on the stock-flow
adjustments.
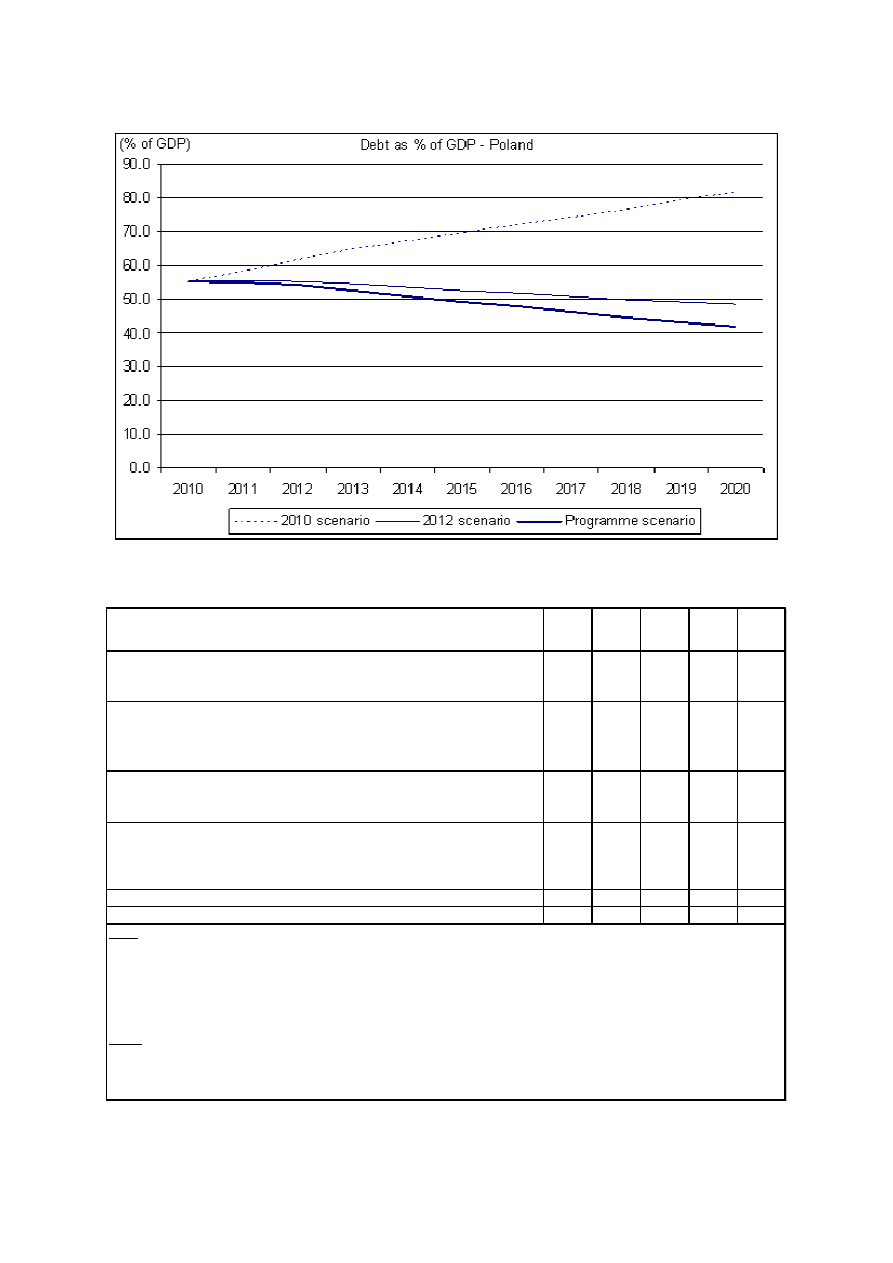
Poland is at medium risk with regard to the long-term sustainability of public finances. The
long-term cost of ageing is significantly below the EU average. However, the current
budgetary position causes a wide sustainability gap over the long term. Based on the current
fiscal position, debt would increase to 82 % of GDP by 2020. However, full implementation
of the programme would be enough to put debt on a downward path and bring it below 60 %
of GDP by 2020. Ensuring higher primary surpluses over the medium term would help reduce
the risks to the sustainability of public finances currently assessed as medium.
Poland has strengthened substantially its fiscal framework over the past years. However,
existing fiscal rules and medium-term programming procedures do not provide for sufficient
transparency and flexibility in the event of a macroeconomic shock in order to assure
sustainability of public finances in the medium to long term and incentives for coordination
between various tiers of government.
4.2.1.2. Financial sector
The Polish banking sector is by far the biggest in absolute terms in Central and Eastern
Europe, with a total balance sheet reaching 80 % of GDP in 2010. Polish banks are
predominantly foreign owned (70 % of Polish banks in terms of assets are controlled by
foreign owners), although the biggest bank in Poland, PKO BP, is state controlled.
Like the rest of the Polish economy, the banking sector has weathered the crisis well. Due to
the rather conservative, domestically-focused business model, adopted by financial
institutions in Poland and prudent financial regulation, the sector has not been exposed to any
toxic assets or complex derivative transactions. However, since 2008 the quality of the
lending portfolios has steadily worsened across all client segments. In particular, consumer
loans, where non-performing loans exceeded 17 %, should be closely monitored.
Immediate risks to the stability of the Polish financial system are restricted to the issue of
foreign currency (FX) lending, the risk of a housing bubble being relatively limited because of
prudent financial regulations and existing acute shortages in housing. Un-hedged FX loans
account for one third of banks’ credit portfolio, with about three quarters of all FX loans being
mortgage loans. The two foreign currencies predominant in financing Polish mortgages are
the Swiss franc (88 %) and the euro (11 %). The risks related to un-hedged foreign currency

10
lending are being addressed by the Polish financial supervisor (KNF) via recommendations
aiming to improve the quality of credit risk management in banks and raising the overall
awareness on risks related to loans in foreign currencies. Two recent recommendations set
stringent loan-to-value and debt service-to-income ratios, impose on banks the separation
between loan sales and risk assessment procedures and enable clients to repay credits directly
in foreign currencies. It is expected that the stock of FX loans will gradually diminish over the
next 10-15 years as loans are repaid or redenominated into the national currency. All in all,
Poland appears to address this challenge adequately at this stage, but the Commission will
continue to monitor the situation.
4.2.2. Labour market policies
Poland recognises the structural challenges related to labour market reform. In November
2010, the government adopted the ‘Human Capital Development Strategy’ as part of the ‘Plan
of Re-arrangement of Development Strategy’. The human capital strategy identifies a number
of strategic objectives (e.g. an increased level of professional activity, greater mobility and
adaptability, an improvement of quality of working life and raising the level of competence
and skills of citizens).
Labour market participation
With respect to the low employment rate of older workers, the government replaced the
existing early retirement schemes with ‘bridge pensions’ in 2009. These are available for a
much smaller number of people (i.e. employees in difficult working conditions) and are partly
funded with additional employers’ contributions. Moreover, in 2010 the government started
consultations with the trade unions on potential changes to the pension system for uniformed
services (the police, the armed forces and the prison service), in order to lengthen their service
time. However, the National Reform Programme makes no reference to further changes to the
pension system apart from a general statement to increase the effective retirement age by
2015.
The introduction of ‘bridge pensions’ in 2009 and the further work to extend the service time
of uniformed professions should increase the effective retirement age and reduce fiscal costs.
However, the proposed amendments with respect to uniformed services will not apply to
current employees and thus their full effect will only become apparent in the longer term.
Moreover, the proposals to change the special retirement arrangements and to rise the
statutory retirement age are delayed.
Access to childcare for 3-5 year-olds has increased over the last years with significant support
from EU funding. Nevertheless, concrete measures are needed to ensure a sustainable and
affordable service provision in the future. The NRP includes plans to subsidise municipalities
for creating kindergartens. Recently, more flexible childcare arrangements for younger
children have been introduced. The government also intends to implement a ‘Toddler
programme’’ (‘Program Maluch’) aimed at developing childcare institutions and expanding
existing forms of childcare. Further efforts might be necessary to ensure the sustainability of
the pre-school arrangements currently under development, accelerate enrolment rates of
children below three years and facilitate access to care services for the elderly and other
dependants.
As far as the low employment rate of the disabled is concerned, the latest legislative changes
propose financial measures to support their employment and are aimed at reducing co-
financing of jobs for the mildly or moderately disabled while increasing co-financing for jobs
occupied by the more seriously disabled. The proposals target assistance to those with a

11
serious level of disability (representing 4 % of all working disabled and almost 19 % of all
disabled of working age) while others, especially the lesser disabled, are to be encouraged to
seek work on the open labour market.
Investment in transport infrastructure, as well as more accessible social infrastructure and
affordable housing remain crucial to promote labour mobility and facilitate commuting. In
this respect, the NRP envisages expanding the affordable housing rental market, while
increasing flexibility in rental housing legal provisions and investing in transport networks in
order to facilitate commuting from rural to urban areas. However, the announced measures
may not significantly improve labour mobility and labour market participation, as they do not
sufficiently address the supply of housing (hindered by the lack of zoning plans) and focus too
much on major transport networks neglecting short-distance railway infrastructure facilitating
commuting.
No major legislative initiatives are currently envisaged to tackle the problem of the
incomplete restructuring of the agriculture sector. The debate on the farmers’ social security
system (KRUS) is not advancing. However, as a result of the recent Constitutional Court
opinion (October 2010), the rules for calculating the value of health insurance contributions
within KRUS have to be changed. The value of individuals’ contributions will have to be
adjusted to their income (currently they are equal for all farmers). This may reduce one of the
incentives for remaining in the KRUS scheme, namely the lower healthcare insurance
contributions. Overall, the current system of incentives to remain in agriculture needs to be
reviewed and concrete measures aimed at providing ex-farmers with new skills should be
implemented.
Education and skills
Poland has been carrying out extensive reforms to modernise all levels of its education system
and has improved its results in OECD PISA studies. It has number leaving school early
considerably below the EU average, and higher education attainment is slightly above EU
average.
However, the education system faces serious difficulties in providing adequate skills as
required by the labour market. Skills and jobs mismatches, especially among young people
should be addressed by implementing the proposed effective lifelong learning strategy, the
reform of the higher education system linking it better with labour market needs and further
investments in vocational education programmes, targeting in particular the low-skilled and
older workers. Work has already started on implementation of the National Qualifications
Framework on top of the national register of qualifications (scheduled for 2012). A policy
document ‘The prospect of Lifelong Learning’ is soon to be adopted. The NRP sets out plans
for legislative amendments to better link education to the needs of the labour market, e.g. by
enabling schools to implement training courses preparing to confirm qualifications. The NRP
also envisages facilitating the transition from education to first employment and job creation
in new, less crisis-prone industries.
In addition, Poland is addressing challenges in this area through a higher education reform,
which is expected to be implemented in the second half of 2011. The reform is intended to
encourage universities to provide more flexible and higher quality curricula which would
reduce the skills mismatch by involving employers in the education process and by
strengthening university-business links in order to ensure an appropriate range of fields of
studies meeting labour market needs.
Access to tailored and individualised support programmes including dedicated training and
apprenticeship programmes leading to a first vocational experience is low. Moreover, the

12
provision of practical training in enterprises for young people within the VET framework is
not effective nor is the system of incentives for companies to provide on the job learning. The
amendment of December 2010 to the Act on Employment Promotion is, however, a step in
the right direction. It renders compulsory the preparation of Individual Action Plans for
unemployed young people (under 25) and for those with no qualifications or vocational
experience who remain unemployed for over 6 months.
Poverty reduction
Improving the job prospects for the main groups at risk of exclusion will help reduce poverty
in Poland. Accordingly, efforts should be made to assist families with children, since
childcare responsibilities are one of the main reasons for inactivity/unemployment (women
after child birth and single parents constitute a significant proportion of the unemployed).
Another challenge is related to the existing short working careers of women, also due to the
lower statutory retirement age for women, exposing them to a real risk of inadequate future
pensions. In addition, the high in-work poverty should also be addressed, especially among
workers with low educational attainment. Lastly, combating in-work poverty and social
exclusion among the disabled (especially in rural areas) remains a challenge in Poland.
4.2.3.
Growth enhancing structural measures
Business environment
Cumbersome tax administration procedures, unstable tax legislation, rigid business entry/exit
procedures for companies and burdensome licence and permit requirements, including lengthy
construction permit procedures, adversely affect the business climate. Recent changes to the
tax system, that entered into force in 2011, including introduction of VAT registers for
lawyers and doctors, abolition of the tax exemptions for company cars and moderate changes
in tax administration (a shorter VAT refund period and electronic personal income tax (PIT)
settlements introduced in 2009) make the tax system slightly more transparent and taxpayer-
friendly. Additionally, the government is working on the revision of implementing provisions
introducing ‘one-stop shops’ to register business activity (as part of the implementation of the
Small Business Act) to make business registration over the internet possible countrywide in
2011. Moreover, in the new business environment reform, which should be enacted in 2011,
the authorities intend to abolish several licences and permits, replace redundant certificates
issued by public institutions with signed declarations, permit the electronic access to the
National Court Register and allow the use of e-invoices. Lastly, introduction of an e-judiciary
for small lawsuits in 2010 slightly reduced the backlog of pending court cases.
These reforms of the tax administration and business administration are important, even
though small improvements. Creating favourable entry and exit conditions for companies and
limiting the number of licences and permits remain major challenges. Despite the creation of
the e-judiciary, judicial proceedings are still very lengthy, but their cost is much lower than
the EU average. The government has not yet simplified the construction permit process, but
several promises were made, while local governments are slow in establishing zoning plans
that would simplify the investment procedures. In order to promote competitiveness of Polish
SMEs in markets outside the EU, the government could also envisage speeding up export and
import procedures. Regarding the legislative process, the impact assessment and public
consultation guidelines are insufficiently implemented. In general, there is a need to change
the legislation making culture by fully and effectively implementing the impact assessment
and public consultation guidelines.

13
Legislation to implement the Services Directive has been adopted, and the Commission is
conducting a quality assessment. Poland has also set up its electronic Point of Single Contact
Portal, but could step up efforts to enhance the online completion of procedures. For the last
four years, Poland has missed the agreed internal market acquis transposition deficit target.
The transposition of directives into national law is not given sufficient political priority in
Poland. The checks in place do not work effectively as there is no internal sanction system
when transposition deadlines are missed. Most transposition requires making changes to acts
of Parliament, resulting in long procedures.
Energy and climate change
In the field of energy, the policy objectives were set in the framework strategy Energy Policy
of Poland until 2030
. In addition, the government intends to adopt in 2011 the 2nd National
Energy Efficiency Action Plan
(NEEAP2) with clear allocation of responsibilities, deadlines
and budgets. It has also launched demonstration projects for Carbon Capture and Storage
(CCS) technology to exploit the potential of reconciling climate policy goals with the heavy
coal dependency of the Polish economy. Furthermore, new legislation introducing the system
of white certificates for energy providers has recently been voted in the Polish Parliament and
financial support for thermo-modernisation of buildings is offered through a dedicated
programme. Poland has submitted its National Renewable Energy Action Plan aimed at
reaching its 2020 renewable energy targets. The Plan is to be fully implemented and will fully
transpose Directive 2009/28/EC on the promotion of the use of energy from renewable
sources. Lastly, the NRP envisages that the act on transmission corridors to facilitate
investment in the electricity grid will be prepared in 2011.
In spite of the influence of the economic crisis, the recent trend in emissions does not appear
in line with the 2020 national target (+14 % compared to 2005 levels). This means that
additional emissions reduction measures or the use of flexibility mechanisms would be
needed to reach the target, in particular in the road transport, construction and agriculture
sectors.
Ageing generation capacities and transmission networks could lead to an undersupply of
energy and a strong increase in energy costs for end-consumers and industry. The provision of
a large amount of emission permits to the energy sector has indirectly created incentives to
renew capacity generation based on coal. As planned new electricity generation plants will be
mainly based on coal, the potential high carbon price increases may be passed onto electricity
prices, particularly given the limited competition on the Polish energy market and the slow
progress in the developing cross-border interconnections of the electricity grid. Rebalancing
incentive mechanisms for investments in low carbon emitting energy sources, including
renewable energy sources, would help Poland meet its emission targets. Speeding up the
development of interconnections with the rest of the European Energy Market, in particular in
the context of the Baltic Energy Market Interconnection Plan, would meanwhile help to
prevent electricity price hikes. Poland could also reduce emissions by increasing its energy
and resource efficiency, for example by more efficient use of biomass. Energy production
could also be more frequently based on highly energy efficient co-generation of electricity
and heat. A clearer and more favourable legal framework for energy performance contracting
would also enable investment in energy saving in public buildings with less need to resort to
public funding. A further source of energy efficiency would be to specify energy efficiency
targets for electricity generation capacity to avoid wasting fuel resources.
As far as the gas market is concerned, the lack of third party access (TPA) is still an
outstanding problem and Poland may further invest in gas interconnectors and domestic

14
transmission pipelines to successfully address energy security and market liberalisation
challenges.
Transport and broadband infrastructure
Spending on the new transport network, co-financed with EU funds, accelerated in 2010 and
is supposed to increase in 2011-2012. The electronic toll system to be introduced from 2011
onwards for buses and other heavy vehicles may help move towards an infrastructure
charging system in line with the ‘polluter pays’ and ‘user pays’ principles, while generating
revenue and achieving a more balanced modal split, which would improve the efficiency of
the entire transport system. However, existing bottlenecks in transport administration,
budgetary constraints to extend transport infrastructure and a strong focus on the road network
has resulted in neglect of the railway sector. Poland would thus benefit from introducing
sustainability concerns in its planning, in that it would rebalance investment between transport
modes and shift support in favour of railways. Implementation of the already adopted master
plan would improve the attractiveness of rail transport and would help modernise the largely
obsolete rolling stock (leading to significant changes to the speed limits as the maximum
speed on 40 % of the operating network is less than 80 km/h). Poland also intends to adopt
this year the new integrated transport strategy, which is expected to better balance investment
priorities in various transport modes (railway, air and road transport) taking into account long-
term sustainability, including the policy thrust of the Transport 2050 Roadmap. It is also
important to ensure compliance of transport investments with EU environmental and transport
directives and regulations. Lastly, the economic justification for the way transport
infrastructure priorities are set may be revised to limit the effects of budget cuts on the
infrastructure network. Where appropriate and justified, public-private partnerships can be
considered to reduce budgetary pressure while assuring adequate infrastructure for the
economy.
Poland has a very low fixed broadband penetration, in particular in rural areas. Mobile
broadband is another gateway for access but Poland is behind schedule to switch off analogue
terrestrial TV and free up a significant amount of radio spectrum. This delay risks slowing
down mobile broadband deployment.
Research, innovation and tertiary education
In the last few years, Poland has adopted many reforms aimed at increasing the quantity and
efficiency of public support for research and innovation. In October 2010, the ‘Building upon
Knowledge’ (‘Budujemy na Wiedzy’) reform programme entered into force. This reform
programme will render the Polish Academy of Sciences more excellence-driven, introduce a
competitive funding system for the allocation of public funding and decentralise the
implementation of science policy by setting up two new executive agencies, the National
Science Centre, in charge of basic research, and the National Research and Development
Centre dealing with applied and collaborative research between research institutions and
industry.
A reform of tertiary education will give higher education establishments more freedom to set
curricula. The best public and private universities will receive additional public grants and the
quality and financing of PhD students will be improved through greater focus on their
publication record and more competitive qualification procedures. Moreover, academic staff
will be restricted in the number of positions they can hold and the procedures of staff
appointment, promotion and performance appraisal will be made more transparent and
competitive (including periodic assessment of academic staff). There are further plans to give
a major stimulus to private sector R&D spending, particularly through collaborative private-

15
public projects and the development of a system of significant fiscal incentives. Lastly, smart
specialisation strategies at national and regional level will be developed to provide a
framework for improving the regional innovation systems.
The reform of the science system should result in a more competitive framework, responding
better to market needs and promoting excellence in research through international peer
review. Moreover, it should help change the incentives and mentality of Polish researchers.
However, substantial private funds and public incentives (based on current initiatives from
EU funds) will be needed to reach the national R&D spending target, while further reforms
leading to internationalisation of the science framework and better alignment with business
needs are necessary. The reform of tertiary education should be an effective way to introduce
competition into the system. Moreover, in the medium term (after the Excessive Deficit
Procedure for Poland is lifted), the design and implementation of a tax scheme to support
private research and innovation together with the inclusion of a multiannual funding
framework in the upcoming strategy for an innovative economy could be envisaged.
5.
S
UMMARY
The 2011 update of the convergence programme sets out an ambitious budgetary
consolidation programme to be implemented in 2011 and 2012, based on a plausible
macroeconomic scenario. A package of mostly structural measures, strengthened by a
significant economic rebound, aims to bring the general government deficit below 3 % of
GDP by 2012, and thus meet the deadline set by the Council under the Excessive Deficit
Procedure. A number of risks to implementation of the consolidation package mean that
successful correction of the excessive deficit by 2012 may require additional measures. An
efficient, transparent and flexible fiscal framework seems to be required to ensure stability of
the public finances over the long term.
The reform policy agenda, presented in the National Reform Programme, covers a broad
range of measures aimed at overcoming major structural challenges in Poland. Currently
enacted and proposed labour market reforms are expected to increase the employment rate,
especially by improving female employment and better linking education to labour market
needs. These reforms will have to be effectively implemented and strengthened by further
measures on childcare and vocational education, including on-the-job training. In addition,
particular attention should be put on specific measures targeting the employment of older
workers, increasing their retirement age and improving internal mobility of the workforce. In
order to increase labour productivity, improve the business environment and boost innovation,
the enacted and announced reforms of the R&D and education system, business
administration and increased infrastructure spending must be effectively implemented.
Additional measures could be envisaged to further strengthen links between tertiary
education, research and industry, to encourage investment in low-carbon-emitting energy
sources and infrastructure and to enhance contract law enforcement, simplify construction
permit procedures and speed up the establishment of local zoning plans.

16
ANNEX
Table I. Macro economic indicators
1995-
1999
2000-
2004
2005-
2008
2009
2010
2011
2012
Core indicators
GDP growth rate
6.0
3.2
5.4
1.7
3.8
4.0
3.7
Output gap
1
-0.3
-0.3
1.4
-0.7
-1.1
-1.2
-1.4
HICP (annual % change)
11.3
4.3
2.6
4.0
2.7
3.8
3.2
Domestic demand (annual % change)
2
7.5
2.4
6.0
-1.0
4.0
4.4
3.7
Unemployment rate (% of labour force)
3
12.0
18.6
12.1
8.2
9.6
9.3
8.8
Gross fixed capital formation (% of GDP)
21.7
19.9
20.4
21.2
19.5
20.8
21.3
Gross national saving (% of GDP)
20.3
17.5
18.6
18.2
17.5
17.7
18.1
General Government (% of GDP)
Net lending (+) or net borrowing (-)
-4.1
-5.0
-3.3
-7.3
-7.9
-5.8
-3.6
Gross debt
42.8
41.8
46.7
50.9
55.0
55.4
55.1
Net financial assets
0.1
-19.9
-20.0
-22.7
n.a
n.a
n.a
Total revenue
42.3
38.3
39.9
37.2
37.8
40.0
40.1
Total expenditure
46.4
43.3
43.2
44.5
45.7
45.8
43.7
of which: Interest
4.4
3.0
2.5
2.6
2.7
2.8
2.7
Corporations (% of GDP)
Net lending (+) or net borrowing (-)
-4.5
-1.8
0.0
3.7
4.0
3.9
1.9
Net financial assets; non-financial corporations
-74.7
-69.4
-72.2
-80.6
n.a
n.a
n.a
Net financial assets; financial corporations
10.3
11.6
-8.3
-3.2
n.a
n.a
n.a
Gross capital formation
14.7
12.4
13.0
10.5
9.8
10.2
11.4
Gross operating surplus
14.7
18.0
22.0
23.6
22.8
22.4
22.2
Households and NPISH (% of GDP)
Net lending (+) or net borrowing (-)
6.3
3.6
0.5
2.5
2.6
0.8
0.3
Net financial assets
37.1
39.8
47.3
42.9
n.a
n.a
n.a
Gross wages and salaries
35.1
34.2
32.4
32.8
32.8
32.7
32.8
Net property income
5.6
5.4
3.5
3.0
2.8
2.5
2.2
Current transfers received
20.4
20.8
20.3
21.2
21.7
21.0
20.7
Gross saving
10.5
8.3
5.4
6.7
7.4
5.5
5.0
Rest of the world (% of GDP)
Net lending (+) or net borrowing (-)
-2.3
-3.1
-2.8
-1.0
-1.1
-1.0
-1.3
Net financial assets
27.5
38.4
53.9
64.8
n.a
n.a
n.a
Net exports of goods and services
-2.8
-3.7
-2.3
0.1
-0.8
-1.7
-1.5
Net primary income from the rest of the world
-0.8
-0.9
-2.5
-3.5
-3.7
-3.8
-4.0
Net capital transactions
0.1
0.0
0.7
1.2
2.0
3.0
2.8
Tradable sector
52.4
49.8
48.8
48.8
49.0
n.a
n.a
Non tradable sector
35.9
38.9
38.9
40.0
39.2
n.a
n.a
of which: Building and construction sector
6.5
5.8
5.9
6.5
6.1
n.a
n.a
Real effective exchange rate (index, 2000=100)
93.8
98.4
99.6
89.2
96.6
99.5
101.7
Terms of trade goods and services (index, 2000=100)
106.9
100.1
103.7
106.7
105.1
103.7
104.3
Market performance of exports (index, 2000=100)
92.7
107.5
127.6
144.5
143.3
145.0
146.8
Commission services' spring 2011 forecast
Notes:
2
The indicator on domestic demand includes stocks.
3
Unemp loyed p ersons are all p ersons who were not emp loyed, had actively sought work and were ready to begin working immediately or within
two weeks. The labour force is the total number of p eople employ ed and unemploy ed. The unemp loyment rate covers the age group 15-74.
Source :
1
The outp ut gap constitutes the gap between the actual and p otential gross domestic product at 2000 market p rices.

17
Table II. Macro economic scenario for the budgetary projections
2013
2014
COM
CP
COM
CP
COM
CP
CP
CP
Real GDP (% change)
3.8
3.8
4.0
4.0
3.7
4.0
3.7
3.9
Private consumption (% change)
3.2
3.2
3.3
3.2
3.7
3.9
3.6
3.8
Gross fixed capital formation (% change)
-2.0
-2.0
9.7
9.9
7.0
7.1
4.5
5.1
Exports of goods and services (% change)
10.2
10.2
7.7
8.5
7.6
8.5
8.0
7.1
Imports of goods and services (% change)
10.7
10.7
8.5
9.5
7.5
8.5
7.4
6.7
Contributions to real GDP growth:
- Final domestic demand
2.2
4.0
4.2
4.6
3.8
4.1
3.6
3.8
- Change in inventories
1.8
1.9
0.2
0.2
0.0
0.1
0.0
0.0
- Net exports
-0.2
-0.3
-0.4
-0.6
-0.1
-0.2
0.1
0.0
Output gap
1
-1.1
-1.0
-1.2
-1.0
-1.4
-1.0
-1.1
-1.0
Employment (% change)
0.4
0.6
1.1
1.6
1.0
1.2
0.7
0.4
Unemployment rate (%)
9.6
9.7
9.3
9.4
8.8
8.8
8.5
8.4
Labour productivity (% change)
3.4
3.2
2.9
2.3
2.7
2.8
3.0
3.4
HICP inflation (%)
2.7
2.7
3.8
3.5
3.2
2.8
2.5
2.5
GDP deflator (% change)
1.3
1.3
3.3
3.3
3.3
2.6
2.5
2.5
Comp. of employees (per head, % change)
4.7
5.6
5.9
6.8
6.3
5.8
5.7
6.1
Net lending/borrowing vis-à-vis the rest of
the world (% of GDP)
-1.1
1.4
-1.0
1.3
-1.3
1.1
1.4
1.8
Note:
1
In percent of potential GDP, with p otential GDP growth according to the p rogramme as recalculated by Commission
services.
Source :
Commission services’ spring 2011 forecasts (COM); Convergence programme (CP).
2010
2011
2012

18
Table III. Composition of the budgetary adjustment
2010
2013
2014
Change:
2010-2014
COM
COM
CP
COM
CP
CP
CP
CP
Revenue
37.8
40.0
40.1
40.1
40.7
39.7
39.2
1.4
of which:
- Taxes on production and imports
13.5
14.0
13.9
14.0
14.1
13.9
13.4
-0.1
- Current taxes on income, wealth, etc.
6.9
7.1
7.3
7.4
7.6
8.0
8.3
1.4
- Social contributions
11.1
11.8
11.9
12.3
12.5
12.5
12.5
1.4
- Other (residual)
6.3
7.0
7.0
6.4
6.5
5.3
5.0
-1.3
Expenditure
45.7
45.8
45.7
43.7
43.7
42.2
41.2
-4.5
of which:
- Primary expenditure
43.0
43.0
42.9
41.0
40.9
39.5
38.6
-4.4
of which:
Compensation of employees
10.1
9.8
9.8
9.4
9.4
9.2
9.0
-1.1
Intermediate consumption
6.2
6.1
6.1
5.9
5.9
5.8
5.7
-0.5
Social payments
17.0
16.5
16.5
16.1
16.2
15.9
15.7
-1.3
Subsidies
0.5
0.5
0.5
0.5
0.5
0.5
0.5
0.0
Gross fixed capital formation
5.6
6.6
6.6
5.8
5.8
4.9
4.6
-1.0
Other (residual)
3.7
3.5
3.4
3.3
3.2
3.2
3.1
-0.6
- Interest expenditure
2.7
2.8
2.8
2.7
2.8
2.7
2.6
-0.1
General government balance (GGB)
-7.9
-5.8
-5.6
-3.6
-2.9
-2.5
-2.0
5.9
Primary balance
-5.2
-3.0
-2.8
-0.9
-0.2
0.3
0.6
5.8
One-off and other temporary measures
0.0
0.0
0.0
0.0
0.0
0.0
0.0
0.0
GGB excl. one-offs
-7.9
-5.8
-5.6
-3.6
-2.9
-2.5
-2.0
5.9
Output gap
2
-1.1
-1.2
-1.0
-1.4
-1.0
-1.1
-1.0
0.1
Cyclically-adjusted balance
2
-7.4
-5.3
-5.2
-3.1
-2.5
-2.1
-1.6
5.8
Structural balance
3
-7.4
-5.3
-5.2
-3.1
-2.5
-2.1
-1.6
5.8
Change in structural balance
2.1
2.2
2.3
2.7
0.5
0.5
Structural primary balance
3
-4.7
-2.6
-2.4
-0.3
0.3
0.6
1.0
5.7
Change in structural primary balance
2.1
2.3
2.2
2.7
0.4
0.4
Notes:
1
On a no-policy-change basis.
2012
(% of GDP)
2011
2
Output gap (in % of potential GDP) and cyclically-adjusted balance according to the programme as recalculated by Commission
services on the basis of the information in the programme.
3
Structural (primary) balance = cyclically-adjusted (primary) balance excluding one-off and other temporary measures.
Source :
Convergence programme (CP); Commission services’ spring 2011 forecasts (COM); Commission services’ calculations

19
Table IV. Debt dynamics
2013
2014
COM
CP
COM
CP
CP
CP
Gross debt ratio
1
47.6
55.0
55.4
54.9
55.1
54.1
52.4
50.8
Change in the ratio
1.0
4.1
0.4
-0.2
-0.3
-0.8
-1.7
-1.6
Contributions
2
:
1. Primary balance
1.6
5.2
3.0
2.8
0.9
0.2
-0.3
-0.6
2. “Snow-ball” effect
-0.8
0.1
-0.9
-0.9
-0.9
-0.7
-0.3
-0.5
Of which:
Interest expenditure
2.5
2.7
2.8
2.8
2.7
2.7
2.8
2.6
Growth effect
-2.0
-1.8
-2.1
-2.1
-1.9
-2.1
-1.9
-1.9
Inflation effect
-1.3
-0.7
-1.6
-1.7
-1.7
-1.3
-1.2
-1.2
3. Stock-flow adjustment
0.3
-1.2
-1.7
-2.0
-0.3
-0.3
-1.0
-0.4
Of which:
Cash/accruals diff.
-0.2
-0.2
-0.2
-0.2
0.2
0.2
0.2
0.0
Acc. financial assets
0.5
-1.0
-1.5
-1.5
0.3
0.3
-0.8
-0.4
Privatisation
-0.3
-1.8
-0.5
-0.5
-0.3
-0.3
-0.1
-0.1
Val. effect & residual
0.0
0.0
-4.1
-4.1
-4.3
-4.3
-3.6
-3.3
1
End of period.
Convergence programme (CP); Commission services’ spring 2011 forecasts (COM); Commission services’
calculations
Notes:
2
The snow-ball effect captures the impact of interest expenditure on accumulated debt, as well as the impact of real
GDP growth and inflation on the debt ratio (through the denominator). The stock-flow adjustment includes
differences in cash and accrual accounting, accumulation of financial assets and valuation and other residual effects.
Source :
(% of GDP)
2010
2011
2012
average
2005-09
Table V. Long-term sustainability indicators
Poland
S1
S2
S1
S2
Value
6.1
6.0
-0.1
-0.1
of wh ich:
Initial budgetary position (IBP)
6.0
5.9
-0.1
-0.2
Debt requirement in 2060 (DR)
0.1
-
-0.1
-
Long-term change in the primary balance (LTC)
0.1
0.1
0.1
0.1
2010
2015
2020
2010
2015
2020
Debt as % of GDP
55.1
69.4
81.8
55.1
49.2
41.7
Baseline scenario (2010)
Programme scenario
Note:
The ‘baseline’ scenario (2010) depicts the sustainability gap under the assumption that the 2010 budgetary
position remains unchanged over the medium–term (until the end of the period covered by the programme). The
‘programme’ scenario depicts the sustainability gap under the assumption that the budgetary plans of the
programme are fully implemented.
20
Figure. Medium term debt projection
Table VI. Financial sector indicators
2006
2007
2008
2009
2010
Total assets of the banking sector (% of GDP)
64.1
67.5
74.8
82.9
84.1
Share of assets of the five largest banks (% of total assets)
46.1
46.6
44.2
43.9
…
Foreign ownership of banking system (% of total assets)
69.0
71.2
71.8
67.6
…
Financial soundness indicators:
- non-performing loans (% of total loans)
7.4
5.2
4.5
8.0
8.8
- capital adequacy ratio (%)
1)
13.2
12.0
11.2
13.3
13.8
- profitability - return on equity (%)
2)
22.2
24.9
20.5
10.4
12.7
Private credit growth (annual % change)
19.5
35.3
40.5
0.6
14.2
Residential property prices (y-o-y % change)
Exposure to countries receiving/repaying official financial assistance (% of GDP)
3)
…
…
…
…
…
Private debt (% of GDP)
35.1
43.5
43.7
54.9
54.7
Gross external debt (% of GDP)
- Public
19.3
17.6
14.1
19.1
22.9
- Private
22.2
23.9
24.4
27.9
26.5
Long term interest rates spread versus Bund (basis points)*
146.9
126.8
208.8
289.8
303.8
Credit default swap spreads for sovereign securities (5-year)*
…
…
226.0
190.8
129.6
* M easured in basis p oints.
Notes:
1)
The capital adequacy ratio is defined as total capital devided by risk weigthed assets.
2)
Net income to equity ratio. After extraordinary items and taxes. Accumulated income of the last 12 months. Tier 1 cap ital. Branches of
foreign banks are excluded.
3)
Covered countries are IE, EL, PT, RO, LV and HU.
Source :
Bank for International Settlements and Eurostat (exposure to macro-financially vulnerable countries), IMF (financial soundness indicators),
Commission services (long-term interest rates), World Bank (gross external debt) and ECB (all other indicators).

21
Table VII. Labour market and social indicators
Labour market indicators
2005
2006
2007
2008
2009
2010
Employment rate
(% of population aged 20 - 64)
58.3
60.1
62.7
65.0
64.9
64.6
Employment growth
(% change from previous year)
2.2
3.2
4.4
3.8
0.3
0.4
Employment rate of women
(% of female population aged 20 - 64)
51.7
53.1
55.5
57.3
57.6
57.7
Employment rate of men
(% of male population aged 20 - 64)
65.1
67.3
70.2
73.0
72.6
71.6
Employment rate of older workers
(% of population aged 55 - 64)
27.2
28.1
29.7
31.6
32.3
34.0
Part-time employment (% of total employment)
10.8
9.8
9.2
8.5
8.4
8.3
Fixed term employment
(% of employees with a fixed term contract)
25.7
27.3
28.2
27.0
26.5
27.3
Unemployment rate
1
(% of labour force)
17.8
13.9
9.6
7.1
8.2
9.6
Long-term unemployment
2
(% of labour force)
10.3
7.8
4.9
2.4
2.5
3.0
Youth unemployment rate
(% of youth labour force aged 15-24)
36.9
29.8
21.7
17.3
20.6
23.7
Youth NEET
3
rate (% of population aged 15-24)
13.9
12.6
10.6
9.0
10.1
:
Early leavers from education and training (% of
pop. 18-24 with at most lower sec. educ. and not
in further education or training)
5.3
5.4
5.0
5.0
5.3
:
Tertiary educational attainment (% of population
30-34 having successfully completed tertiary
education)
22.7
24.7
27.0
29.7
32.8
:
Labour productivity per person employed
(annual % change )
1.4
2.9
2.3
1.3
1.3
3.4
Hours worked per person employed (annual %
change)
-0.2
0.0
0.0
-0.4
-2.2
2.1
Labour productivity per hour worked (annual %
change; constant prices)
1.5
2.9
2.3
1.7
3.6
1.3
Compensation per employee (annual % change;
constant prices)
-0.9
0.3
0.9
5.7
-0.7
3.4
Nominal unit labour cost growth (annual %
change)
0.3
-1.1
2.6
7.5
1.6
0.6
Real unit labour cost growth (annual % change)
-2.3
-2.5
-1.3
4.3
-2.0
-0.6
Sources:
Comission services (EU Labour Force Survey and European National Accounts)
Notes:
1
According to ILO definition, age group 15-74)
2
Share of persons in the labour force who have been unemployed for at least 12 months.
3
NEET are persons that are neither in employment nor in any education or training.

22
Table VII. Labour market and social indicators (continued)
Expenditure on social protection
benefits (% of GDP)
2004
2005
2006
2007
2008
Sickness/Health care
3.81
3.81
3.84
3.93
4.45
Invalidity
2.25
2.05
1.88
1.70
1.60
Old age and survivors
11.74
11.42
11.52
10.71
10.85
Family/Children
0.89
0.84
0.82
0.79
0.73
Unemployment
0.67
0.63
0.57
0.40
0.35
Housing and Social exclusion n.e.c.
0.30
0.48
0.33
0.26
0.22
Total
19.7
19.2
19.0
17.8
18.2
of which: Means tested benefits
1.02
1.23
0.99
0.90
0.78
Social inclusion indicators
2005
2006
2007
2008
2009
Risk-of-poverty or exclusion
1
(% of total
population)
45.3
39.5
34.4
30.5
27.8
Risk-of-poverty or exclusion of children (% of
people aged 0-17)
48.0
42.0
37.1
32.9
31.0
Risk-of-poverty or exclusion of elderly (% of
people aged 65+)
39.3
32.5
27.3
26.9
25.8
At-Risk-of-Poverty rate
2
(% of total population)
20.5
19.1
17.3
16.9
17.1
Value of relative poverty threshold (single HH
per year) - in PPS
2856
3060
3360
4044
4428
Severe Material Deprivation
3
(% of total
population)
33.8
27.6
22.3
17.7
15.0
Share of people living in low work intensity
households
4
(% of people aged 0-59 not
student)
14.2
12.3
10.0
7.9
6.9
In-work at-risk-of poverty rate (% of persons
employed)
13.8
12.8
11.7
11.5
11.0
2
At-risk-of poverty rate: share of people with an equivalised disposable income below 60% of the national
equivalised median income.
Sources:
For expenditure for social protection benefits ESSPROS; for social inclusion EU-SILC.
4
People living in households with very low work intensity: Share of people aged 0-59 living in households
where the adults work less than 20% of their total work-time potential during the previous 12 months.
3
Share of people who experience at least 4 out of 9 deprivations: people cannot afford to i) pay their rent or
utility bills, ii) keep their home adequately warm, iii) face unexpected expenses, iv) eat meat, fish, or a protein
equivalent every second day, v) enjoy a week of holiday away from home once a year, vi) have a car, vii) have
a washing machine, viii) have a colour tv, or ix) have a telephone
Notes:
1
People at-risk-of poverty or social exclusion (AROPE): individuals who are at-risk-of poverty (AROP)
and/or suffering from severe material deprivation (SM D) and/or living in household with zero or very low
work intensity (LWI).

23
Table VIII. Product market performance and policy indicators
Performance indicators
2001-
2005
2006
2007
2008
2009
2010
Labour productivity
1
total economy (annual
growth in %)
4.3
2.6
2.2
1.3
1.4
n.a.
Labour productivity
1
in manufacturing (annual
growth in %)
4.9
10.2
7.0
4.0
1.7
n.a.
Labour productivity
1
in electricity, gas, water
(annual growth in %)
5.1
-7.2
3.2
-8.6
-5.5
n.a.
Labour productivity
1
in the construction sector
(annual growth in %)
-0.9
2.2
-3.2
-9.4
10.5
n.a.
Patent intensity in manufacturing
2
(patents of the
EPO divided by gross value added of the sector)
0.2
0.3
0.2
n.a.
n.a.
n.a.
Policy indicators
2001-
2005
2006
2007
2008
2009
2010
Enforcing contracts
3
(days)
n.a.
980
830
830
830
830
Time to start a business
3
(days)
n.a.
31
31
31
32
32
R&D expenditure (% of GDP)
0.6
0.6
0.6
0.6
0.6
n.a.
Tertiary educational attainment
(% of 30-34 years old population)
17.6
24.7
27.0
29.7
32.8
n.a.
Total public expenditure on education
(% of GDP)
5.4
5.3
4.9
n.a.
n.a.
n.a.
2003
2005
2006
2008
2009
2010
Product market regulation
4
, Overall
(Index; 0=not regulated; 6=most regulated)
3.0
n.a.
n.a.
2.3
n.a.
n.a.
Product market regulation
4
, Retail
(Index; 0=not regulated; 6=most regulated)
3.2
n.a.
n.a.
3.2
n.a.
n.a.
Product market regulation
4
, Network Industries6
(Index; 0=not regulated; 6=most regulated)
3.1
2.4
2.4
2.3*
n.a.
n.a.
4
The methodologies of the Product market regulation indicators are presented in detail at the website
http://www.oecd.org/document/1/0,3746,en_2649_34323_2367297_1_1_1_1,00.html
. The latest available product market
regulation indicators refer to 2003 and 2008, except for Network Industries.
Source :
Commission services, World Bank Doing Business (for enforcing contracts and time to start a business) and OECD (for the
product market regulation indicators).
6 Aggregate ET CR.
*figure for 2007.
Notes:
1
Labour productivity is defined as gross value added (in constant prices) divided by the number of persons employed.
2
Patent data refer to applications designated to the European Patent Office (EPO). They are counted according to the year in
which they were filed at the EPO. They are broken down according to the inventor's place of residence, using fractional
counting if multiple inventors or IPC classes are provided to avoid double counting.
3
The methodologies, including the assumptions, of this indicator is presented in detail at the website
http://www.doingbusiness.org/methodology
.
Wyszukiwarka
Podobne podstrony:
From Lisbon to Europe 2020 report
Europejski Commission
Hitchhiking In Europe Conversation
Andrew Garrett Convergence in the formation of Indo European subgroups
CSBA6235 (EDS Europe Report)v2 web
CIA Terrorism Reports 9 11 Commish Interview
Report of the Independent International Commission of Inquiry on the Syrian Arab Republic EN
EUROPEJSKA WSPÓLNOTA GOSPODARCZA
Unia Europejska 2
OPIEKA DLUGOTERMINOWA W KRAJACH UNII EUROPEJSKIEJ
download Prawo PrawoAW Prawo A W sem I rok akadem 2008 2009 Prezentacja prawo europejskie, A W ppt
europejski system energetyczny doc
Europejski Bank Centralny
LOBBING W UNII EUROPEJSKIEJ
więcej podobnych podstron