
1
45% by 2030
2030
Towards a truly sustainable energy system in the EU
45
%
by
e u r o p e a n r e n e w a b l e e n e r g y c o u n c i l

3
45% by 2030
authors of erec report “45% by 2030”:
Josche Muth (Deputy Secretary general, erec)
eleanor Smith (policy officer, erec)
Design and production: www.mardi.be
published in May 2011
Towards a truly sustainable energy system in the EU
45
%
by

Table of contents
The next step: Moving to 2030
5
01
Here to stay: Renewable energy 1997 to 2010
6
Energy for the Future – The 1997 White Paper
6
The 2001 Renewable Electricity Directive
7
The 2003 Biofuels Directive
8
The Missing Renewable Heating and Cooling Directive
8
Decarbonising the EU’s Energy Supply
9
Investing in Renewable Energy
9
02
A new decade of opportunity: Prospects for 2020
10
The 2009 Renewable Energy Directive
10
Member States’ Expectations for 2020
10
Decreasing Greenhouse Gas Emissions by 30%
12
Investing in Europe’s Energy Future
13
03
The way forward:
14
A binding renewable energy target for 2030
Renewable Energy up to 2030
16
Renewable Electricity up to 2030
16
Renewable Heating and Cooling up to 2030
16
Renewable Transport Fuels up to 2030
16
04
A binding 2030 target: Assessing the impact
18
Avoiding Emissions and Carbon Costs
18
Replacing Fossil Fuels – Increasing Energy Security
18
Costs and Competitiveness
19
Greening the Economy – Effects on Employment
20
05
Completing the picture: Additional policy measures
21
Less is More – An Ambitious Energy Savings Framework 21
Moving Beyond 20% – Strengthening the ETS
21
The Triangle for Success: RES – GHG - ES
22
06
References
24
Annex 1: Methodology
26
Annex 2: Breakdown of figures
27

5
45% by 2030
The next step:
Moving to 2030
Strong words demand strong actions. There is a far reaching agreement that
europe’s energy system must undergo radical change. This is seen as the key
element for fulfilling the european union’s commitment to reducing greenhouse gas
emissions by 80-95% by 2050 in order to avoid the most serious effects of climate
change for the well-being of our societies.
with today’s policies, however, the eu is set to fail meeting its long-term climate
ambition. The european commission estimates that a continuation of current
trends and policies would result in only a 40% reduction in greenhouse gas (gHg)
emissions by 2050. eu energy policy, building upon its 2020 targets, needs to be
geared up to reach significant greenhouse gas emissions reductions by 2050, while
increasing energy security and competitiveness for the benefit of european citizens.
renewable energy sources and energy savings are the most straightforward
means of both reducing emissions and improving security of energy supply. energy
related co
2
emissions have already been reduced by more than 20% against 1990
levels due to the deployment of renewable energy technologies. in addition, the
renewable energy industry is one of the fastest growing sectors, providing jobs and
bringing new technologies to the market, thereby helping to ensure that europe
maintains its technological leadership in global industrial innovation. However, the
eu is increasingly being globally challenged by new market players. in order to
keep its pole position, clear signals for investors are needed.
The decisions made today will determine the direction the energy sector will take in
the long-term. it has to be made clear that high-carbon investments are expensive,
and will remain so in the future. only then will markets be capable of triggering
the vital private investments (including capital intensive and long-term investments)
which are needed for a transition to a resource-efficient and renewable energy
system, not least in times of tight public budgets.
investors need a long-term perspective guided by an ambitious and stable policy
framework. Targets have proven to be one of the key elements for ensuring a
progressive development of the energy sector.
in 2004, the european renewable energy council (erec) called for a legally binding
eu target of 20% renewable energy by 2020, a claim which has been supported by
various stakeholders and finally enshrined in law with the 2009 renewable energy
Directive. now it is time to take the next step and lift up our ambitions for the post-
2020 decade.
erec calls on the european commission, Member States and the european
parliament to deliver on the european union’s long-term climate commitment by
proposing and endorsing a legally binding eu target of at least 45% renewable
energy by 2030.
Moreover, erec believes that the current energy policy needs to be enhanced by
setting a binding 20% energy savings target and a 30% domestic gHg reduction
target for 2020. This is the successful triangle for an 80%-95% gHg emission
reduced europe by 2050.
it is now high time to decide whether to opt for a polluting, fossil fuels dependent
energy pathway or one based on clean, sustainable, widespread and available
renewable energy sources. Strong goals demand strong targets.
6
45% by 2030
renewable energy has become more and more significant in the european energy
market and will, without a doubt, play a key role in the long-term. within less than
two decades, renewable energy has developed from an alternative energy source
in a niche market to one of the most important energy sources worldwide and a
driving force for a sustainable 21
st
century economy. renewable energy reduces
import dependency and diversifies energy sources, contributing to future economic
development in europe. Decisions that can help continue this economically and
environmentally important trend will depend on an understanding of what has
nurtured its growth so far.
Energy for the Future – The 1997 White Paper
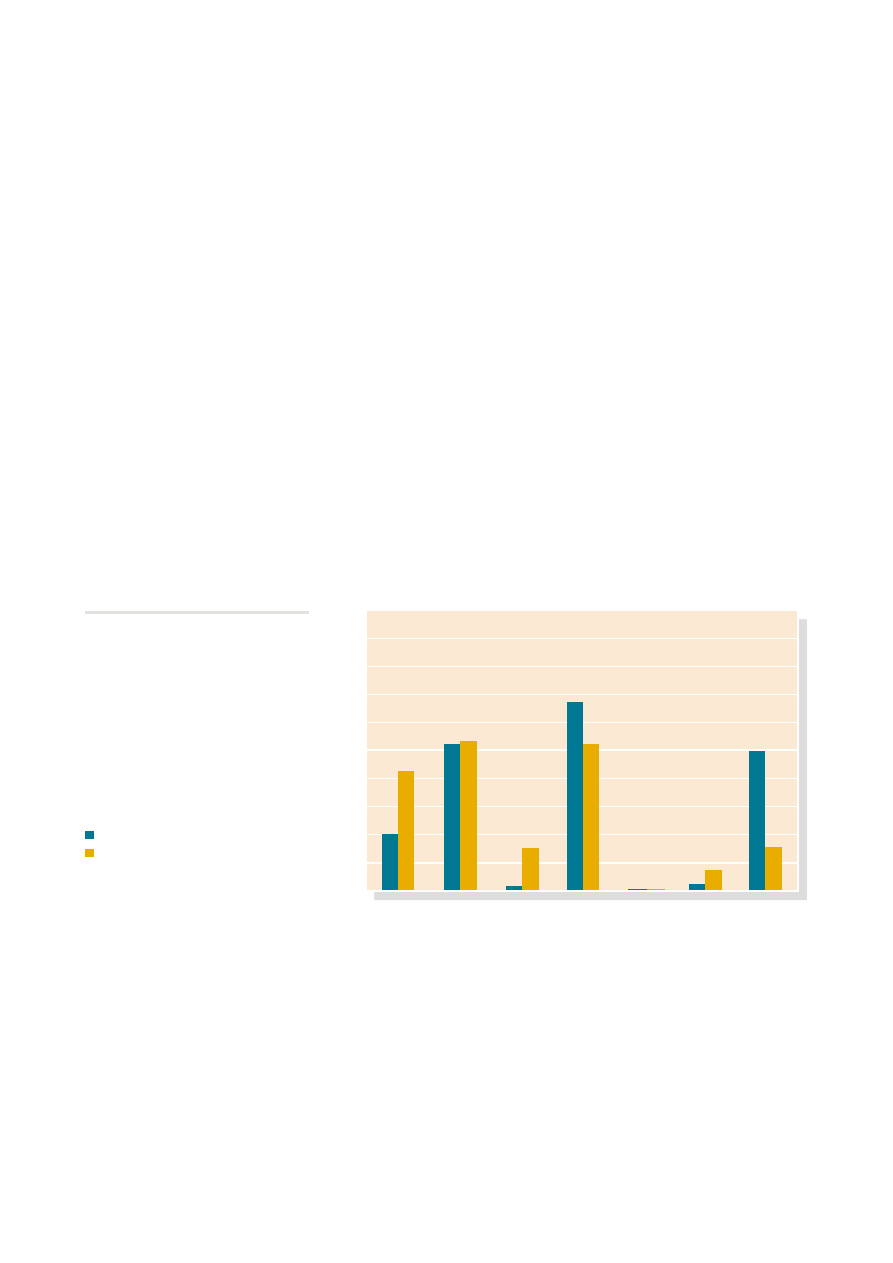
with its white paper on renewable Sources of energy in 1997, the european union
started working towards a target of a 12 % share of renewable energy by 2010
1
representing a doubling of the contribution from renewable energy compared with
1997. it included targets for the various renewable energy technologies for 2010.
2
in most cases these targets were already achieved or exceeded ahead of 2010.
photovoltaic electricity, for example, reached a cumulative installed capacity of almost
30 gw in the eu in 2010. This is more than nine times higher than the target foreseen
in the 1997 white paper. at the same time, geothermal heat exceeded three times
the projected installed capacity of 5 gwth, achieving about 15 gwth, while the wind
industry had already installed the 40 gw envisaged by the white paper in 2005, five
years ahead of the commission’s target. wind power’s cumulative installed capacity
accounted for 85 gw in 2010, more than double the white paper target.
The modest market development of renewable heating and cooling technologies
can be explained by the lack of dedicated european legislation and the absence of
clear and ambitious targets for the heating and cooling sector.
Here to stay:
Renewable energy
1997 to 2010
01
1
european commission (coM (97) 599):
Energy for the Future – Renewable Sources
of Energy. White paper for a Community
Strategy and Action Plan. 1997.
2
european commission (coM (97) 599):
Energy for the Future – Renewable Sources
of Energy. White paper for a Community
Strategy and Action Plan. 1997. Table 1 a.
Figure 1
Expected Installed Capacity
2010 and Actual Installed Capacity
for 2009/2010
Source: European Commission and EREC
White Paper Projection 2010
Capacity in 2009/2010
0
20
40
60
80
100
120
140
160
180
200
WIND
(GW)
HYDRO
(GW)
PV
(GW)
Bioenergy
(Mtoe)
GT Electricity
(GWth)
GT Heat
(GWth)
ST Collectors
(million m
2
)
7
45% by 2030
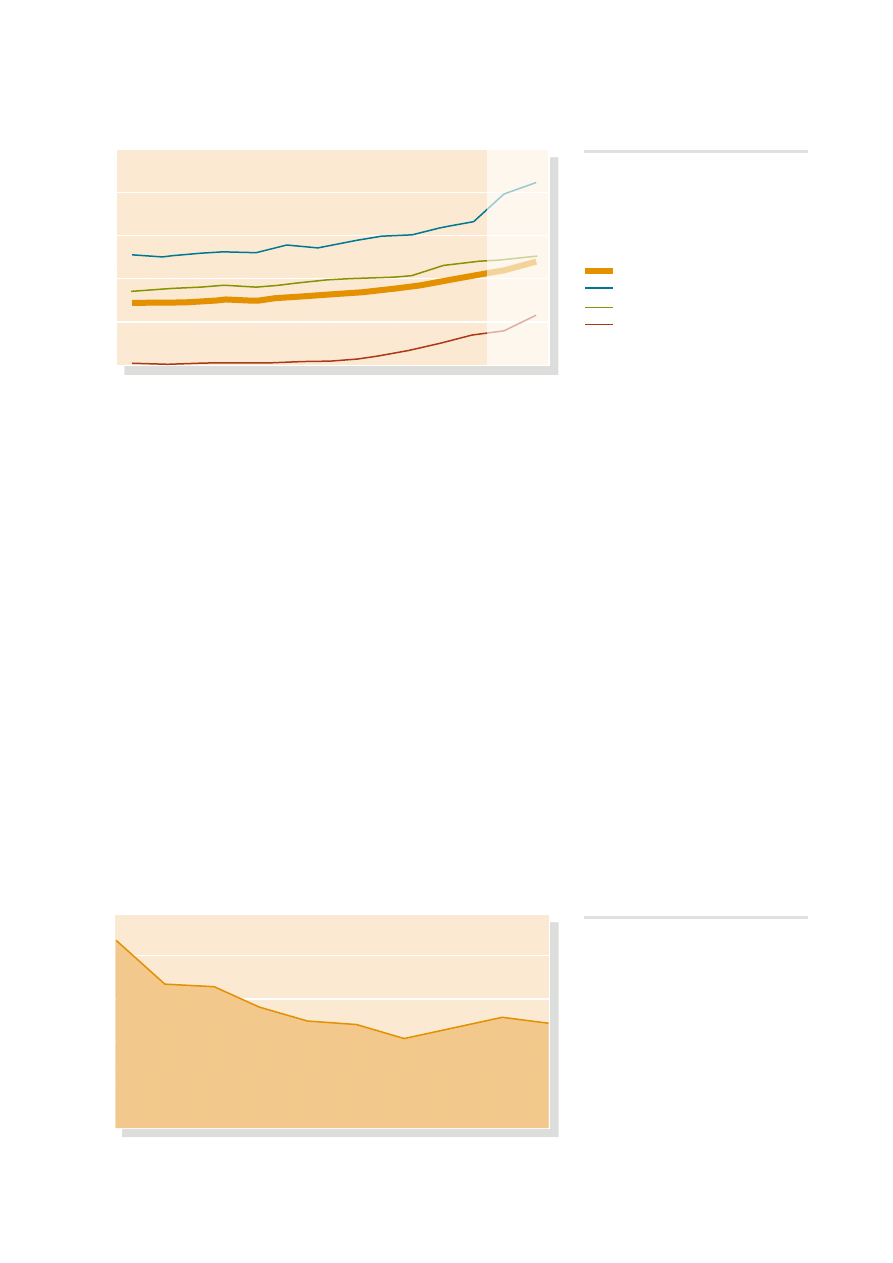
until 2010, the development of energy from renewable sources in the eu was mainly
driven by two key pieces of legislation: Directive 2001/77/ec on the promotion of
electricity from renewable energy
3
and the Directive 2003/30/ec on the promotion
of biofuels,
4
both setting ambitious national and eu targets for 2010.
The 2001 Renewable Electricity Directive
Following the 1997 white paper, the european union established the 2001
renewable electricity Directive, its first renewable energy legislation, leading to the
creation of stable policy frameworks and improving planning regimes and electricity
grid access for renewable energy in each Member State. The Directive set an
overall target to source 21 % of electricity from renewable sources by 2010.
5
each
eu country has a national indicative target for renewable electricity to contribute
towards this overall goal.
provisional data for 2009 show that renewable energy sources produced
about 19.9 % (608 Twh) of the eu’s total electricity consumption (3,042 Twh).
6
Hydropower contributed the largest share with 11.6 %, followed by wind energy
with 4.2 %, biomass with 3.5 %, and solar power with 0.4 %. This represents a
significant increase on 2008, when renewable power generation provided 16.6 %
(558 Twh) of gross electricity consumption (3357 Twh).
Furthermore, renewable power capacity is set to increase further moving towards a
situation where newly installed renewable energy electricity capacity is predominant.
new renewable energy power installations increased from just 1.3 gw in 1995
to 13.3 gw in 2008, and 17.3 gw in 2009. in 2010, more renewable electricity
capacity was installed in the eu than ever before: a record 22.7 gw.
Figure 2
New Installed Power Capacity per
Year 1995-2010 (MW)
3
european union: Directive 2001/77/EC
of the European Parliament and of the
Council of 27 September 2001 on the
promotion of electricity produced from
renewable energy sources in the internal
electricity market. 2001.
4
european union: Directive 2003/30/EC
of the European Parliament and of the
Council of 8 May 2003 on the promotion of
the use of biofuels or other renewable fuels
for transport. 2003.
5
The target was set in Directive 2001/77/ec
at 22.1 % and was realigned to 21 % when
the new Member States joined the eu.
6
european commission (Jrc): Renewable
Energy Snapshots 2010. 2010; European
Commission (Eurostat): Electricity Statistics
– Provisional Data for 2009. Data in Focus
14/2010.
55,000
60,000
35,000
50,000
30,000
15,000
45,000
25,000
10,000
40,000
20,000
5,000
0
2010
1996
1995
2009
1997
1998
1999
2000
2001
2002
2008
2007
2006
2005
2004
2003
Wind
PV
Large Hydro
Other RES
Other non RES
Nuclear
Coal
Natural Gas
Fuel Oil
Source: EWEA (2011)
MW
RES

8
45% by 2030
The 2003 Biofuels Directive
The transport sector relies on an unbroken and relatively cheap supply of oil for its
survival. 95 % of transport consumption is covered by petroleum products, mainly
petrol and diesel for land transport. biofuels are the only available large scale
substitute. given the precarious security of oil supply, in 2003 the eu adopted the
biofuels Directive, with the aim of boosting both the consumption and production
of biofuels.
The Directive established an indicative target of 5.75%, calculated on the basis
of energy content, of all petrol and diesel for transport purposes, for the share of
biofuels and other renewable fuels to be placed on the market by 31
st
December
2010, compared to a share of just 0.5% in 2003. biofuel consumption has
developed considerably over the last few years, triggered by the eu targets for
the share of biofuels in transport. in 2008 its share in transport was 3.5%, up from
2.6% in 2007. Four Member States – austria, germany, Slovakia and Sweden –
had already met the 2010 transport target in 2008, with France being certain to
join this group in 2009.
7
preliminary data for 2009 show that biofuels consumption
amounted to 12 Mtoe, representing a 4% biofuels share in transport.
8
The Missing Renewable Heating and Cooling Directive
Despite being the dominant energy sector, accounting for about 50% of the eu final
energy consumption, the growth in renewable heating and cooling has been less
rapid than in the other sectors. This can be explained by the absence until 2010
of any eu legislation to promote heating and cooling from renewable sources. The
12% white paper target did, however, create an implicit heating and cooling target
of 80 Mtoe in 2010, an increase from about 40 Mtoe in 1997.
9
The share of renewable heating and cooling in 2007 was 11.5 %, compared to
10.3 % in 2006. in 2008 heating and cooling from renewable sources accounted
for approximately 67 Mtoe, increasing its share further to 11.9 % of final heat
demand.
10
overall, the eu-27 progressed rapidly within one decade from a renewable energy
share of 6 % in 1997 to about 10 % in 2007. in 2009 preliminary data show a share
of renewable energy in final energy consumption of about 11 %. linear estimates
from the european commission see the overall renewable energy share in the eu
reaching 11.6 % in 2010 with further growth in all three sectors.
11
7
european commission (Sec (2011)
130 final): commission Staff working
Document. Recent progress in developing
renewable energy sources and technical
evaluation of the use of biofuels and other
renewable fuels in transport in accordance
with Article 3 of Directive 2001/77/EC and
Article 4(2) of Directive 2003/30/EC. 2011.
page 7.
8
eurobserv’er: Biofuels Barometer. 2010
9
based on the targets for electricity
(21% by 2010) and biofuels (5.75 % in
2010), renewable heating and cooling
would have to contribute 80 Mtoe in order
for the 12 % overall target to be met.
10
european commission (eurostat):
Renewable Energy Indicators. Data in
Focus 30/2010.
11
european commission (coM (2011)
31 final): Communication from the
Commission to the European Parliament
and the Council. Renewable Energy:
Progressing towards the 2020 target.
2011. page 3.
Figure 3
Energy Consumption for Heating (Mtoe)
RES-H&C
Total Final Heat Demand
Source: Eurostat
700
600
500
400
300
200
100
0
2006
2007
2008
Mtoe
9
45% by 2030
Decarbonising the EU’s Energy Supply
The steady increase of renewable energy was at the expense of fossil fuels.
The net gHg saving achieved by biofuels production and consumption in 2008,
for instance, are estimated to be 15 Mt co
2
to 17.4 Mt co
2
This translates into an
overall weighted gHg saving of 43 % to 49 % relative to fossil fuels replaced.
12
in
2010, the installed wind power capacity of 85 gw avoided 126 Mt co
2
emissions.
13
in total, the deployment of renewable energy avoided about 880 Mt of energy related
co
2
emissions in 2010.
14
This is equivalent to a total reduction of energy related
emissions of about 22 % against 1990 levels.
15
considering a carbon price of €20/t,
the additional total co
2
benefit can be calculated as being about €18 billion in 2010.
Investing in Renewable Energy
in the 2000-2010 decade, financial transactions – and hence investments – in
renewable energy rose strongly, amounting to €55 billion and €62 billion in 2008
and 2009 respectively.
16
in addition to the constant increase of renewable energy investments, a change in
financing patterns can be observed. while at the beginning of the decade, balance
sheet financing was clearly the dominant financial instrument, debts or loans have
become more prominent in recent years. From an investor’s and lender’s point
of view, that could be explained both by technological development and by the
strong political commitment of binding renewable energy targets, which has the
clear result of reducing risk.
Figure 4
Renewable Energy Share in Final
Energy Consumption 1997-2010 (%)
12
european commission (Sec (2011) 130 final):
Commission Staff Working Document.
Recent progress in developing renewable
energy sources and technical evaluation
of the use of biofuels and other renewable
fuels in transport in accordance with Article
3 of Directive 2001/77/EC and Article 4(2)
of Directive 2003/30/EC. 2011. page 29.
13
european wind energy association
(ewea): Pure Power. 2011. Forthcoming.
14
1 Twh of renewable electricity avoids
about 0.696 Mt co
2
, while 1 Mtoe of
renewable heating avoids about 8 Mt co
2
and 1 Mtoe of biofuels 1.5 Mt co
2
15
by 1990, eu-27 energy related co
2
emissions were in the order of 4030.6 Mt
– see european commission: EU Energy
Trends to 2030 – Update 2009. 2010.
16
Fraunhofer iSi et al.: Review report on
support schemes for renewable electricity
and heating in Europe. re-Shaping project.
D8 report. 2011. page 28.
% RES in FEC
% RES-E
% RES-H&C
% RES-T
1997 1998 1999 2000 2001 2002
2010
2009
2008
2007
2006
2005
2004
2003
25%
20%
15%
10%
5%
0%
Source: 1997-2008 Eurostat;
2009 preliminary data; 2010 EU targets
Figure 5
Average Equity-debt Ratio of
Renewable Investments in the EU (%)*
* The equity-debt ratio is a financial ratio indicating
the relative proportion of shareholders’ equity and
debt used to finance a company’s assets.
2001
2002
2003
2004
2005
2006
2007
2008
2009
60%
50%
40%
30%
20%
10%
0%
2010
Source: Bloomberg New Energy Finance
and Fraunhofer ISI et al.
10
45% by 2030
A new decade of opportunity:
Prospects for 2020
02
The 2009 Renewable Energy Directive
The 2010-2020 decade started out with a groundbreaking and ambitious proposal:
legally binding targets for renewable energy across the eu. on 5
th
June 2009, the
Directive on the promotion of the use of energy from renewable sources
17
entered into
force and had to be transposed into national law by December 2010. The Directive
covers energy consumption as a whole, including heating and cooling, and lays down
legally binding national targets, to ensure that the eu achieves a share of at least
20% renewable energy by 2020. it also contains a much reinforced set of provisions
to facilitate the development of renewable energy, such as a legal requirement for the
Member States to prepare national renewable energy action plans (nreaps).
The review of Member States’ nreaps shows that the approach continues to pay
off. a comprehensive and binding regulatory framework is proving catalytic in driving
forward renewable energy development to achieve the ambitious climate and energy
targets that the eu has set itself. Member States’ projections show that renewable
energy will grow at an even faster pace in the years up to 2020 than in the past.
18
Member States’ Expectations for 2020
according to the 27 plans that Member States submitted to the european
commission in 2010,
19
the eu will exceed its target of 20% renewable energy.
Total renewable energy consumption will more than double from 96 Mtoe in 2005
to about 245 Mtoe in 2020. This represents a 20.7% share of renewable energy in
2020 final energy consumption.
Figure 6
Member Sates’ NREAPs projections
for 2020
17
european union: Directive 2009/28/EC
of the European Parliament and of the
Council of 23 April 2009 on the promotion
of the use of energy from renewable
sources and amending and subsequently
repealing Directives 2001/77/EC and
2003/30/EC. 2009
18
For a comprehensive analysis of national
renewable energy action plans: european
renewable energy council (erec):
Mapping Renewable Energy Pathways
towards 2020. EU Roadmap. 2011
Countries meeting their 2020 targets
Overachieving countries
Underachieving countries
Source: EREC based on NREAPs
19
The national renewable energy action
plans can be found on the commission’s
transparency platform:
http://ec.europa.eu/energy/renewables/
transparency_platform/action_plan_en.htm
11
45% by 2030
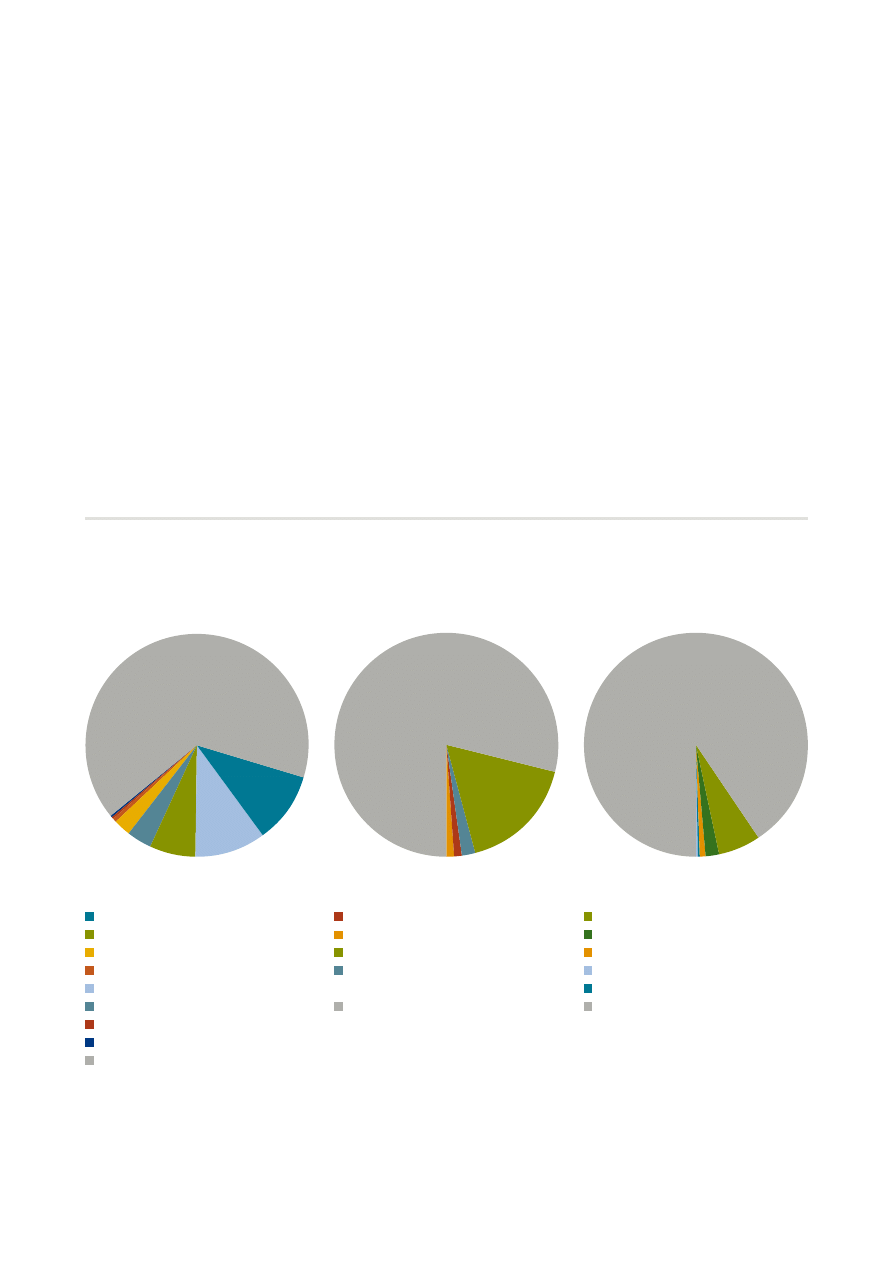
Renewable Electricity
based on Member States’ plans,
more than one third of the eu’s
electricity consumption will come from
renewable energy sources in 2020.
The share of renewable electricity will
increase from more than 14 % in 2005
to 34.3 % in 2020.
Renewable Heating and Cooling
More than one fifth of the eu’s heating
consumption in 2020 is expected
to come from renewable sources.
renewable heating and cooling is set
to increase from 10 % in 2005 to more
than 21 % in 2020.
Renewable Transport
The share of renewable energy in
transport is projected to reach 11.3 %
of diesel and gasoline consumption
in 2020, hence overtaking the binding
transport target of 10 %.
Figure 9
Renewable Energy Sources
in the Transport Mix in 2020
Biodiesel
Bioethanol/ETBE
RES-E (non road transport)
RES-E (road transport)
Others
Conventional Energy Sources
Figure 7
Renewable Energy Sources
in the Electricity Mix in 2020
Hydro
Bioelectricity
PV
CSP
Wind onshore
Wind offshore
Geothermal Electricity
Ocean
Conventional Energy Sources
Figure 8
Renewable Energy Sources
in the Heating Mix in 2020
Geothermal
Solar Thermal
Bioheat
Aerothermal and Hydrothermal
Heat Pumps
Conventional Energy Sources
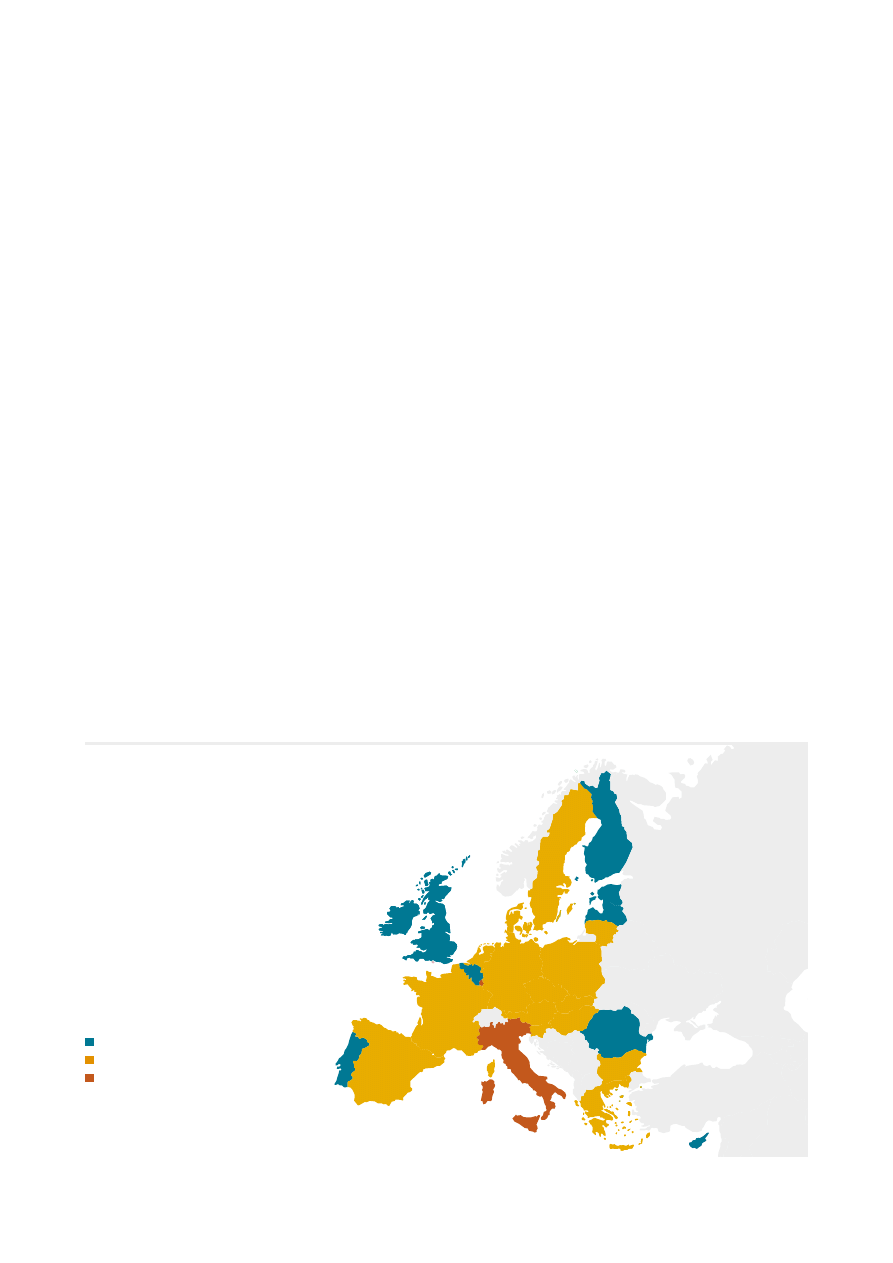
16 Member States expect to exceed their 2020 binding targets: austria, bulgaria,
the czech republic, Denmark, France, germany, greece, Hungary, lithuania,
Malta, the netherlands, poland, Slovenia, Slovakia, Spain and Sweden. 9 Member
States will meet their national binding targets, including belgium, Finland, and the
united Kingdom etc. only two Member States (italy and luxembourg) plan to
resort to cooperation Mechanisms to achieve their binding 2020 goals.
These predictions show that the vast majority of european countries clearly
understand the benefits of deploying renewable energy technologies.
Source: EREC based on NREAPs
65.7%
79%
91%
10.5%
10.2%
6.6%
17%
6%
2%
2%
0,1%
0,2%
3.8%
2%
1%
1%
2.4%
0.5%
0.3%
0.2%

12
45% by 2030
The Directive 2009/28/ec provides a strong and stable regulatory framework for
the development of renewable energy in europe. with the transposition of the
Directive by 5
th
December 2010 and the adoption of national renewable energy
action plans, the foundations for determined eu action on renewable energy have
been laid.
Decreasing Greenhouse Gas Emissions by 30%
besides the target of at least 20% renewable energy share by 2020, the eu made a
unilateral commitment of reducing greenhouse gas emissions to 20% below 1990
levels and to 30% in the event of an international climate agreement.
based on Member States’ nreaps, it is clear that renewable energy will provide a
significant part of the eu’s legally binding emissions reductions. renewable energy
deployment by 2020 will reduce energy related co
2
emissions by about 1,690 Mt,
which is equivalent to a reduction of energy related co
2
emissions of more than
40%. given that energy related co
2
emissions account for about 70% of total gHg
emissions today, this translates into an overall emissions reduction by 2020 of
more than 20%.
20
assuming a co
2
cost of €25/t, the additional total carbon benefit
would account for more than €42 billion in 2020.
it is currently being debated whether the eu should move unilaterally beyond 20% by
2020. erec believes that moving to 30% domestic gHg reduction is urgently needed.
in 2009 both the european parliament and the european council endorsed the
need to set an eu objective of reducing emissions by 80-95% by 2050 compared
to 1990 levels in order to keep climate change below 2°c.
21
The ipcc stated that
in order to avoid such a drastic rise in temperature industrialised countries need to
reduce domestic emissions by 25-40% by 2020.
22
even before the economic crisis,
2007 emissions were about 8% below 1990 levels. This represents approximately
all domestic action required with the 20% gHg target, as the rest of the reduction
can be met via cDM/Ji in developing countries.
23
Moving to 30% is hence not out
of reach.
20
This is in line with the findings of the
european commission’s low carbon
economy roadmap: See communication
from the Commission. A Roadmap for
moving to a competitive low carbon
economy in 2050. 2011. page 5 as well as
its communication from the commission.
Analysis of options to move beyond 20%
greenhouse gas reductions. 2010.
21
european parliament resolutions of 4
th
February 2009, 11
th
March 2009 and
25
th
november 2009; european council:
presidency conclusions 15265/1/09.
2009.
22
ipcc: 4
th
Assessment Report. AR4. 2007
23
The eTS allows for 50% of the target to
be met with cDM/Ji, while sectors outside
of the eTS currently can use offsets for
up to two thirds of the reduction: overall
roughly 60% offset across the eu economy
are possible.
€ Billion/year
90
80
70
60
50
40
30
20
10
0
%GDP
old 20%
new 20%
new 30%
0,6
0,5
0,4
0,3
0,2
0,1
0
70
48
81
0,45
0,32
0,54
Figure 10
Costs of a 30 % GHG Reduction Target
Costs (€ billion/year)
% GDP
Source: European Commission (2010)

13
45% by 2030
The incentives for renewable investments have reduced as a result of the significantly
lower than expected carbon price in the eu emissions Trading System (eTS).
Moving to a 30% reduction target would restore these incentives, urgently needed
to maintain the eu’s pole position in developing a resource-efficient and renewable
energy economy and to meeting its long-term gHg commitment by 2050.
24
Moreover, as underlined by the european commission, with its current policies the
eu is on track to meet the 20% gHg target. reaching 20% energy efficiency by
2020 would enable the eu to achieve a 25% domestic gHg reduction by 2020.
Such a reduction has been identified as being the cost-efficient pathway to meeting
the long-term gHg reduction commitment by 2050.
For all these reasons, erec firmly supports moving to a 30% domestic gHg
reduction target for 2020.
Investing in Europe’s Energy Future
while facing the largest economic crisis since the creation of the eu, Member
States are committed not only to meeting their binding targets by 2020, but even
to exceeding the eu’s overall target of 20% renewable energy.
Major effort and significant investments are a crucial requirement for the mass
deployment and roll out of current technologies, which are needed to reach the
eu 2020 targets, as well as developing and deploying advanced technologies for
a resource-efficient and renewable energy sector. For this reason it is essential that
there is a stable and predictable environment for the financing of renewable energy.
while it is clear that financing instruments both at european and national level need
to be further optimised and adjusted to follow the cost decrease of technologies,
any retroactive changes should be avoided.
25
otherwise, this could risk freezing
investments, that are vital to meeting the 2020 target and identified to be in the
order of about €60 to €70 billion annually.
26
25
See the letters on retroactive cuts in
solar tariffs, cosigned by commissioners
Hedegaard and oettinger, to the
authorities of Spain and czech republic on
22.02.2011 and 11.01.2011 respectively
(available on the web).
26
ecofys et al.: Financing Renewable Energy
in the European Union Energy Market.
2011. page 143-150.
24
european commission (coM(2011)
112 final): Communication from the
Commission. A Roadmap for moving to a
competitive low carbon economy in 2050.
2011. page 4-5
14
45% by 2030
A binding renewable
energy target for 2030
03
european and national renewable energy policies were founded on the need to
address climate change, improve the security of energy supply and develop
europe’s competitiveness as well as industrial and technological innovation. with
a binding renewable energy target of at least 20 % of final energy consumption by
2020, europe has embarked on a sustainable pathway. However, there is a need to
continue on this path and speed up the transformation of the eu’s energy system.
with current policies being projected to reduce emissions to -20 % in 2020, -30 %
in 2030 and around -40 % in 2050,
27
europe will clearly fail to meet the Heads of
State’s commitment of reducing gHg emissions by 80 %-95 % by 2050. Further
actions will be required to reach these emission levels.
The deployment of renewable energy technologies has already significantly
contributed to the reduction of energy related emissions and is one of the most
efficient and effective means of meeting the goal of the eu eTS: reducing emissions.
in order to ensure europe achieves its long-term emissions reduction ambitions,
policies promoting renewable energy must be extended. This will not only ensure
meeting emissions reduction targets, regardless of any shortcomings of the
eTS, but also stimulate further development of innovative solutions, create new
job opportunities, maintain europe’s first mover advantage in renewable energy
technologies, and unlock private investments, especially needed in times of short
public budgets.
28
if this is going to happen, it is important to ensure a stable and
progressive investment climate across the eu. investors need the right signals
today to make europe a resource-efficient and renewable energy economy by
2050. given that 2050 is only one investment cycle away,
29
clarity on the future
legislative framework is needed. otherwise the eu risks steering itself into a “lock-
in situation” with high-carbon investments and stranded cost in the associated
assets. climate and energy policies in the coming decade will therefore require
a combination of strong carbon pricing and reliable instruments that attract and
secure private investments.
27
european commission (coM(2011)
112 final): Communication from the
Commission. A Roadmap for moving to a
competitive low carbon economy in 2050.
2011.
28
european commission (Sec(2011)
288 final): impact assessment. a roadmap
for moving to a competitive low carbon
economy in 2050. 2011. page 95.
29
as the lifetime of, for instance, a coal
power plant is about 35-40 years.
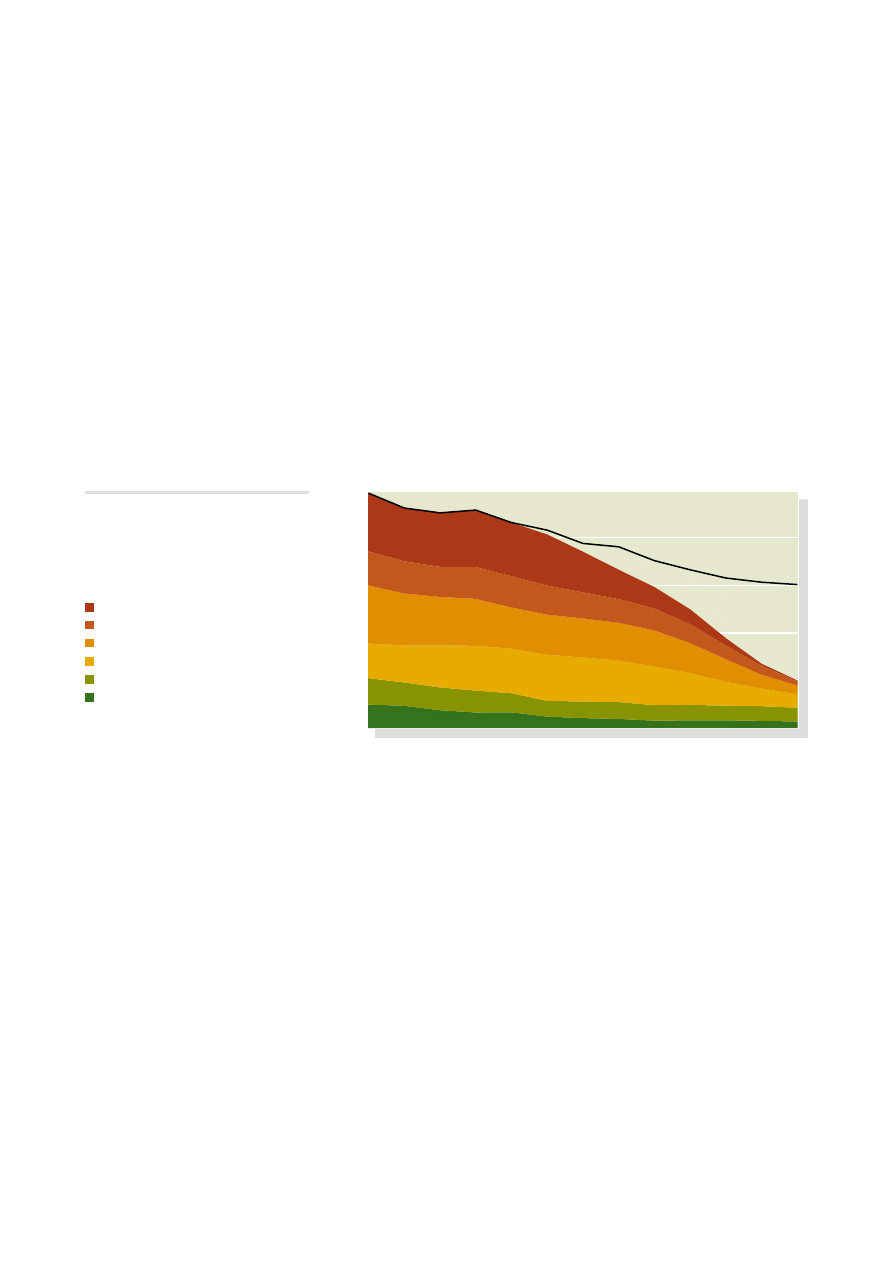
Figure 11
EU GHG emissions towards
an 80% domestic reduction
100%
80%
60%
40%
20%
0
1990
2000
2010
2020
2040
2050
2030
Source: European Commission (2011)
Power sector
Residential & Tertiary
Industry
Transport
Non CO
2
Agriculture
Non CO
2
others sectors
The way forward:
Current policy

15
45% by 2030
30
euractiv, 17
th
March 2011: “brussels
nuclear debate goes into meltdown”,
http://www.euractiv.com/en/climate-
environment/brussels-nuclear-debate-
goes-meltdown-news-503173
31
The guardian, 2
nd
May 2011: “connie
Hedegaard seeks renewable energy
targets for 2030”, http://www.guardian.
co.uk/environment/2011/may/02/connie-
hedegaard-renewable-targets-2030
32
For a detailed description of the
Methodology see annex 1.
in many sectors of the economy, targets are used to provide clarity and stability
to industry, to allow them to plan and invest with a higher degree of certainty.
providing targets at the european level augments this stabilising impact. eu policy
has the advantage of longer time horizons and avoiding the destabilising effects of
market volatilities and short-term domestic political changes.
The setting of legally binding national targets in the renewable energy Directive
(2009/28/ec) constitutes an important milestone for the development of a truly
sustainable europe. Such a move demonstrated that the european commission
had the mandate and the will to form directives tackling a sector that is extremely
sensitive at Member State level. The setting of these targets helps to attract
investments by providing stability and reducing market risks. This, in turn,
contributes to the further reduction of gHg emissions and to security of supply as
well as assuring the international competitiveness of the european industry.
europe does not have the time for a “trial and error” strategy, rather needing
to make use of policy instruments that have proven to generate the enabling
environment for investing in a truly sustainable economy: binding renewable energy
targets. a binding 2030 renewable energy target is thus increasingly supported
by key stakeholders, including the european commissioner for energy
30
and the
european commissioner for climate action.
31
based on a series of analytical steps, including various breakdowns between the
different energy sub-sectors and diverging energy demand assumptions,
32
erec
believes that a legally binding eu target of at least 45% of renewable energy
sources by 2030 is both feasible and desirable.
while the binding 2020 target has created the right framework conditions for
increasing the market up-take of renewable energy technologies, a binding 2030
target will enable europe to move towards a truly sustainable energy system.
16
45% by 2030
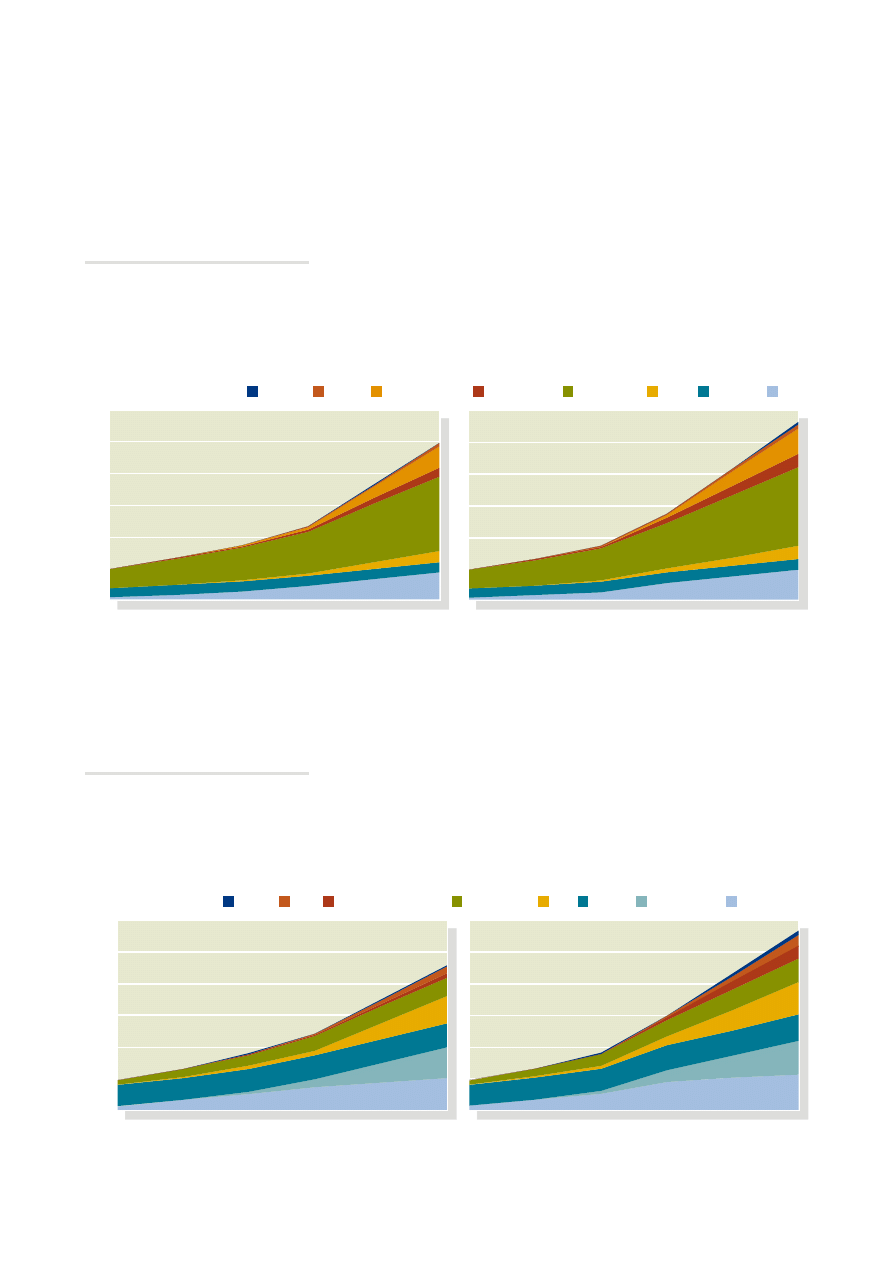
TWh
Renewable Electricity up to 2030
according to the “baseline Scenario”, 1,217 Twh of renewable electricity will be
produced in 2020, meeting 34% of eu electricity demand. This share will further
increase to 45% in 2025. with 2,296 Twh of electricity being produced in 2030,
renewable energy would thus account for about 57% of electricity demand.
Following the “advanced Scenario”, renewable electricity would satisfy 42% of
the eu’s power demand in 2020 with 1,490 Twh. by 2025 this share would be
about 55% with renewable electricity technologies producing 2,157 Twh. in 2030
renewable power would reach a share of 67%-69%, with more than 2,800 Twh.
Baseline Scenario
Advanced Scenario
3000
2000
2500
1500
1000
500
0
2005
2005
2010
2010
2015
2015
2020
2020
2025
2025
2030
2030
Figure 13
Development of Different Renewable
Electricity Technologies until 2030 (TWh)
Source: EREC
*excluding pumped storage
Renewable Energy up to 2030
according to erec’s “baseline Scenario”, renewable energy would meet more
than 20% of eu final energy demand in 2020 and 30% in 2025. by 2030 renewable
energy would account for 498.4 Mtoe, which represents a share of 42% of eu-27
final energy demand.
assuming erec’s “advanced Scenario” for the market uptake of the various
renewable energy technologies, renewable energy would satisfy 24 % of the
eu’s total energy demand in 2020, increasing further to 35 % in 2025. in 2030,
renewable energy would provide more than 570 Mtoe, achieving a share of 48 %.
Figure 12
Development of different renewable
energy technologies until 2030 (Mtoe)
Advanced Scenario
Baseline Scenario
Mtoe
600
500
400
300
200
100
0
2005
2010
2015
2020
2025
2030
2005
2010
2015
2020
2025
2030
Source: EREC
*excluding pumped storage
Ocean
CSP
Solar Thermal
Geothermal
Bioenergy
PV
Hydro*
Wind
Ocean
CSP
Geothermal Electricity
Bioelectricity
PV
Hydro*
Offshore Wind
Onshore Wind
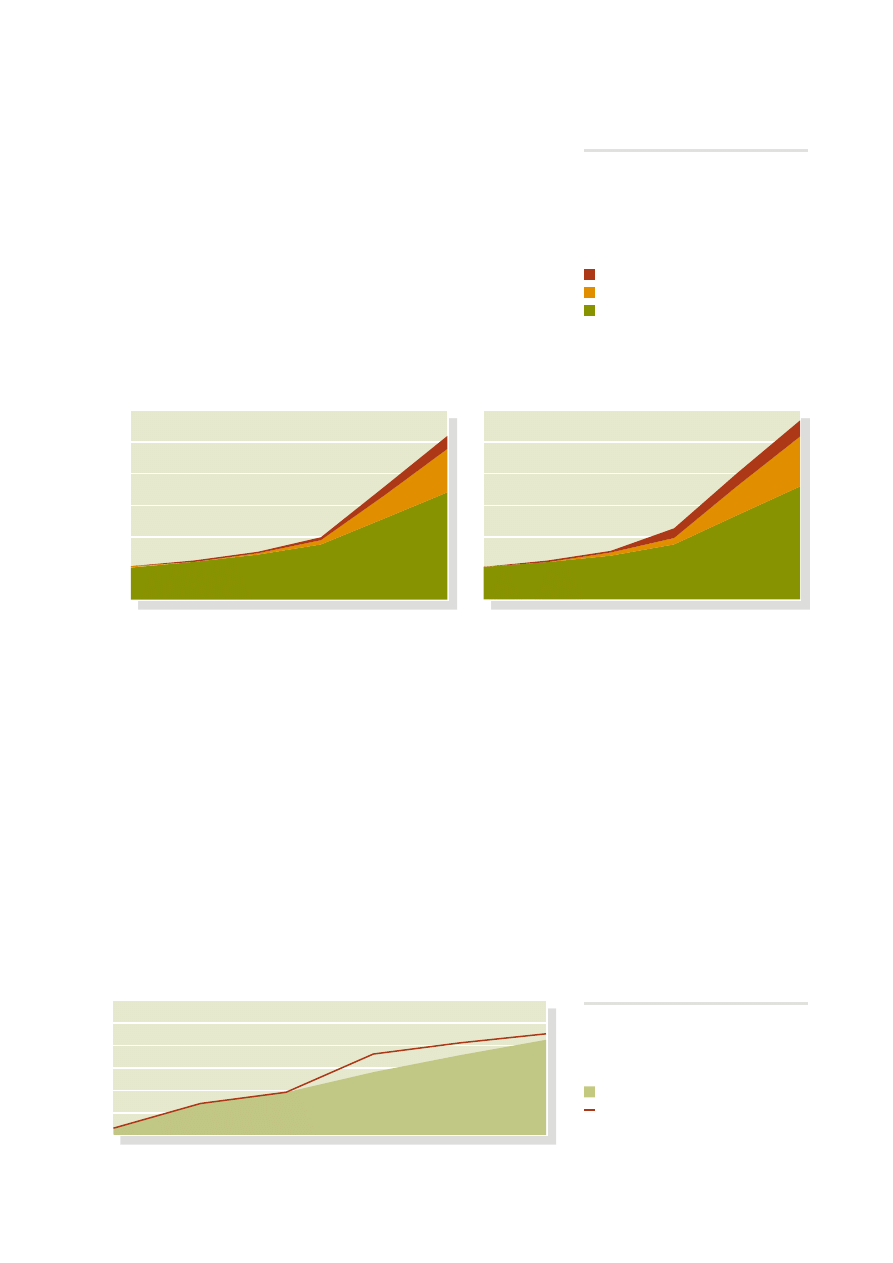
17
45% by 2030
Source: EREC
Source: EREC
Figure 14:
Development of Different Renewable
Heating Technologies until 2030 (Mtoe)
Baseline Scenario
Advanced Scenario
Geothermal
Solar Thermal
Bioheat
300
250
200
150
100
50
0
Mtoe
Mtoe
2005
2010
2015
2020
2025
2030
2005
2010
2015
2020
2025
2030
Renewable Heating and Cooling up to 2030
assuming the “baseline Scenario”, renewable heating technologies would produce
99.4 Mtoe in 2020, accounting for 19% of the eu’s heat demand. by 2025
renewable heating and cooling could reach 33%, covering almost half (47%-49%)
of the eu’s heat demand in 2030.
based on the “advanced Scenario”, 21.5% of the heat demand in the eu-27
would be satisfied by renewable energy, increasing further to 36% in 2025. in
2030, renewable heating and cooling would produce 284 Mtoe, thereby meeting
52%-54% of final heat demand.
2005
2010
2015
2020
2025
2030
60
50
40
30
20
10
0
Renewable Transport Fuels up to 2030
according to the “baseline Scenario”, renewable transport fuels (including
biodiesel, bioethanol and biogas) would account for 9% of transport fuel demand
by 2020 with 28 Mtoe. it has to be noted that this compares biofuels production
to transport fuel demand, excluding for instance renewable electricity used for
transport purposes. in 2025, biofuels would meet 11% of the eu’s transport fuel
demand and account for 13.6% in 2030.
Following the “advanced Scenario”, biofuels would satisfy 12% of the 2020
transport fuel demand, meeting 13% of the eu’s demand in 2025. with 45 Mtoe,
biofuels production would cover about 15% of the transport fuel demand in 2030.
regarding the transport sector in general, erec assumes an uptake of electric vehicles
(eVs) after 2020 and a steep increase after 2030. This is in line with the european
commission’s assumptions in which eVs reach a market share in new car sales of
1-2% in 2020 and 11-30% in 2030.
33
Member States projections (nreaps) show a
contribution of renewable electricity to road transport of about 450 ktoe in 2020.
Figure 15
Development of Renewable Transport
Fuels until 2030 (Mtoe)
Biofuels (baseline scenario)
Biofuels (advanced scenario)
33
european commission: Communication on
a European strategy on clean and efficient
vehicles. 2010.

18
45% by 2030
A binding 2030 target:
Assessing the impact
04
The impact in economic, social and environmental terms of achieving and
implementing a binding 2030 target for renewable energy is of course in part
predictable and measurable, as will be shown below, but it also comprises benefits
which remain unquantifiable, being more of a qualitative nature. These include the
revitalisation of industrial areas and social cohesion.
Avoiding Emissions and Carbon Costs
besides increasing the security of energy supply and improving the eu’s
industrial competitiveness, the deployment of renewable energy technologies
has significantly contributed to the reduction of energy related emissions. The
amount of co
2
emissions that can be avoided through the exploitation of the eu’s
renewable energy potential strongly depends on the way in which the renewable
source is converted into heat, electricity or transport fuels, and which fossil fuels
are replaced. The emissions avoided via the use of renewable energy sources are
calculated on the basis of specific co
2
emissions for conversion technologies.
34
in total, the deployment of renewable energy will avoid approximately 3,750-4,328
Mt of energy related co
2
emissions in 2030. This is equivalent to a total reduction
of energy related emissions of 93-100% against 1990 levels.
35
considering a
carbon price of €40/t,
36
the additional total co
2
benefit can be calculated to be in
the range of €150-€173 billion in 2030.
Replacing Fossil Fuels – Increasing Energy Security
Security of energy supply was the main driver of eu energy policy in the mid-1990s
in the move towards renewable energy.
37
This concern has further increased as has
the eu´s fossil fuel import dependency from 45% in 1997 to about 55% in 2008.
certainly, this dependency turns into a price risk as fossil fuels are globally traded
commodities. according to the european commission, these energy imports
represent an estimated €350 billion, which is equal to around €700 annually for
each and every eu citizen.
38
relying on natural sources for their “fuel”, one of the most attractive features of
renewable energy technologies is that their increased use contributes to enhanced
security of supply by decreasing fossil fuel dependency from third countries and
diversifying fuel consumption within the eu. The eu will strengthen its security of
supply if it sets a binding target of 45% renewable energy by 2030. The transition
to a resource-efficient and renewable energy economy will bring with it a reduced
european energy bill as well as a lower dependency on fossil fuel imports. one
way to sum up the benefits is to look at the quantity of fossil fuels displaced by
renewable energy. assuming the eu achieved a 45% share of renewable energy,
the annual reduction in fossil fuel demand can be calculated to be 556 Mtoe from
2030 onwards. This is equivalent to the total combined energy consumption of
belgium, germany, latvia, poland, the uK and Spain.
34
1 Twh of renewable electricity avoids
about 0.696 Mt co
2
, while 1 Mtoe of
renewable heating avoids about 8 Mt co
2
and 1 Mtoe of biofuels 1.5 Mt co
2
.
35
by 1990, eu-27 energy related co
2
emissions were in the order of 4030.6 Mt
– see european commission: EU Energy
Trends to 2030 – Update 2009. 2010.
36
The european commission’s “baseline
2009” assumes a carbon price of €39/t
in 2030, while the “reference Scenario”
suggests a price of €19/t in 2030. See
european commission: EU Energy Trends
to 2030 – Update 2009. 2010.
37
european commission (coM (97) 599):
Energy for the Future – Renewable Sources
of Energy. White paper for a Community
Strategy and Action Plan. 1997.
38
european commission (coM(2008)
781 final): Communication from the
Commission to the European Parliament,
the Council, the European Economic
and Social Committee and the Committee
of the Regions. Second Strategic Energy
Review. An EU Energy Security and
Solidarity Action Plan. 2008. page 2.

19
45% by 2030
The amount of fossil fuel costs avoided due to increased renewable energy
production depends on the price of energy. Today, oil and gas prices are very
closely linked, as is coal – to a lesser extent, and follow the price of oil. Therefore,
the fossil fuel costs avoided due to increased renewable energy production can
be calculated on the basis of the european commission’s price assumptions in its
“Trends to 2030”.
39
assuming an oil price of $106/barrel (€91/barrel), renewable energy will avoid fuel
costs of approximately €371 billion in 2030.
40
Hence, shifting towards a renewable
energy pathway leads to a massive shift from fuel costs to possible investment
expenditure.
Costs and Competitiveness
energy market price signals remain distorted in favour of non-renewable energy
sources,
41
in particular due to the continued failure to internalise external costs.
although external costs are partially internalised through the eu’s eTS, fiscal
instruments or support frameworks for renewable energy sources, current market
prices are still far from reflecting true cost.
as the european commission emphasises, striving to compete with incumbent
energy companies as well as technologies, and with fossil and nuclear energy
still receiving four times the level of subsidies, renewable energy is often more
expensive than traditional sources.
42
However, in contrast to fossil and nuclear energy, there has been a continued and
significant reduction in the cost of renewable energy over the last 20 years. This
trend will continue in the coming years, with a significant decrease in the generation
costs of a series of technologies.
nonetheless, a 45% binding target for renewable energy in the eu by 2030 will entail
additional investments. The size of these will depend on the degree of competition
in the market, the technology choices made and the mix of financial tools.
it is important to note, that a 10% increase in renewable energy share is estimated
to avoid gDp losses in the range of €20-36 billion in the eu (€34-62 billion for
oecD). These avoided losses offset one-fifth of the renewable energy investment
needs up to 2020 and half the oecD investment projected by a g-8 Task Force.
43
39
european commission: EU Energy Trends
to 2030 – Update 2009. 2010. page 16.
40
using a conversion factor of 1 tonne of oil
equivalent (toe) = 7.33 barrels.
41
european commission (co M(2006)
851 final): Communication from the
Commission. Inquiry pursuant to Article
17 of Regulation (EC) No 1/2003 into the
European gas and electricity sectors
(Final Report). 2007.
42
european commission (coM (2011)
31 final): Communication from the
Commission to the European Parliament
and the Council. Renewable Energy:
Progressing towards the 2020 target.
2011.
43
Shimon awerbuch, raphael Sauter:
Exploiting the oil–GDP effect to support
renewables deployment.
energy policy 34 (2006) 2805–2819. 2006.
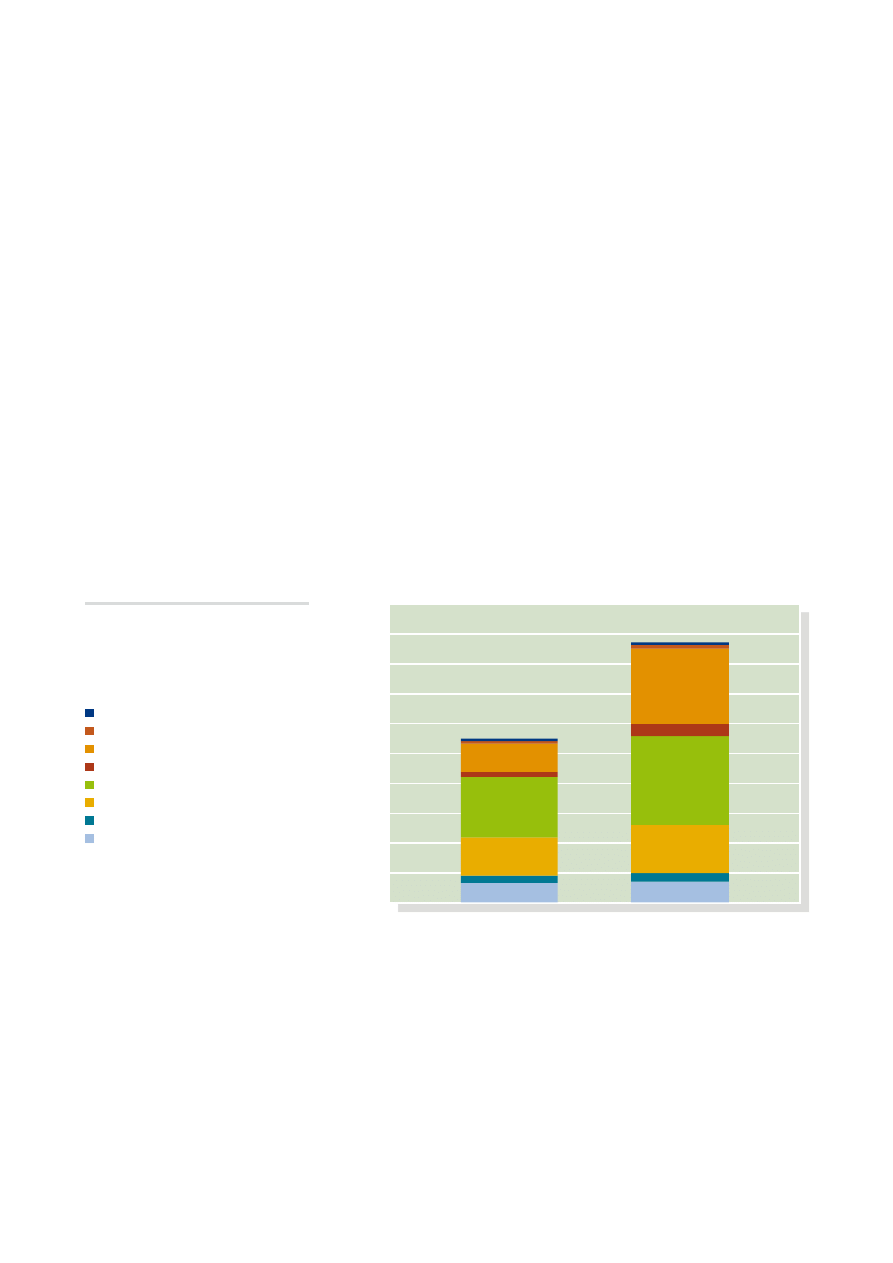
700
600
500
400
300
200
100
0
Figure 16
Additional cumulative capital
investments 2030 (€)
Biofuels
Geothermal
Solar Thermal
Bioheat
Ocean
CSP
Geothermal
Electricity
Bioelectricity
PV
Hydro
Wind
Source: EREC (2010)
€
20
45% by 2030
45
Joint research centre (Jrc)
working paper: Biofuels in the European
Context: facts, uncertainties
and recommendations. 2007
compared to the total cumulative renewable energy investments needed to
meeting the 2020 target, additional cumulative capital requirements are about
€660 billion to 2030.
44
This would result in an additional average annual investment
of approximately €66 billion.
The renewable energy industry will be one of the key growth sectors of the future
and provide a competitive advantage for a wide range of manufacturing industries.
in a world that is increasingly moving towards a resource-efficient and renewable
energy economy, the widespread deployment of renewable energy technologies is
considered as one of the key domains of future job creation.
Greening the Economy – Effects on Employment
investment in renewable energy helps the economy by reducing energy costs,
easing the over-use of precious natural resources and increasing employment in the
energy sector. From a societal perspective, the renewable energy industry offers a
variety of high-quality jobs in very different technologies, bringing an immeasurable
benefit by encouraging a motivated and skilled workforce.
according to the european commission’s Joint research centre (Jrc), achieving,
the eu’s 2020 10% renewable transport fuel target, for instance, would create
additional employment estimated at €1.8 billion in distributed salaries over the
2007- 2020 period.
45
Figure 17
Gross Employment in the Renewable
Energy Sector
5000000
4500000
4000000
3500000
3000000
2500000
2000000
1500000
1000000
500000
0
Employees
2020
2030
Source: EREC (2010)
Ocean
CSP
Solar Thermal
Geothermal
Bioenergy
PV
Hydro
Wind
44
For a detailed analysis, please see erec:
RE-thinking 2050. A 100 % Renewable
Energy Vision for the European Union.
2010.
considering that the target of 45% renewable energy in final energy consumption
in 2030 is met, this would provide gross employment of about 4.4 million in the
renewable energy sector – an annual average growth rate of about 6% on 2020
(2.7 million employees).
Facing the most serious economic crisis since its creation, the eu needs to create
new jobs as quickly as possible. beyond that time horizon, further efforts are
needed to secure the development of the european economy delivering high levels
of employment, prosperity, sustainability and international competitiveness.

21
45% by 2030
There are two major drawbacks of markets: they tend to discount future benefits
and long-term risks. legislation compensates for these two flaws, by providing a
clear framework. Setting an intermediary renewable energy target for 2030 would
allow the eu to progress in a cost-efficient, globally competitive pathway towards
its long-term ambitions, while serving as an intermediate check point between
2020 and 2050. in the absence of such a legally binding target, possible corrective
actions may be very costly and it may then even become impossible to achieve the
eu´s long-term energy and climate goals. erec therefore believes that stringent
policies on energy savings and gHg emissions are needed alongside a binding
target for renewable energy of at least 45 % in 2030.
Less is More – An Ambitious Energy Savings Framework
besides its 2020 targets of 20% gHg reduction and 20% renewable energy, the
eu has set itself a target of achieving 20% energy savings by 2020, as compared
to a business as usual energy use scenario. This target translates into an absolute
reduction of primary energy use from 1,840 Mtoe in 2005 to approximately 1,500
Mtoe in 2020. However, while the gHg and renewable energy targets are legally
binding, the energy savings target remains indicative.
recent findings of the european commission indicate that the energy savings
potential is not being realised and that with the rates of implementation of the
current policies in eu Member States, a reduction of only about 8.9% (-166 Mtoe)
will be achieved in 2020.
46
However, energy savings are fundamental in achieving
the long-term 80-95% gHg reduction target, as they have the potential to cover
at least half of it.
a binding energy savings target as well as an ambitious roadmap on how to
improve energy efficiency are needed to further advance to a resource-efficient
and renewable energy system.
Moving Beyond 20 % – Strengthening the ETS
The eu needs to move to a 30% domestic gHg reduction target by 2020. Science
clearly tells us that industrialised countries need to reduce domestic emissions
by 25-40% by 2020, in order to give the world a 50% chance of avoiding a 2°c
rise in temperature.
47
with its 20% reduction target, the eu is not in line with this
recommendation.
as has been shown in this report, renewable energy will provide a large part of the
eu’s emissions reduction efforts. energy related co
2
emissions will be reduced by
more than 40% by 2020, due to the deployment of renewable energy technologies,
enabling the eu to meet its 20% gHg reduction target by 2020.
Furthermore, investment needs related to the climate and energy package,
which in 2008 were estimated to be of at least €70 billion a year in 2020, have
been reduced. lower economic growth has reduced gHg emissions, effectively
reducing the stringency of the 20% gHg target and leading to a depression of the
carbon price. in addition, emission allowances not used for compliance in the eu
eTS due to the crisis are being carried forward into the 2013–2020 eTS trading
period, significantly lowering expected carbon prices in 2020.
Additional policy
measures
Completing the picture:
05
46
european commission
(Sec(2010)1346 final): Commission Staff
Working Document. State of play in the EU
energy policy. Energy 2020.
2010. pages 4-6.
47
ipcc: 4
th
Assessment Report. AR4. 2007.

22
45% by 2030
as a consequence, the effectiveness of the eTS has been clearly undermined as a
means of shifting the eu away from high-carbon fossil fuel investments. instead, it
has created vast windfall profits for heavy industry and led to cheap business-as-
usual solutions. This is well documented by the fact that in 2010 – for the first time
in years – more new coal power capacity was installed than decommissioned.
48
This will have serious negative consequences for europe’s emissions performance,
both regarding its 2020 ambition and the 80-95% gHg reduction objective
endorsed by the european parliament and the european council. To re-establish
the effectiveness of the eTS and to avoid oversupply on the carbon market
and hence a low price of carbon before 2020, the eu must raise the currently
established emission reduction target to 30% domestic reduction in 2020.
Moving to 30% emissions reductions is the most effective way to establish the high
carbon price, which is needed, alongside the binding 45% renewable energy target
for 2030 and a mandatory 2020 energy savings target, in the move to a resource-
efficient and renewable energy economy. erec therefore calls on all eu Member
States and the european parliament to agree on a 30% domestic gHg reduction
by 2020, putting the eu on a pathway to a maximum 2°c temperature increase.
The Triangle for Success: RES – GHG - ES
Figure 18:
Tomorrow’s energy policy
Source: EREC based on Ecofys/Fraunhofer
(2010)
Binding targets
Non-binding target
The eu has from the start been the cradle of renewable energy innovation. This
momentum needs to be kept. acting earlier rather than later would have significant
long-term benefits for europe’s competitiveness by maintaining a strong eu position
in a rapidly growing global market for renewable energy technologies. Furthermore,
it would put eu emissions onto a trajectory compatible with achieving our objective
of a 80-95% gHg reduction below 1990 levels by 2050.
erec believes that the eu needs to enhance and extend its current energy policy
by setting a legally binding eu target of at least 45% renewable energy in 2030.
This should be complemented by a binding 20% energy savings target and a 30%
domestic gHg reduction target for 2020. This is the successful triangle for an
80%-95% gHg emission reduced europe by 2050.
Today
Tomorrow
48
ewea:
Wind in Power. 2010 European Statistics.
2011. page 6.
RES
20%
RES
45%
GHG
-20%
GHG
-30%
Savings
20%
Savings
20%

23
45% by 2030

24
45% by 2030
References
Shimon Awerbuch, Raphael Sauter:
Exploiting the oil–GDP effect to support renewables deployment. Energy Policy
34 (2006) 2805–2819. 2006.
1997
EurActiv, 17
th
March 2011:
http://www.euractiv.com/en/climate-environment/brussels-nuclear-debate-goes-
meltdown-news-503173
2007
European Commission (COM (97) 599):
Energy for the Future – Renewable Sources of Energy.
White paper for a Community Strategy and Action Plan.
1997
European Commission (COM(2006) 851 final):
Communication from the Commission. Inquiry pursuant to Article 17 of
Regulation (EC) No 1/2003 into the European gas and electricity sectors (Final
Report).
2007
European Commission(COM(2008) 781 final):
Communication from the Commission to the European Parliament, the Council,
the European Economic and Social Committee and the Committee of the
Regions. Second Strategic Energy Review. An EU Energy Security and Solidarity
Action Plan.
2008
European Commission (COM(2010) 265 final):
Communication from the Commission. Analysis of options to move beyond 20%
greenhouse gas reductions.
2010
European Commission (SEC(2010)1346 final):
Commission Staff Working Document. State of play in the EU energy policy.
Energy 2020.
2010
European Commission:
Communication on a European strategy on clean and efficient vehicles.
2010
European Commission (Eurostat):
Electricity Statistics – Provisional Data for 2009.
Data in Focus 14/2010
European Commission (Eurostat):
Renewable Energy Indicators.
Data in Focus 30/2010
European Commission (JRC):
Renewable Energy Snapshots 2010.
2010
European Commission:
EU energy trends to 2030 – Update 2009.
2010
European Commission (COM (2011) 31 final):
Communication from the Commission to the European Parliament and the
Council. Renewable Energy: Progressing towards the 2020 target.
2011
European Commission (COM(2011) 112 final):
Communication from the Commission. A Roadmap for moving to a competitive
low carbon economy in 2050.
2011
06

25
45% by 2030
European Commission (SEC(2011) 130 final):
Commission Staff Working Document. Recent progress in developing renewable
energy sources and technical evaluation of the use of biofuels and other
renewable fuels in transport in accordance with Article 3 of Directive 2001/77/EC
and Article 4(2) of Directive 2003/30/EC.
2011
European Commission (SEC (2011) 131 final):
Commission Staff Working Document. Review of European and national financing
of renewable energy in accordance with Article 23(7) of Directive 2009/28/EC.
2011
European Council:
Presidency Conclusions 15265/1/09.
2009
Eurobserv’er:
Biofuels Barometer.
2010
European Renewable Energy Council (EREC):
RE-thinking 2050. A 100% Renewable Energy Vision for the European Union.
2010
European Renewable Energy Council (EREC):
Mapping Renewable Energy Pathways towards 2020. EU Roadmap.
2011
European Union:
Directive 2001/77/EC of the European Parliament and of the Council of 27
September 2001 on the promotion of electricity produced from renewable energy
sources in the internal electricity market.
2001
European Union:
Directive 2003/30/EC of the European Parliament and of the Council of 8
May 2003 on the promotion of the use of biofuels or other renewable fuels for
transport.
2003
European Union:
Directive 2009/28/EC of the European Parliament and of the Council of 23
April 2009 on the promotion of the use of energy from renewable sources and
amending and subsequently repealing Directives 2001/77/EC and 2003/30/EC.
2009
European Wind Energy Association (EWEA):
Wind in Power. 2010 European Statistics.
2011
European Wind Energy Association (EWEA):
Pure Power. 2011.
Forthcoming
Frauenhofer ISI et al.:
Review report on support schemes for renewable electricity and heating in
Europe. re-Shaping project. D8 report.
2011
IPCC:
4
th
Assessment Report. AR4.
2007
Joint Research Centre (JRC) Working Paper:
Biofuels in the European Context: facts, uncertainties and recommendations.
2007
The Guardian, 2
nd
May 2011:
“connie Hedegaard seeks renewable energy targets for 2030”, http://www.
guardian.co.uk/environment/2011/may/02/connie-hedegaard-renewable-
targets-2030

26
45% by 2030
Annex 1:
Methodology
The analysis of the future development of renewable energy sources is based on a
series of analytical steps. These include various breakdowns, into electricity, heating
and cooling and transport, applying diverging energy demand assumptions, and
taking as exogenous input eu Member States expectations on renewable energy
until 2020 as outlined in their national renewable energy action plans (nreaps).
energy demand assumptions, including those for electricity, heating and cooling,
and transport, are based on the european commission´s “eu energy Trends to
2030 – update 2009” providing for a “baseline 2009” and a “reference Scenario”.
The main difference between these two scenarios is that the “baseline 2009”
determines the development of the eu energy system under policies implemented
until april 2009, excluding the renewable energy target, while the “reference
Scenario” takes the 2009/28/ec Directive into account assuming that the
20% target would be met. in addition, we apply for 2020 the energy demand
assumptions of Member States national action plans (nreaps – Table 1).
contributions of the various technologies are based on two different scenarios:
a “baseline Scenario” and an “advanced Scenario”. The “baseline Scenario” is
determined by Member States projections up to 2020 (nreaps) and assumes a
continuation of the envisaged trends and market developments in the decade up to
2030. The rather conservative projections for several renewable energy technologies
as presented in the nreaps, however, might lead to major underestimations of the
technical and economic potential of those technologies and hence, result in fairly
low assumptions for 2030. The “advanced Scenario”, presented in this publication
is based on the eu industry roadmap projections for 2020, which was developed
in the framework of the repap2020 project.
49
Though this roadmap does not
fully reflect each of the different european renewable industries associations’ own
projections for 2020, it serves as point of reference for 2030 in the “advanced
Scenario”.
For the sake of consistency, the development of the various renewable energy
technologies between 2005 and 2015 is derived from the nreap statistics.
The main objective of this modelling exercise was not to discriminate between the
various technologies, but to have a clear and consistent eu-wide view of future
renewable energy development up to 2030.
49
renewable energy policy action – paving
the way towards 2020 (repap2020):
http://www.repap2020.eu/
27
45% by 2030
Annex 2:
Breakdown of figures
Table 1:
Contribution of Renewable Energy Technologies to Final Energy Demand
Source:
EREC
*excluding pumped storage
Mtoe
2005
2010
2015
2020
2020
2025
2025
2030
2030
Baseline
Advanced
Baseline
Advanced
Baseline
Advanced
Wind
6
14.7
25.8
42.5
55.1
64.2
75
86
95
Onshore
5.7
13.8
21.9
31
39
37.4
43.7
43.8
48.5
Offshore
0.2
0.86
3.9
11.5
16.1
26.8
31.3
42.1
46.5
Hydro*
29
29.8
30.6
31.8
34
32.5
33.9
33
34.2
PV
0.2
1.7
4.5
7.2
11.5
21.9
27.5
36.6
44
Bioenergy
60
82.2
103.8
134.5
145
184.5
200.5
236
255
Geothermal
1.1
2.4
4.1
7.5
17.5
17.6
30.1
28.4
42
Electricity
0.5
0.5
0.6
0.9
3.3
3.6
10.1
6.4
17
Heating
0.6
1.9
3.5
6.6
14.2
14
20
22
25
Solar Thermal
0.7
1.4
3
6.3
10.5
37
46
68
81
CSP
0
0.09
0.8
1.7
2.2
5
8.5
8.4
15
Ocean
0.09
0.09
0.8
0.5
0.7
1.3
3.4
2
6
Total RES
96
132.3
173.4
232
276.3
364
424.9
498.4
572.2
Final Energy
Demand
NREAPs
Scenario
1180
1180
Baseline
2009
1173
1169
1211
1229
1229
1227
1227
1216
1216
Reference
Scenario
1173
1169
1208
1216
1216
1204
1204
1189
1189
Total share
of RES (%)
8.5 %
11.3 %
14.3 %
19 - 20 % 23 - 24 %
30 %
35 %
41 - 42 % 47 - 48 %
28
45% by 2030
Table 2:
Contribution of Renewable Electricity Technologies to Electricity Demand
Source: EREC
*excluding pumped storage
TWh
2005
2010
2015
2020
2020
2025
2025
2030
2030
Baseline
Advanced
Baseline
Advanced
Baseline
Advanced
Wind
69
171
301
495
641
746
872
998
1105
Onshore
67
161
255
361
453
435
508
509
564
Offshore
2
10
46
134
188
312
364
489
541
Hydro*
337
346
356
370
393
378
395
384
398
PV
2
20
52
83
134
255
320
426
506
Bioelectricity
67
114
169
232
251
262
314
292
377
Geothermal
electricity
6
6
7
11
38
42
118
74
198
CSP
0
1
9
20
25
59
99
98
173
Ocean
1
1
9
6
8
15
39
24
70
Total RES-E
481
659
902
1217
1490
1757
2157
2296
2827
Electricity
Demand
NREAPs
Scenario
3538.6
3538.6
Baseline 2009
3274
3312
3554
3795
3795
4013
4013
4192
4192
Reference
Scenario
3274
3306
3531
3709
3709
3931
3931
4073
4073
Total share
of RES (%)
14.7 %
20 %
25 - 26 %
33 - 34 % 39 - 42 %
44 - 45 % 54 - 55 %
55 - 57 % 67 - 69 %
29
45% by 2030
Table 4:
Contribution of Biofuels to Transport Fuel Demand
Source: EREC
*excluding aviation and inland navigation
Mtoe
2005
2010
2015
2020
2020
2025
2025
2030
2030
Baseline
Advanced
Baseline
Advanced
Baseline
Advanced
Biofuels
2.9
13.6
19.1
28
36
35
40.5
42
45
Total RES Fuels
2.9
13.6
19.1
28
36
35
40.5
42
45
Transport
Fuel Demand*
NREAPs
Scenario
312
312
Baseline 2009
308
312.9
324.6
325.6
325.6
318.8
318.8
307.3
307.3
Reference
Scenario
308
312.9
323.8
323.1
323.1
319.5
319.5
309.8
309.8
Total share
of RES (%)
0.9%
4.3%
5.9%
8.6 - 9% 11.2 - 12%
11%
13%
13.6%
15%
Table 3:
Contribution of Renewable Heating Technologies to Heat Demand
Source: EREC
*excluding aerothermal and hydrothermal heat pumps
Mtoe
2005
2010
2015
2020
2020
2025
2025
2030
2030
Baseline
Advanced
Baseline
Advanced
Baseline
Advanced
Bioheat
51
58.8
70.2
86.5
87
127
133
169
178
Solar thermal
0.69
1.4
3
6.3
10.5
37
46
68
81
Geothermal
0.6
1.9
3.5
6.6
14.2
14
20
22
25
Total RES-H*
52.29
62.1
76.7
99.4
111.7
178
199
259
284
Heat
Demand
NREAPs
Scenario
520.4
520.4
Baseline 2009
579
571
581
577
577
563
563
548
548
Reference
Scenario
579
571
579
574
574
546
546
529
529
Total share
of RES (%)
9%
11%
13%
17 - 19%
21.5%
32 - 33% 35 - 36%
47 - 49% 52 - 54%
30
45% by 2030
Who is EREC?
erec is the united voice of the european renewable energy industry encompassing
all major industry, trade and research associations active in the field of photovoltaics,
small hydropower, solar thermal, bioenergy, ocean, geothermal, wind energy, and
solar thermal electricity. it now has 11 members, which in turn, comprise globally
active companies within their membership. erec represents an industry with an
annual turnover of more than €70 billion employing more than 550,000 people.
EREC’ members:
AEBIOM (european biomass association)
EGEC (european geothermal energy council)
EPIA (european photovoltaic industry association)
EREF (european renewable energies Federation)
ESHA (european Small Hydropower association)
ESTELA (european Solar Thermal electricity association)
ESTIF (european Solar Thermal industry Federation)
EUBIA (european biomass industry association)
EU-OEA (european ocean energy association)
EUREC Agency (european association of renewable energy research centres)
EWEA (european wind energy association)
Contact details of EREC
European Renewable Energy Council
Renewable Energy House
rue d’arlon 63-67 - b-1040 brussels, belgium
T: +32 2 546 1933 - F: +32 2 546 1934
e: erec@erec.org - i: www.erec.org


32
45% by 2030
design : www
.mar
di.be
p
rinted on r
ecycled paper containing 50% r
ecycled waste and 50% virgin fibr
e
and manufactur
ed at a mil certified with
iS
o
14001 envir
onmental management standar
d,
using vegetable ink.
www.erec.org
erec calls on the european commission,
Member States and the european parliament
to deliver on the european union’s long-
term climate commitment by proposing and
endorsing a legally binding eu target of at
least 45% renewable energy by 2030.
“
”
Wyszukiwarka
Podobne podstrony:
RMB to be global reserve currency by 2030 Xinhua
LEP BY TVN MED, Zestaw LEP - TVN MED - PEDIATRIA III, Zestaw LEP: Zestaw losowy (2008-03-29 14:45:57
45 Odpalać silniki! Fire up Your engines! by Kirk Lundbeck Feb 16 2013
24(45)RUP
BYT 109 D faza projektowania
8(45) Diagramy klas cz2
biochemia krwi 45
45 sekundowa prezentacja w 4 ro Nieznany (2)
2 (109)
plik (45)
45 49 (2)
4 pomiary by kbarzdo
dymano teoria by demon
I CSK 45 09 1
Dz U 1997 109 704 R S u ba bezpiecze stwa i higi 3
p19 109
więcej podobnych podstron