
MEASURING THE DYNAMIC DEFORMATION OF BRIDGES
USING A TOTAL STATION
Emily Cosser, Gethin W Roberts, Xiaolin Meng, Alan H Dodson
Institute of Engineering Surveying and Space Geodesy (IESSG), University of Nottingham
Abstract
It is well known that long term movements of structures can be monitored using a total station.
Measurements are taken over minutes, hours or weeks to a number of targets to measure
settlement or long term permanent deformations. At the University of Nottingham research is
concentrated on the dynamic deformation of structures, in particular bridges. Monitoring
equipment includes GPS, accelerometers, pseudolites and now total stations. A recent bridge trial
conducted by the authors on the Wilford Suspension Bridge in Nottingham included the use of a
servo driven Leica TCA2003 total station measuring angles and distances at a 1 Hz data rate. The
total station results are compared to the GPS data. Outlined in this paper are the results from
initial total station trials, including the bridge trial.
1. Introduction
Total stations have been used to measure the movement of structures and natural processes with
good results (Hill and Sippel 2002;Kuhlmann and Glaser 2002;Leica Geosystems 2002). Leica
Geosystems (2002) quote accuracies of better than 1mm for their bridge and tunnel surveys. They
use a remote system that logs measurements 6 times daily via a modem, with measurements still
possible at peak times. Kuhlmann and Glaser (2002) use a reflectorless total station to monitor
the long term deformation of bridges. Measurements are taken of the whole bridge every six
years and statistical tests are used to confirm if the points have moved. Hill and Sippel (2002) use
a total station and other sensors to measure the deformation of the land in a landslide region.
For all of the examples mentioned above the data rate for the total station measurement is slow.
At the IESSG, University of Nottingham (UoN), the research aim is improving the monitoring of
the dynamic deformation of bridges. For this a much higher data rate is needed. GPS needs a
clear line of site to the satellites and so for bridge monitoring can only measure from the bridge
deck and towers. Even on the bridge deck the cable and towers can cause obstructions to the
signals. Total station prisms can be located underneath the bridge deck as long as there is a clear
line of sight to the total station itself. For these reasons the possibility of dynamic deformation
monitoring with a total station has become a current research topic.
There are advantages and disadvantages of using a total station for dynamic deformation
monitoring. The advantages include the high accuracy as quoted above, the automatic target
recognition which provides precise target pointing (Hill and Sippel 2002) and the possibility of
measuring indoors and in urban canyons (Radovanovic and Teskey 2001). The disadvantages
include the low sampling rate (Meng 2002), problems with measurement in adverse weather
conditions (Hill and Sippel 2002) and the fact that a clear line of sight is needed between the total
station and the prism.
Radovanovic and Teskey (2001) conducted experiments to compare the performance of a robotic
total station with GPS. This experiment was conducted because GPS is not an option in many
application areas such as indoors. Total stations are now capable of automatic target recognition
and they can track a prism taking automatic measurements of angles and distances once lock has
Proceedings, 11
th
FIG Symposium on Deformation Measurements, Santorini, Greece, 2003.

been established manually. It was found that the total station performed better than GPS in a stop
and go situation, where measurements were taken of a moving object only when it was stationary.
In a completely kinematic situation GPS performed the best. It was found that there were two
main problems with the total station in kinematic mode. These were a low EDM accuracy caused
by a ranging error that was linearly dependent upon the line of sight velocity; and an uneven
sampling rate over time worsened by no time tagging.
This paper outlines some initial tests conducted with the total station on the University campus,
which included a trial with a moving monument and a metronome. The total station was also
tested in a bridge environment and compared to results from a GPS antenna located close to the
prism.
2. Technical Specifications and Software
The UoN own a Leica TCA 2003 total station. The technical specifications for this instrument are
angle measurements are accurate to 0.5”, rapid tracking distance measurements are accurate to
10mm+2ppm, automatic target recognition up to 200m away adds an error of 1mm and the 360_
prism adds errors of 5mm in distance and 5mm for the angles (Leica Geosystems 2000).
A piece of software called Geocom provided by Leica Geosystems with the total station makes
displaying the angle and distance data to the screen of a laptop possible. The total station is put
into Geocom mode and then all readings go directly to the laptop. This software was tested and
modified slightly by the authors so that the angles, changed to output in radians rather than gons,
and distances, in rapid tracking mode, were output to a file along with a time tag. The time tag
was accurate to a second and taken directly from the laptop. Sub second time tagging was
investigated, but there was no success with this for the visual basic program. After the
modification of the software, testing needed to be conducted with the total station. When the total
station was in rapid tracking mode it could measure angles and distances approximately every
second, so at approximately a 1 Hz data rate. Since it was not possible to know the time more
accurately than every second, the exact data rate could not be calculated. It is known from
Radovanovic and Teskey (2001) and from the experience of the authors that this data rate is
probably not constant.
3. Initial Tests
Some initial tests were conducted on the University Campus to test the software and the total
station. The first test took place on the 6
th
June 2002. A prism was attached to a monument
which was forced to move up and down (see Figure 6 for a picture of the monument in a
subsequent experiment). The amount that the prism could move up and down was measured and
the total movement was found to be 0.09m in the vertical direction and no movement in the
horizontal direction. The total station in Geocom mode was attached onto the top of another
monument. Four setups were carried out with the distance between the two monuments changed
at every setup (these distances were 12m, 22m, 40m and 60m). The prism was moved up and
down a number of times at each setup and the results were recorded.
Figure 1 and Figure 2 show the vertical and horizontal movement of the prism as recorded by the
total station. It can be seen that the vertical movement is 0.09m as expected and the horizontal is
about 0.004m. Since there was very little or no movement in the horizontal direction the
measurement of 0.004m in that direction is attributed to the errors of the instrument. The results
at all distances were similar, all showed a clear movement of 0.09m in the vertical direction and
the movement in the horizontal direction was always around 0.004m. So, at this slow speed the
total station measured the movement well.
Vertical Movement at 40m
2.5
2.52
2.54
2.56
2.58
2.6
2.62
2.64
09:59:54
10:00:12
10:00:29
10:00:46
10:01:03
10:01:21
10:01:38
Time (hours:minutes:seconds)
Movement (m
)
Figure 1 Vertical movement of the prism at
a distance of 40m
Horizontal Movement at 40m
40.124
40.1245
40.125
40.1255
40.126
40.1265
40.127
40.1275
40.128
40.1285
40.129
09:59:54
10:00:12
10:00:29
10:00:46
10:01:03
10:01:21
10:01:38
Time (hours:minutes:seconds)
Movement (m)
Figure 2 Horizontal movement of the
prism at a distance of 40m
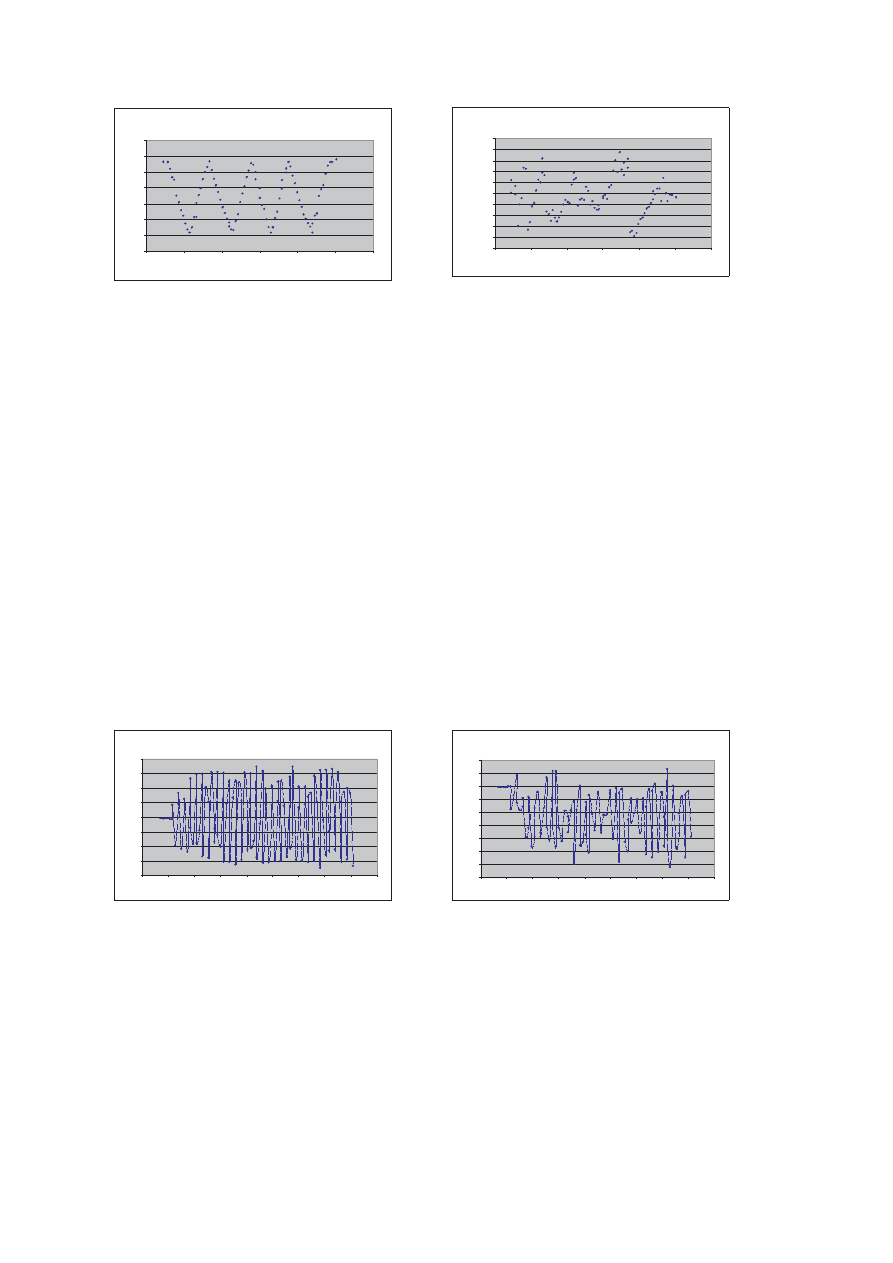
In the second experiment that occurred on campus a small sticky retro target was attached to the
hand of a metronome. The metronome was made to move from side to side at various speeds,
120, 100, 80, 60 and 50 beats per minute. These speeds corresponded to approximately 60, 50,
40, 30 and 25 horizontal oscillations per minute respectively, as there were 2 ‘beats’ per
oscillation. The total station was set up about 14 metres away from the target. For each speed
about one minute of data was collected.
Figure 3 and Figure 4 show the X coordinate and Y coordinate verses time for 80 beats per
minute. The Y coordinate particularly shows an irregular pattern of movement, further
demonstrating the uneven sampling rate of the total station, as the movement of the metronome
was regular. Figure 3 shows a period of approximately 1 minute when measurements were taken.
The metronome was moving at approximately 80 beats per minute and so about 40 oscillations
should be seen in the X direction. Figure 3 shows 33 oscillations. The weight of the retro target
caused the metronome to beat slightly slower than it would have done on its own, so 33
oscillations is a perfectly plausible amount. However, in the vertical direction 80 beats per minute
should correspond to 80 cyclic movements up and down. Figure 4 only shows 26 oscillations
which does suggest that the total station did not pick up anywhere near all of the oscillations in the
vertical direction. This did seem to imply that when the metronome moved faster than 1 Hz it was
too fast for the total station to be able to pick out all the movement.
X Coordinate Displacement Against Time
-0.08
-0.06
-0.04
-0.02
0
0.02
0.04
0.06
0.08
15:33:33
15:33:42
15:33:50
15:33:59
15:34:08
15:34:16
15:34:25
15:34:34
15:34:42
15:34:51
Time (hours:minutes:seconds)
Displacement (m)
Figure 3 X displacement verses time for
the metronome beating at 80 beats per
minute
Y Coordinate Displacement Against Time
-0.035
-0.03
-0.025
-0.02
-0.015
-0.01
-0.005
0
0.005
0.01
15:33:33
15:33:42
15:33:50
15:33:59
15:34:08
15:34:16
15:34:25
15:34:34
15:34:42
15:34:51
Time (hours:minutes:seconds)
Displacement (m)
Figure 4 Y displacement verses time for
the metronome beating at 80 beats per
minute
The results for each metronome speed were similar to that shown in the graphs. The X
displacement always showed clear oscillations of movement whereas the Y did not. This results
was not too encouraging as it is known that the first natural frequency of the Wilford Suspension
Footbridge is 1.75 Hz (Dodson, et al. 2001). It was now known that the total station could
measure up to about 1 Hz and show the displacement clearly; however, faster than that not all
oscillations were shown.
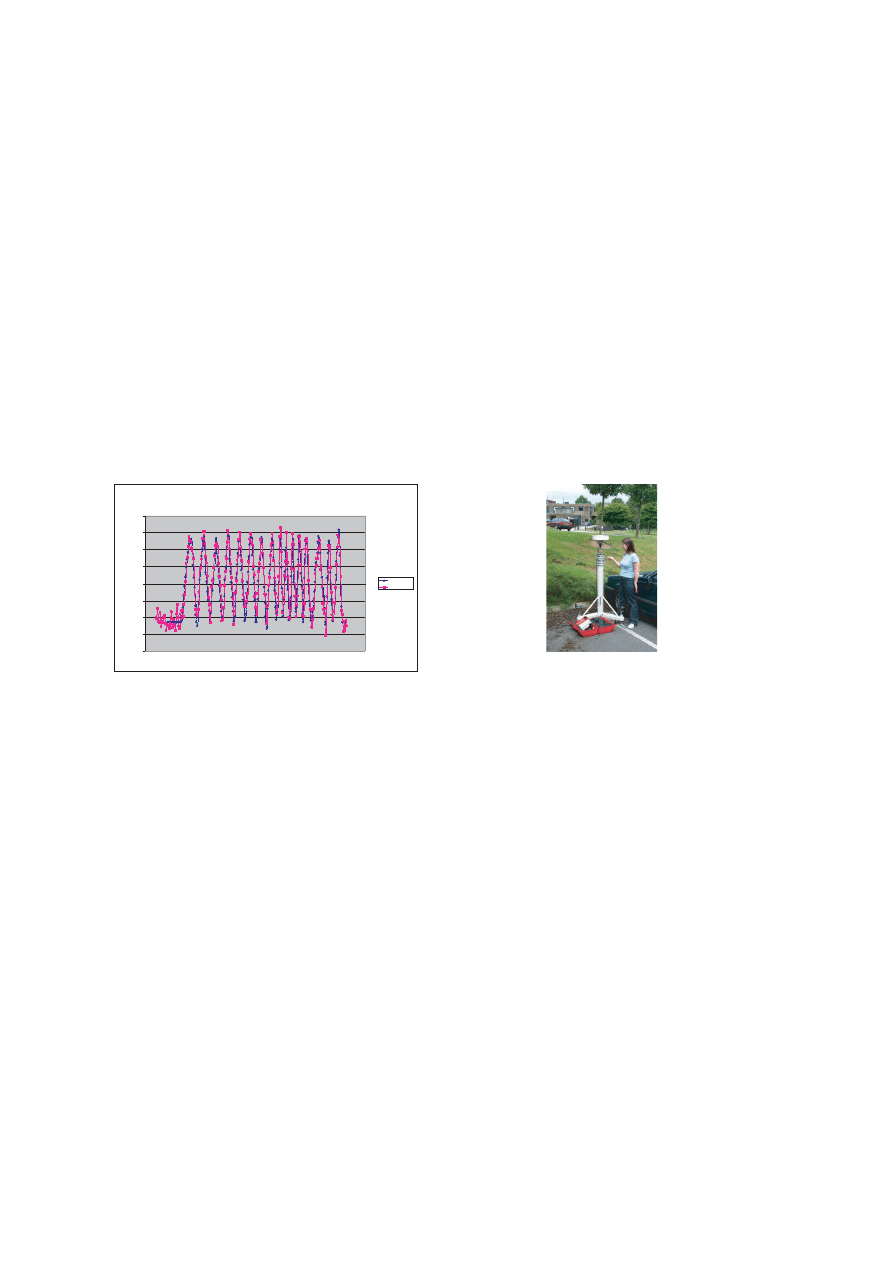
4. GPS Housed With the Total Station Prism
The initial tests had shown that the total station was capable of monitoring moving objects, but
how did it compare to GPS? A further test was undertaken on the University campus where a
GPS antenna and a circular total station prism were housed together as one unit and placed on top
of a monument (a picture of this can be seen in Figure 6). The prism was made to move up and
down as in the previous monument experiment, however this time the movement was slightly
greater, measured as 0.1m. A Leica dual frequency GPS receiver recording in RTK mode at a 1
Hz data rate was used as the rover with a similar receiver as reference transmitting corrections.
The result of this test can be seen in Figure 5. It can be seen from this Figure that the agreement
between the GPS measurements and the total station is good. They follow the same pattern of
movement, showing a displacement of approximately 0.1m which is the amount the monuments
was made to move in this case. This result also demonstrates well the precision that is attainable
from GPS in the vertical direction. The laptop time was manually set so that it was as close to
GPS time as possible; however the original total station data was still offset from GPS time by 11
seconds, but this was compensated for before the graph was plotted. At present the authors cannot
exactly align the laptop time to GPS time, which can cause problems when trying to compare the
data from both systems.
Total Station Displacement Verses GPS Displacement
-0.08
-0.06
-0.04
-0.02
0
0.02
0.04
0.06
0.08
14:25:26
14:26:10
14:26:53
14:27:36
14:28:19
14:29:02
14:29:46
Time (hours:minutes:seconds)
Displacement (m)
Total Station
GPS
Figure 5 The displacement of the total
station prism and the GPS antenna
Figure 6 The GPS antenna and the total
station prism housed together as one unit
on a monument
Most of the initial tests had shown that the total station was a good tool for kinematic monitoring,
but the metronome test had shown that the total station could not keep up if the speed was too
high. The total station was taken to the bridge to test if it could pick up the movement effectively.
It was known that the total station would only be able to pick out movement; it would not be able
to be used for the calculation of the natural frequencies as the data rate is far too slow.
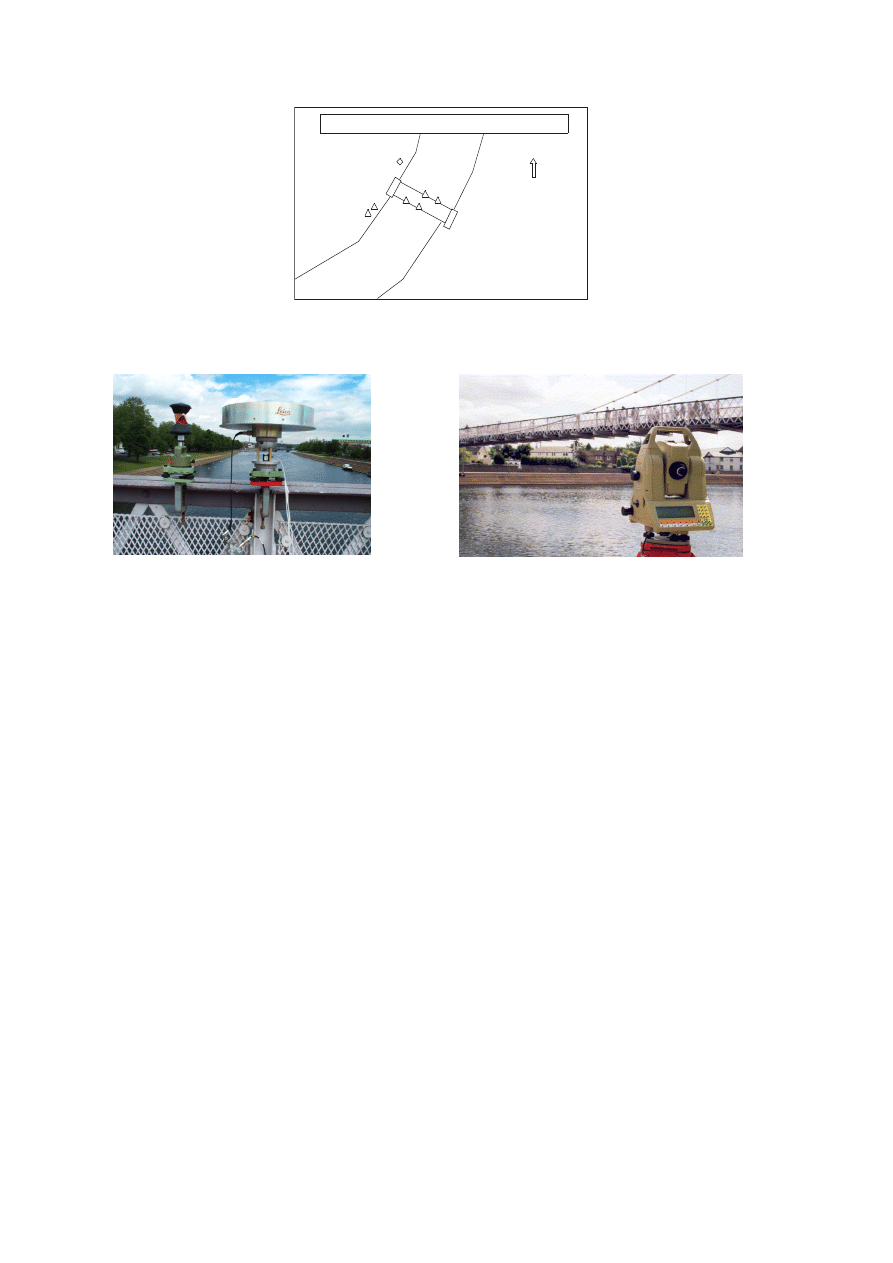
5. Bridge Trial
A GPS, accelerometer and total station bridge trial was conducted at the Wilford Suspension
Footbridge, over the River Trent in Nottingham, on the 19
th
, 20
th
and 21
st
June, 2002. This bridge
has been the focus of a number of trials carried out by the UoN (for more information about trials
conducted see, for example Roberts, et al. (2001)). The layout of the equipment for this trial can
be seen in Figure 7. Single and/or dual frequency Leica system 500 GPS receivers were located at
points Bdg1, Bdg2, Bdg3, Bdg4, Ref1 and Ref2. The total station prism was located next to the
cage that housed the GPS antenna and accelerometer at point Bdg2; a picture of this can be seen
in Figure 2. Figure 3 shows the total station with the Wilford Bridge in the background.
River Trent
Ref1
Ref2
Bdg2
Bgd1
Bdg3
Bdg4
Total Station
Set up at the Wilford Bridge- 19
th
, 20
th
and 21
st
June, 2002
Wilford Bridge
North
Figure 1 The layout of the GPS receivers and total station for the bridge trial in June, 2002 (not to
scale)
Figure 2 The total station 360° prism located
next to the GPS antenna
Figure 3 The total station with the Wilford
Bridge in the background
The bridge was made to move and vibrate by staff and students from the IESSG who passed
across the bridge in different ways (marching, running etc.). Measurements from the total station
were collected on all three days of the trial only during these periods of highest activity (the
amount of time varied from day to day). On the first day of the trial the circular prism was used
and also the retro tape was tested. It was not possible to pick up a signal from the retro tape. On
the other two days the 360° prism was used. This paper will compare and discuss the results
shown by the total station and GPS data. Results from the accelerometer will be discussed in
another paper.
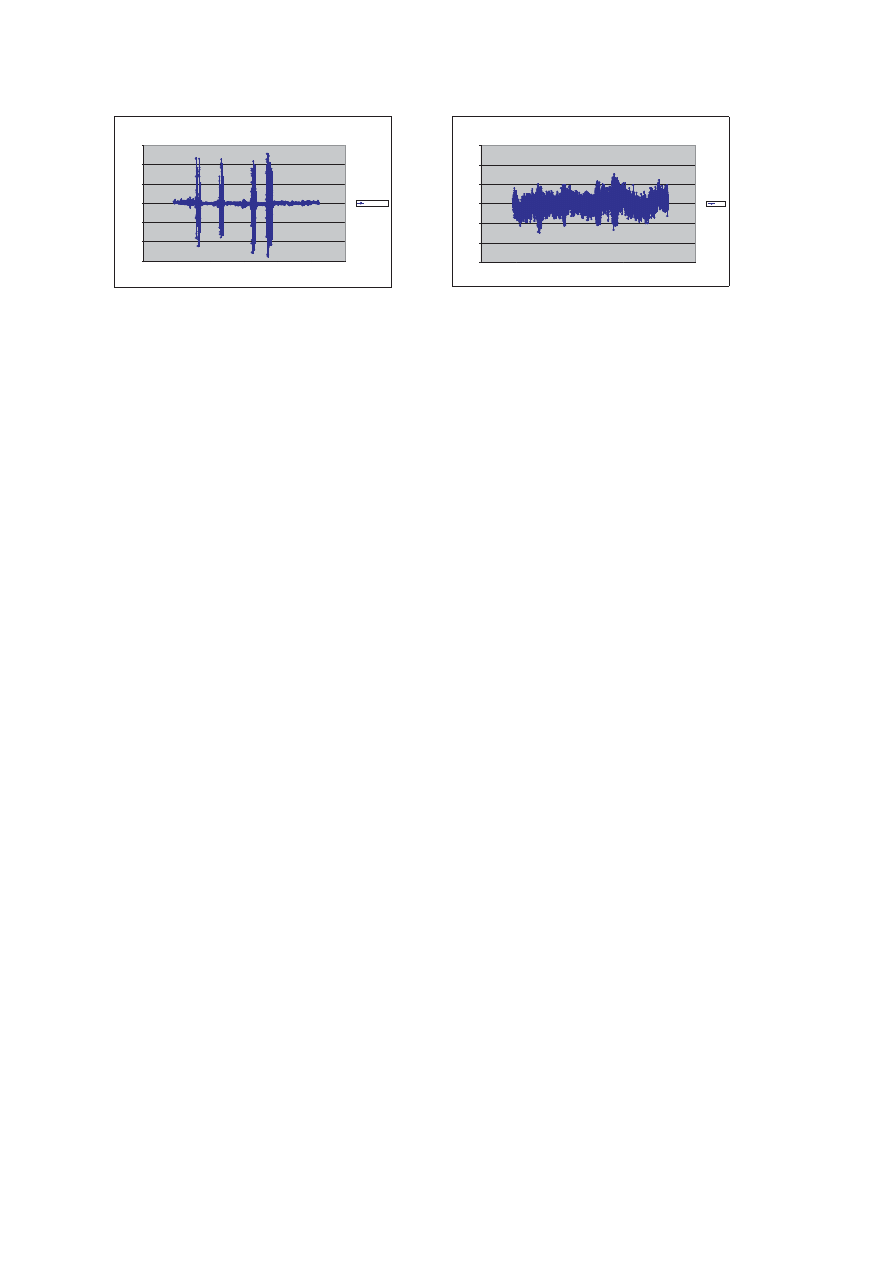
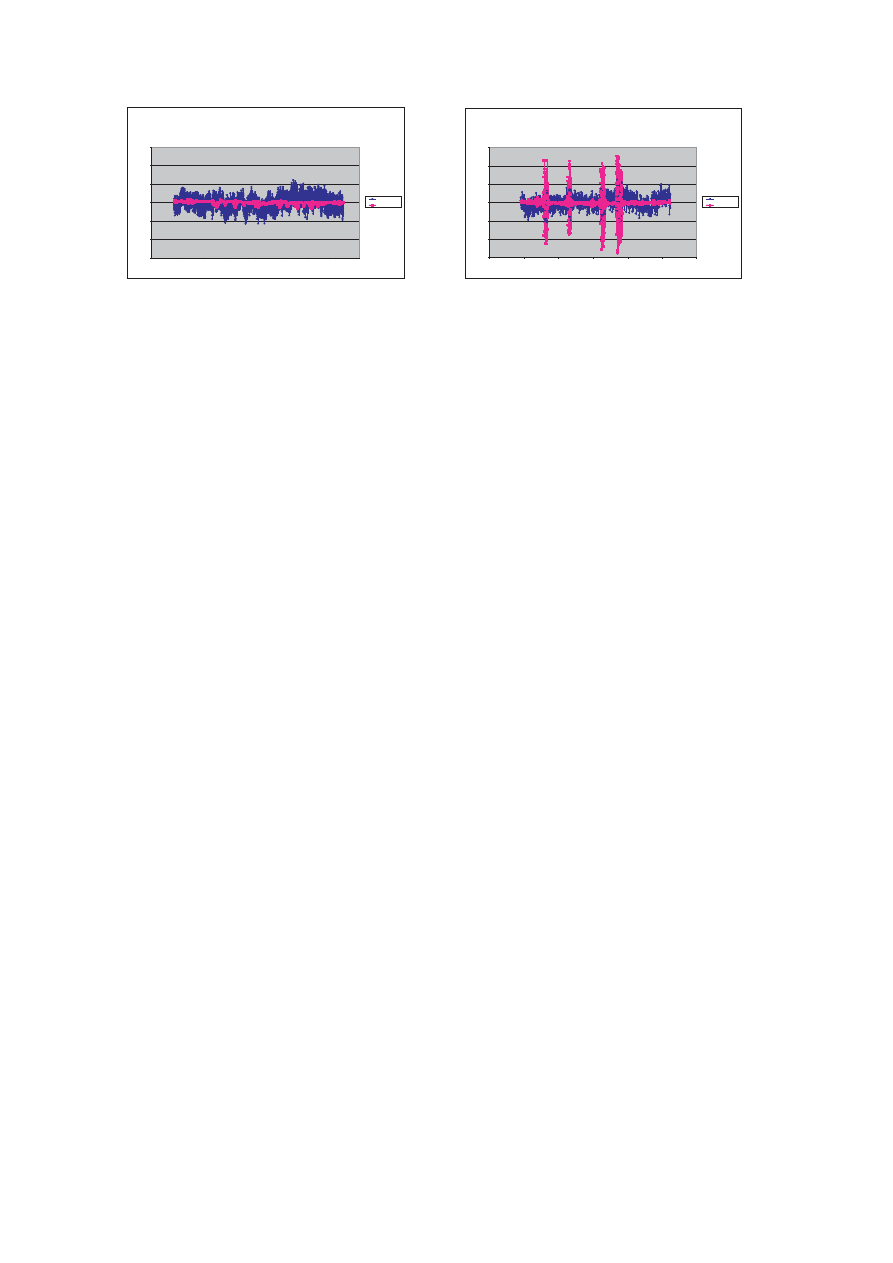
6. Bridge Trial Results
Calculations of the movement of the prism, from the angles and distances taken from the total
station were performed. Figure 10 shows the height displacement as recorded by the total station
for the last day of the bridge trial. The Leica dual frequency GPS data from point Bdg2 was
processed using Ski-Pro with Ref1 as the reference station, and the height displacements
calculated can be seen in Figure 11. The GPS data is at a 10 Hz data rate, while the total station
data rate is 1 Hz.
Height Displacement Measured by the Total Station
-0.06
-0.04
-0.02
0
0.02
0.04
0.06
472000
472500
473000
473500
474000
474500
475000
Time (GPS seconds)
Displacement (m)
Total Station
Figure 10 The height displacement
measured by the total station on Friday
21st June.
Height Displacement Measured by GPS
-0.06
-0.04
-0.02
0
0.02
0.04
0.06
472000
472500
473000
473500
474000
474500
475000
Time (GPS seconds)
Displacement (m)
GPS
Figure 11 The height displacement shown
by GPS at Bdg2 on Friday 21st June.
Four very distinct peaks of movement can be seen in Figure 10. The amplitude of these
movements is at the highest peak approximately 0.1m. The same peaks of movement can be seen
(if a little less clearly) in Figure 11, however the amplitudes of these movements are very much
smaller with the peak only being about 0.05m, which is half that shown by the total station. It was
encouraging that the total station had picked out all the peaks of movement in this case, but why
were the amplitudes so different? For a long time the reason for the difference in amplitude
calculated from the two systems was not known. In this situation it was difficult to ascertain
which system showed the ‘truth’, although as GPS has been used for many years for dynamic
monitoring perhaps this system should be more trusted. It was, however, suggested that the GPS
data could go through some filtering during the processing or even in the receiver itself. The GPS
data was reprocessed in two other pieces of software, GrafNav and Kinpos (the software
developed at the UoN), and the results were similar to those from Ski-Pro.
Recently it has been suggested that the 360° prism could be to blame. 360° prisms have a face
error of about 6mm which is constant on each face, but is opposite on adjacent faces. It is
possible that the total station could have been measuring to the prism in such a way that it was
hitting the corners and swapping between the faces as the bridge moved. If this is the case then
the GPS data shows the correct amplitude.
Results from the first day of the bridge trial, when the circular prism was used, were also
processed and these can be seen in Figure 12. As it can be seen from this Figure there is a
difference in the amplitude of movement calculated by each system here too. However, in this
case the GPS shows a much higher displacement. The total station is only measuring a
displacement of 8mm at maximum. This cannot be correct as from observing the movement of
the bridge it was apparent that it was moving much more than 8mm. Comparing Figure 12 and
Figure 13, the difference shown in displacement measured by the total station on the two different
days is quite striking. The amount of bridge movement on the third day of the trial was indeed
greater than on the first day, but the difference was not of this magnitude. On the first day the
circular prism was used and on the third it was the 360°, suggesting that some sort of face
changing error could have caused larger displacements than were actually occurring to be
recorded. The reason that such small displacements were recorded on the first day of the trial is
still not known.
The sampling rate of the total station is approximately 1 Hz. As it has been mentioned earlier in
this paper the natural frequency of the Wilford Bridge has been found to be 1.75 Hz. It has been
suggested that the measurements of the total station are always taken at the same point of the
bridge movement cycle, therefore showing no movement at all. On the third day of the bridge
trial the periods of highest movement correspond to when the people on the bridge were ‘forcing’
the bridge to move at a certain frequency. This ‘forcing’ did not occur on the first day of the trial.
It is thought that by changing the frequency at which the bridge moves it could have enabled
movement to be observed by the total station that would not have been otherwise possible.
The Displacements Measured by The Total Station and
GPS on 19th June, 2002
-0.06
-0.04
-0.02
0
0.02
0.04
0.06
300400
300600
300800
301000
301200
301400
301600
301800
302000
Time (GPS seconds)
Displacement (m
)
GPS
Total Station
Figure 12 The displacement measured by
GPS and total station on the first day of
the bridge trial when the circular prism
was used.
The Displacements Measured by GPS and Total
Station on the 21st June, 2002
-0.06
-0.04
-0.02
0
0.02
0.04
0.06
472000
472500
473000
473500
474000
474500
475000
Time (GPS seconds)
Displacement (m)
GPS
Total Station
Figure 13 The displacement measured by
GPS and total station on the third day of
the bridge trial when the 360Γ prism was
used.
The results from the metronome suggested that for movement as fast as 1.75 Hz, it was not
possible for the total station to measure all of the bridge movement. As it was seen with the data
at 80 beats a minute not all oscillations were picked up, however a span of movement was shown.
The results for the third also show a span of results (in this case the span is too high). It is not
known why on the first day little or no movement was detected.
Other possible errors that could be associated with the total station are also related to the speed at
which the bridge moves. It has been suggested that the angles and distances may not correspond
to each other exactly. In the time it takes for the EDM signal to get to the bridge, be reflected by
the prism and be recorded back at the total station, the bridge would have moved and so the
corresponding angles recorded may not be correct. This could have affected the displacements
recorded.
7. Conclusion
From the results presented it can be seen that measuring slow dynamic deformation is possible.
The total station results from the trial with a moving monument matched well with the results that
were obtained from GPS. However, the total station had many difficulties measuring the dynamic
movement of very fast moving objects like the metronome and the bridge. Due to its slow data
rate not all the oscillations were recorded and in the case of the bridge, very little movement was
measured at all on the first day of the trial. For smaller bridges with a small amplitude and high
frequency the total station can simply not measure fast enough. For longer bridges that move at
slower frequencies the total station could be a possibility for monitoring.
On the third day of the bridge trial the amplitude of the structure measured by the total station was
very large. It is thought that this was caused by face change on the 360° prism. Large amplitude
were not seen when the circular prism was used, so this is likely to be the case.
A possible problem that has been identified is that, due to the speed at which the bridge vibrates
the measurement of angles and distances may not correspond to each other.
8. Future Work
In the future it is hoped that experiments can be performed with two total stations on a fixed
baseline measuring angles only. The advantages of this system are that angles can be measured
faster than distances at a rate of four times per second and so a higher data rate can be achieved
for the total station; and previously it has been stated that prior research by Radovanovic and
Teskey (2001) has found that the main source of error with the total station is the EDM
measurement. This would mean that more accurate measurements could be made at a quicker
time interval. This could also lead to the total station being able to measure all the movement on

smaller bridges and would also remove the possible problem of the angles and distances not
corresponding to each other.
The main problem with the above method is whether the total stations are both measuring at the
same time. Connecting the laptops to an external oscillator and/or a GPS receiver could be a
solution to this problem. The uneven sampling rate of the total stations could cause problems for
this method. Another problem is the accuracy to which the time can be known. At present it can
only be known to the nearest second, which is not good enough for this application. Both these
matters may be looked into in the future by the authors.
Acknowledgements
This research is funded by the UK’s Engineering and Physical Sciences Research Council
(EPSRC), in collaboration with Cranfield University, Network Rail, WS Atkins, Pell Frischmann
and Leica Geosystems Ltd. The authors would like to thank Mr Andrew Nesbitt for his help and
advice during the trials mentioned in this paper. Gratitude is also expressed to staff from Leica
Geosystems, particularly Steve Cooper, for their expertise and advice.
References
Dodson, A. H., Meng, X. and Roberts, G. W. (2001). "Adaptive Methods for Multipath
Mitigation and Its Applications for Structural Deflection Monitoring." International
Symposium on Kinematic Systems in Geodesy, Geomatics and Navigation (KIS 2001),
Banff, Canada, pp.
Hill, C. D. and Sippel, K. D. (2002). "Modern Deformation Monitoring: A Multi Sensor
Approach." FIG XXII International Congress, Washington DC, USA, pp.
Kuhlmann, H. and Glaser, A. (2002). "Investigation of New Measurement Techniques for
Bridge Monitoring." 2nd Symposium on Geodesy for Geotechnical and Structural
Engineering, Berlin, Germany, pp.
Leica Geosystems. (2000). TPS-System 100: Electronic Theodolites and Total Stations, User
Manual, Leica Geosystems, Heerbrugg, Switzerland.
Leica Geosystems. (2002). "Bridge Surveys." [online]. Available at: <
http://www.leica-
geosystems.com/civil/application/bridge.htm
> [1st October 2002]
Meng, X. (2002). "Real-time Deformation Monitoring of Bridges Using GPS/Accelerometers,"
PhD thesis, University of Nottingham, Nottingham, UK
Radovanovic, R. S. and Teskey, W. F. (2001). "Dynamic Monitoring of Deforming Structures:
GPS verses Robotic Tacheometry Systems." The 10th FIG International Symposium on
Deformation Measurements, Orange, California, USA, pp.
Roberts, G. W., Meng, X. and Dodson, A. H. (2001). "The Use of Kinematic GPS and Triaxial
Accelerometers to Monitor the Deflections of Large Bridges." 10th International
Symposium on Deformation Measurement, FIG, California, USA, pp. (CD-ROM).
Wyszukiwarka
Podobne podstrony:
nottingham
The Fourth Way and Esoteric Christianity by Rebecca Nottingham
Notting Hill She
NOTTING HILL, level 3
NottingHillCarnival
When You Say Nothing at All (Notting Hill) inst in C
When You Say Nothing at All (Notting Hill) inst in Es
She (Theme From Notting Hill) Charles Aznavour Piano partition musicale
Uczeni z uniwersytetu w Nottingham
SP032 Studium przypadku Nowe centrum lotniczych przewozów towarowych DHL na lotnisku w Nottingham Ea
Nottingham Analog HORIZON
When You Say Nothing at All (Notting Hill) inst in B
Curtis Richard Notting Hill(3)
więcej podobnych podstron