
doi:10.1016/j.gca.2003.11.030
Copper(II) sorption onto goethite, hematite and lepidocrocite: A surface complexation
model based on ab initio molecular geometries and EXAFS spectroscopy
C
AROLINE
L. P
EACOCK
and D
AVID
M. S
HERMAN
*
Department of Earth Sciences, University of Bristol, Bristol, BS8 1RJ, United Kingdom
(Received August 18, 2003; accepted in revised form November 10, 2003)
Abstract—We measured the adsorption of Cu(II) onto goethite (
␣-FeOOH), hematite (␣-Fe
2
O
3
) and lepi-
docrocite (
␥-FeOOH) from pH 2–7. EXAFS spectra show that Cu(II) adsorbs as (CuO
4
H
n
)
n
⫺6
and binuclear
(Cu
2
O
6
H
n
)
n
⫺8
complexes. These form inner-sphere complexes with the iron (hydr)oxide surfaces by corner-
sharing with two or three edge-sharing Fe(O,OH)
6
polyhedra. Our interpretation of the EXAFS data is
supported by ab initio (density functional theory) geometries of analogue Fe
2
(OH)
2
(H
2
O)
8
Cu(OH)
4
and
Fe
3
(OH)
4
(H
2
O)
10
Cu
2
(OH)
6
clusters. We find no evidence for surface complexes resulting from either
monodentate corner-sharing or bidentate edge-sharing between (CuO
4
H
n
)
n
⫺6
and Fe(O,OH)
6
polyhedra.
Sorption isotherms and EXAFS spectra show that surface precipitates have not formed even though we are
supersaturated with respect to CuO and Cu(OH)
2
. Having identified the bidentate (
§FeOH)
2
Cu(OH)
2
0
and
tridentate (
§Fe
3
O(OH)
2
)Cu
2
(OH)
3
0
surface complexes, we are able to fit the experimental copper(II) adsorp-
tion data to the reactions
3
共§FeOH兲 ⫹ 2Cu
2
⫹
⫹ 3H
2
O
⫽ 共§Fe
3
O
共OH兲
2
兲Cu
2
共OH兲
3
0
⫹ 4H
⫹
and
2
共§FeOH兲 ⫹ Cu
2
⫹
⫹ 2H
2
O
⫽ 共§FeOH兲
2
Cu
共OH兲
2
0
⫹ 2H
⫹
.
The two stability constants are similar for the three iron (hydr)oxide phases investigated.
Copyright
© 2004 Elsevier Ltd
1. INTRODUCTION
The aqueous geochemistry of copper can be strongly con-
trolled by sorption onto iron and manganese (hydr)oxides and
clay minerals. In soils, copper is concentrated into the clay
fraction (
) presumably by sorption
onto colloidal FeOOH phases. In lacustrine sediments, there is
clear evidence of the copper-FeOOH association:
showed that Cu was bound to Mn- and Fe-oxides and
that the pore waters were undersaturated with respect to all Cu
solid phases. Adsorption of copper to FeOOH phases controls
the release of copper during sulfide oxidation (
inger et al., 1998; Juang and Wu, 2002; O
In the deep oceans, the Cu-FeOOH association is less clear:
in the lower water column, copper is scavenged by the partic-
ulate fraction (
) but released during early
diagenesis at the ocean floor (e.g.,
). The
resulting benthic source enriches bottom waters in copper
(
); however, if Fe-Mn oxide hydroxide phases
are forming at the sediment-water interface, the flux of Cu into
bottom water is diminished (
). Adsorption of Cu(II) onto colloidal iron oxides
produced at hydrothermal vents at mid ocean ridges does occur
(
Feely, 1992; Bogdanov, 1997; Savenko, 2001
) but is not a
major control on the concentration of copper in seawater (
). The incorporation of Cu in metal-
rich ridge-crest sediments is a minor component of the overall
cycle of the element in the deep water column (
Iron oxyhydroxide phases commonly form as reactive, high-
surface area secondary minerals resulting from surface weath-
ering processes. Goethite (
␣-FeOOH) is ubiquitous in natural
systems, occurring in virtually all weathering environments,
whilst hematite (
␣-Fe
2
O
3
) is widespread in the soils of tropical
and subtropical regions (
Lepidocrocite (
␥-FeOOH) occurs as a major iron oxyhydroxide
under acid mine drainage (AMD) conditions (
and commonly forms via oxidation of Fe
2
⫹
phases such as
green rust (a mixed Fe
2
⫹
/Fe
3
⫹
oxyhydroxide;
Previous studies examining the interaction between Cu(II)
and iron oxyhydroxide minerals have tended to focus on either
the modeling of adsorption behavior displayed in experimental
adsorption edges and isotherms, or direct spectroscopic inves-
tigation of the metal-mineral association.
Two types of modeling approach have been followed: sur-
face complexation modeling (SCM) and a more empirical
consideration involving the use of Langmuir or similar equa-
tions to describe adsorption data (
). Both
SCM and empirical modeling frameworks have successfully
described the adsorption of Cu(II) to goethite and hematite by
invoking
§SOCu
⫹
surface complexes (e.g.,
Christl and Kretzschmar, 1999; Buerge-Weirich, 2002
§SOCuOH surface complexes (
), or a com-
bination of both
§SOCu
⫹
and
§SOCuOH surface complexes
). Using the competitive Langmuir
model,
successfully described Cu(II) ad-
* Author to whom correspondence should be addressed (dave.sherman@
bristol.ac.uk).
Pergamon
Geochimica et Cosmochimica Acta, Vol. 68, No. 12, pp. 2623–2637, 2004
Copyright © 2004 Elsevier Ltd
Printed in the USA. All rights reserved
0016-7037/04 $30.00
⫹ .00
2623

sorption to goethite through the competitive adsorption of
monomeric CuOH
⫹
and dimeric Cu
2
(OH)
2
2
⫹
, the dimer ad-
sorbing more strongly to the mineral surface.
,b) drew on spectroscopic evidence and recommend the
use of polymer species within the SCM framework to ade-
quately describe adsorption at higher surface loadings. Model-
ing Cu(II) adsorption onto iron (hydr)oxide phases in the pres-
ence of natural organic matter (NOM) has also received much
attention (e.g.,
Nowack et al., 1996; Christl and Kretzschmar,
2001; Buerge-Weirich et al., 2002
) as oxide mineral surfaces in
many natural environments can be coated with adsorbed NOM
(
Direct spectroscopic investigations of Cu(II)-iron oxyhy-
droxide adsorption revealed inner-sphere surface complexes
(e.g.,
) consistent with modeling results.
Several studies also reported the presence of small multinuclear
clusters bound by inner-sphere complexation at the iron oxy-
hydroxide surface.
attributed a second
shell of metal atoms at 2.96 A
˚ to Cu atoms associated with
hydroxo-bridged Cu
2
⫹
surface polymers, while
reported Cu-Cu/Fe-Cu at 2.92 A
˚ on goethite and Cu-
Cu/Fe-Cu at 3.04 A
˚ on lepidocrocite.
also reported Cu-Cu interactions at 2.65 A
˚ (average) and 3.11
A
˚ on muscovite and biotite respectively.
To date, however, no study has attempted to develop a
surface complexation model of Cu sorption constrained by
results from spectroscopy. Here, we fit sorption edges and
isotherms to a surface complexation model based on surface
species determined from EXAFS spectroscopy. The interpreta-
tion of EXAFS spectra is aided using first-principles (density
functional theory) calculations of surface complex geometries.
Since the surface complexation model will be based on the
actual surface species, we believe our results will be more
reliable when applied to modeling reactive transport of Cu in
complex natural systems.
2. EXPERIMENTAL METHODS
2.1. Mineral Preparation and Characterization
Goethite, hematite and lepidocrocite were synthesized from AR
grade reagents using the methods of
Schwertmann and Cornell (1991)
Goethite was prepared by hydrolysis of a Fe(NO
3
)
3
solution at pH
12–13 and 70°C for 60 h. Hematite was prepared by hydrolysis of a
Fe(NO
3
)
3
solution held at 98°C for 7 d. Lepidocrocite was prepared by
the oxidation/hydrolysis of a FeCl
2
solution at pH 6.7– 6.9. Plastic
labware was used throughout. Mineral identity and purity was con-
firmed by X-ray powder diffraction (XRD) analysis of randomly ori-
entated powder samples. The surface areas of the synthesized goethite,
hematite and lepidocrocite were measured by BET to be 32.73
⫾ 3
m
2
/g, 30.02
⫾ 3 m
2
/g and 75.24
⫾ 3 m
2
/g respectively.
2.2. Potentiometric Titration
Goethite, hematite and lepidocrocite potentiometric titrations were
carried out at three salt concentrations (0.003 mol/L, 0.01 mol/L and
0.1 mol/L NaNO
3
) following the method of
. The
dried solid mineral was suspended in preboiled, nitrogen-purged (
⬍1
ppm CO
2
(g)) 18.2 m
⍀ Milli-Q water and nitrogen-purged (⬍1 ppm
CO
2
(g)) overnight before titrations. Initial pH of the goethite, hematite
and lepidocrocite solutions after overnight purging were approximately
pH 8, 8.5 and 7.2 respectively. Titrations were performed at 25°C in an
air-tight reactor with constant stirring to prevent settling. Base (NaOH,
free from carbonate), acid (HNO
3
) and salt solutions (NaNO
3
) were
prepared from stock solutions and added via an automated titrator. A
nitrogen atmosphere (
⬍1 ppm CO
2
(g)) was maintained throughout the
experiment. Electrolyte was added to adjust the ionic strength to 0.003
mol/L and acid then added to gradually lower the pH to approximately
pH 4 (see
). Incremental addition of base then
produced a titration from approximately pH 4
⫺11. After each incre-
mental addition of base, 5 min were allowed for pH equilibration. The
suspension was returned to pH
⬃4 by reverse acid titration, electrolyte
added to adjust the ionic strength to the next level and the titration
repeated following the same method. Goethite, hematite and lepido-
crocite concentration in solution were 6.63 and 5 g/L respectively. In
agreement with other titration studies (e.g.,
ertson and Leckie, 1998; Venema et al., 1998
) we observed no signif-
icant hysteresis between the acid and base titration legs.
We used a pin-tip double junction glass combination electrode
(Sentek) with a salt bridge of 3 mol/L NaNO
3
. The electrode was
calibrated potentiometrically following the method of
The base leg of the titrations are reported here and used to optimize
acid-base parameters for use in mineral-copper surface complexation
modeling.
2.3. Sample Synthesis
Goethite, hematite and lepidocrocite batch experiments were pre-
pared with copper II aqueous solution using AR grade reagents and
18.2 m
⍀ Milli-Q water. All solutions and resulting experimental sus-
pensions were purged with Ar (g) or N
2
(g) (
⬍1 ppm CO
2
(g)) and all
adsorption experiments were conducted at 25°C. pH measurements
were calibrated to
⫾ 0.05 pH units using Whatman NBS grade buffers.
2.3.1. pH Adsorption Edge Experiments
Copper II stock solution was prepared at 100 ppm from
Cu(NO
3
)
2
.3H
2
O. Adsorption pH experiments at 25 ppm [Cu]
total
were
prepared by adding 7.5 mL of 100 ppm Cu stock solution to 0.1 g
sorbent (goethite, hematite or lepidocrocite) in 22.5 mL of 0.1 mol/L
NaNO
3
. Sorbent concentration in solution was therefore 3.33 g/L. The
resulting suspensions were immediately shaken and initial pH was
recorded after stabilization to two decimal places. Suspension pH was
then varied from pH 2
⫺7 by the dropwise addition (⬍1 mL) of
HNO
3
/NaOH and recorded after stabilization to two decimal places.
Adsorption pH experiments were then shaken continuously for 4
weeks. Adsorption of Cu to goethite at 25 ppm [Cu]
total
was investi-
gated with EXAFS spectroscopy of specific samples from the adsorp-
tion edge at pH
⬃4.7 and 6.3. Goethite samples at pH ⬃4.7 and 6.3
contained 0.38 and 0.75 wt% copper with estimated surface coverage
(calculated assuming 6 sites/nm
2
and 32.73 m
2
/g) at 17.8% and 34.9%
respectively. Adsorption of Cu to hematite at 25 ppm [Cu]
total
was
investigated with EXAFS spectroscopy of a specific sample from the
adsorption edge at pH
⬃5.3, containing 0.73 wt% copper with esti-
mated surface coverage (calculated assuming 7.5 sites/nm
2
and 30.02
m
2
/g) at 46%. Adsorption of Cu to lepidocrocite at 25 ppm [Cu]
total
was
investigated with EXAFS spectroscopy of specific samples from the
adsorption edge at pH
⬃4.6, 5 and 6.4. Lepidocrocite samples at pH
⬃4.6, 5 and 6.4 contained 0.2, 0.43 and 0.75 wt% Cu with estimated
surface coverage (calculated assuming 1.6 sites/nm
2
and 75.24 m
2
/g) at
13.8%, 30.4% and 52.3% respectively.
2.3.2. Constant-pH Isotherm Experiments
Goethite, hematite and lepidocrocite constant pH experiments were
prepared by adding 3–15 mL of 100 ppm Cu stock solution to 0.1 g
sorbent (goethite, hematite or lepidocrocite) in 27–15 mL of 0.1 mol/L
NaNO
3
respectively. Sorbent concentration in solution was therefore
3.33 g/L, and [Cu]
total
ranged from 10 –50 ppm. The resulting suspen-
sions were immediately shaken and initial pH was recorded after
stabilization to two decimal places. Suspension pH was then set at pH
6.5 by the dropwise addition (
⬍1 mL) of NaOH and recorded after
stabilization to two decimal places. Plastic centrifuge tubes containing
the suspensions were then shaken continuously for 4 weeks.
Batch adsorption samples were separated by centrifugation (10,000
rpm for 10 –15 min) into an adsorption sample (thick paste) for spec-
troscopic analysis and a clear supernate for determination of total
copper concentration. Supernates were filtered using 0.2
m cellulose
2624
C. L. Peacock and D. M. Sherman
nitrate membrane filters, acidified with 1% HNO
3
and analyzed for
copper by inductively-coupled plasma atomic emission spectrometry
(ICP-AES). All adsorption samples were spectroscopically analyzed
either immediately after centrifugation or after storage at 1– 4°C for a
maximum of 48 h.
2.4. EXAFS Data Collection and Analysis
2.4.1. Data Collection
EXAFS fluorescence spectra of the copper K edge (8.979 keV) were
collected on station 16.5 at the CLRC Synchrotron Radiation Source,
Daresbury Laboratory, UK. Adsorption samples were presented to the
X-ray beam as a wet paste held by Sellotape in a 2 mm-thick Teflon
slide with a 4
⫻ 15 mm sample slot. During data collection, storage
ring energy was 2.0 GeV and the beam current varied between 130 and
240 mA. The monochromator was set to reject 50% of the incoming
beam to minimize higher harmonics in the EXAFS spectrum. EXAFS
data were collated from up to 10 fluorescence mode scans using an
Ortec 18-element solid state detector.
It should be noted that EXAFS cannot discriminate between Cu and
Fe using phase and amplitude functions alone. Next-nearest neighbor
distances in section 3.1 are therefore Fe or Cu.
2.4.2. Data Analysis
EXAFS data reduction was performed using Daresbury Laboratory
software (EXCALIB and EXBACK,
EXCALIB was used to calibrate from monochromator position (mil-
lidegrees) to energy (eV) and to average multiple spectra from indi-
vidual samples. EXBACK was used to define the start of the EXAFS
oscillations (determined from the inflection point on the K edge) and
perform background subtraction. The preedge was fit to a linear func-
tion and the postedge background to two second-order polynomial
segments. EXAFS were fit in the small atom approximation and we
allowed for multiple scattering as coded in EXCURV98 (
). The phase-shift functions used in the curve fitting were derived
by ab initio methods in EXCURV98 using Hedin-Lundqvist potentials
(
) and von Barth ground states. No Fourier
filtering was performed during the data analysis.
The inclusion of multiple scattering improved the fit in the 3.5– 4.5
A
˚ region where some of the features result from O-O scattering within
the square planer CuO
4
6
⫺
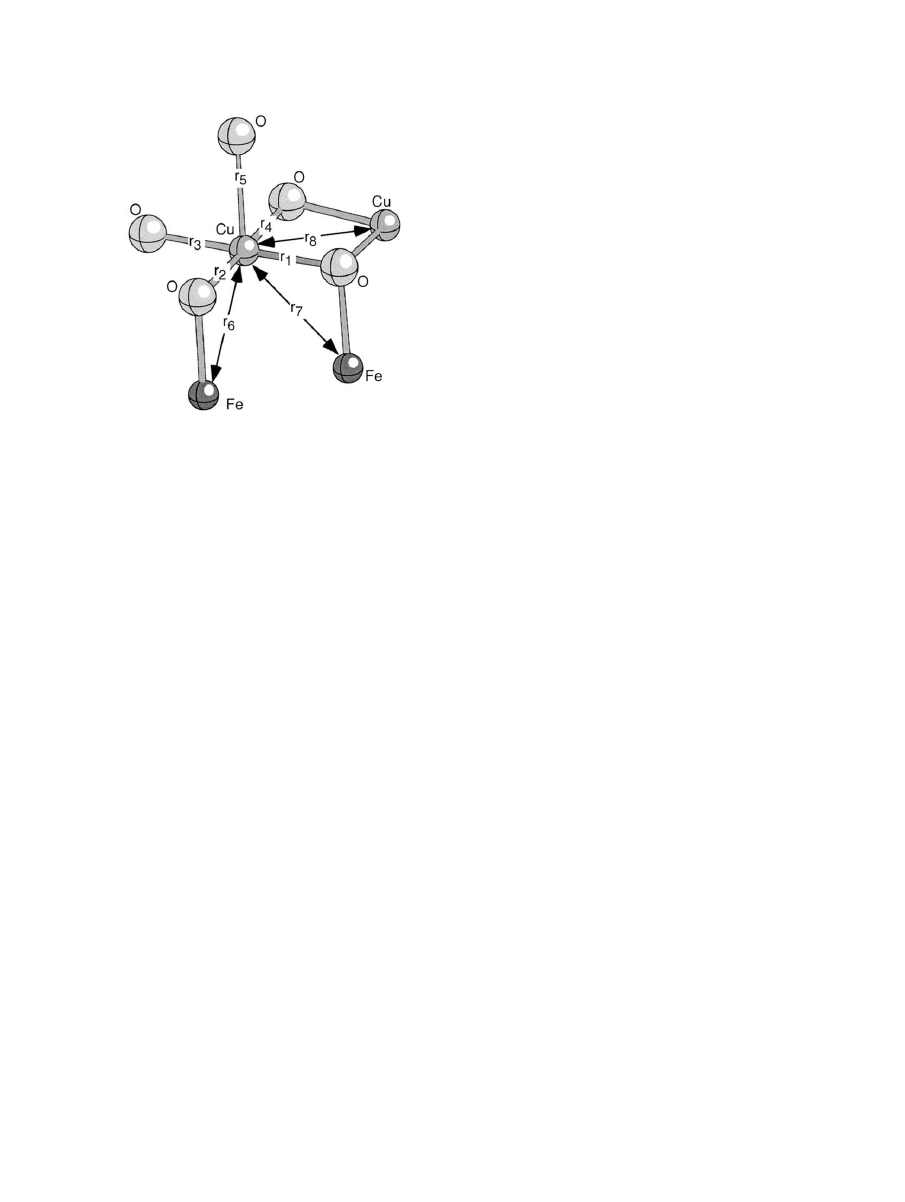
clusters. Multiple scattering calculations
require specification of the full three dimensional structure of the Cu
coordination environment (i.e., bond angles in addition to bond
lengths). This was done using a hypothetical model cluster (
) with
C
1
symmetry. Note that the multiple-scattering contributions were
calculated self-consistently during the EXAFS fits. Multiple scattering
paths were limited to those involving 5 atoms although using only 3
atoms gave similar results. Multiple scattering path lengths were lim-
ited to 10 A
˚ .
2.5. Density Functional Calculations
Quantum mechanical calculation of cluster geometries and energies
were performed using the ADF 2.0 code (
) which
implements density functional theory for finite clusters and molecules
using the linear combination of atomic orbital formalism. Molecular
orbitals in the ADF code are constructed from Slater-type atomic
orbitals, consisting of a Cartesian part r
kr
x
kx
y
ky
z
kz
with k
x
⫹ k
y
⫹ k
z
⫽ l (l ⫽ angular momentum quantum number) and an exponential part
e
⫺
␣r
. Density functional theory allows a very large basis set to be used:
For all atoms we used an uncontracted, triple-zeta basis set with
polarization functions (i.e., 1s2s2p3s3p3d3d
⬘3d⬙4s4s⬘4s⬙ ⫹ 4p for iron,
1s2s2s
⬘2s⬙ ⫹ 3d for oxygen, 1s2s2p3s3p3d3d⬘3d⬙4s4s⬘4s⬙ ⫹ 4p for
copper and 1s1s
⬘1s⬙ ⫹ 2p for hydrogen). The charge density was also
fit to a Slater-type orbital basis set. For all atoms except hydrogen, we
used frozen core orbitals (i.e., 1s, 2s, 2p and 3p for Fe; 1s for O and 1s,
2s, 2p and 3p for Cu).
We used the
parameterization for the local
exchange-correlation functionals together with generalized gradient
corrections of
. All calculations were performed
using the spin-unrestricted formalism and we set the cluster to have a
ferromagnetic configuration. The choice of ferromagnetic vs. antiferro-
magnetic configuration for the Fe
2
(OH)
2
(H
2
O)
8
/Fe
3
(OH)
4
(H
2
O)
10
sub-
strate should only have a minor chemical effect. (Note that a spin-
restricted calculation would be seriously in error, however, since it
would mix in configurations associated with high energy multiplets as
discussed by
The geometries of the clusters were optimized using a Newton-
Raphson method and Broydon-Fletcher update of the Hessian matrix as
coded in ADF 2.0. During the geometry optimizations the total energies
were converged to
⫾ 5 kJ/mole.
2.6. Surface Complexation Modeling
The program FITEQL v3.2 (
) was used to
fit the acid-base behavior of the mineral surfaces and subsequently the
adsorption behavior of copper on goethite, hematite and lepidocrocite
to a surface complexation model. The diffuse layer model (DLM,
) and triple layer model (TLM,
Leckie, 1987; Hayes et al., 1988
) were used to account for surface
electrostatics. FITEQL is used extensively for the calculation of chem-
ical equilibrium constants in metal adsorption studies (e.g.,
). The quality of the
fits produced is given by:
V
共Y兲 ⫽ 共Y/S
Y
兲
2
/
共n
p
*n
II
⫺ n
u
兲
(1)
where Y is the actual error in the mass balance equation, S
Y
is the
estimated experimental error given by FITEQL and the reciprocal of
the variance S
Y
is the weighting factor. n
p
is the number of data points,
n
II
is the number of chemical components with known total and free
concentrations, and n
u
is the number of adjustable parameters (
don and Evans, 1994; Gao and Mucci, 2001
). A good fit to experimen-
tal metal binding data is indicated by a value of V(Y) between 0.1 and
20 (
3. RESULTS AND DISCUSSION
3.1. Sorption of Cu
2
ⴙ
on Goethite, Hematite, and
Lepidocrocite
3.1.1. Adsorption pH Edge Data
The aqueous speciation of Cu
2
⫹
at 25 ppm [Cu]
total
(calcu-
lated by suppressing the formation of CuO and Cu(OH)
2
) is
Fig. 1. Multiple scattering configuration used in EXAFS fits for
Cu(II) sorbed to goethite, hematite and lepidocrocite.
2625
Surface complexation of Cu
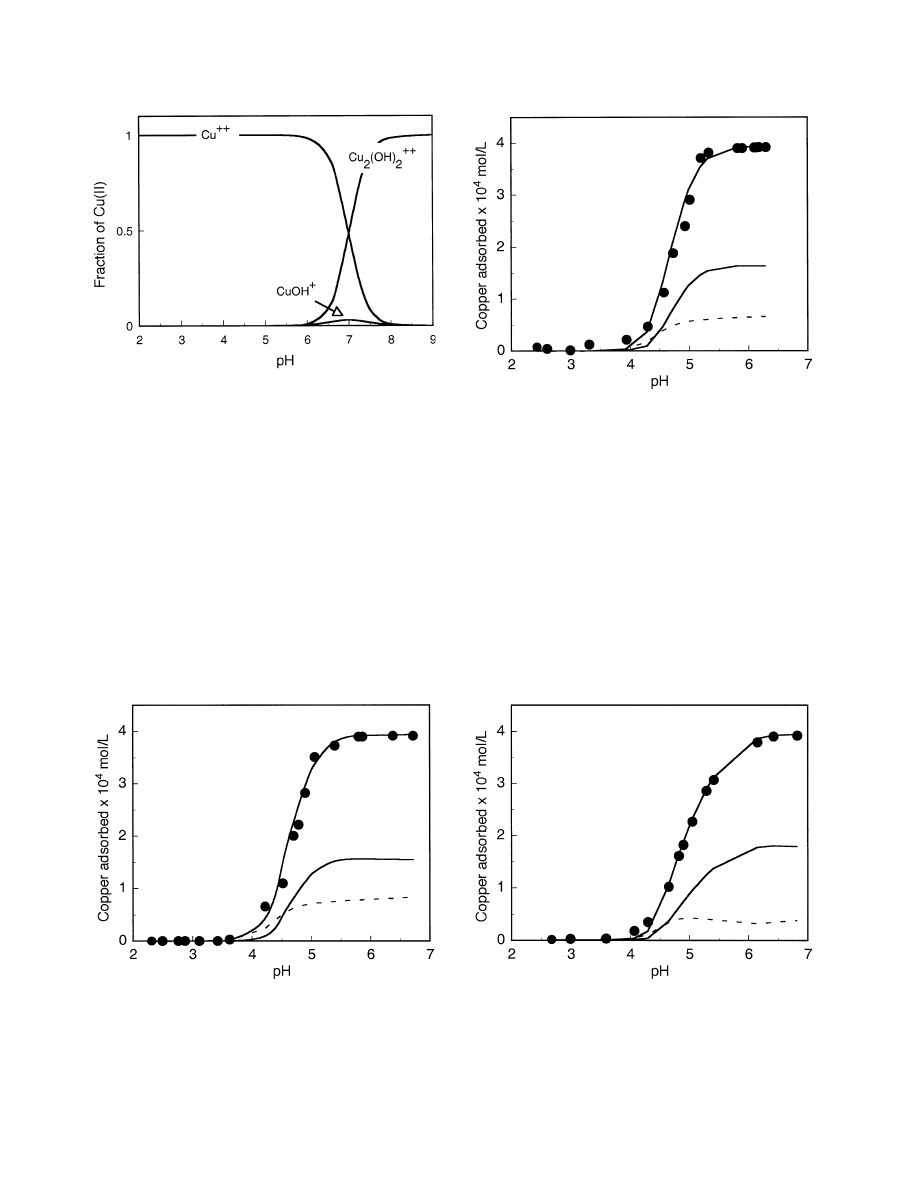
shown in
as a function of pH. Between pH
⬃2–6.5,
Cu(II) occurs predominantly as the Cu
2
⫹
aqueous cation.
Above pH
⬃7, the major hydrolysis product is Cu
2
(OH)
2
2
⫹
. At
25 ppm [Cu]
total
and between pH
⬃2–6.5, Cu(II) therefore
likely sorbs as Cu
2
⫹
(aq) and we find a sigmoid adsorption
edge for goethite, hematite and lepidocrocite (
and
respectively). The shape of our adsorption edges are in good
agreement with several previous studies of Cu
2
⫹
adsorption
onto iron oxyhydroxides (e.g., for goethite,
Murray, 1982; Ali and Dzombak, 1996
; for hematite,
3.1.2. Constant pH Isotherm Data
Constant pH sorption data for goethite, hematite and lepido-
crocite at pH 6.5 (
) is plotted as final aqueous [Cu] (log)
against the surface density of adsorbed ions,
⌫ (log mol/m
2
).
Saturation of CuO (s) and Cu(OH)
2
(s) is predicted to occur
when log [Cu
2
⫹
] mol/L is
⫺5.8 (⬃0.1 ppm) and ⫺4.8 to ⫺4.5
(
⬃1–2 ppm), respectively. However, at the nominal saturation
Fig. 2. Speciation of copper(II) as a function of pH. [Cu]
total
⫽ 3.94
⫻ 10
⫺4
molal (
⬃25 ppm) in 0.1 mol/L NaNO
3
. Calculated by sup-
pressing the formation of CuO (s) and Cu(OH)
2
(s). Hydrolysis stability
constants from
Fig. 3. Adsorption of copper(II) ions to goethite (
␣-FeOOH, 3.33
g/L) as a function of pH at I
⫽ 0.1 mol/L NaNO
3
and 25°C, after 4
weeks equilibration time with 25 ppm [Cu]
total
. Symbols are data
points, lines are DLM fits showing total and individual surface species.
Solid line
⫽ tridentate-dimer complex; dashed line ⫽ bidentate-mono-
nuclear complex. Note that the concentration of copper due to the
tridentate-dimer complex is twice that represented by the individual
surface species solid line.
Fig. 4. Adsorption of copper(II) ions to hematite (
␣-Fe
2
O
3
, 3.33 g/L)
as a function of pH at I
⫽ 0.1 mol/L NaNO
3
and 25°C, after 4 weeks
equilibration time with 25 ppm [Cu]
total
. Symbols are data points, lines
are DLM fits showing total and individual surface species. Solid line
⫽
tridentate-dimer complex; dashed line
⫽ bidentate-mononuclear com-
plex. Note that the concentration of copper due to the tridentate-dimer
complex is twice that represented by the individual surface species
solid line.
Fig. 5. Adsorption of copper(II) ions to lepidocrocite (
␥-FeOOH,
3.33 g/L) as a function of pH at I
⫽ 0.1 mol/L NaNO
3
and 25°C, after
4 weeks equilibration time with 25 ppm [Cu]
total
. Symbols are data
points, lines are DLM fits showing total and individual surface species.
Solid line
⫽ tridentate-dimer complex; dashed line ⫽ bidentate-mono-
nuclear complex. Note that the concentration of copper due to the
tridentate-dimer complex is twice that represented by the individual
surface species solid line.
2626
C. L. Peacock and D. M. Sherman
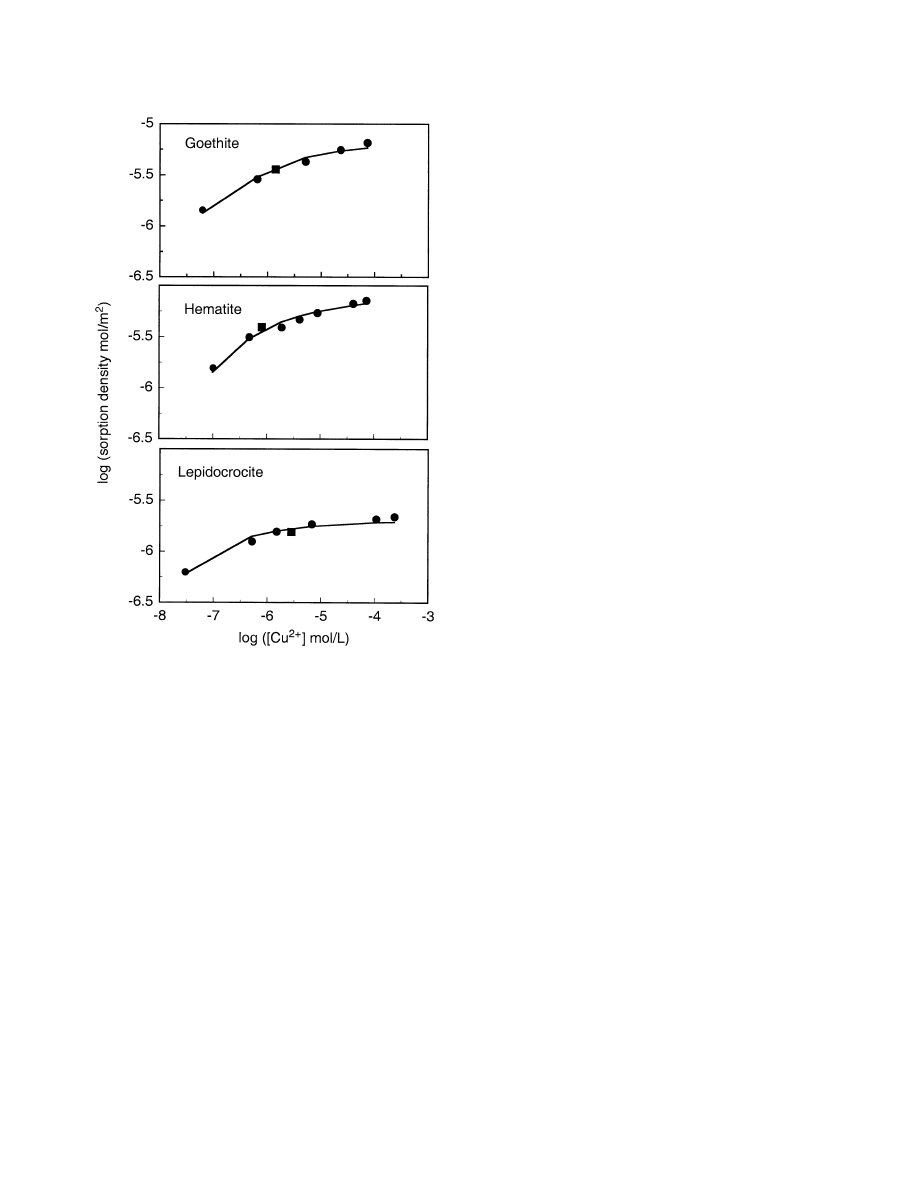
conditions, the surface density of “sorbed” ions does not in-
crease sharply with [Cu
2
⫹
] (
). A sharp increase in [Cu
2
⫹
]
at log [Cu
2
⫹
] mol/L
⬃⫺4.8 to ⫺4.5 would be expected if
precipitation of Cu(OH)
2
(s) was occurring. This is contrary to
the results of
Karthikeyan and Elliott (1999)
and
for Cu
2
⫹
adsorption on HFO where constant pH
isotherm data (pH 6.9) clearly showed a sharp increase in the
surface density of adsorbed ions at
⬃3.58 ppm [Cu
2
⫹
]. The
absence of Cu(OH)
2
(s) precipitation in our experiments at [Cu]
⫽ 3.58 ppm presumably reflects the somewhat lower pH (6.5
vs. 6.9) at which we measured the isotherms.
Following
Karthikeyan and Elliott (1999)
, we plot data
points (square) on the goethite, hematite and lepidocrocite
constant pH isotherms (
) corresponding to the adsorption
pH edge condition at pH
⬃6.5 represented in
and
, respectively. These points lie in the region assigned as being
dominated by adsorption (
) and
furthermore are well below the [Cu
2
⫹
] required for the precip-
itation of Cu(OH)
2
(s).
Karthikeyan and Elliott (1999)
and
successfully modeled their constant pH isotherm and pH edge
data with the surface precipitation model including the forma-
tion of Cu(OH)
2
(s). However,
Karthikeyan and Elliott (1999)
noted that interaction between Cu and HFO could be dominated
by surface precipitation reactions or sorption of polymeric
species.
,b) also noted the need for
multinuclear complexes to explain adsorption at moderate to
high surface coverages.
As discussed below, EXAFS spectra are consistent with the
absence of precipitation on the mineral surface, at least up to
pH 6.5, in the constant pH isotherm (and pH edge) experiments.
Our constant pH isotherm and pH edge data can, therefore, be
used to develop a surface complexation model rather than a
surface precipitation model as employed by
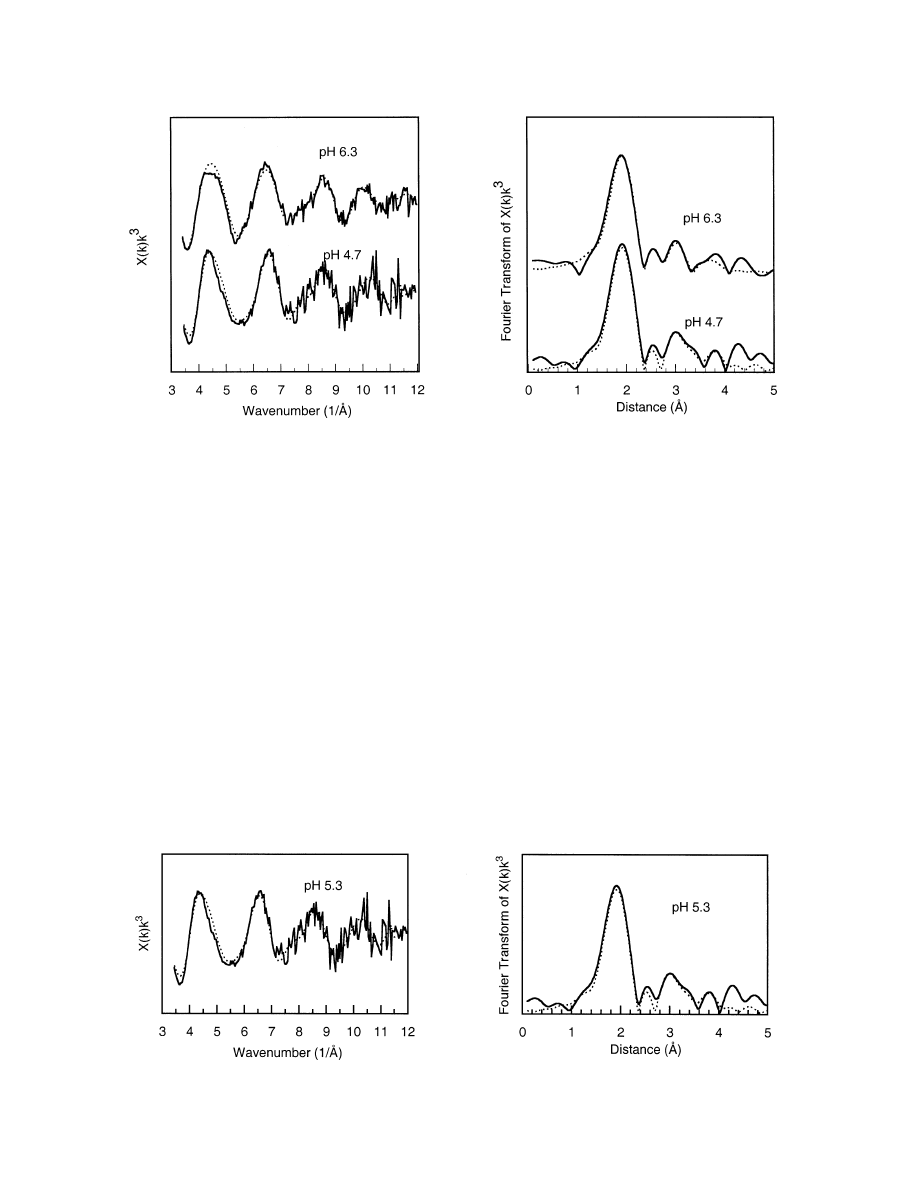
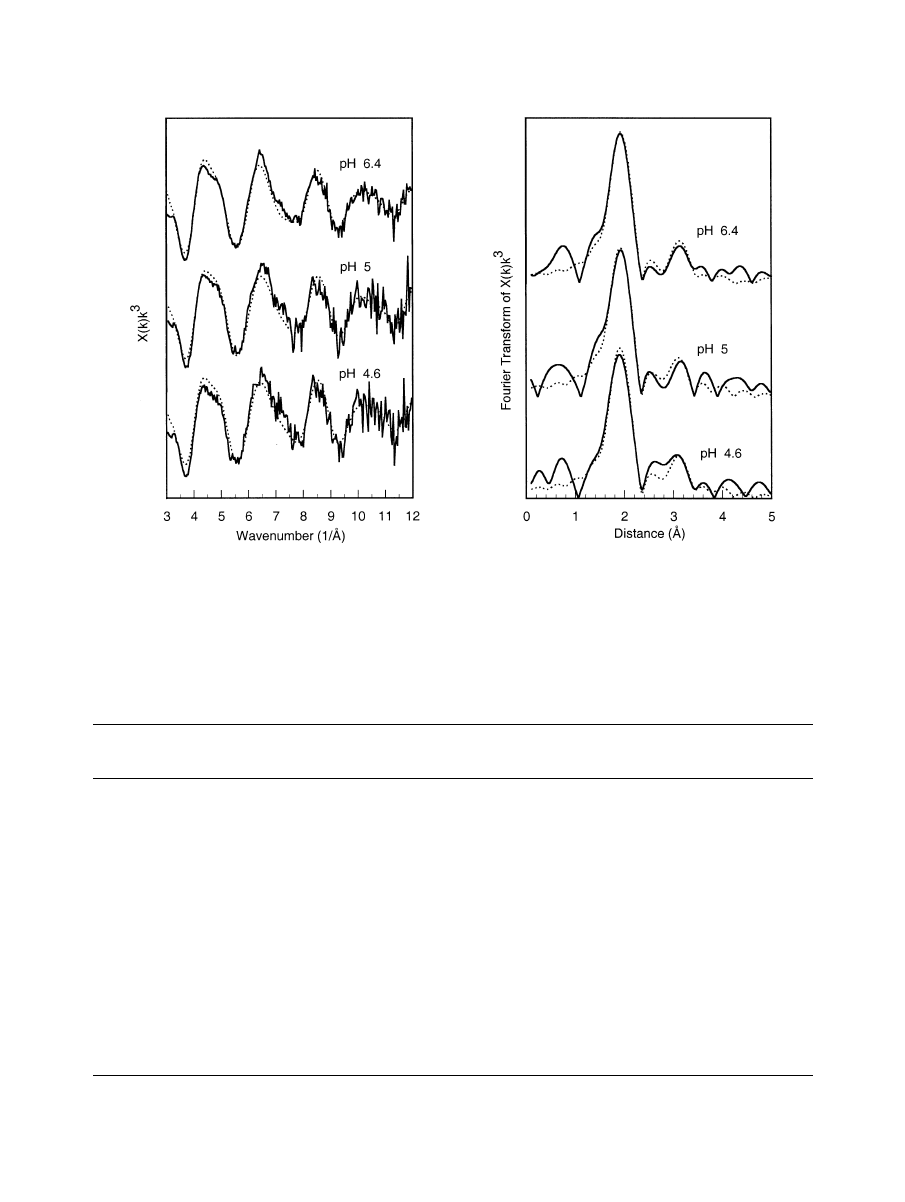
3.1.3. Cu K-edge EXAFS Spectroscopy and Ab Initio
Molecular Geometries
Cu K-edge EXAFS (and Fourier transforms of the EXAFS)
for wet-paste goethite hematite and lepidocrocite adsorption
samples are shown in
and
, respectively, and
summarized in
. Note, again, that we are fitting the
spectra in terms of single-atom shells in a cluster with C
1
symmetry to allow for self-consistent inclusion of multiple
scattering. At pH
⬃4, 5 and 6 we find the copper first-shell
coordination environment to have 4.0 O at
⬃1.85–2.05 A˚
consistent with the protonated square-planar (CuO
4
H
n
)
n-6
ion.
This is expected given the Jahn-Teller distortion of the d
9
Cu
2
⫹
ion. The range of Cu-O distances and small Debye-Waller
factors of the O shells may be an artifact of fitting the four
oxygens to four distinct shells. Attempts to constrain the Cu-O
distances to be equal (but with larger Debye-Waller factors)
gave less satisfactory fits. The ab initio geometries (discussed
below) predict that the four shortest Cu-O bond lengths in the
surface complexes range from 1.92 to 2.12 A
˚ . Inclusion of an
axial oxygen with a larger distance and Debye-Waller factor
than the equatorial oxygens in the Cu coordination shell gives
a slight improvement to the fits.
Beyond the oxygen shells, we find 1.0 next-nearest-neighbor
atoms (Cu or Fe) at
⬃2.9 A˚. We interpret the 2.9 A˚ distance to
result from polymerization of (CuO
4
H
n
)
n-6
complexes to give
(Cu
2
O
6
H
n
)
n
⫺8
dimers. We find an additional next-nearest-
neighbor shell corresponding to 2 Fe atoms at a distance of
3.2–3.4 A
˚ . Note that we constrained the Debye-Waller factors
to be constant for the 2.9 and 3.2–3.4 A
˚ shells. We interpret
these distances as resulting from bidentate corner-sharing be-
tween (CuO
4
H
n
)
n-6
complexes and edge-sharing Fe(O,OH)
6
polyhedra (
) or by tridentate corner-sharing between
(Cu
2
O
6
H
n
)
n-8
dimers and three edge-sharing Fe(O,OH)
6
poly-
hedra (
The features in the Fourier transform of the EXAFS at
distances greater than 3.5 A
˚ appear to result from multiple
scattering. We are able to model the first peak (near 3.9 A
˚ )
fairly well using paths including only 3 atoms. The peaks at
greater distances (
⬎4.0 A˚) cannot be very accurately modeled
in terms of multiple scattering within the small cluster used
here (
). Some of this structure is also due to noise. Surface
complexes resulting from monodentate corner-sharing between
(CuO
4
H
n
)
n-6
and Fe(O,OH)
6
polyhedra would give Cu-Fe dis-
tances greater than 3.7 A
˚ . That such distances in the Fourier
Fig. 6. Adsorption of copper(II) ions to goethite, hematite and
lepidocrocite (3.33 g/L) at pH 6.5 (constant), I
⫽ 0.1 mol/L NaNO
3
,
and 25°C, after 4 weeks equilibration time with 10 –50 ppm [Cu]
total
.
Symbols are data points; lines are DLM fits showing total surface
species.
2627
Surface complexation of Cu
transform can be modeled in terms of multiple scattering sug-
gests that monodentate surface complexes are not important.
However, we cannot completely rule out monodentate com-
plexes.
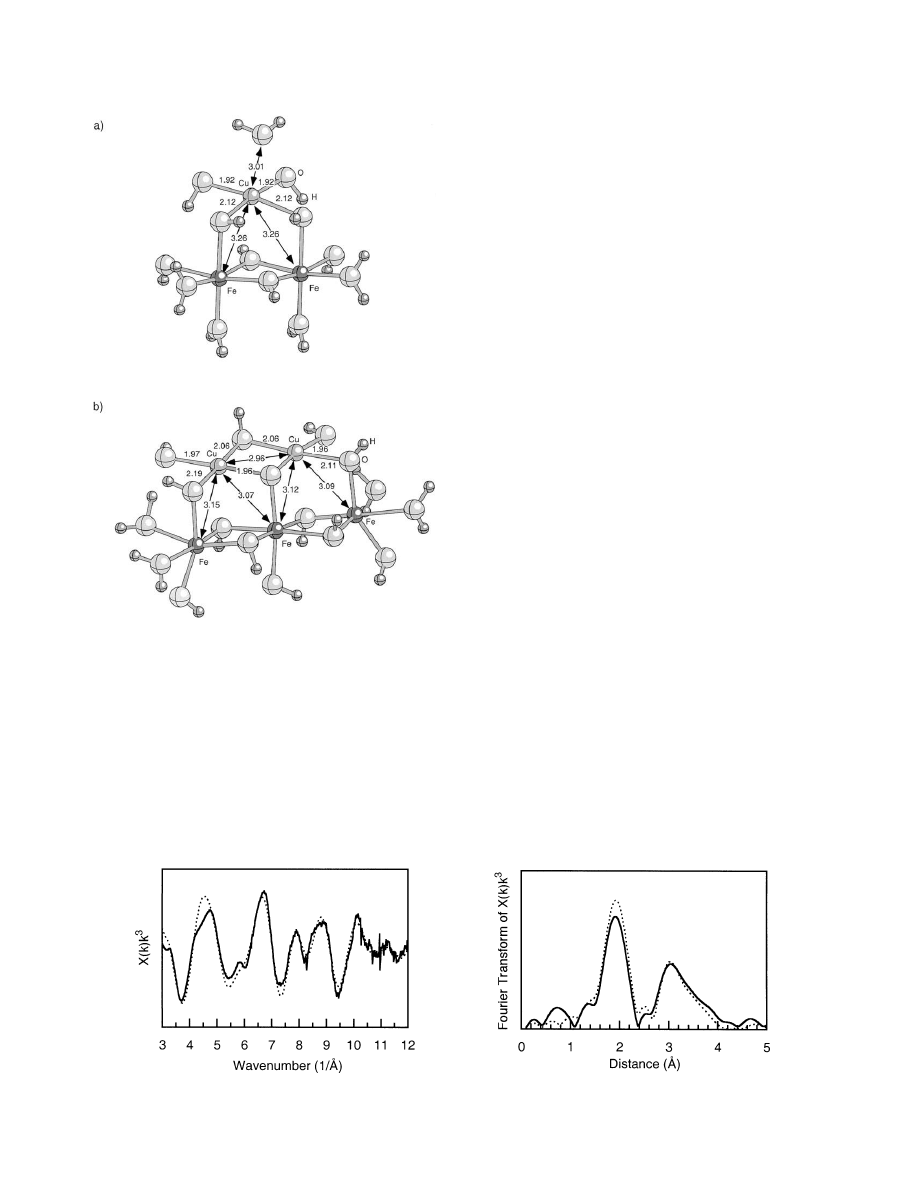
To help verify the structural models for the surface com-
plexes, we calculated the optimized geometries for clusters
analogous to bidentate mononuclear corner-sharing and biden-
tate binuclear corner-sharing surface complexes (
, respectively) using density functional theory. The ab initio
predicted bond lengths (
) are in reasonable agreement
with those observed via EXAFS for Cu adsorption on goethite,
hematite and lepidocrocite (
). Based on the effect of
protonation on bond lengths, we propose the dimer to be
protonated as Cu
2
O(OH)
5
3
⫺
Surface complexes analogous to those predicted with ab
initio calculations are able to occur on the {100} and {101}
faces of goethite (setting Pnma); the {110} and imperfect
{001} faces of hematite (R-3c) and the {001} face of lepido-
crocite (setting Cmc2
1
). Note that we are using the standard
space-group settings; our notation differs from that of other
authors (e.g.,
Hiemstra and van Riemsdijk, 1996; Venema et
) for goethite and lepidocrocite.
With the results from our EXAFS spectroscopy we cannot
rule out the possibility of bidentate edge-sharing between
(CuO
4
H
n
)
n-6
and two oxygens on a single Fe site (e.g., at the
{210} and {010} faces of goethite). An ab initio calculation,
however, shows that a cluster analogous to the edge-sharing
complex is somewhat less stable (15 kJ/mole) than the cluster
analogous to the bidentate corner-sharing complex (
Moreover, as is discussed below, the {210} and {010} faces in
goethite comprise a very small fraction of the total surface area;
the number of FeOH(H) sites due to these faces is not high
enough to account for all the sorption displayed in our edges
and isotherms. We show below that it is, in fact, unnecessary to
include {210} and {010} edge-sharing FeOH(H) sites in the
value for active surface site density as all the adsorption can be
comfortably modeled with just corner-sharing FeOH(H) sites
present on the {101} and {100} faces of goethite.
EXAFS data for synthetic Cu(OH)
2
, shown in
and
summarized in
, were fit according to the structural
Fig. 7. EXAFS and Fourier transform of EXAFS for Cu(II) on goethite adsorption samples equilibrated with 25 ppm
[Cu]
total
.
Fig. 8. EXAFS and Fourier transform of EXAFS for Cu(II) on hematite adsorption samples equilibrated with 25 ppm
[Cu]
total
.
2628
C. L. Peacock and D. M. Sherman
model of
. The local structural environment
of Cu in Cu(OH)
2
is similar to that of Cu sorbed onto FeOOH/
Fe
2
O
3
. However, we believe that the EXAFS confirm the
absence of Cu(OH)
2
on the sorption samples: Using the same
Debye-Waller factors as in Cu(OH)
2
, we find only 1.0 (
⫾ 0.5)
Cu neighbors at 2.9 –3.0 A
˚ and 2.0 (
⫾ 0.5) Fe at 3.2–3.4 A˚ in
the Cu sorption samples. Note also that the EXAFS of the
Cu-FeOOH samples at pH 6.3– 6.4 are identical to those at pH
Fig. 9. EXAFS and Fourier transform of EXAFS for Cu(II) on lepidocrocite adsorption samples equilibrated with 25 ppm
[Cu]
total
.
Table 1. Multiple scattering EXAFS fits for Cu(II) sorbed to goethite, hematite, and lepidocrocite.
a
pH
(wt %Cu)
N
O
,
R(Cu-O
1
)
N
O
,
R(Cu-O
2
)
N
O
,
R(Cu-O
3
)
N
O
,
R(Cu-O
4
)
N
O
,
R(Cu-O
5
)
N
Cu
,
R(Cu-Cu)
N
Fe
,
R(Cu-Fe
1
)
N
Fe
,
R(Cu-Fe
2
)
X
2
(R %)
(2
2
)
(2
2
)
(2
2
)
(2
2
)
(2
2
)
(2
2
)
(2
2
)
(2
2
)
Goethite
4.7
1.0
1.0
1.0
1.0
1.0
0.9
1.3
1.2
2.52
(0.38)
1.86
1.98
2.00
2.11
2.29
2.97
3.14
3.33
(27.4)
(0.001)
(0.005)
(0.001)
(0.007)
(0.013)
(0.013)
(0.015)
(0.015)
6.3
1.0
1.0
1.0
1.0
1.0
1.0
1.6
1.2
2.23
(0.75)
1.87
1.98
2.00
2.09
2.29
2.99
3.21
3.41
(24.8)
(0.002)
(0.005)
(0.002)
(0.005)
(0.013)
(0.010)
(0.015)
(0.015)
Hematite
5.3
1.0
1.0
1.0
1.0
1.0
1.0
1.0
1.0
5.67
(0.73)
1.89
1.96
2.00
2.10
2.31
2.93
3.14
3.41
(35.7)
(0.001)
(0.007)
(0.001)
(0.001)
(0.004)
(0.010)
(0.015)
(0.015)
Lepidocrocite
4.6
1.0
1.0
1.0
1.0
1.0
1.0
1.0
1.0
5.14
(0.20)
1.86
1.95
1.99
2.06
2.29
3.02
3.09
3.24
(41.0)
(0.003)
(0.002)
(0.002)
(0.009)
(0.010)
(0.015)
(0.015)
(0.015)
5.0
1.0
1.0
1.0
1.0
1.0
1.0
1.0
1.0
4.31
(0.43)
1.84
1.95
1.98
2.05
2.28
3.01
3.09
3.25
(36.9)
(0.003)
(0.001)
(0.001)
(0.012)
(0.015)
(0.015)
(0.015)
(0.015)
6.4
1.0
1.0
1.0
1.0
1.0
1.0
1.0
1.0
2.41
(0.75)
1.86
1.94
2.01
2.02
2.26
3.07
3.03
3.24
(26.7)
(0.007)
(0.001)
(0.01)
(0.001)
(0.019)
(0.015)
(0.015)
(0.015)
a
Values in italics were constrained during fitting. R is distance in Å; 2
2
is Debye-Waller factor in Å
2
; N
A
is number of atoms of type A.
2629
Surface complexation of Cu
4.6 – 4.7 (where the system is unsaturated in Cu(OH)
2
). Con-
sequently, we argue that the EXAFS data indicate that Cu(OH)
2
has not precipitated on iron (hydr)oxide surfaces. Again, the
absence of Cu(OH)
2
precipitation is indicated by the sorption
isotherms at pH 6.5 discussed above. As will be shown below,
the surface complexation model obtained by fitting the sorption
edges is consistent with the complexes shown in
3.2. Surface Complexation Modeling
3.2.1. Equilibria at the Mineral Surface
The goethite, hematite and lepidocrocite mineral surfaces
were modeled using the single-site 2-pK model, where the
single surface adsorption site may exist in one of three proto-
nation states;
§SOH
2
⫹
,
§SOH and §SO
⫺
. A homogeneous min-
eral surface with only one type of active surface functional
group is assumed. Surface acidity constants are assigned to the
reactions:
§SOH
⫹ H
⫹
⫽ §SOH
2
⫹
log K
a1
(2)
§SOH
⫽ §SO
⫺
⫹ H
⫹
log K
a2
,
(3)
where S is a nonspecific surface metal ion and
§SOH
2
⫹
,
§SOH
and
§SO
⫺
are representative surface species.
The amphoteric treatment of a single surface site is generally
recognized as a convenient modeling framework rather than a
precise representation of actual functional groups existing at
the mineral surface (
). For iron oxyhydrox-
ides in particular, a crystallographic consideration of the
cleaved mineral surface (
) shows sur-
face oxide ions to be coordinated by up to three metal ions. As
such, reactions (2) and (3) underestimate somewhat the com-
plexity of a mineral surface. However, there has been consid-
erable success in modeling cation (and anion) sorption under
this construct, especially when a single-site multispecies ap-
proach is applied (e.g., using the CCM:
using the DLM:
; using the TLM:
). Recently, cation sorption data, previously
modeled in a two-site or multisite approach, has been success-
fully remodeled in a single-site (multispecies) extended TLM
framework (
Criscenti and Sverjensky, 2002
The DLM (
Leckie, 1987; Hayes et al., 1988
) were used to describe the
electric double layer properties of the mineral surfaces. Mineral
surface area was determined by BET analysis. Active surface
site density was determined by a crystallographic consideration
of the mineral surface and by fitting potentiometric titration
data. Surface complexation involving ions of the background
electrolyte was considered within the TLM framework, where
NO
3
⫺
and Na
⫹
were allowed to form outer sphere complexes at
the
 plane (Eqns. 4 and 5,
Fig. 10. Cu(II) ab initio molecular geometry clusters. (a) Bidentate
corner-sharing mononuclear cluster. (b) Tridentate corner-sharing binu-
clear cluster. Bond lengths shown in A
˚ . Both clusters give Cu-Fe and
Cu-O bond lengths in good agreement with those observed in the
EXAFS.
Fig. 11. EXAFS and Fourier transform of EXAFS for synthetic Cu(OH)
2
.
2630
C. L. Peacock and D. M. Sherman

3.2.2. Modeling Potentiometric Titration Data
The DLM has three adjustable model parameters: a surface
site density and two acidity constants. For hematite, we fixed
the site density at the value (7.5 sites/nm
2
) proposed by
. (This value is consistent with the site density
estimated by modeling competitive sorption experiments for
Cu and Pb on hematite;
.) For
goethite, there are 3.03 FeO sites/nm
2
on {101} and 7.19 FeO
sites/nm
2
on {100}. We arbitrarily fixed the site density at an
average value of 6 sites/nm
2
. Note that this is the same as that
proposed by
Hiemstra and van Riemsdijk (1996)
for the total
active surface site density. However, they arrived at this value
by including the triply coordinated oxygens on {101} (which
we assume are not involved in copper surface complexation)
and neglecting the {100} surface. The values used for the
surface site densities are consistent with what would be ex-
pected given the dominant crystal faces of the typical crystal
morphologies. We then fit the potentiometric titration data to
derive the surface acidity constants (Eqns. 2 and 3,
For lepidocrocite, we fit the total surface site density following
the method of
. The lepidocrocite sensitivity
analysis yielded a unique set of parameter values for the surface
acidity constants (Eqns. 2 and 3,
) at the value of surface
site density to produce the lowest goodness of fit parameter
(V(Y)).
The TLM has six fitting parameters: site density, four equi-
librium constants (two surface acidity constants and two elec-
trolyte binding constants), and the capacitance of the inner
Helmholtz plane, C
1
. The capacitance of the outer Helmholtz
plane (C
2
) was assumed to be 0.2 F/m
2
following
) and
Attempts to simultaneously fit all parameters did not converge;
thus we adopted the modeling approach of
We determined a unique set of parameter values for goethite
and hematite by fixing the site densities (as before) and the
surface acidity constants (Eqn. 2 and 3,
) and fitting for
capacitance C
1
and electrolyte binding constants (Eqn. 4 and 5,
). Surface acidity constants were then varied according
to
⌬pK
a
(
⫺[(Log K
⫺
)
⫹ (Log K
⫹
)]) to find the value of the
electrolyte binding constants at the largest
⌬pK
a
to cause no
change in the goodness of fit parameter (V(Y)).
include a detailed description of the procedure. Unique
Table 2. Multiple-scattering EXAFS parameters for Cu(OH)
2
.
a
N
O
,
R(Cu-O
1
)
N
O
,
R(Cu-O
2
)
N
O
,
R(Cu-O
3
)
N
O
,
R(Cu-O
4
)
N
Cu
,
R(Cu-Cu)
N
Cu
,
R(Cu-Cu)
N
Fe
,
R(Cu-Cu)
N
Fe
,
R(Cu-Cu)
X
2
(R %)
(2
2
)
(2
2
)
(2
2
)
(2
2
)
(2
2
)
(2
2
)
(2
2
)
(2
2
)
1.0
1.0
1.0
1.0
1.0
1.0
2.0
2.0
0.76
1.86
1.95
1.95
2.01
2.92
2.99
3.23
3.38
(32.0)
(0.001)
(0.009)
(0.006)
(0.005)
(0.015)
(0.015)
(0.009)
(0.010)
a
Values in italics were constrained during fitting. R is distance in Å; 2
2
is Debye-Waller factor in Å
2
; N
A
is number of atoms of type A.
Table 3. Mineral-Cu surface complexation model reactions.
Mineral surface
Species
Mass action relation
Equilibrium constant
1) SOH
SOH
—
2) SOH
2
⫹
SOH
⫹ H
⫹
⫽ SOH
2
⫹
K
a1
3) SO
⫺
SOH
⫽ SO
⫺
⫹ H
⫹
K
a2
4) SO
⫺
⫺ Na
⫹
SOH
⫹ Na
⫹
⫽ SO
⫺
⫺ Na
⫹
⫹ H
⫹
K
cat
5) SOH
2
⫹
⫺ NO
3
⫺
SOH
⫹ NO
3
⫺
⫹ H
⫹
⫽ SOH
2
⫹
⫺ NO
3
⫺
K
an
Cu(II)
Solution speciation
6) CuOH
⫹
Cu
2
⫹
⫹ H
2
O
⫽ CuOH
⫹
⫹ H
⫹
K
Hyd.1
(10
⫺8.2
)
a
7) Cu
2
(OH)
2
2
⫹
2Cu
2
⫹
⫹ 2H
2
O
⫽ Cu
2
(OH)
2
2
⫹
⫹ 2H
⫹
K
Hyd.2
(10
⫺10.59
)
a
8) Cu(OH)
2
Cu
2
⫹
⫹ 2H
2
O
⫽ Cu(OH)
2
⫹ 2H
⫹
K
Hyd.3
(10
⫺17.5
)
a
9) H
2
O
H
2
O
⫽ 2OH
⫺
⫹ H
⫹
K
W
(10
⫺13.79
)
b
Hypothetical surface complexes
10) SOCu
⫹
SOH
⫹ Cu
2
⫹
⫽ SOCu
⫹
⫹ H
⫹
K
10
11) SOHCu
2
⫹
SOH
⫹ Cu
2
⫹
⫽ SOHCu
2
⫹
K
11
12) SOCuOH
0
SOH
⫹ Cu
2
⫹
⫹ H
2
O
⫽ SOCuOH
0
⫹ 2H
⫹
K
12
13) SOHCuOH
⫹
SOH
⫹ Cu
2
⫹
⫹ H
2
O
⫽ SOHCuOH
⫹
⫹ H
⫹
K
13
14) (SOH)
2
Cu(OH)
2
0
2SOH
⫹ Cu
2
⫹
⫹ 2H
2
O
⫽ (SOH)
2
Cu(OH)
2
0
⫹ 2H
⫹
K
14
15) SOCu
2
(OH)
2
⫹
SOH
⫹ 2Cu
2
⫹
⫹ 2H
2
O
⫽ SOCu
2
(OH)
2
⫹ 3H
⫹
K
15
16) S
2
O
2
Cu
2
(OH)
2
(OH)
2
)
2
0
2SOH
⫹ 2Cu
2
⫹
⫹ 4H
2
O
⫽ S
2
O
2
Cu
2
(OH)
2
(OH
2
)
2
0
⫹ 4H
⫹
K
16
17) (SOH)
2
Cu
2
(OH)
2
(OH
2
)
2
2
⫹
2SOH
⫹ 2Cu
2
⫹
⫹ 4H
2
O
⫽ (SOH)
2
Cu
2
(OH)
2
(OH
2
)
2
2
⫹
⫹ 2H
⫹
K
17
18) (S
3
O(OH)
2
)Cu
2
(OH)
3
0
3SOH
⫹ 2Cu
2
⫹
⫹ 3H
2
O
⫽ (S
3
O(OH)
2
)Cu
2
(OH)
3
0
⫹ 4H
⫹
K
18
a
From
b
From Gunnarsson et al. (2000).
2631
Surface complexation of Cu
parameter values for lepidocrocite were determined by the
same method but with an additional step at the beginning of the
sensitivity analysis to find the optimal surface site density
value. (Briefly, we fixed the surface acidity constants (Eqn. 2
and 3,
) and fit for surface site density and electrolyte
binding constants (Eqn. 4 and 5,
). Surface site density
was then fixed at the optimal value and the analysis method
followed as for goethite and hematite.
include a detailed description of the procedure).
In passing, we find that fitting for goethite and hematite
surface site density in both the DLM and TLM (following the
method of
) produces values similar (within
1.5 sites/nm
2
) to those expected from crystallographic consid-
erations. Our optimal value for lepidocrocite surface site den-
sity (
) is also consistent with those previously reported
(e.g., 1.67 sites/nm
2
,
Optimized acid-base parameter combinations are listed in
and the potentiometric titration data with model fits
shown on
and
. The experimental pH
PZC
(the
pH where the surface charge is zero) for goethite, hematite and
lepidocrocite is the same (
⫾ 0.03 pH units for goethite, ⫾ 0.01
pH units for hematite,
⫾ 0.1 pH units for lepidocrocite) for all
three ionic strengths measured. We report pH
PZC
values of 8.5,
8.8 and 7.7 for goethite, hematite and lepidocrocite, respec-
tively. These values lie within the range of reported experimen-
tal values (
⬃7.5–9.5 for goethite and hematite and ⬃7–8 for
lepidocrocite). Model fits of the acid-base data (
) show the TLM produces a very good replication of the data;
the DLM fit is less satisfactory.
3.2.3. Modeling Cu Adsorption Data
The observed copper adsorption data was replicated in the
DLM and TLM using the optimized acid-base parameter com-
binations (
). Equilibria for reactions occurring in solu-
tion (Eqns. 6 – 8,
) were taken from
which provides an internally consistent set of stability
constants that includes the dimer complexes that form in solu-
tion.
3.2.4. Cu
2
⫹
Complexation at the Surface of Goethite,
Hematite, and Lepidocrocite
A number of possible surface complexes (Eqns. 10 –18,
) were used in the attempt to model the observed copper
adsorption. We include multinuclear surface complexation
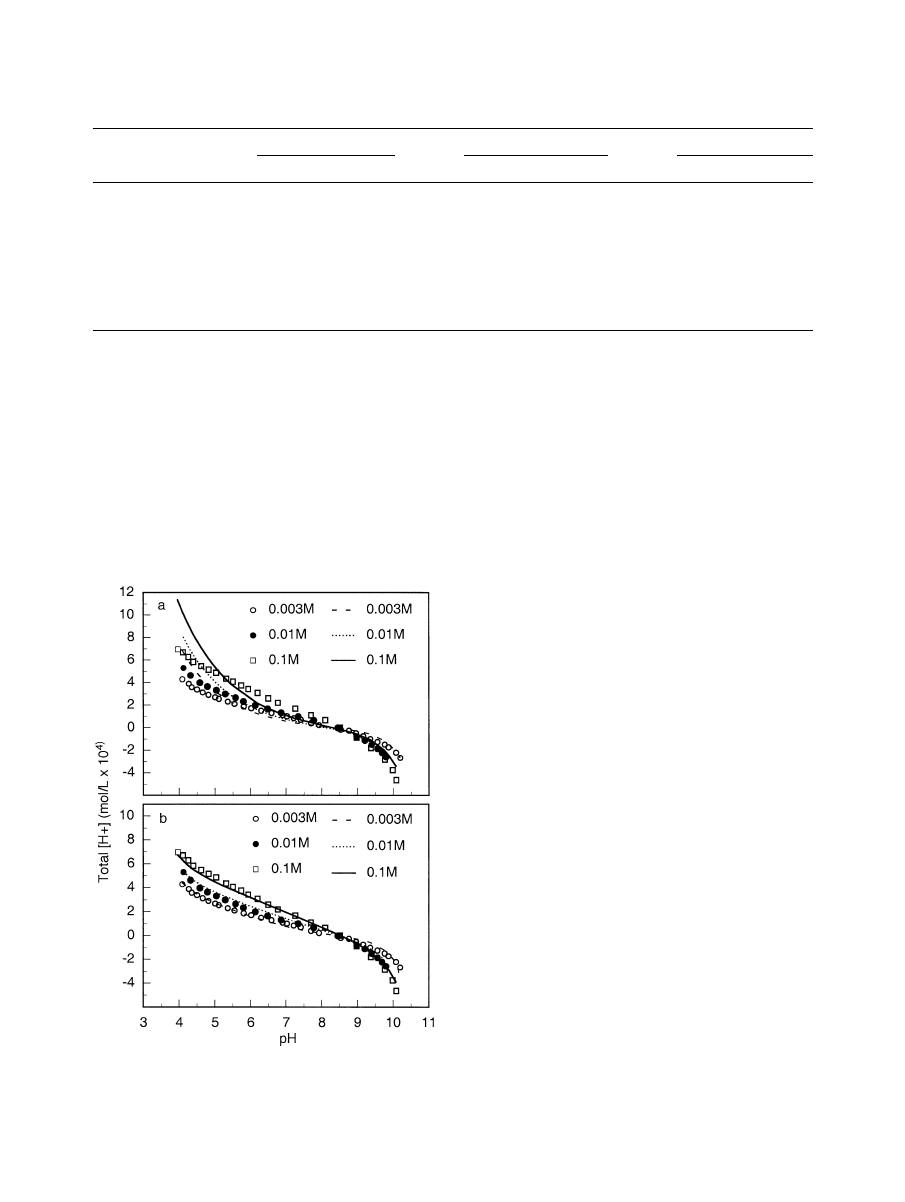
Fig. 12. Goethite potentiometric titration data at I
⫽ 0.003, 0.01 and
0.1 NaNO
3
and 25°C, shown as total [H
⫹
] in mol/L; 6.63 g/L oxide.
Symbols are data points; lines are model fits. (a) DLM. (b) TLM.
Table 4. Acid-base fits used in mineral-Cu surface complexation modeling.
TLM
Goethite
Hematite
Lepidocrocite
DLM
TLM
DLM
TLM
TLM
DLM
pH
PZC
a
8.5
8.5
8.8
8.8
7.7
7.7
surface area(m
2
/g)
b
32.73
32.73
30.02
30.02
75.24
75.24
[SOH] (sites/nm
2
)
6
c
6
c
7.5
c
7.5
c
1.6
d
1.6
d
log K
a1
d
6.78
7.50
6.90
7.80
6.93
6.69
log K
a2
d
⫺10.10
⫺9.50
⫺10.83
⫺9.80
⫺8.52
8.69
log K
an
d
8.31
8.17
8.48
log K
cat
d
⫺9.07
⫺10.02
7.18
C
1
(F/m
2
)
d
1.0
1.1
0.8
C
2
(F/m
2
)
e
0.2
0.2
0.2
V(Y)
85.0
9.8
71.0
8.0
31.2
4.7
a
Determined from potentiometric titration data (this study).
b
Determined from BET analysis (this study).
c
Determined from a crystallographic consideration of the mineral surface (
Hiemstra and van Riemsdijk, 1996
d
Determined from FITEQL simulation of potentiometric titration data (this study).
e
From
2632
C. L. Peacock and D. M. Sherman
(Eqns. 15–18,
) in our modeling based on our direct
spectroscopic evidence and ab initio predictions. This inclusion
is in keeping with that of
,b) who noted
the need for multinuclear complexes to explain adsorption at
moderate to high surface coverages. Furthermore, there is con-
siderable additional spectroscopic evidence for the formation of
surface polymers on oxide surfaces at moderate to high surface
loadings (e.g., Cu(II),
; Cr(III),
; Pb(II),
The DLM fit to the copper(II) adsorption data is shown on
and
and summarized in
. In both the DLM
and TLM, surface species 10 –18 were initially considered in a
single species framework for adsorption on goethite, hematite
and lepidocrocite between pH 2–7. In agreement with our
EXAFS measurements and ab initio calculations, the formation
of tridentate binuclear (
§Fe
3
O(OH)
2
)Cu
2
(OH)
3
0
surface com-
plexes (Eqn. 18,
) provides the best fit to the observed
copper adsorption data. We find binuclear surface complexes
account for adsorption at moderate to high surface coverages in
the higher pH range of the adsorption edges (in agreement with
). To improve the fit to the observed
copper adsorption at low surface coverage (below pH
⬃4.5) on
goethite, hematite and lepidocrocite, surface species 10 –14
were considered in conjunction with binuclear surface com-
plexes. We find this multispecies modeling approach provides
the best fit to the adsorption data (in agreement with
) by accounting for adsorption at both
high and low surface coverage in the higher and lower pH
range of the adsorption edges respectively. In light of our
EXAFS measurements and ab initio predicted geometries, we
fit
the
sorption
edges
using
the
tridentate
binuclear
(
§Fe
3
O(OH)
2
)Cu
2
(OH)
3
0
complex
3
§FeOH
⫹ 2Cu
2
⫹
⫹ 3H
2
O
⫽ 共§Fe
3
O
共OH兲
2
兲Cu
2
共OH兲
3
0
⫹ 4H
⫹
(4)
with stability constant
K
共共§Fe
3
O
共OH兲
2
兲Cu
2
共OH兲
3
0
兲
⫽
关共§Fe
3
O
共OH兲
2
兲Cu
2
共OH兲
3
0
兴关H
⫹
兴
4
关§FeOH兴
3
关Cu
2
⫹
兴
2
(5)
and the bidentate mononuclear (
§FeOH)
3
Cu(OH)
2
0
complex
2
§FeOH
⫹ Cu
2
⫹
⫹ 2H
2
O
⫽ 共§FeOH兲
2
Cu
共OH兲
2
0
⫹ 2H
⫹
(6)
with stability constant
K
共共§FeOH兲
2
Cu
共OH兲
2
0
兲 ⫽
关共§FeOH兲
2
Cu
共OH兲
2
0
兴关H
⫹
兴
2
关§FeOH兴
2
关Cu
2
⫹
兴
,
(7)
where the surface species concentrations are given in moles/kg
of water. Given the uncertainties in the coordination numbers
(1.0
⫾ 0.5) due to copper neighbors at 2.9 A˚, we cannot
accurately resolve the relative fractions of monomer vs. dimer
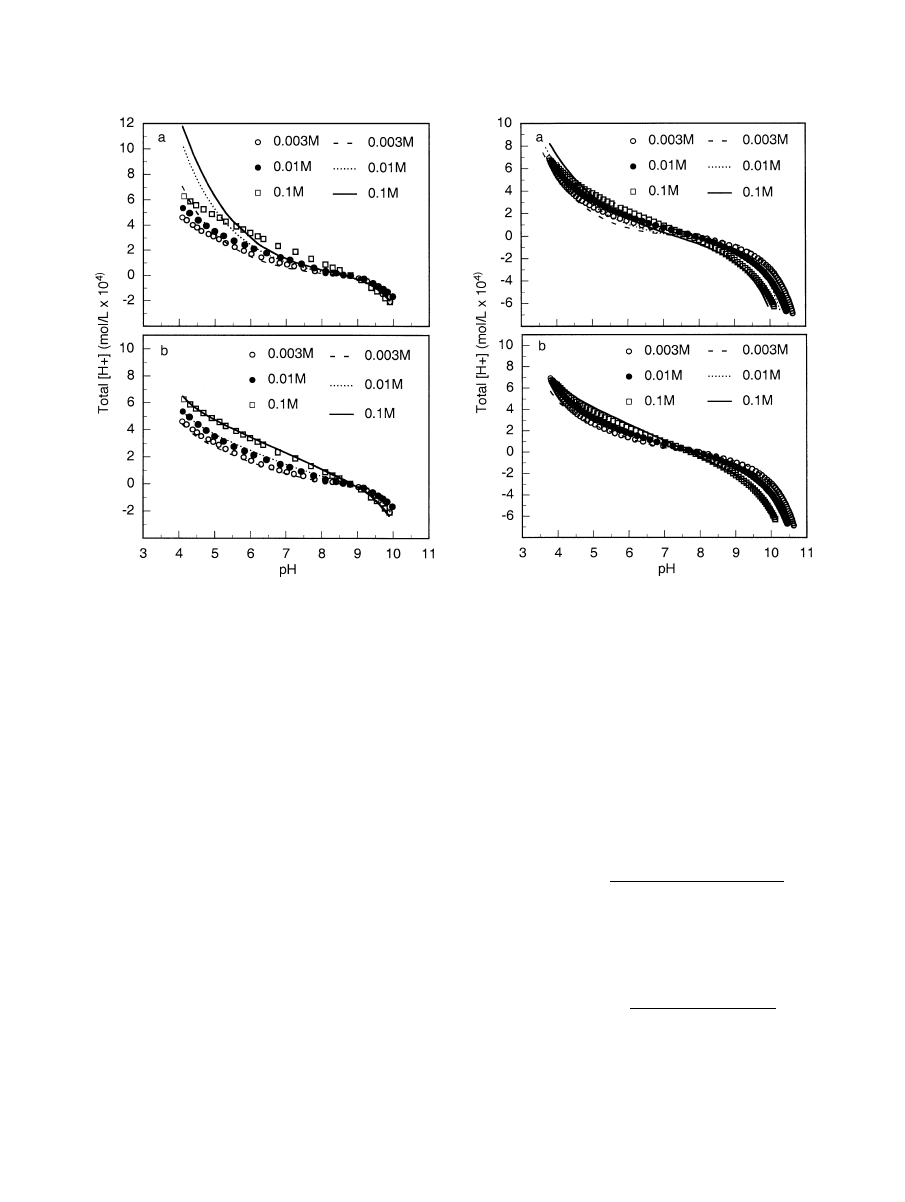
Fig. 13. Hematite potentiometric titration data at I
⫽ 0.003, 0.01 and
0.1 NaNO
3
and 25°C, shown as total [H
⫹
] in mol/L; 6.63 g/L oxide.
Symbols are data points; lines are model fits. (a) DLM. (b) TLM.
Fig. 14. Lepidocrocite potentiometric titration data at I
⫽ 0.003, 0.01
and 0.1 NaNO
3
and 25°C, shown as total [H
⫹
] in mol/L; 5 g/L oxide.
Symbols are data points; lines are model fits. (a) DLM. (b) TLM.
2633
Surface complexation of Cu

copper surface complexes using EXAFS spectroscopy. EXAFS
shows that the dimer is present down to pH 4.6 and this is
consistent with our surface complexation modeling of the sorp-
tion edges (
and
Both the DLM and the TLM successfully modeled the ob-
served copper adsorption data. We find little change in equi-
librium constants for predicted surface complexes and good-
ness of fit parameters when including outer sphere attraction of
the background electrolyte ions (see
). The fits shown
and
) are therefore those generated in the simpler
DLM modeling framework.
3.2.5. Activity Model for Surface Species
A better approach is to express the equilibrium constants in
terms of activities of surface species. If we use a hypothetical
standard state of complete coverage, then we can approximate
the activity of a surface species as being the mole fraction of
surface sites occupied by the species. In contrast, the molal
standard state requires the stability constant of a multi-dentate
surface complex to be a function of the concentration of the
sorbent.
For the tridentate-dimer complex, at complete coverage (all
surface sites used) we have
关共§Fe
3
O
共OH兲
2
兲Cu
2
共OH兲
3
0
兴 ⫽ S
tot
/ 2
so that
a
共§Fe
3
O
共OH兲
2
兲Cu
2
共OH兲
3
0
⫽ X
共§Fe
3
O
共OH兲
2
兲Cu
2
共OH兲
3
0
⫽
2
关共§Fe
3
O
共OH兲
2
兲Cu
2
共OH兲
3
0
兴
S
tot
(8)
where S
tot
is the total moles of surface sites/kg water. For the
bidentate-mononuclear complex, we have, at complete cover-
age, [(
§FeOH)
2
Cu(OH)
2
0
]
⫽ S
tot
/2 so that
a
共§FeOH兲
2
Cu
共OH兲
2
0
⫽ X
共§FeOH兲
2
Cu
共OH兲
2
0
⫽
2
关共§FeOH兲
2
Cu
共OH兲
2
0
兴
S
tot
.
(9)
(In this scheme, we require, by definition, that bidentate-mono-
nuclear complexes do not share surface hydroxyls with each
other.) The activities of the
§SOH sites will simply be their
mole fractions: X
§SOH
⫽ [§SOH]/S
tot
. The equilibrium con-
stants then become
K
共共§Fe
3
O
共OH兲
2
兲Cu
2
共OH兲
3
0
兲 ⫽
冉
S
tot
2
2
冊
X
共共§Fe
3
O
共OH兲
2
兲Cu
2
共OH兲
3
0
兲
关H
⫹
兴
4
X
§FeOH
3
关Cu
2
⫹
兴
2
(10)
K
共共§FeOH兲
2
Cu
共OH兲
2
0
兲 ⫽
冉
S
tot
2
冊
X
共§FeOH兲
2
Cu
共OH兲
2
0
关H
⫹
兴
2
X
§FeOH
2
关Cu
2
⫹
兴
(11)
3.2.6. Test of Our Surface Complexation Model
We are able to fit our constant pH isotherm data (
) to
the surface complexation model proposed for the (pH edge)
adsorption of copper to goethite, hematite and lepidocrocite.
Using the log K constants derived in the pH edge data surface
complexation modeling (
) we fit our isotherm data in
both the DLM and TLM. The DLM fits are shown on
with V(Y) at 17.5 for goethite, 14.5 for hematite and 15.2 for
lepidocrocite. Following
, theoret-
ical surface density of adsorbed ions is the sum of the densities
of the two types of surface complexes. The successful fitting of
our isotherm data to the formation of tridentate binuclear
(
§Fe
3
O(OH)
2
)Cu
2
(OH)
3
0
complexes and bidentate mononu-
clear (
§FeOH)
2
Cu(OH)
2
0
complexes is further evidence that
precipitation of Cu(OH)
2
(s) and/or CuO (s) does not contribute
to the apparent adsorption of Cu
2
⫹
to goethite, hematite and
lepidocrocite.
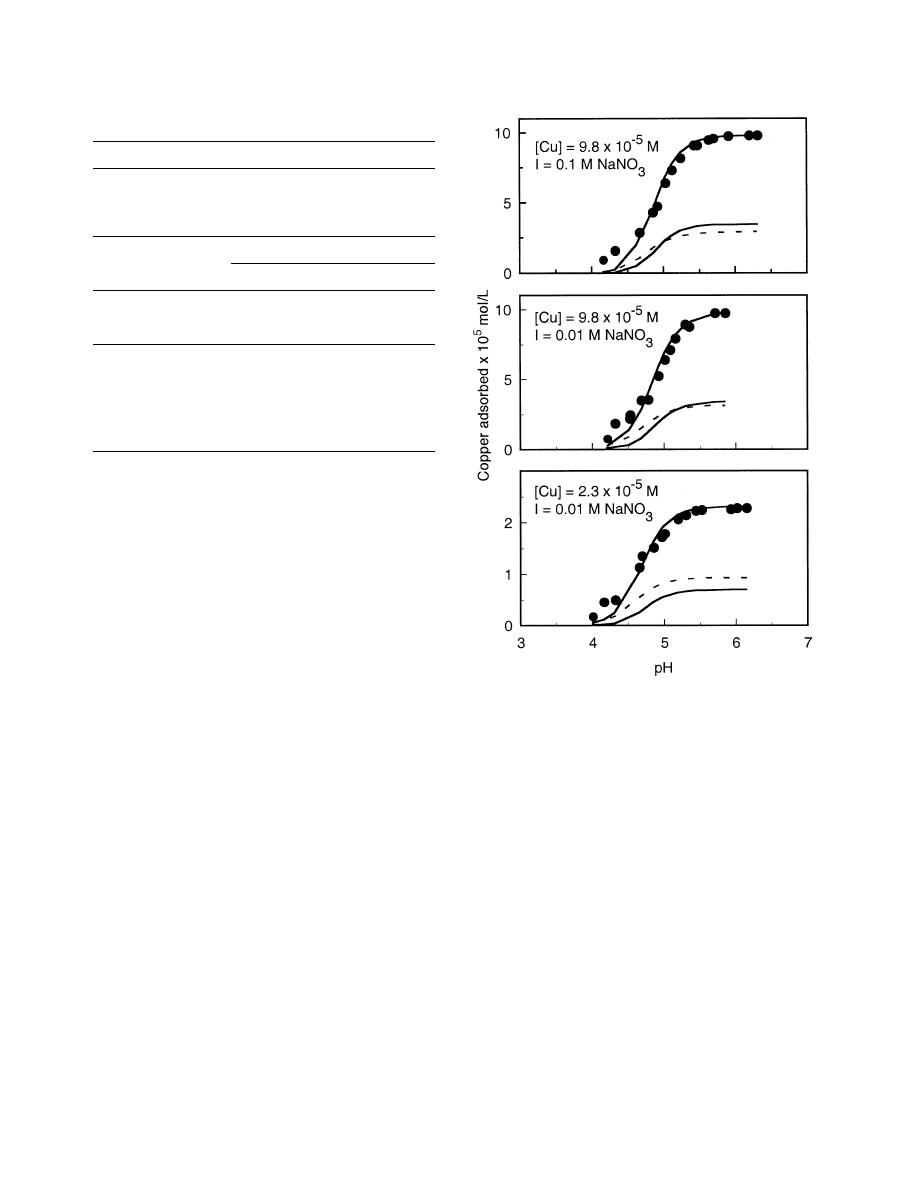
To test our surface complexation model, we have fit our
proposed surface complexes to previously published copper
adsorption data on goethite (
) at an
order of magnitude lower [Cu]
total
and an order of magnitude
lower background electrolyte concentration ([BE]). We have
modeled Cu
2
⫹
adsorption to goethite in the DLM at [Cu]
total
⫽
9.8
⫻ 10
⫺5
M, [BE]
⫽ 0.1 mol/L (G1); [Cu]
total
⫽ 9.8 ⫻ 10
⫺5
M, [BE]
⫽ 0.01 mol/L (G2); and [Cu]
total
⫽ 2.3 ⫻ 10
⫺5
M,
[BE]
⫽ 0.01 mol/L (G3). All surface complexation model
parameters were as reported by
) except goethite surface site density which we fixed at our
chosen value (6 sites/nm
2
).
We are able to fit the data of
reasonably well to the formation of tridentate binuclear
(
§Fe
3
O(OH)
2
)Cu
2
(OH)
3
0
complexes and bidentate mononu-
clear (
§FeOH)
2
Cu(OH)
2
0
complexes. The results of our mod-
eling are shown in
and summarized in
. We
find that the stability constants for the two surface complexes
are similar (within 0.65) to those predicted for our own Cu
2
⫹
goethite adsorption data (at [Cu]
total
⫽ 3.94 ⫻ 10
⫺4
M; [BE]
⫽
Table 5. Predicted complexation of Cu
2
⫹
to goethite, hematite, and lepidocrocite.
Predicted metal
complexes
Goethite
Hematite
Lepidocrocite
DLM
TLM
DLM
TLM
DLM
TLM
log K
14
a
⫺3.10
⫺3.22
⫺3.60
⫺3.55
⫺2.40
⫺2.45
log K
18
a
⫺5.25
⫺5.31
⫺5.90
⫺5.89
⫺4.23
⫺4.28
V(Y)
11.1
8.7
12.6
17.8
12.6
9.35
log K
14
: log K(SOH)
2
Cu(OH)
2
0
: 2SOH
⫹ Cu
2
⫹
⫹ 2H
2
O
⫽ (SOH)
2
Cu(OH)
2
0
⫹ 2H
⫹
log K
18
: log K(SOH)
2
SOCu
2
(OH)
3
0
: 3SOH
⫹ 2Cu
2
⫹
⫹ 3H
2
O
⫽ (SOH)
2
SOCu
2
(OH)
3
0
⫹ 4H
⫹
a
From simulation of Cu sorption data (this study).
2634
C. L. Peacock and D. M. Sherman
0.1 mol/L NaNO
3
). The low pH adsorption data (below pH 4.5)
of
is fit less well by our surface
complexation model than our own low pH Cu
2
⫹
adsorption
data. However, in the pH region comparable to that investi-
gated by EXAFS spectroscopy in this study (above pH 4.5), we
model the formation of a dimer surface complex and this is
consistent with our EXAFS results.
4. CONCLUSIONS
We measured the adsorption of Cu(II) onto goethite (
␣-
FeOOH), hematite (
␣-Fe
2
O
3
) and lepidocrocite (
␥-FeOOH) from
pH 2–7. EXAFS spectra show that Cu(II) adsorbs as (CuO
4
H
n
)
n-6
and binuclear (Cu
2
O
6
H
n
)
n-8
complexes. These form inner-sphere
complexes with the iron (hydr)oxide surfaces by corner-sharing
with two or three edge-sharing Fe(O,OH)
6
polyhedra. Our inter-
pretation of the EXAFS data is supported by ab initio (density
functional theory) geometries of analog Fe
2
(OH)
2
(H
2
O)
8
Cu(OH)
4
and Fe
3
(OH)
4
(H
2
O)
10
Cu
2
(OH)
6
clusters. We find no evidence
for surface complexes resulting from either monodentate corner-
sharing or bidentate edge-sharing between (CuO
4
H
n
)
n-6
and
Fe(O,OH)
6
polyhedra. Sorption isotherms and EXAFS spec-
tra show that surface precipitates have not formed even though
we are supersaturated with respect to CuO and Cu(OH)
2
. Hav-
ing identified the bidentate (
§FeOH)
2
Cu(OH)
2
0
and tridentate
(
§Fe
3
O(OH)
2
)Cu
2
(OH)
3
0
surface complexes, we are able to fit the
experimental copper(II) adsorption data to the reactions
3
共§FeOH兲 ⫹ 2Cu
2
⫹
⫹ 3H
2
O
⫽ 共§Fe
3
O
共OH兲
2
兲Cu
2
共OH兲
3
0
⫹ 4H
⫹
and
2
共§FeOH兲 ⫹ Cu
2
⫹
⫹ 2H
2
O
⫽ 共§FeOH兲
2
Cu
共OH兲
2
0
⫹ 2H
⫹
The two stability constants are similar for the three iron (hydr)ox-
ide phases investigated. In an encouraging test of our model we
are also able to fit copper adsorption data at an order of
magnitude lower [Cu]
total
and an order of magnitude lower
background electrolyte concentration. Our surface complex-
ation model disagrees with previous studies which invoked
monodentate surface species (e.g.,
). In those studies, monodentate
complexes were able to provide a good fit to the sorption edges.
This shows that it is difficult to unambiguously fit sorption
edges to a surface complexation model without spectroscopic
data.
Acknowledgments—Thanks are due to P. Chung Choi for assistance
with ICP-AES analysis, Paul Moir-Riche and Chris Corrigan at Dares-
bury Materials Support Laboratory for XRD, and Bob Billsborrow at
Daresbury Laboratory for support at Station 16.5. CLP was supported
by a NERC studentship.
Associate editor: D. L. Sparks
Table 6. Predicted complexation of Cu
2
⫹
to goethite (data from
Surface complexation model parameters
a
pH
PZC
8.0
⫾ 0.1
Surface area (m
2
/g)
79.4
log K
a1
7.68
log K
a2
⫺8.32
Metal complexes
Experimental conditions
G1
G2
G3
log K
14
b
⫺3.65
⫺3.60
⫺3.25
log K
18
b
⫺5.75
⫺5.90
⫺4.80
V(Y)
18.2
14.2
11.97
log K
14
: log K(SOH)
2
Cu(OH)
2
0
: 2SOH
⫹ Cu
2
⫹
⫹ 2H
2
O
⫽
(SOH)
2
Cu(OH)
2
0
⫹ 2H
⫹
log K
18
: log K(SOH)
2
SOCu
2
(OH)
3
0
: 3SOH
⫹ 2Cu
2
⫹
⫹ 3H
2
O
⫽
(SOH)
2
SOCu
2
(OH)
3
0
⫹ 4H
⫹
G1: [Cu]
total
⫽ 9.8 ⫻ 10
⫺5
M, [BE]
⫽ 0.1 M
G2: [Cu]
total
⫽ 9.8 ⫻ 10
⫺5
M, [BE]
⫽ 0.01 M
G3: [Cu]
total
⫽ 2.3 ⫻ 10
⫺5
M, [BE]
⫽ 0.01 M
a
As reported in
b
From simulation of Cu sorption data (data from
; simulation, this study).
Fig. 15. Adsorption of copper(II) ions to goethite (
␣-FeOOH, 1.6
g/L) as a function of pH. Symbols are data points (from
); lines are DLM fits (this study) showing total and
individual surface species (solid line
⫽ tridentate-dimer complex;
dashed line
⫽ bidentate-mononuclear complex). Note that the concen-
tration of copper due to the tridentate-dimer complex is twice that
represented by the individual surface species solid line.
2635
Surface complexation of Cu

REFERENCES
Ali M. A. and Dzombak D. A. (1996) Effects of simple organic acids
on sorption of Cu
2
⫹
and Ca
2
⫹
on goethite. Geochim. Cosmochim.
Acta 60, 291–304.
Angove M. J., Wells J. D., and Johnson B. B. (1999) The influence of
temperature on the adsorption of cadmium(II) and cobalt(II) on
goethite. J. Colloid Interface Sci. 211, 281–290.
Baes C. F. and Mesmer R. E. (1976) The Hydrolysis of Cations. Wiley.
Balistrieri L. S. and Murray J. W. (1982) The adsorption of Cu, Pb, Zn
and Cd on goethite from major ion seawater. Geochim. Cosmochim.
Acta 46, 1253–1265.
Bargar J. R., Brown G. E., Jr., and Parks G. A. (1997) Surface
complexation of Pb(II) at oxide-water interfaces: I. XAFS and bond-
valence determination of mononuclear and polynuclear Pb(II) sorp-
tion products on aluminium oxides. Geochim. Cosmochim. Acta 61,
2617–2637.
Binsted N. (1998) Excurv98: The Manual. Daresbury Laboratory,
Warrington, UK.
Bochatay L., Persson P., Lovgren L., and Brown G. E., Jr.. (1997)
XAFS study of Cu(II) at the water-goethite (
␣-FeOOH) interface. J.
Phy. IV 7, 819 – 820 (Colloque C2).
Bogdanov Y. A., Bortnikov N. S., Vikentev I. V., Gurvich E. G., and
Sagalevich A. M. (1997) A new type of modern mineral-forming
system: Black smokers of the hydrothermal field at 14 degrees 45
⬘N
latitude, Mid-Atlantic Ridge. Geol. Ore Dep. 39, 58 –78.
Bonnissel-Gissinger P., Alnot M., Ehrhardt J. J., and Behra P. (1998)
Surface oxidation of pyrite as a function of pH. Environ. Sci.
Technol. 32, 2839 –2845.
Boyle E. A., Sclater F. R., and Edmond J. M. (1977) The distribution
of dissolved copper in the Pacific. Earth Planet. Sci. Lett 37, 38 –54.
Buerge-Weirich D., Hari R., Xue H., Behra P., and Sigg L. (2002)
Adsorption of Cu, Cd, and Ni on goethite in the presence of natural
groundwater Ligands. Environ. Sci. Technol. 36, 328 –336.
Callender E. and Bowser C. J. (1980) Manganese and copper geochem-
istry of interstitial fluids from manganese nodule-rich pelagic sedi-
ments of the northeastern equatorial pacific ocean. Am. J. Sci. 280,
1063–1096.
Criscenti L. J. and Sverjensky D. A. (2002) A single-site model for
divalent transition and heavy metal adsorption over a range of metal
concentrations. J. Colloid Interface Sci. 253, 329 –352.
Christl I. and Kretzschmar R. (1999) Competitive sorption of copper
and lead at the oxide-water interface: Implications for surface site
density. Geochim. Cosmochim. Acta 63, 2929 –2938.
Christl I. and Kretzschmar R. (2001) Interaction of copper and fulvic
acid at the hematite-water interface. Geochim. Cosmochim. Acta 65,
3435–3442.
Davis J. A. (1982) Adsorption of natural dissolved organic matter at the
oxide/water interface. Geochim. Cosmochim. Acta 46, 2381–2393.
Dent A. J. and Mosselmans J. F. W. (1992) A Guide to EXBACK,
EXCALIB and EXCURV92. CLRC Daresbury Laboratory, War-
rington, UK.
Dzombak D. and Morel F. M. M. (1990) Surface Complexation Mod-
elling Hydrous Ferric Oxide. Wiley.
Eggleston C. M. and Stumm W. (1993) Scanning-tunneling-micros-
copy of Cr(III) chemisorbed on
␣-Fe
2
O
3
(001) surfaces from aque-
ous-solution—Direct observation of surface mobility and clustering.
Geochim. Cosmochim. Acta 57, 4843– 4850.
Elderfield H. and Schultz A. (1996) Mid-ocean ridge hydrothermal
fluxes and the chemical composition of the ocean. Annu. Rev. Earth
Planet Sci. 24, 191–224.
Farquhar M. L., Vaughan D. J., Hughes C. R., Charnock J. M., and
England K. E. R. (1997) Experimental studies of the interaction of
aqueous metal cations with mineral substrates: Lead, cadmium, and
copper with perthitic feldspar, muscovite, and biotite. Geochim.
Cosmochim. Acta 61, 3051–3064.
Feely R. A., Massoth G. J., Baker E. T., Lebon G. T., and Geiselman
T. L. (1992) Tracking the dispersal of hydrothermal plumes from the
Juan de Fuca ridge using suspended mater composition. J. Geophys.
Res. Solid Earth 97 (B3), 3457–3468.
Fendorf S. E., LaForce M. J., Li G. C., and Patterson R. R. (1997)
Pulsed-flow kinetic analysis of solid-phase transformations in min-
eral suspensions using XANES spectroscopy: Oxidation of FeS to
␥-FeOOH (abstract). Abstr. Am. Chem. Soc 214, 34-GEOC.
Fernex F., Fevrier G., Benaim J., and Arnoux A. (1992) Copper, lead
and zinc trapping in Mediterranean deep-sea sediments: Probable
coprecipitation with Mn and Fe. Chem. Geol. 98, 293–306.
Gao Y. and Mucci A. (2001) Acid base reactions, phosphate and
arsenate complexation, and their competitive adsorption at the sur-
face of goethite in 0.7 M NaCl solution. Geochim. Cosmochim. Acta.
65, 2361–2378.
Gans P. and O’Sullivan B. (2000) GLEE: A new computer program for
glass electrode evaluation. Talanta 51, 33–37.
Gunnarsson M., Jakobsson A., Ekberg S., Albinsson Y., and Ahlberg E.
(2000) Sorption studies of cobalt(II) on colloidal hematite using
potentiometry and radioactive tracer technique. J. Colloid Interface
Sci. 231, 326 –336.
Hayes K. F. and Leckie J. O. (1987) Modelling ionic-strength effects
on cation adsorption at hydrous oxide-solution interfaces. J. Colloid
Interface Sci. 115, 564 –572.
Hayes K. F., Papelis C., and Leckie J. O. (1988) Modelling ionic-
strength effects on anion adsorption at hydrous oxide-solution inter-
faces. J. Colloid Interface Sci. 125, 717–726.
Hayes K. F., Redden G., Ela W., and Leckie J. O. (1991) Surface
complexation models: An evaluation of model parameter estimation
using FITEQL and oxide mineral titration data. J. Colloid Interface
Sci. 142, 448 – 469.
Hedin L. and Lundqvist S. (1969) Effects of electron-electron and
electron-photon interactions on the one-electron states of solids.
Solid State Phys. 23, 1–181.
Herbelin A. and Westall J. (1996) A Computer Program for Determi-
nation of Chemical Equilibrium Constants from Experimental Data.
Version 3.2. Department of Chemistry, Oregon State University,
Corvallis, Oregon. 97331.
Herbert R. B. (1995) Precipitation of Fe oxyhydroxides and jarosite
from acidic groundwater. GFF 117, 81– 85.
Hiemstra T., van Riemsdijk W. H., and Bolt H. (1989a) Multisite
proton adsorption modeling at the solid/solution interface of (hydr)
oxides: A new approach. Part I. J. Colloid Interface Sci. 133,
91–104.
Hiemstra T., de Wit J. C. M., and van Riemsdijk W. H. (1989b)
Multisite proton adsorption modeling at the solid/solution interface
of (hydr) oxides: A new approach. Part II. J. Colloid Interface Sci.
133, 105–117.
Hiemstra T. and Van Riemsdijk W. H. (1996) A surface structural
approach to ion adsorption: The charge distribution (CD) model. J.
Colloid Interface Sci. 179, 488 –508.
Ikhsan J., Johnson B., and Wells J. D. (1999) A comparative study of
the adsorption of transition metals on kaolinite. J. Colloid Interface
Sci. 217, 403– 410.
Juang R. and Wu W. (2002) Adsorption of sulphate and copper(II) on
goethite in relation to the changes of zeta potentials. J. Colloid
Interface Sci. 249, 22–29.
Jung J., Cho Y., and Hahn P. (1998) Comparative study of Cu
2
⫹
adsorption on goethite, hematite and kaolinite: Mechanistic model-
ling approach. Bull. Korean. Chem. Soc. 19, 324 –327.
Katz L. E. and Hayes K. F. (1995a) Surface complexation modeling. I.
Strategy for modeling monomer complex formation at moderate
surface coverage. J. Colloid Interface Sci. 170, 477– 490.
Katz L. E. and Hayes K. F. (1995b) Surface complexation modeling. II.
Strategy for modeling polymer and precipitation reactions at high
surface coverage. J. Colloid Interface Sci. 170, 491–501.
Karthikeyan K. G. and Elliott H. A. (1999) Surface complexation
modeling of copper sorption by hydrous oxides of iron and alumi-
nium. J. Colloid Interface Sci. 220, 88 –95.
Karthikeyan K. G., Elliott H. A., and Chorover J. (1999) Role of
surface precipitation in copper sorption by the hydrous oxides of iron
and aluminium. J. Colloid Interface Sci. 209, 72–78.
Kosmulski M. (1996) Adsorption of cadmium on alumina and silica:
Analysis of the values of stability constants of surface complexes
calculated for different parameters of triple layer model. Colloids
Surf. A 117, 201–214.
Le Riche H. H. and Weir A. H. (1963) A method of studying trace
elements in soil fractions. J. Soil Sci. 14, 225–235.
2636
C. L. Peacock and D. M. Sherman

Lovgren L., Sjoberg S., and Schindler P. W. (1990) Acid/base reactions
and Al(III) complexation at the surface of goethite. Geochim. Cos-
mochim. Acta 54, 1301–1306.
Lumsdon D. G. and Evans L. J. (1994) Surface complexation model
parameters for goethite (
␣-FeOOH). J. Colloid Interface Sci. 164,
119 –125.
Nowack B., Lutzenkirchen J., Behra P., and Sigg L. (1996) Modeling
the adsorption of metal-EDTA complexes onto oxides. Environ. Sci.
Technol. 30, 2397–2405.
O
¨ hlander B., Thunberg J., Land M., Olof Ho¨glund L., and Quishang H.
(2003) Redistribution of trace metals in a mineralized spodosol due
to weathering, Liikavaara, northern Sweden. Appl. Geochem. 18,
883– 899.
O’Melia C. R. (1989) Particle-particle interactions in aquatic systems.
Colloids Surf. 39, 255–271.
Oswald H. R., Reller A., Schmalle H., and Dubler E. (1990) Structure
of copper(II) hydroxide, Cu (OH)
2
. Acta Crystall. C 46, 2279 –2284.
Palmqvist U., Ahlberg E., Lo¨vgren L., and Sjo¨berg S. (1997) In situ
voltammetric determinations of metal ions in goethite suspensions:
Single metal ion systems. J. Colloid Interface Sci. 196, 254 –266.
Parkman R. H., Charnock J. M., Bryan N. D., Livens F. R., and
Vaughan D. J. (1999) Reactions of copper and cadmium ions in
aqueous solution with goethite, lepidocrocite, mackinawite, and py-
rite. Am. Mineral. 84, 407– 419.
Perdew J. P., Chevary J. A., Vosko S. H., Jackson K. A., Pederson
M. R., Singh D. J., and Fiolhais C. (1992) Atoms, molecules, solids,
and surfaces—Applications of the generalised gradient approxima-
tion for exchange and correlation. Phy. Rev. B 46, 6671– 6687.
Robertson A. P. and Leckie J. O. (1998) Acid/base, copper binding, and
Cu
2
⫹
/H
⫹
exchange properties of goethite, an experimental and mod-
elling study. Environ. Sci. Technol. 32, 2519 –2530.
Rodda D. P., Wells J. D., and Johnson B. B. (1996) Anomalous
adsorption of copper(II) on goethite. J. Colloid Interface Sci. 184,
564 –569.
Rustad J. R., Felmy A. R., and Hay B. P. (1996) Molecular statics
calculations of proton binding to goethite surfaces: A new approach
to estimation of stability constants for multisite surface complexation
models. Geochim. Cosmochim. Acta 60, 1563–1576.
Savenko A. V. (2001) Coprecipitation of manganese, copper, zinc,
lead, and cadmium with iron hydroxide in hydrothermal plumes—
(By the data of laboratory modeling). Oceanology 41, 502–507.
Schwertmann U. and Cornell R. M. (1991) Iron Oxides in the Labo-
ratory. VCH Verlag.
Schwertmann U. and Fechter H. (1994) The formation of green rust and
its transformation to lepidocrocite. Clay Mineral. 29, 87–92.
Sherman D. M. (1985) Electronic structures of Fe
3
⫹
coordination sites
in iron oxides: Applications to spectra, bonding and magnetism.
Phys. Chem. Mineral. 12, 161–175.
Tadanier C. J. and Eick M. J. (2002) Formulating the charge-distribu-
tion multisite surface complexation model using FITEQL. Soil. Sci.
Soc. Am. J. 66, 1505–1517.
Tamura H. and Furuichi R. (1997) Adsorption affinity of divalent
heavy metal ions for metal oxides evaluated by modeling with the
Frumkin isotherm. J. Colloid Interface Sci. 195, 241–249.
te Velde G., Bickelhaupt F. M., Baerends E. J., Fonseca Guerra C., van
Gisbergen S. J. A., Snijders J. G., and Ziegler T. (2001) Chemistry
with ADF. J. Computat. Chem. 22, 931–967.
Tessier A., Rapin F., and Carignan R. (1985) Trace-metals in oxic
lake-sediments—Possible
adsorption
onto
iron
oxyhydroxide.
Geochim Cosmochim Acta 49, 183–194.
Vanos B., Visser H. J., Middelburg J. J., and Delange G. J. (1993)
Occurrence of thin, metal-rich layers in deep-sea sediments—A
geochemical characterization of copper remobilization. Deep-Sea
Res. 1 40, 1713–1730.
Venema P., Hiemstra T., Weidler P. G., and van Riemsdijk W. H.
(1998) Intrinsic proton affinity of reactive surface groups of metal
(hydr)oxides: Application to iron (hydr)oxides. J. Colloid Interface
Sci. 198, 282–295.
Vosko S. H., Wilk K., and Nusair M. (1980) Accurate spin-dependent
electron liquid correlation energy for local spin density calculations:
A critical analysis. Can. J. Phys. 1980, 1200 –1205.
Zhang Y., Charlet L., and Schindler P. W. (1992) Adsorption of
protons, Fe(II) and Al(III) on lepidocrocite (gamma-FeOOH). Col-
loids Surfaces 63, 259 –268.
2637
Surface complexation of Cu
Document Outline
- Copper(II) sorption onto goethite, hematite and lepidocrocite: A surface complexation model based on ab initio molecular geometries and EXAFS spe
Wyszukiwarka
Podobne podstrony:
positive-pytania, III, IV, V ROK, SEMESTR II, POSITIVE PSYCHOLOGY BETWEEN HAPPINESS AND GOOD LIFE, p
Cheung2011 Selected Pashto Problems II Historical Phonology 1 On Vocalism and Etyma Iran and Caucasu
Por wnanie wojskowej Enigmy z innymi maszynami szyfruj cymi II wojny wiatowej Military Enigma and ot
Basel II and Regulatory Framework for Islamic Banks
1 sem II Hall paradoxe de la cu Nieznany
The World War II Air War and the?fects of the P 51 Mustang
Analysis of Nazism, World War II, and the Holocaust
stopy Cu, Automatyka i Robotyka, Semestr II, Zasady doboru materiałów inżynierskich
Group Theory and the Rubik's Cu Nieznany
SHSBC 248 R2 12 THEORY AND PRACTICE PART II
U S Soldiers Returning From World War II and Their Problems
Basel II and Regulatory Framework for Islamic Banks
Appleton, Victor II Tom Swift Jr 001 Tom Swift and His Flying Lab William Dougherty UC
Appleton, Victor II Tom Swift Jr 021 Tom Swift and the Asteroid Pirates Jim Lawrence UC
Appleton, Victor II Tom Swift Jr 007 Tom Swift and His Diving Seacopter Jim Lawrence UC
Appleton, Victor II Tom Swift Jr 022 Tom Swift and His Repelatron Skyway Jim Lawrence UC
Appleton, Victor II Tom Swift Jr 006 Tom Swift and His Outpost in Space Jim Lawrence UC
Appleton, Victor II Tom Swift Jr 019 Tom Swift and His Triphibian Atomicar Jim Lawrence UC
więcej podobnych podstron