52/2012 - 2 April 2012
February 2012
Euro area unemployment rate at 10.8%
EU27 at 10.2%
The euro area
1
(EA17) seasonally-adjusted
2
unemployment rate
3
was 10.8% in February 2012, compared with
10.7% in January
4
. It was 10.0% in February 2011. The EU27
1
unemployment rate was 10.2% in February 2012,
compared with 10.1% in January
4
. It was 9.5% in February 2011.
Eurostat estimates that 24.550 million men and women in the EU27, of whom 17.134 million were in the euro area,
were unemployed in February 2012. Compared with January 2012, the number of persons unemployed increased
by 167 000 in the EU27 and by 162 000 in the euro area. Compared with February 2011, unemployment rose by
1.874 million in the EU27 and by 1.476 million in the euro area.
These figures are published by Eurostat, the statistical office of the European Union.
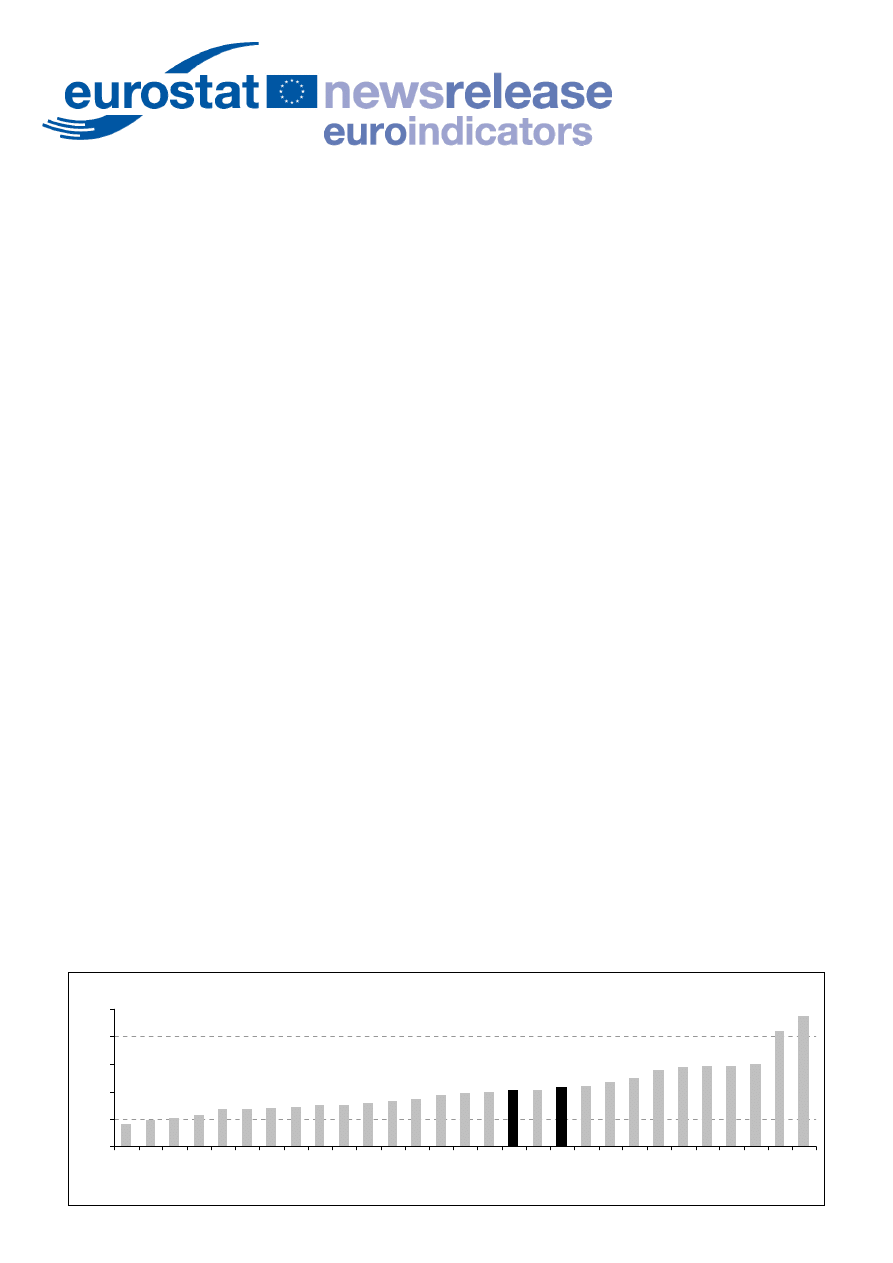
Among the Member States, the lowest unemployment rates were recorded in Austria (4.2%), the Netherlands
(4.9%), Luxembourg (5.2%) and Germany (5.7%), and the highest in Spain (23.6%) and Greece (21.0% in
December 2011).
Compared with a year ago, the unemployment rate fell in eight Member States, increased in eighteen and
remained stable in Romania. The largest falls were observed in Lithuania (17.5% to 14.3% between the fourth
quarters of 2010 and 2011), Latvia (17.0% to 14.6% between the fourth quarters of 2010 and 2011) and Estonia
(13.9% to 11.7% between the fourth quarters of 2010 and 2011). The highest increases were registered in Greece
(14.3% to 21.0% between December 2010 and December 2011), Spain (20.6% to 23.6%) and Cyprus (6.7% to
9.7%).
Between February 2011 and February 2012, the unemployment rate for males increased from 9.7% to 10.7% in the
euro area and from 9.4% to 10.1% in the EU27. The female unemployment rate rose from 10.3% to 11.0% in the
euro area and from 9.6% to 10.2% in the EU27
.
In February 2012, 5.462 million young persons (under 25) were unemployed in the EU27, of whom 3.272 million
were in the euro area. Compared with February 2011, youth unemployment increased by 262 000 in the EU27 and
by 106 000 in the euro area. In February 2012, the youth unemployment rate was 22.4% in the EU27 and 21.6% in
the euro area. In February 2011 it was 21.0% and 20.5% respectively. The lowest rates were observed in
Germany (8.2%), Austria (8.3%) and the Netherlands (9.4%), and the highest in Spain (50.5%) and Greece
(50.4% in December 2011).
In February 2012, the unemployment rate was 8.3% in the USA. In January 2012 it was 4.7% in Japan.
Unemployment rates in February 2012, seasonally adjusted
4.2
5.2 5.7
6.8 6.8 7.1 7.2 7.4
7.9 8.3 8.7
9.3 9.7
10.2
11.0 11.7
12.4
14.0 14.3 14.6
15.0
21.0
23.6
7.5
10.0
14.7
10.8
4.9
10.2
0
5
10
15
20
25
AT
NL
LU
DE
CZ
MT
RO
BE
FI
SE
DK
UK
*
SI
IT
CY
FR
EU
27
PL
EA
17
HU
EE
**
BG
SK
LT*
*
LV*
*
IE
PT
EL*
ES
%
* December 2011 ** Q4 2011

1. The euro area (EA17) consists of Belgium, Germany, Estonia, Ireland, Greece, Spain, France, Italy, Cyprus, Luxembourg,
Malta, the Netherlands, Austria, Portugal, Slovenia, Slovakia and Finland.
The EU27 includes Belgium (BE), Bulgaria (BG), the Czech Republic (CZ), Denmark (DK), Germany (DE), Estonia (EE),
Ireland (IE), Greece (EL), Spain (ES), France (FR), Italy (IT), Cyprus (CY), Latvia (LV), Lithuania (LT), Luxembourg (LU),
Hungary (HU), Malta (MT), the Netherlands (NL), Austria (AT), Poland (PL), Portugal (PT), Romania (RO), Slovenia (SI),
Slovakia (SK), Finland (FI), Sweden (SE) and the United Kingdom (UK).
2. Non-seasonally adjusted and trend data can be found in the statistical database on the Eurostat website.
3. Eurostat produces harmonised unemployment rates for individual EU Member States, the euro area and the EU. These
unemployment rates are based on the definition recommended by the International Labour Organisation (ILO). The
measurement is based on a harmonised source, the European Union Labour Force Survey (LFS).
Based on the ILO definition, Eurostat defines unemployed persons as persons aged 15 to 74 who:
- are without work;
- are available to start work within the next two weeks;
- and have actively sought employment at some time during the previous four weeks.
The unemployment rate is the number of people unemployed as a percentage of the labour force. The labour force is the
total number of people employed plus unemployed.
The numbers of unemployed and the monthly unemployment rates are estimates based on results of the LFS which is a
continuous household survey carried out in Member States on the basis of agreed definitions. These results are
interpolated/extrapolated to monthly data using national survey data and/or national monthly series on registered
unemployment. The most recent figures are therefore provisional; results from the Labour Force Survey are available 90
days after the end of the reference period for most Member States.
Monthly unemployment and employment series are calculated first at the level of four categories for each Member State
(males and females 15-24 years, males and females 25-74 years). These series are then seasonally adjusted and all the
national and European aggregates are calculated.
Member States may publish other rates such as register based unemployment rates, or rates based on national Labour
Force Surveys or corresponding surveys. These rates may vary from those published by Eurostat due to a different definition
or methodological choices.
Current deviations from the definition of unemployment in the EU Labour Force Survey:
Spain, Italy and United Kingdom: Unemployment is restricted to persons aged 16-74. In Spain and Italy the legal minimum
age for working is 16. Employment data used for Italy includes also those above 74.
4. Compared with the rates published in News Release 31/2012 of 1 March 2012, the January 2012 unemployment rates for
the EA17 and for the EU27 remain unchanged. Among Member States, the rate has been revised by between 0.2 and 0.4
percentage points for Belgium, the Czech Republic, Hungary and Malta. The rate has been revised upwards by 0.5
percentage points for Slovenia, and by 0.7 percentage points for Bulgaria and Slovakia. The revisions are primarily caused
by the inclusion of the most recent EU Labour Force Survey data in the calculation process and the annual update of
seasonal adjustment parameters.
The following LFS data are used in the calculations of the monthly unemployment rates published in this News Release:
For Germany, Italy, the Netherlands, Austria, Romania, Finland and Sweden monthly data up to and including February
2012.
For Greece monthly data up to and including December 2011.
For the United Kingdom monthly data up to and including November-December 2011 and January 2012 (3-month rolling
average).
For Belgium, Bulgaria, the Czech Republic, Denmark, Estonia, Ireland, Spain, France, Cyprus, Latvia, Lithuania,
Luxembourg, Hungary, Malta, Poland, Portugal, Slovenia and Slovakia quarterly data up to and including Q4 2011.
5. Italy has implemented a method to produce monthly unemployment data purely based on the LFS. For the moment, these
data should be considered provisional.
6. Estonia, Latvia, Lithuania: quarterly data for all series.
Cyprus, Romania and Slovenia: quarterly data for youth unemployment.
7. For Germany, Austria and Finland the trend component is used instead of the more volatile seasonally adjusted data.
Issued by: Eurostat Press Office
Tim ALLEN
Tel: +352-4301-33 444
eurostat-pressoffice@ec.europa.eu
Eurostat news releases on internet:
For further information on data:
Hannah KIIVER
Tel: +352-4301-38 438
Hubertus VREESWIJK
Tel: +352-4301-34 323
estat-monthly-unemployment@ec.europa.eu
Selected Principal European Economic Indicators: http://ec.europa.eu/eurostat/euroindicators
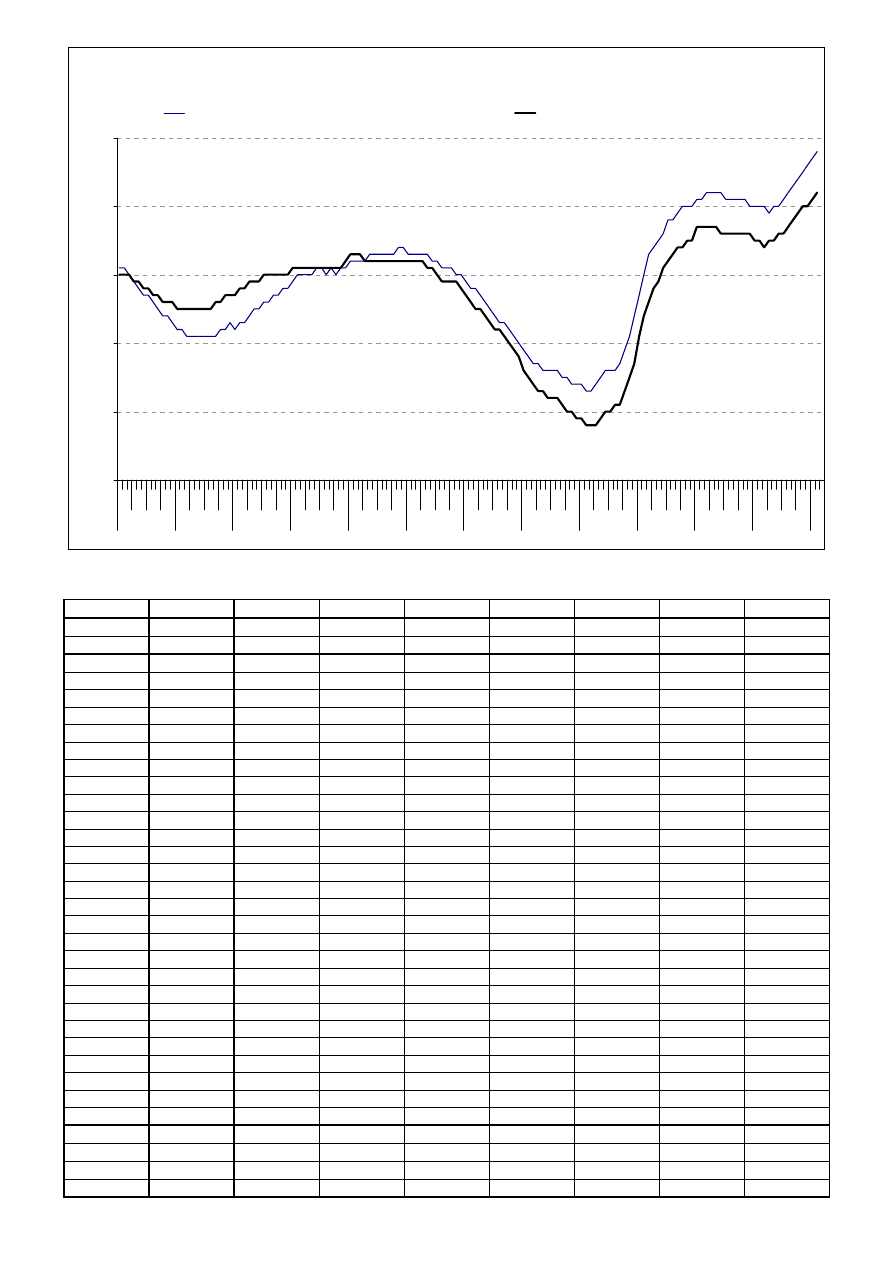
Euro area and EU27 unemployment rates
6
7
8
9
10
11
I II III IV I II III IV I II III IV I II III IV I II III IV I II III IV I II III IV I II III IV I II III IV I II III IV I II III IV I II III IV I
2000
2001
2002
2003
2004
2005
2006
2007
2008
2009
2010
2011
2012
%
Euro area (EA17), seasonally adjusted series
EU27, seasonally adjusted series
SEASONALLY ADJUSTED UNEMPLOYMENT RATES (%)
TOTALS
Feb 2011
Aug 2011
Sep 2011
Oct 2011
Nov 2011
Dec 2011
Jan 2012
Feb 2012
EA17
10.0 10.2 10.3 10.4 10.5 10.6 10.7 10.8
EU27
9.5 9.7 9.8 9.9 10.0 10.0 10.1 10.2
BE
7.1 7.3 7.3 7.2 7.2 7.1 7.2 7.2
BG
11.1 11.1 11.1 11.3 11.6 11.8 12.2 12.4
CZ
6.9 6.6 6.5 6.5 6.5 6.7 6.7 6.8
DK
7.4 7.5 7.6 7.7 7.8 7.8 7.9 7.9
DE
7
6.3 5.8 5.8 5.7 5.7 5.7 5.7 5.7
EE
6
13.6 11.5 11.5 11.7 11.7 11.7
:
:
IE
14.2 14.7 14.7 14.7 14.8 14.7 14.7 14.7
EL
14.9 18.5 19.0 19.7 20.6 21.0
:
:
ES
20.6 22.0 22.4 22.7 22.9 23.0 23.3 23.6
FR
9.6 9.7 9.7 9.8 9.8 9.9 10.0 10.0
IT
5
8.1 8.3 8.6 8.5 8.8 8.9 9.1 9.3
CY
6.7 7.8 8.3 9.0 9.3 9.4 9.5 9.7
LV
6
16.3 14.8 14.8 14.6 14.6 14.6
:
:
LT
6
16.3 15.3 15.3 14.3 14.3 14.3
:
:
LU
4.7 5.0 4.9 4.9 4.9 5.1 5.1 5.2
HU
10.8 10.9 10.9 10.9 10.9 11.0 11.3 11.0
MT
6.4 6.3 6.4 6.4 6.5 6.8 6.8 6.8
NL
4.3 4.4 4.5 4.8 4.9 4.9 5.0 4.9
AT
7
4.4 3.8 4.0 4.3 4.4 4.2 4.1 4.2
PL
9.4 9.7 9.8 9.9 10.0 10.1 10.1 10.2
PT
12.3 12.7 13.0 13.6 14.0 14.6 14.8 15.0
RO
7.1 7.5 7.7 7.3 7.6 7.5 7.2 7.1
SI
8.1 8.1 8.3 8.6 8.7 8.7 8.7 8.7
SK
13.4 13.5 13.6 13.9 14.0 14.1 14.0 14.0
FI
7
8.0 7.7 7.7 7.6 7.6 7.5 7.5 7.4
SE
7.6 7.4 7.3 7.5 7.5 7.5 7.6 7.5
UK
7.7 8.3 8.3 8.4 8.3 8.3 : :
IS
7.8 7.1 7.1 7.0 7.0 6.9 6.9 6.9
NO
3.2 3.2 3.3 3.4 3.4 3.3 3.2 :
US
9.0 9.1 9.0 8.9 8.7 8.5 8.3 8.3
JP
4.7 4.3 4.2 4.4 4.4 4.5 4.7 :
: Data not available
Source: Eurostat
SEASONALLY ADJUSTED UNEMPLOYMENT RATES (%)
Youth (under 25's)
Males
Females
Feb-11 Dec-11 Jan-12 Feb-12 Feb-11 Dec-11
Jan-12 Feb-12
Feb-11 Dec-11 Jan-12 Feb-12
EA17
20.5 21.4 21.5 21.6
9.7 10.4 10.6 10.7
10.3 10.8 10.9 11.0
EU27
21.0 22.1 22.3 22.4
9.4 9.9 10.1 10.1
9.6 10.1 10.1 10.2
BE
19.2 17.0 16.7 16.6
7.4 7.0 7.2 7.2
6.7 7.2 7.3 7.3
BG
26.5 29.3 31.0 32.2
11.9 13.3 13.7 14.0
10.1 10.2 10.5 10.7
CZ
17.1 18.4 18.8 19.1
6.0 5.8 5.9 6.0
8.1 7.8 7.8 7.8
DK
13.5 14.2 14.5 14.7
7.6 7.9 7.9 8.1
7.2 7.8 7.8 7.7
DE
7
8.9 8.3 8.2 8.2
6.6 5.9 5.9 6.0
6.0 5.4 5.4 5.4
EE
6
20.2 25.1
:
:
14.2 12.6
:
:
12.9 10.8
:
:
IE
29.0 31.1 31.5 31.6
17.3 17.7 17.9 17.9
10.3 11.0 10.9 10.8
EL
39.5 50.4
:
:
12.2 18.0
:
:
18.6 25.0
:
:
ES
44.4 49.3 49.9 50.5
20.1 22.6 22.9 23.3
21.4 23.4 23.7 23.9
FR
23.5 22.6 22.1 21.7
9.0 9.7 9.7 9.8
10.4 10.1 10.2 10.2
IT
5
27.8 30.7 31.0 31.9
7.4 8.4 8.6 8.6
9.1 9.7 9.9 10.3
CY
6
18.8 26.8
:
:
6.5 10.3 10.4 10.6
6.9 8.4 8.5 8.6
LV
6
30.9 27.4
:
:
18.0 16.8
:
:
14.5 12.3
:
:
LT
6
32.0 34.3
:
:
19.1 16.2
:
:
13.5 12.4
:
:
LU
14.4 16.7 16.6 16.9
3.4 4.0 4.0 4.1
6.2 6.4 6.4 6.5
HU
25.7 27.0 28.3 27.8
11.0 10.8 11.1 10.8
10.6 11.1 11.4 11.3
MT
14.0 14.4 14.8 14.5
5.8 6.3 6.1 6.1
7.5 7.5 8.0 8.0
NL
7.4 8.6 9.0 9.4
4.3 4.9 5.0 4.9
4.2 4.9 5.0 4.9
AT
7
8.9 8.4 8.9 8.3
4.3 3.8 3.8 4.0
4.5 4.6 4.5 4.4
PL
25.5 26.9 27.4 27.5
9.1 9.3 9.4 9.5
9.7 11.0 11.0 11.0
PT
26.9 35.0 35.1 35.4
11.9 14.7 14.9 15.1
12.8 14.5 14.7 14.8
RO
6
22.9 24.8
:
:
7.6 7.8 7.8 7.5
6.4 7.0 6.6 6.7
SI
6
16.3 16.4
:
:
8.1 8.4 8.3 8.4
8.0 9.2 9.1 9.0
SK
33.1 33.7 34.1 34.2
13.4 13.9 13.9 13.9
13.5 14.2 14.2 14.1
FI
7
20.4 19.9 19.9 19.8
8.5 8.2 8.2 8.2
7.5 6.7 6.7 6.6
SE
22.7 23.0 22.3 23.5
7.6 7.6 7.8 7.8
7.5 7.3 7.3 7.2
UK
20.1 22.2
:
:
8.3 8.9 : :
7.0 7.6 : :
IS
15.6 15.5 15.5 15.5
8.8 6.9 6.9 6.9
6.6 6.9 6.9 6.9
NO
9.1 8.0 7.6 :
3.5 3.7 3.7 :
2.8 2.8 2.7 :
US
17.6 16.7 16.0 16.5
9.4 8.7 8.3 8.3
8.5 8.3 8.3 :
JP
: : : :
5.0 4.9 4.9 :
4.4 4.0 4.4 :
: Data not available
Source: Eurostat
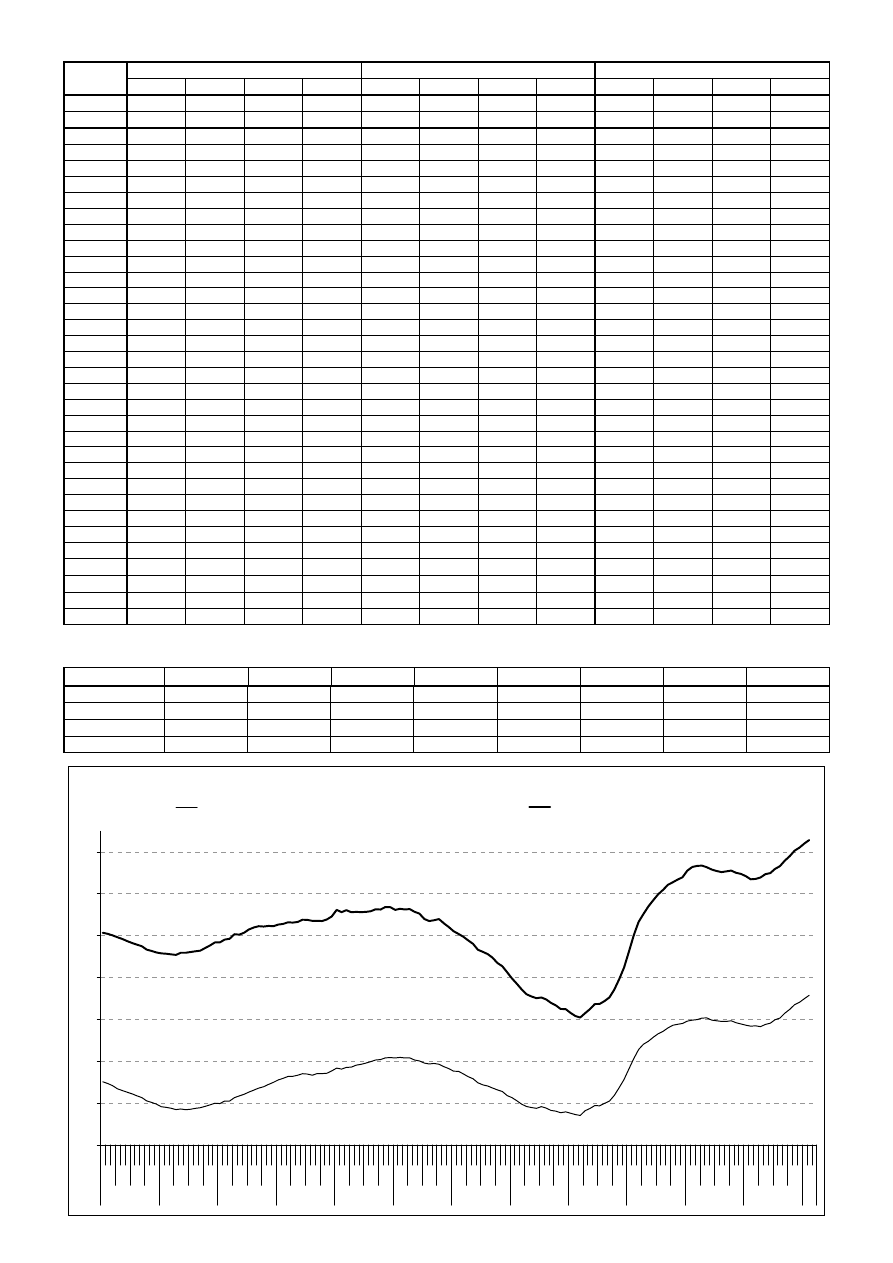
SEASONALLY ADJUSTED NUMBER OF UNEMPLOYED (in millions)
Feb 2011
Aug 2011
Sep 2011
Oct 2011
Nov 2011
Dec 2011
Jan 2012
Feb 2012
EA17
15.658 16.043 16.277 16.456 16.681 16.793 16.972 17.134
EU27
22.676 23.302 23.566 23.778 24.042 24.189 24.383 24.550
EA17 - youth
3.166 3.170 3.213 3.237 3.293 3.265 3.262 3.272
EU27 - youth
5.200 5.290 5.347 5.398 5.479 5.454 5.451 5.462
Euro area and EU27 unemployed (in millions)
10
12
14
16
18
20
22
24
I II III IV I II III IV I II III IV I II III IV I II III IV I II III IV I II III IV I II III IV I II III IV I II III IV I II III IV I II III IV I
2000
2001
2002
2003
2004
2005
2006
2007
2008
2009
2010
2011
2012
Euro area (EA17), seasonally adjusted series
EU27, seasonally adjusted series
Document Outline
Wyszukiwarka
Podobne podstrony:
2 23042012 AP EN
2 23042012 AP EN
moldova enp ap final en
moldova enp ap final en
Budzik Versa wielkość karty kredytowej instrukcja EN
G2 4 PW EN wn Rys 01
Manual Acer TravelMate 2430 US EN
Ćwiczenie 01 EN DI
eci en
instrukcja bhp przy obsludze ap Nieznany (8)
BVSOI 3 001 E en
A Biegus projektowanie konctrukcji stalowych wg PN EN 1993 1 1 cz 1
Flavon Active dopping EN
więcej podobnych podstron