
Laboratory
4
Network Design
Planning a Network with Different Users, Hosts, and Services
Objective
The objective of this lab is to demonstrate the basics of designing a network, taking into
consideration the users, services, and locations of the hosts.
Overview
Optimizing the design of a network is a major issue. Simulations are usually used to
analyze the conceptual design of the network. The initial conceptual design is usually
refined several times until a final decision is made to implement the design. The objective
is to have a design that maximizes the network performance, taking into consideration the
cost constraints and the required services to be offered to different types of users. After
the network has been implemented, network optimization should be performed periodically
throughout the lifetime of the network to ensure maximum performance of the network and
to monitor the utilization of the network resources.
In this lab you will design a network for a company that has four departments: Research,
Engineering, E-Commerce, and Sales. You will utilize a LAN model that allows you to
simulate multiple clients and servers in one simulation object. This model dramatically
reduces both the amount of configuration work you need to perform and the amount of
memory needed to execute the simulation. You will be able to define a profile that
specifies the pattern of applications employed by the users of each department in the
company. By the end of this lab, you will be able to study how different design decisions
can affect the performance of the network.
2
Procedure
Create a New Project
1. Start
OPNET IT Guru Academic Edition
⇒ Choose New from the File menu.
2. Select
Project and click OK
⇒ Name the project <your initials>_NetDesign,
and the scenario SimpleNetwork
⇒ Click OK.
3. In
the
Startup Wizard: Initial Topology dialog box, make sure that Create Empty
Scenario is selected
⇒ Click Next ⇒ Choose Campus from the Network Scale
list
⇒ Click Next ⇒ Choose Miles from the Size drop-down menu and assign 1
for both X Span and Y Span
⇒ Click Next twice ⇒ Click OK.
Create and Configure the Network
Initialize the Network:
1. The
Object Palette dialog box should be now on the top of your project space. If it
is not there, open it by clicking
. Make sure that the internet_toolbox is
selected from the pull-down menu on the object palette.
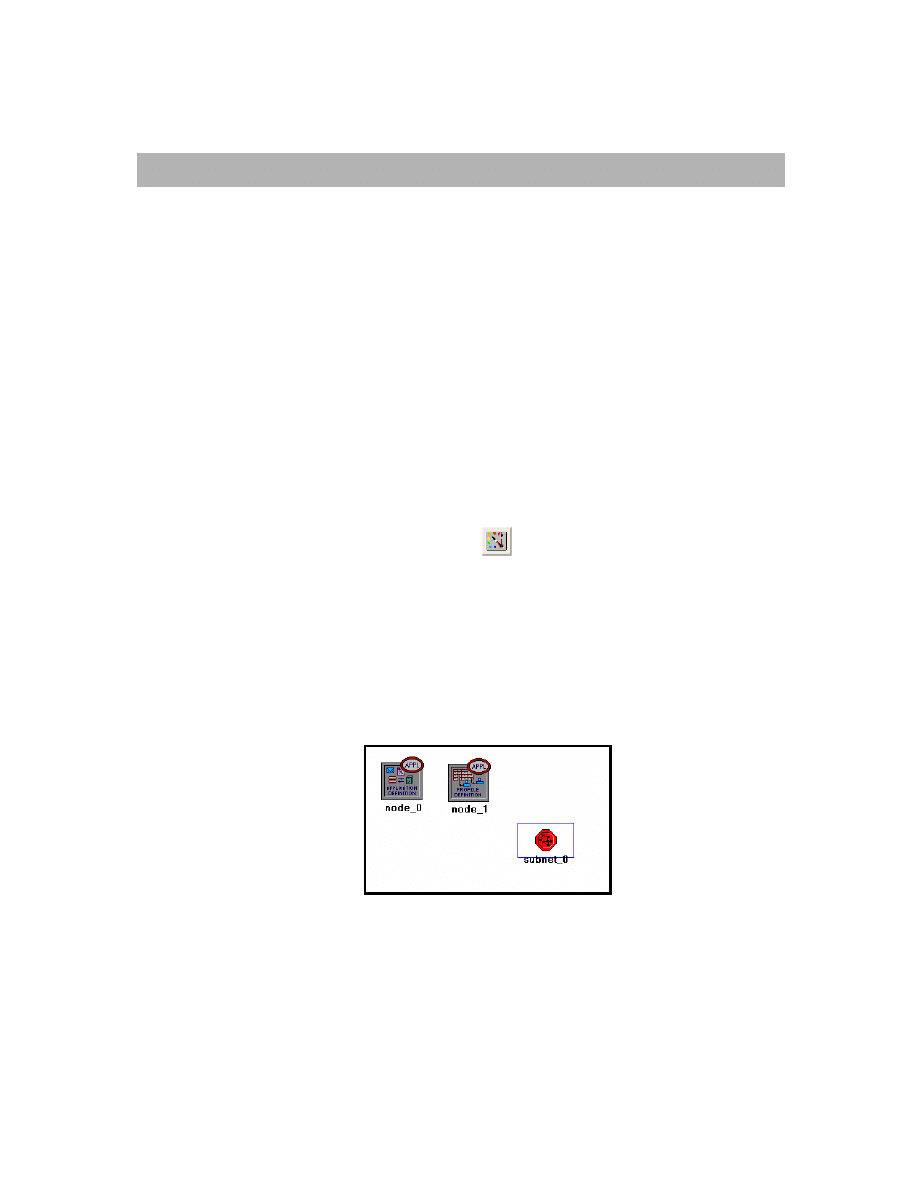
2. Add to the project workspace the following objects from the palette: Application
Config, Profile Config, and a subnet.
a. To add an object from a palette, click its icon in the object palette
⇒ Move your
mouse to the workspace
⇒ Left-click to place the object. Right-click when
finished. The workspace should contain the following three objects:
3. Close
the
Object Palette dialog box and save your project.
Application Config is
used to specify
applications that will be
used to configure users
profiles.
Profile Config describes
the activity patterns of a
user or group of users in
terms of the applications
used over a period of
time. You must define
the applications using
the Application Config
object before using this
object.
3
Configure the Services:
1. Right-click on the Application Config node
⇒ Edit Attributes ⇒ Change the
name attribute to Applications
⇒ Change the Application Definitions attribute
to Default
⇒ Click OK.
2. Right-click on the Profile Config node
⇒ Edit Attributes ⇒ Change the name
attribute to Profiles
⇒ Change the Profile Configuration attribute to Sample
Profiles
⇒ Click OK.
Sample Profiles provides patterns of applications employed by users such as
engineers, researchers, salespeople, and multimedia users.
Configure a Subnet:
1. Right-click
on
the
subnet node
⇒ Edit Attributes ⇒ Change the name attribute
to Engineering and click OK.
2. Double-click on the Engineering node. You get an empty workspace, indicating
that the subnet contains no objects.
3. Open the object palette
and make sure it is still set to internet_toolbox.
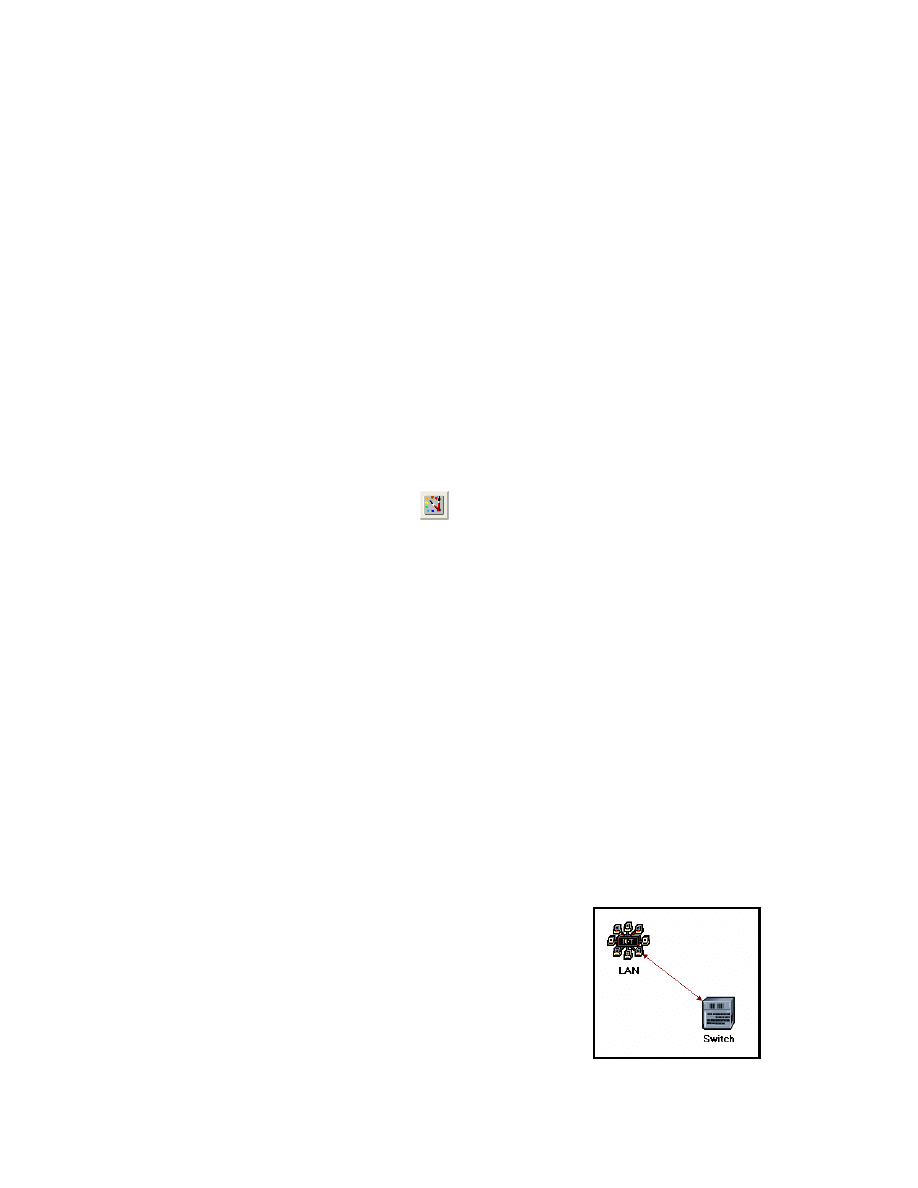
4. Add the following items to the subnet workspace: 10BaseT LAN, ethernet16
Switch, and a 10BaseT link to connect the LAN with the Switch
⇒ Close the
palette.
5. Right-click
on
the
10BaseT LAN node
⇒ Edit Attributes ⇒ Change the name
attribute to LAN
⇒ Observe that the Number of Workstations attribute has a
value of 10. Click in the Value column for the Application: Supported Profiles
attribute, and select Edit. You should get a table in which you should do the
following:
a. Set the number of rows to 1.
b. Set the Profile Name to Engineer. Note: Engineer is one of the
“sample” profiles provided within the Profile Config object.
c. Click
OK twice.
The object we just created is equivalent to a 10-workstation star topology LAN.
The traffic generated from the users of this LAN resembles that generated by
“engineers.”
6. Rename
the
ethernet16 Switch to Switch.
7. The subnet should look like the shown one.
8. Save your project.
4
Configure All Departments:
1. Now you have completed the configuration of the Engineering department
subnet. To go back to the main project space, click the Go to the higher level
button.
The subnets of the other departments in the company should be similar to the
engineering one except for the supported profiles.
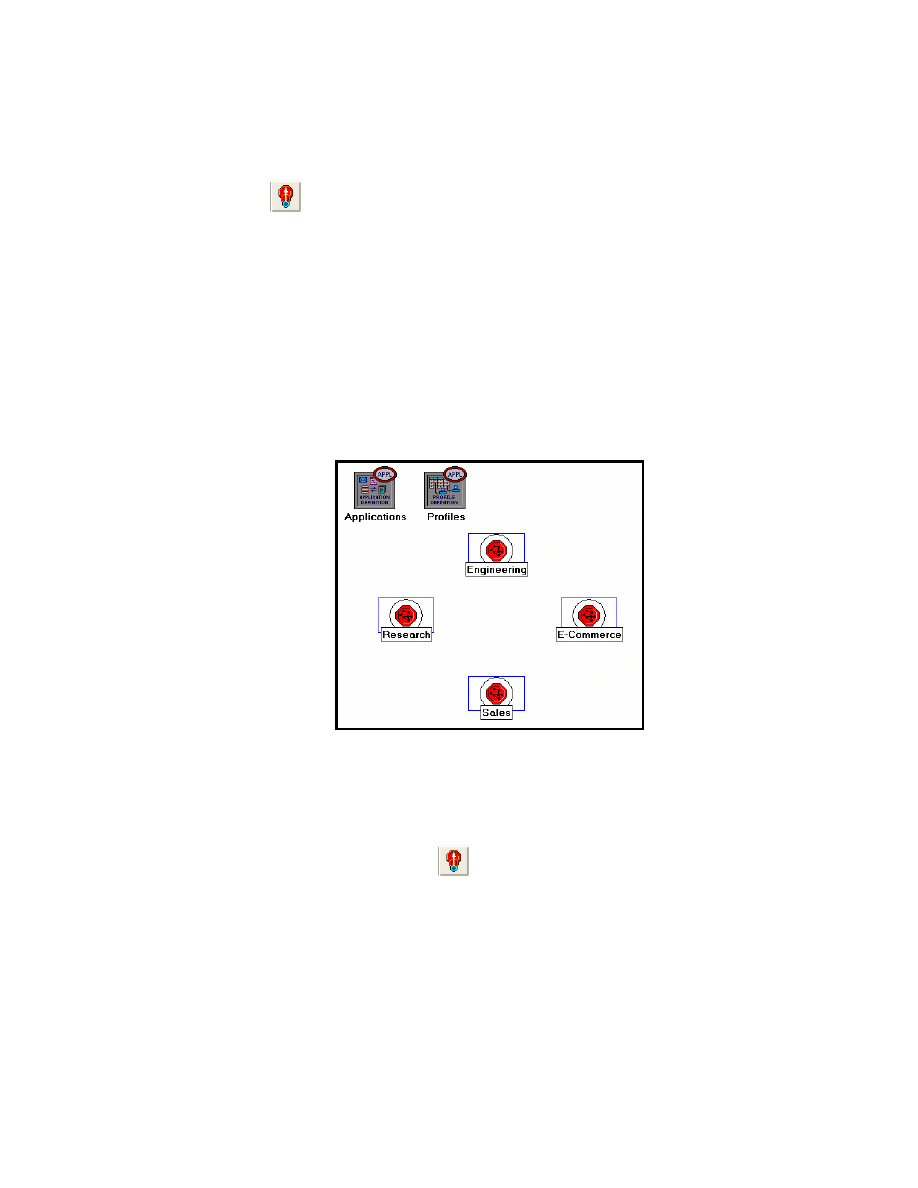
2. Make three copies of the Engineering subnet we just created: Click on the
Engineering node
⇒ From the Edit menu, select Copy ⇒ From the Edit menu,
select Paste three times, placing the subnet in the workspace after each, to
create the new subnets.
3. Rename (right-click on the subnet and select Set Name) and arrange the subnets
as shown below:
4. Double-click
the
Research node
⇒ Edit the attributes of its LAN ⇒ Edit the
value of the Application: Supported Profiles attribute
⇒ Change the value of
the Profile Name from Engineer to Researcher
⇒ Click OK twice ⇒ Go to the
higher level by clicking the
button.
5. Repeat step 4 with the Sales node and assign to its Profile Name the profile
Sales Person.
6. Repeat step 4 with the E-Commerce node and assign to its Profile Name the
profile E-commerce Customer.
7. Save your project.
5
Configure the Servers:
Now we need to implement a subnet that contains the servers. The servers have to
support the applications defined in the profiles we deployed. You can double-check those
applications by editing the attributes of our Profile node. Inspect each row under the
Applications hierarchy, which in turn, is under the Profile Configuration hierarchy. You
will see that we need servers that support the following applications: Web browsing, Email,
Telnet, File Transfer, Database, and File Print.
1. Open the Object Palette
and add a new subnet
⇒ Rename the new
subnet to Servers
⇒ Double-click the Servers node to enter its workspace.
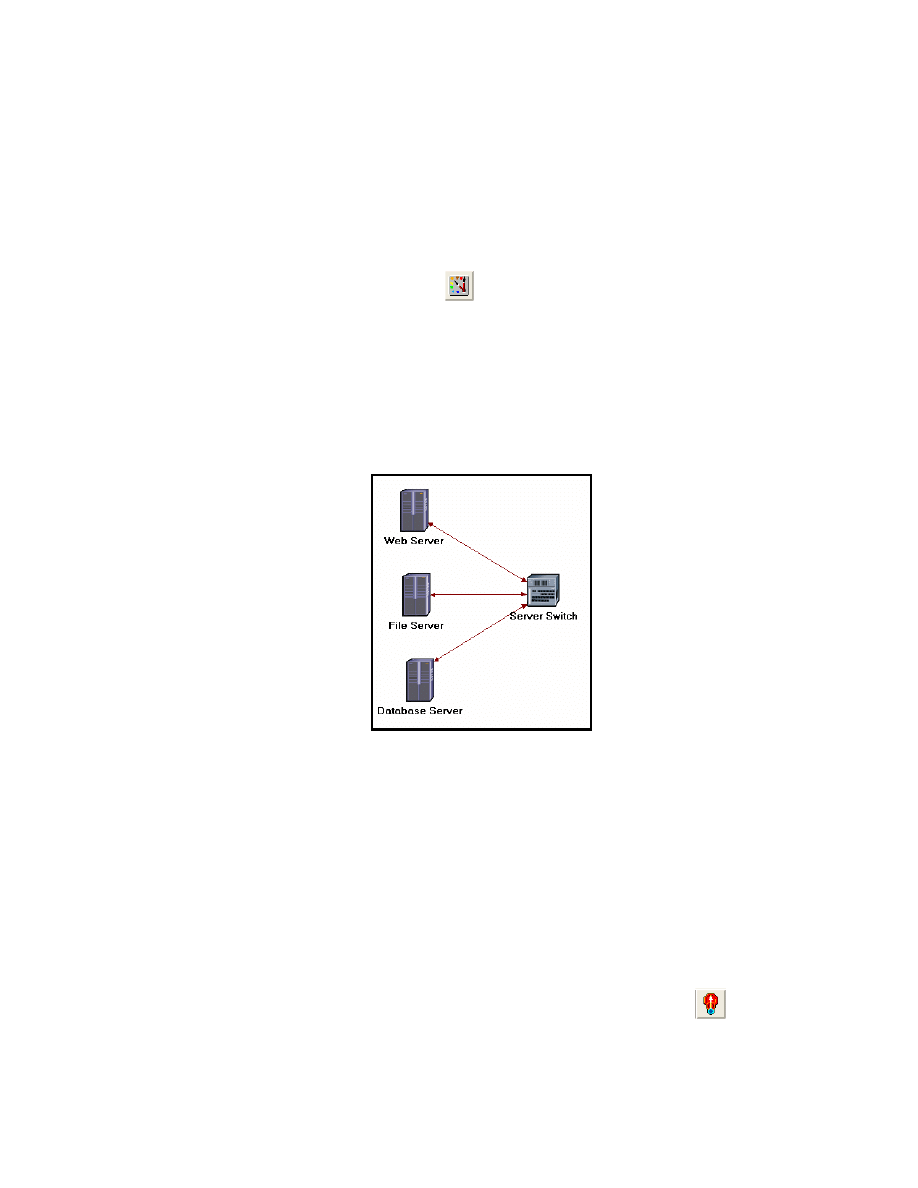
2. From
the
Object Palette, add three ethernet_servers, one ethernet16_switch,
and three 10BaseT links to connect the servers with the switch.
3. Close
the
Object Palette.
4. Rename the servers and the switch as follows:
5. Right-click on each one of the above servers and Edit the value of the
Application: Supported Services attribute.
i. For the Web Server add four rows to support the following services: Web
Browsing (Light HTTP1.1), Web Browsing (Heavy HTTP1.1), Email
(Light), and Telnet Session (Light).
ii. For the File Server add two rows to support the following services: File
Transfer (Light) and File Print (Light).
iii. For the Database Server add one row to support the following service:
Database Access (Light).
6. Go back to the project space by clicking the Go to the higher level
button.
7. Save your project.
6
Connect the Subnets:
Now all subnets are ready to be connected together.
1. Open the Object Palette
and add four 100BaseT links to connect the
subnets of the departments to the Servers subnet.
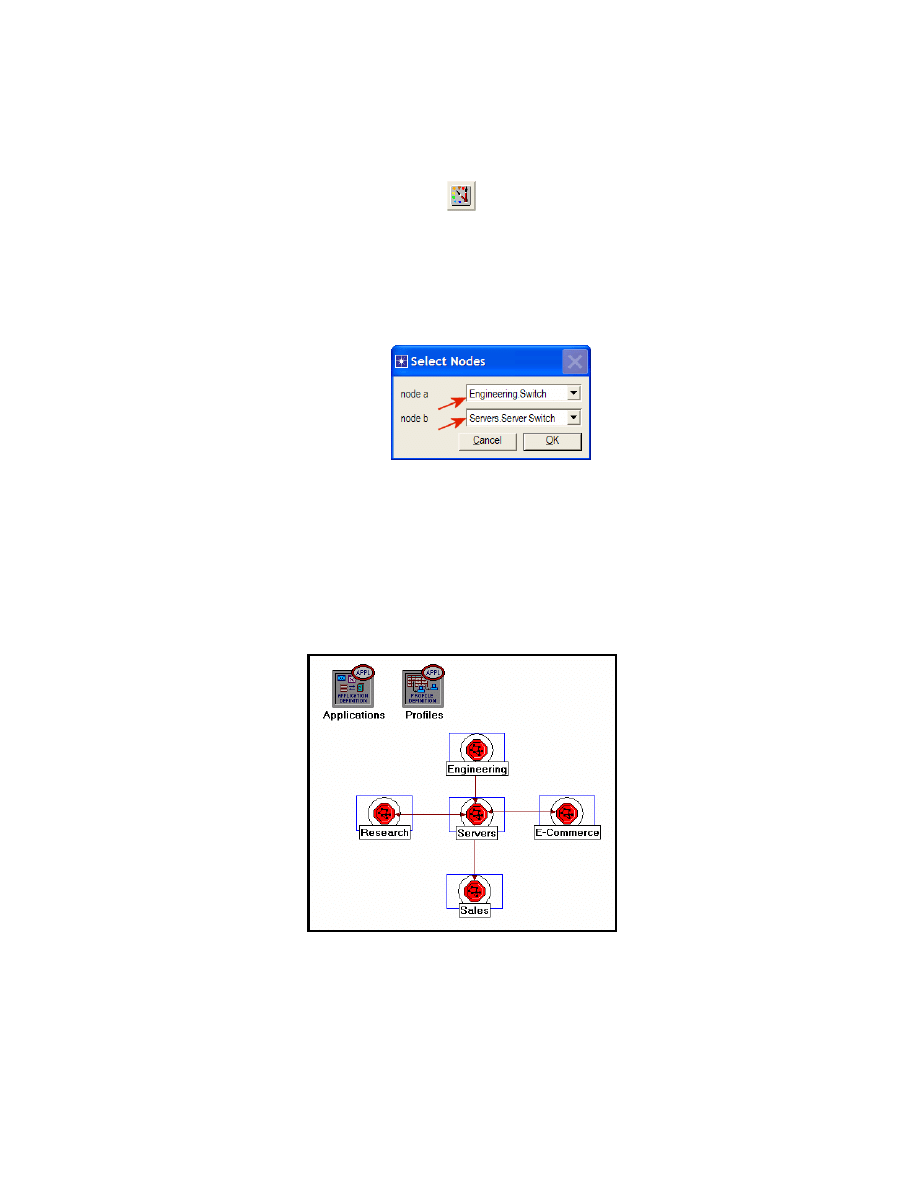
As you create each link, make sure that it is configured to connect the
“switches” in both subnets to each other. Do this by choosing them from the
drop-down menus as follows:
2. Close
the
Object Palette.
3. Now your network should resemble the following one:
4. Save your project.
7
Choose the Statistics
To test the performance of our network we will collect one of the many available statistics
as follows:
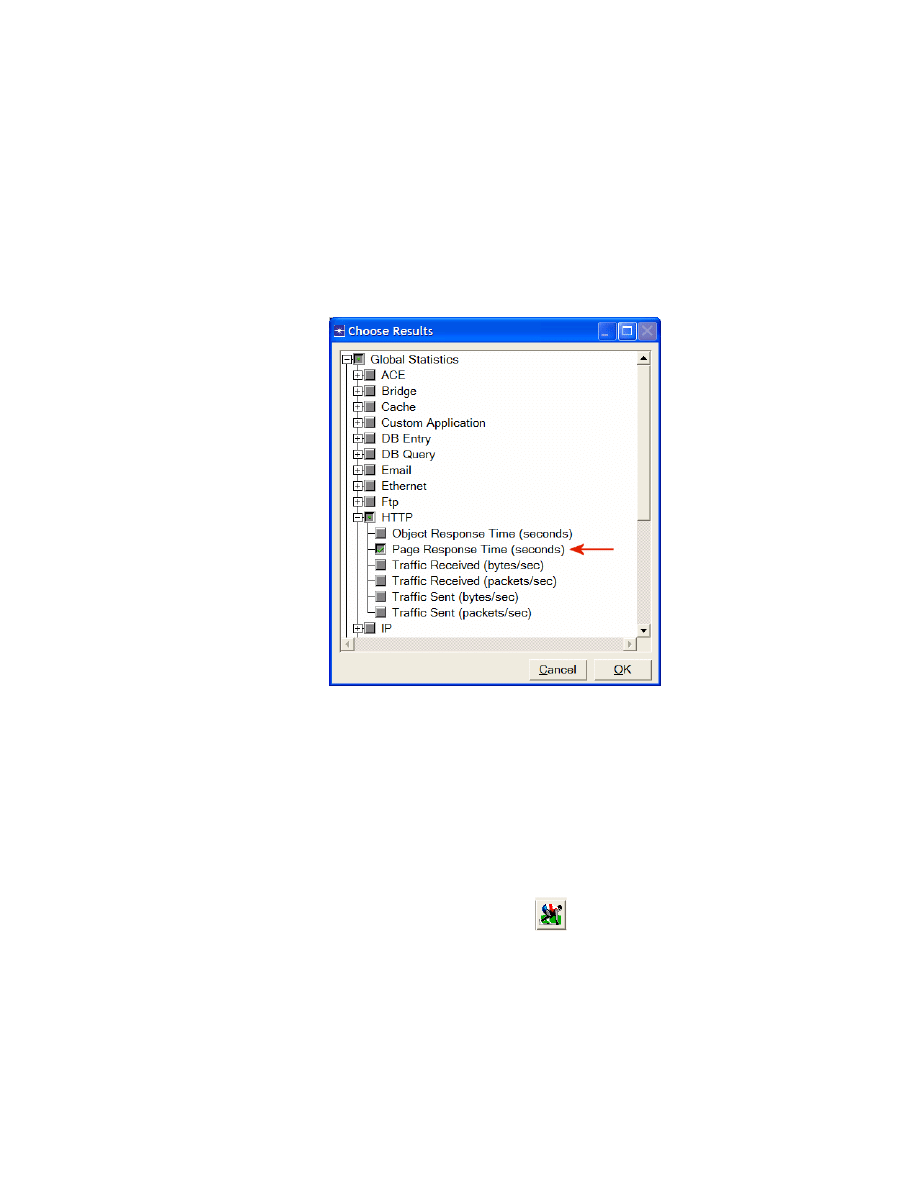
1. Right-click anywhere in the project workspace and select Choose Individual
Statistics from the pop-up menu.
2. In
the
Choose Results dialog box, choose the following statistic:
3. Click
OK.
Configure the Simulation
Here we need to configure the duration of the simulation:
1. Click on the Configure/Run Simulation
button.
2. Set the duration to be 30.0 minutes.
3. Press
OK.
Page Response Time
is the required time to
retrieve the entire page.
8
Duplicate the Scenario
In the network we just created we assumed that there is no background traffic already in
the links. In real networks, the links usually have some existing background traffic. We will
create a duplicate of the SimpleNetwork scenario but with background utilization in the
100BaseT links.
1. Select Duplicate Scenario from the Scenarios menu and give it the name
BusyNetwork
⇒ Click OK.
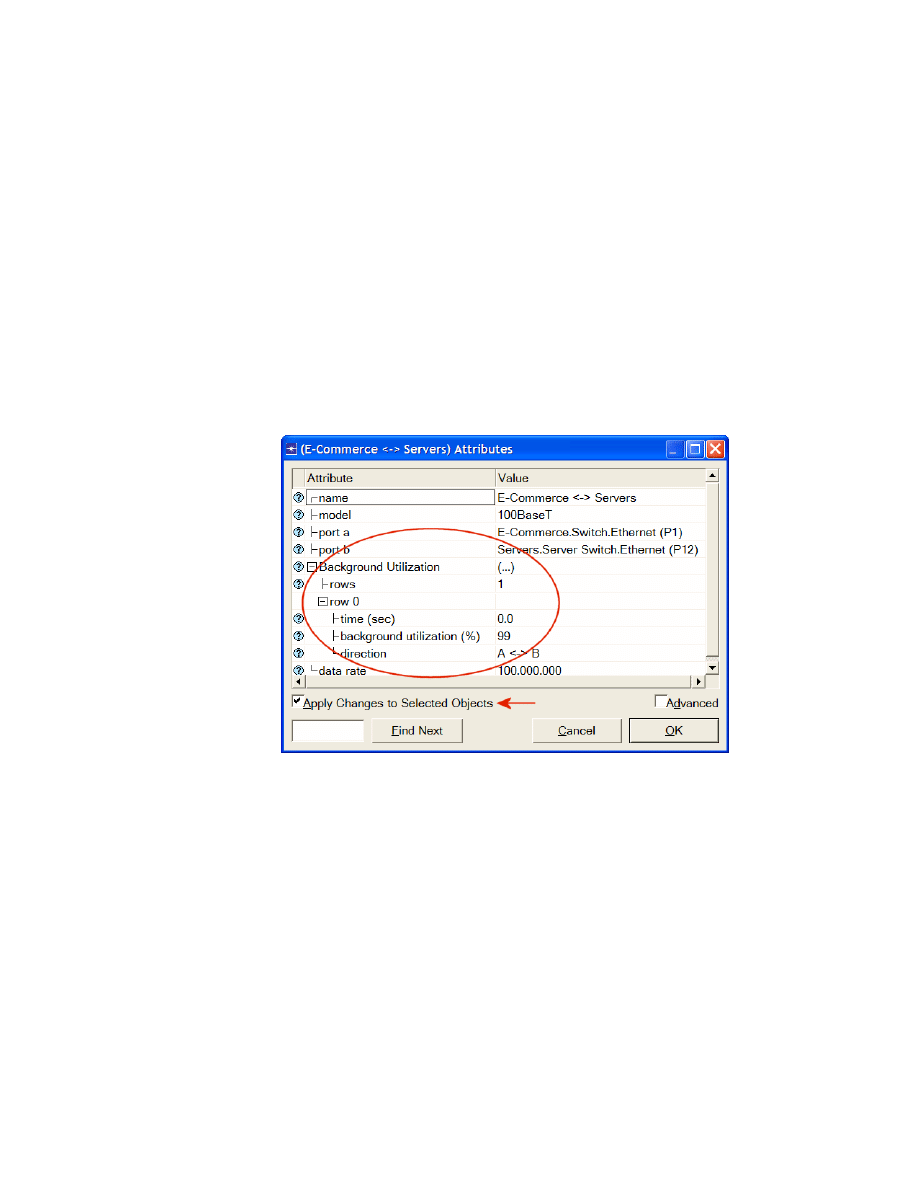
2. Select all the 100BaseT links simultaneously (click on all of them while holding the
Shift key)
⇒ Right-click on anyone of them ⇒ Edit Attributes ⇒ Check the
Apply Changes to Selected Objects check box.
3. Expand the hierarchy of the Background Utilization attribute
⇒ Expand the row
0 hierarchy
⇒ Assign 99 to the background utilization (%) as shown below.
4. Click
OK.
5. Save your project.
Link utilization is the
percentage of the used
link bandwidth.
9
Run the Simulation
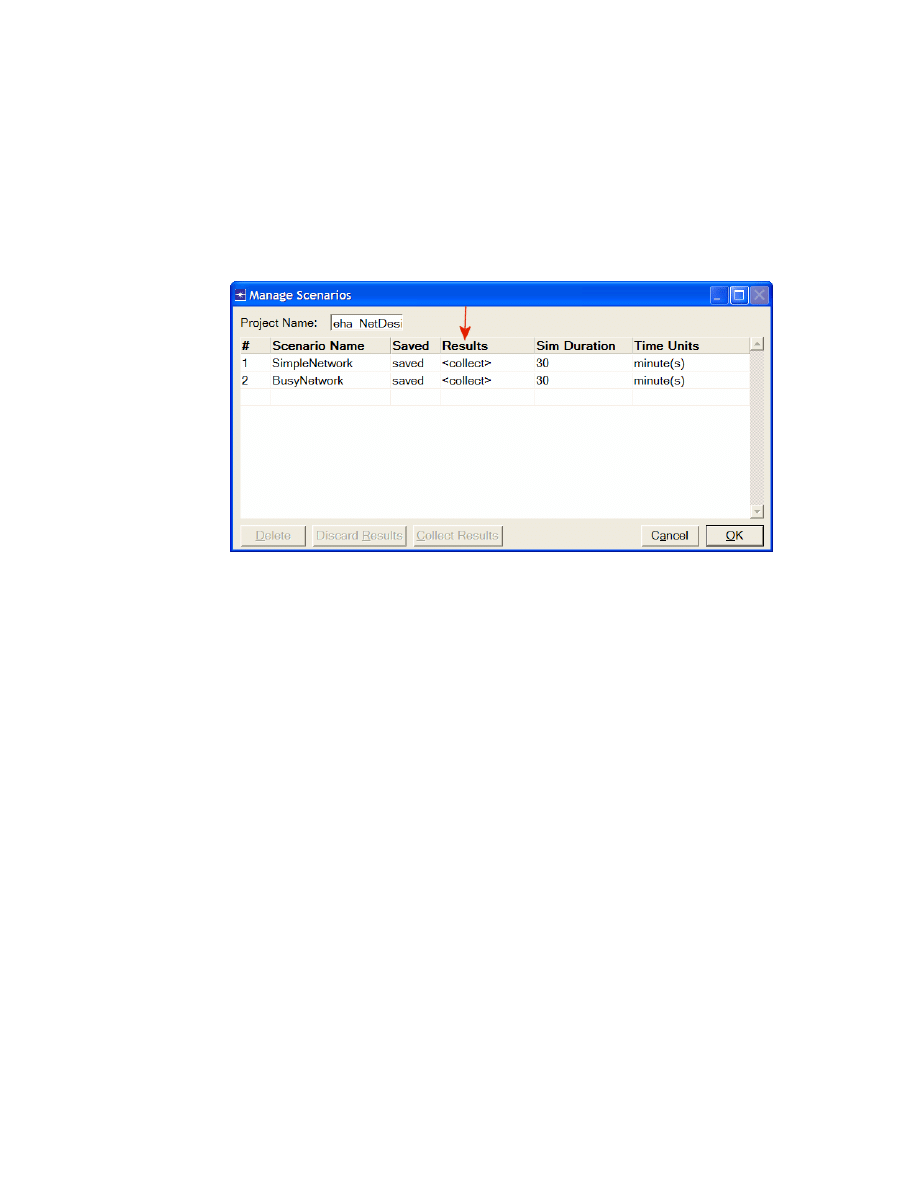
To run the simulation for both scenarios simultaneously:
1. Go to the Scenarios menu
⇒ Select Manage Scenarios.
2. Change the values under the Results column to <collect> (or <recollect>)
for both scenarios. Compare to the following figure.
3. Click
OK to run the two simulations. Depending on the speed of your processor,
this may take several seconds to complete.
4. After the two simulation runs complete (one for each scenario), click Close.
5. Save your project.
10
View the Results
To view and analyze the results:
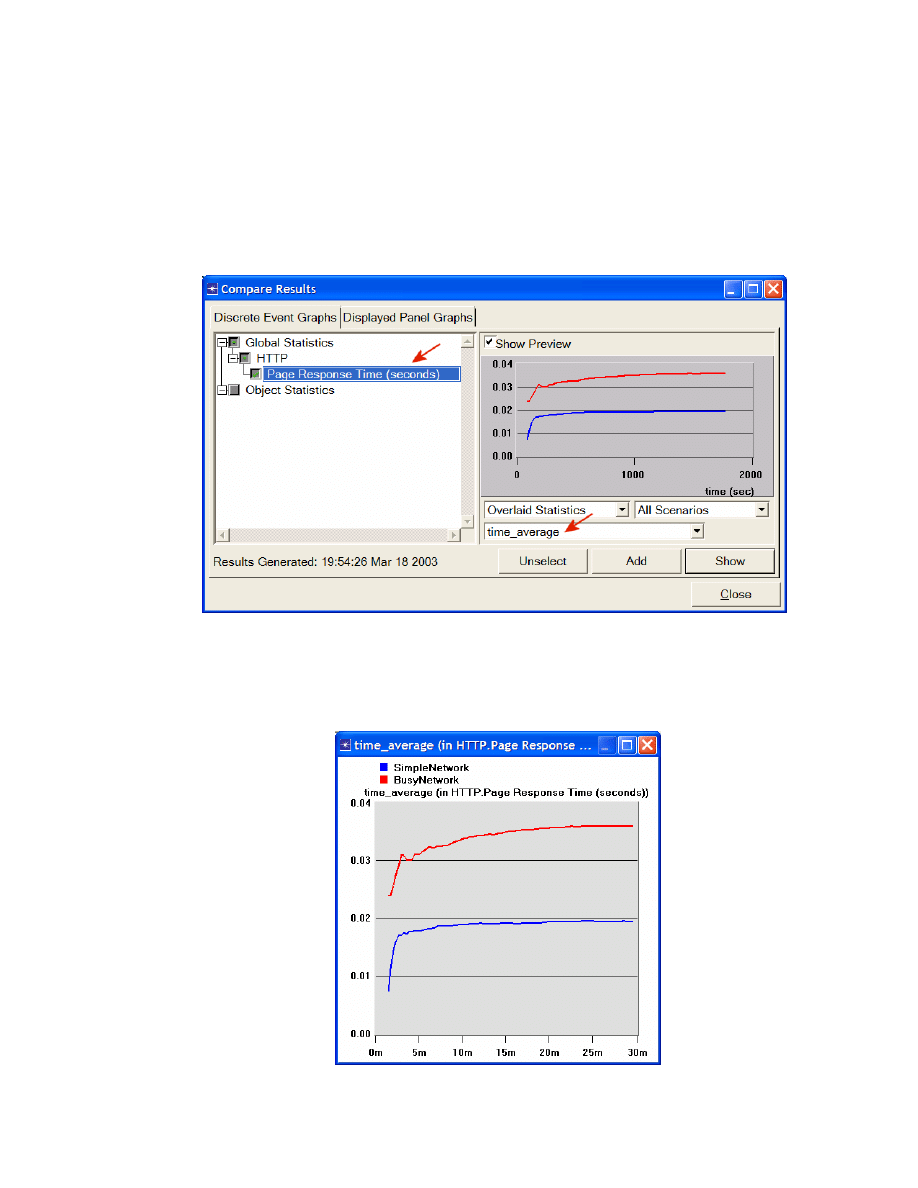
1. Select
Compare Results from the Results menu.
2. Change the drop-down menu in the lower-right part of the Compare Results
dialog box from As Is to time_average as shown.
3. Select the Page Response Time (seconds) statistic and click Show. The
resulting graph should resemble the one below. (Note: Results may vary slightly
due to different node placement.)

11
Further Readings
− OPNET Configuring Applications and Profiles: From the Protocols menu, select
Applications
⇒ Model Usage Guide ⇒ Configuring Profiles and
Applications.
Questions
1)
Analyze the result we obtained regarding the HTTP page response time. Collect
four other statistics, of your choice, and rerun the simulation of the Simple and the
Busy network scenarios. Get the graphs that compare the collected statistics.
Comment on these results.
2)
In the BusyNetwork scenario, study the utilization% of the CPUs in the servers
(Right-click on each server and select Choose Individual Statistics
⇒ CPU ⇒
Utilization).
3)
Create a new scenario as a duplicate of the BusyNetwork scenario. Name the
new scenario Q3_OneServer. Replace the three servers with only one server
that supports all required services. Study the utilization% of that server’s CPU.
Compare this utilization with the three CPU utilizations you obtained in the
previous question.
4)
Create a new scenario as a duplicate of the BusyNetwork scenario. Name the
new scenario Q4_FasterNetwork. In the Q4_FasterNetwork scenario, replace
all 100BaseT links in the network with 10Gbps Ethernet links and replace all
10BaseT links with 100BaseT links. Study how increasing the bandwidth of the
links affects the performance of the network in the new scenario (e.g., compare
the HTTP page response time in the new scenario with that of the
BusyNetwork).
Lab Report
Prepare a report that follows the guidelines explained in Lab 0. The report should include
the answers to the above questions as well as the graphs you generated from the
simulation scenarios. Discuss the results you obtained and compare these results with
your expectations. Mention any anomalies or unexplained behaviors.
Wyszukiwarka
Podobne podstrony:
Cisco Designing Network Security
EDS 06 0016 LV Network Earthing Design
PORTFOLIO DESIGN AND OPTIMIZATION USING NEURAL NETWORK BASED MULTIAGENT SYSTEM OF INVESTING AGENTS
Networks
European Public Administration Network
ZMPST 10 Survivable Networks
Neural networks in non Euclidean metric spaces
History Costume History Costume Design Viking Women
11 2 4 5 Lab ?cessing Network?vices with SSH
Eurocode 5 EN 1995 1 1 Design Of Timber Structures Part 1 1 General Rules
NetworkGSM Instrukcja
Artificial Neural Networks for Beginners
[Instrukcja] GDOT Design Policy Manual Chapter 8 Roundabouts (USA)
Lab04 Konfiguracja DHCP
M2H Networking Tutorial Original
Legendarne Strategie Liderów Network Marketingu
więcej podobnych podstron