
Komputerowe Wspomaganie
Zarządzania Projektami
Poznań 2012
Joanna Gościniak
Bartosz Jarocki
Patryk Guzek
Prof. dr hab. inż. Zenon Ignaszak
Prowadzący:
AGILITY IN MANUFACTURE: IMPROVEMENT OF
THE QUALITY
IN INCREMENTAL SHEET FORMING
ZWINNE WYTWARZANIE: POPRAWA
JAKOŚCI W FORMOWANIU PRZYROSTOWYM
BLACH

References
- Bibliografia
[I] J. TUOMI, L.LAMMINEN, “Incremental Sheet Forming as a Method for Sheet Metal Component
Prototyping and Manufacturing”, 10th European Forum on Rapid Prototyping, 2004.
[2] R. KÜTTNER, M. POHLAK, J. MAJAK, “Modelling and optimal design of sheet metal RP&M
Processes”, 10th European Forum on Rapid Prototyping, 2004.
[3] G. AMBROGIO, I. COSTANTINO, L. DE NAPOLI, L. FILICE, L. FRATINI, M.
MUZZUPAPPA,
“Influence of some relevant process parameters on the dimensional accuracy
in incremental forming: a
numerical and experimental investigation”, Journal of Materials
Processing Technology, N°153-154, 2004,
pp. 501-507.
[4] M.S. SHIM, J.J. PARK, “The formability of aluminium sheet in incremental forming, Journal of
Materials Processing Technology”, N°113, 2001, pp. 654-658.
[5] J.J. PARK, Y.H. KIM, “Fundamental studies on the incremental sheet metal forming technique”,
Journal of Materials Processing Technology, N°140, 2003, pp. 447-453.
[6] J. JESWIET, D. YOUNG, “Forming limit diagram for single-point incremental forming of
aluminium sheet”, ImechE, Vol. 219-B, 2005, pp. 359-364
[7] Y.H. KIM, J.J. PARK, “Effect of process parameters on formability in incremental forming of
sheet metal”, Journal of Materials Processing Technology, N°130–131, 2002, pp. 42-46.
[8] T. SCHÄFER, R.D. SCHRAFT, “Incremental sheet metal forming by industrial robots using a
hammering tool”, 10th European Forum on Rapid Prototyping, 2004.
[9] A. MURATA, “Process Engineering Lab. A new trial on incremental forming of sheet metal
parts”, R&D Review of Toyota CRDL,N°34-3, 1999.
[10] E. CERETTI, C. GIARDINI, A. ATTANASIO, “Experimental and simulative results in sheet
incremental forming on CNC machines”, Journal of Materials Processing Technology, N°152,
2004, pp. 176-184.
[II] S. MATSUBARA, H. AMINO, S. AOYAMA, Y. LU, “Apparatus for dieless forming plate
materials”, European Patent Office, International Publication No. WO 99/38627, 2000.

Abstract:
Incremental sheet forming is a new process to manufacture sheet
metal parts in case of small runs and prototyping as it is highly
flexible: there is no need to modify the punch or the mould to
manufacture a new part, only toolpaths have to be changed. Previous
studies were mainly interested in describing the main techniques and
the implementation of the process for aluminum alloys. Their
majority rather focused on the formability of the sheet metal than on
quality aspects. Others approaches developed finite element analysis
to predict the shape of the final part and to limit the defects of the
obtained part compared to the CAD one.
Streszczenie:
Formowanie przyrostowe jest nowym procesem w produkcji
elementów blachy w przypadku małych partii oraz prototypowaniu, z
racji swojej elastyczności. Nie ma potrzeby modyfikacji stempla lub
matrycy do produkcji nowych części, tylko ścieżka narzędzia podlega
zmianie. Wcześniejsze badania skupiały się głównie na opisie
techniki oraz wdrażaniu procesu do stopów aluminium. Większość
koncentruję się na odkształcalności blachy niż na aspektach
jakościowych. Inne wypracowane metody elementów skończonych do
przewidywania kształtu końcowej części oraz ograniczenia wad
uzyskanej części w porównaniu z CAD.

The newest incremental sheet forming process consists in gradually
deforming a sheet metal to obtain the final part: the tool performs
computer generated trajectories (as tool path in machining) on z-
levels that decrease under a determinate step. The required means
are a NC milling machine equipped with dedicated tool and support.
The process is dieless in the largest majority of its applications and
offers high flexibility. As a consequence it is well adapted to small lots
and prototyping.
Najnowsze formowanie przyrostowe blach polega na stopniowym
deformowaniu blachy w celu uzyskania końcowej części: narzędzie
wykonuje komputerowe generowanie trajektorii (ścieżka narzędzia w
obróbce skrawaniem) na poziomie Z spadek mocy jest zależny od
tego kroku. Wymagane środki to frezarka NC wyposażona w
dedykowane narzędzia oraz wspornik. Proces bezmatrycowy jest
najbardziej stosowany oraz oferuję wysoką elastyczność. W związku z
tym jest stosowany dla małych partii oraz prototypowania.

This paper presents the results of a finite elements study, which
measured the relations between the process parameters and the
resulting deformations and thickness variations of a sheet metal.
Then the impact of the forming parameters on the quality of a real
part is evaluated through an experimental study made on the
machine tool.
W artykule przedstawiono wyniki pracy elementów skończonych,
które mierzono w relacji między parametrami procesu i
odkształceniami wynikającymi z zmiany grubości blachy. Następnie
wpływ parametrów formowania na jakość prawdziwej części jest
oceniana przez eksperymentalne badania wykonywane na
obrabiarce.

Forming without support or negative forming, using one approach
direction: the sheet metal is fastened on its edges and the support is
fixed (Figure 1A). Negative forming using several approach directions
(Figure 1B). Negative forming using an elastomer support for a better
quality (Figure 1C). Forming with support, or positive forming, (Figure
1D). A majority of works were done about negative forming on three-
axis milling machine, as it is the easiest way to implement the
process.
Formowanie bez wspornika lub negatywnego formowania, przy użyciu
jednego kierunku: blacha mocowana jest na brzegach i wsparcie jest
ustalone (rys. 1A) Negatywne formowanie używając kilku podejść
(rys. 1B) Negatywne formowanie tworząc za pomocą wspornika z
elastomerów lepszej jakości (rys. 1C) Formowanie z wspornikiem lub
pozytywne kształtowanie (rys. 1D) Większość prac wykonano
negatywowo na trzyosiowej frezarce, ponieważ jest to najprostszy
sposób na wdrożenie procesu.
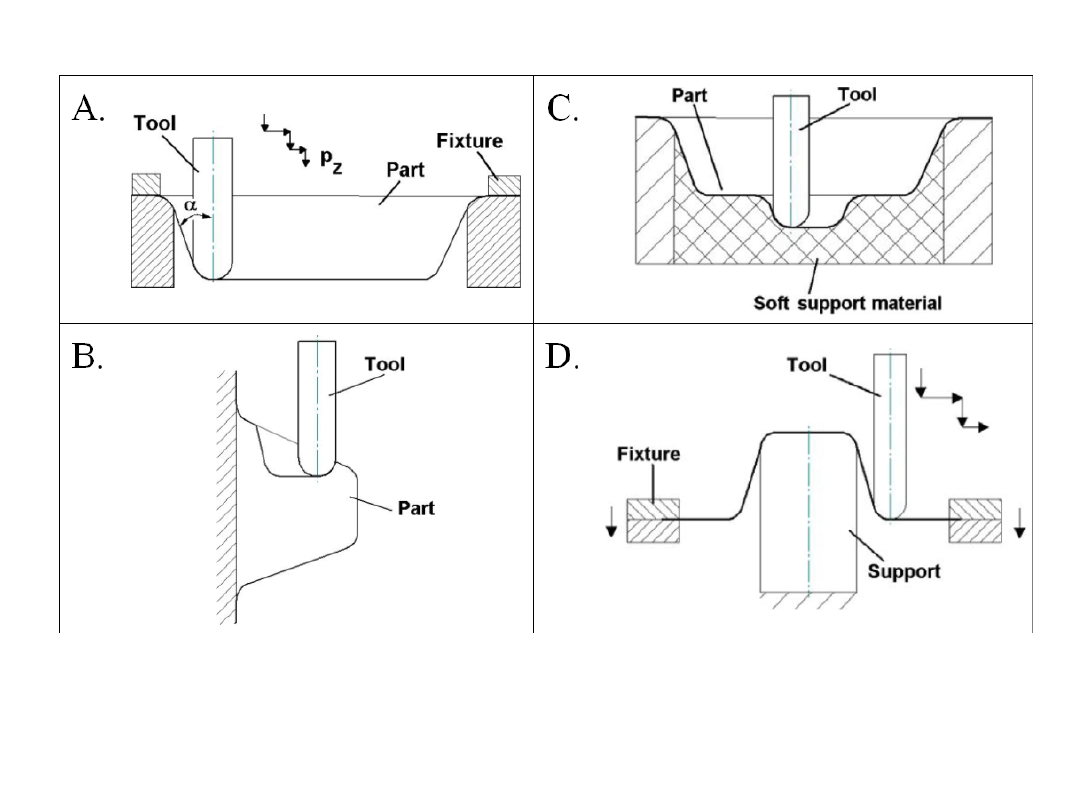
Incremental forming types
Metody formowania przyrostowego

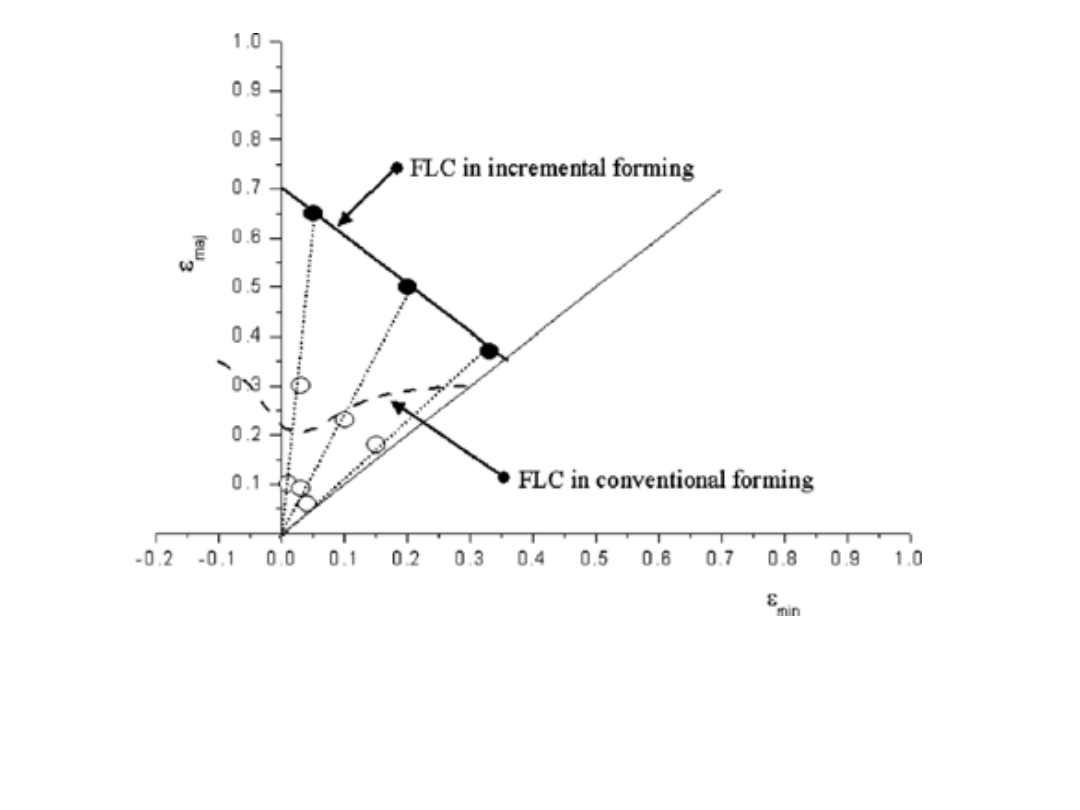
Other works compared the formability of the sheet metal in cases of
deep drawing and incremental forming [4,5]. The results show that
the forming limit curve (FLC) for incremental forming is much higher
than for conventional forming (Figure 2). The curve is quite different
and appears as a straight line with a negative slope in the positive
region of minor strain. In [6], Jeswiet et al. used five different shapes
to determine the formability of 3003-0 and 5754-0 aluminium. Their
results lead them to determine the angle to which a sheet can be
drawn before tears appear. They showed that strains of more than
300 percent can be obtained for all the tested shapes.
Inne prace porównawcze odkształcalności blachy w przypadku
głębokiego tłoczenia i formowania przyrostowego. Wyniki pokazują,
że graniczna krzywa formowana (FLC dla formowania przyrostowego
jest dużo wyższa niż w przypadku konwencjonalnego formowania
(rys. 2) Krzywa jest zupełnie inna i wygląda jak w linii prostej o
ujemnym nachyleniu w obszarze o mniejszym odkształceniu. W [6]
Jeswiet używał pięciu różnych kształtów w celu ustalenia
odkształcenia w 3003-0 i 5754-0 aluminium. Wyniki prowadzą do
określenia kąta, do którego arkusz może zostać wyciągnięty przed
wystąpieniem wgniecenia. Wykazało, że obciążenie wynoszące
więcej niż 300 procent można uzyskać dla wszystkich badanych
kształtów.
FLC dla formowania przyrostowego
FLC dla formowania konwenconalnego
Comparison of FLC
Porównanie FLC

Numerical simulations of the deformation phenomenon
In this part, the influence of some parameters on the resulting
deformations and the thickness variations is evaluated by numerical
simulation and then compared with experimental results. The study
focuses on an aluminum alloy, 5086 H111, which has the same
characteristics as those currently used in aeronautics. An
elastoplastic model with crystallization has been retained. As the
studied problem is symmetric, we chose a plane model to design the
meshed parts.
Numeryczne symulacje zjawiska deformacji
Wpływ wybranych parametrów na deformację wynikającą z różnej
grubości jest oceniana przez symulację numeryczną, a następnie
porównywane z wynikami badań doświadczalnych. Badanie
koncentruje się na stopie aluminium 5086 H111, które ma takie
same cechy jak te obecnie stosowane w lotnictwie. Sprężysty model
krystalizacji został zachowany. Badany problem jest symetryczny,
wybraliśmy model samolotu do projektowania powiązanych części.

Finite Elements Models
The forming process using a die is exanimate. A spherical punch
sticks a sheet metal on an in deformable die thanks to a 100N load.
The sheet metal is also swatted between the tool and the die.
Modified parameters for each experiment are tool radius (6, 8.5,
11mm) and initial sheet metal thickness (0.5, 1.5, 2.5mm). We focus
here on the resulting thickness variation of the sheet metal, given in
microns.
Modele elementów skończonych
Proces kształtowania za pomocą matrycy jest znany. Kulisty stempel
wbija się w metal tworząc odkształcenia o znanej wartości 100N.
Blacha jest również przyciśnięta pomiędzy narzędziem a matrycą.
Zmodyfikowane parametry dla każdego doświadczenia są to
narzędzia o promieniu (6, 8.5, 11mm) oraz początkowej grubości
blachy (0.5, 1.5, 2.5mm) Skupiamy się tutaj na zmianach
wynikających z grubości blach podanych w mikronach.
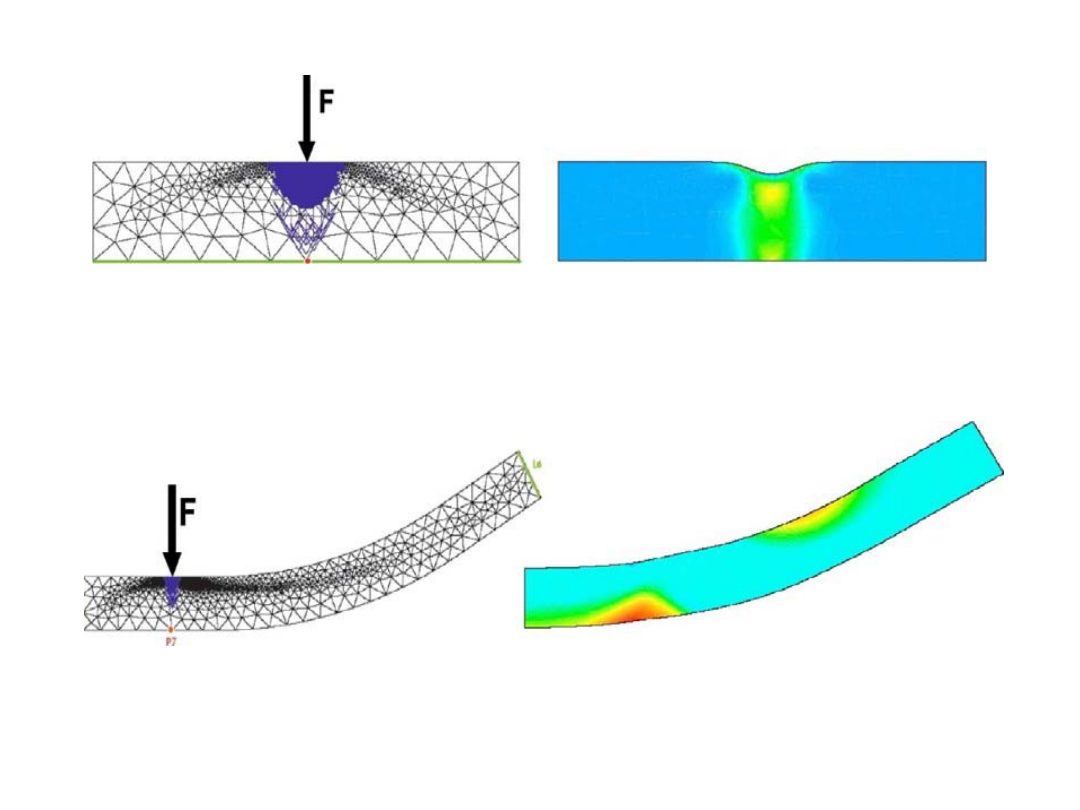
Figure 3: Model 1
Rysunek 3: Typ 1
Figure 4: Model
2
Rysunek 4: Typ
2

On Figure 3, one can observe that deformation is localized closely to
the tool. Its values are from -36.2μm in blue to 83.6μm in yellow. The
greater the tool radius is, the smaller are the thickness variations.
The deformation rate is almost null for 2.5mm sheet metal and is
maximum for the thickest sheet metal. This could be explained by
the fact that the applied force has the same value for all thicknesses.
Its influence is thus lower for thicker sheets. The results, on Figure 4,
show that the maximum deformation appears on the opposite side of
the application point. The calculated values go from 0 in light blue to
33.9μm in red. Contrary to model 1, deformation rate is higher for a
large tool radius. Concerning the other parameters, the deformations
are maximized for the largest z-increment and for the 30° slope.
Na rysunku 3, można zauważyć, że deformacja jest zlokalizowana
blisko urządzenia. Jego wartości wynoszą od -36,2μm w kolorze
niebieskim do 83,6μm w kolorze żółtym. Większy promień narzędzia
jest mniejszy , różnej grubości. Wskaźnik odkształcenia jest prawie
zerowy do 2,5 mm blachy i wynosi maksymalnie do najgrubszej
blachy. Można to wytłumaczyć faktem, że zastosowanie siły ma taką
samą wartość dla wszystkich grubości. Jego wpływ jest więc niższy
dla grubszych arkuszy. Wyniki na rysunku 4 pokazują, że maksymalna
deformacja pojawia się po przeciwnej stronie punktu aplikacji.
Wyliczone wartości zmierzają od 0 w jasnoniebieskich do 33,9μm w
kolorze czerwonym. W przeciwieństwie do modelu pierwszego
wskaźnik odkształcenia jest wyższy o dużym promieniu narzędzia.
Odnośnie pozostałych parametrów odkształcenia są
zmaksymalizowane na największym przyrostu Z i na skosie 30.
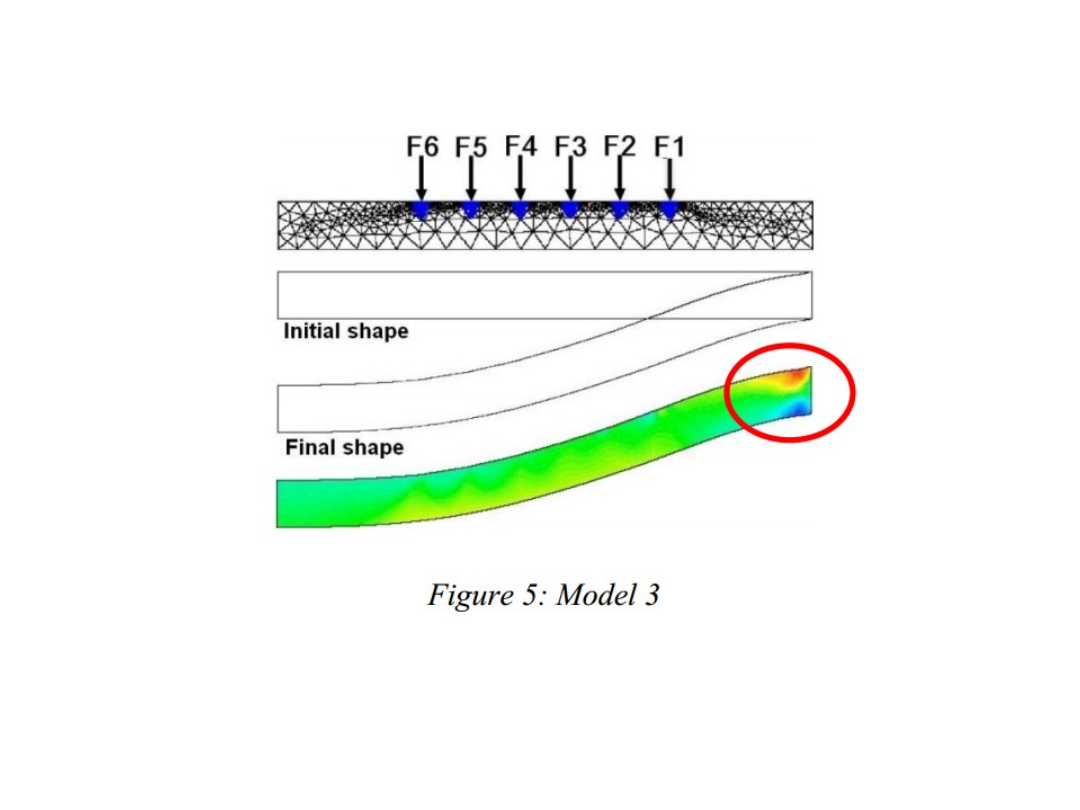
Model 3
Rysunek 5: Model 3
•wstępny kształt
•końcowy kształt

Celem jest redukcja grubości blachy przy użyciu następujących
wartości: siły F1 do F6 50N, nachylenie 30
O
, przyrost Z (ap) 0.6mm,
narzędzie o promieniu 10mm i grubość blachy 1mm. Podczas symulacji,
siły Fi stosuje się po sobie by w końcu uzyskać utworzony arkusz.
Eksperyment ten wskazuje, że grubość pozostaje jednakowa
wzdłuż arkusza. Nie pojawia się osobliwość na punktach ścieżki narzędzia.
Rzeczywiście, zmiana grubości jest zlokalizowana w pobliżu mocowania
blachy (patrz czerwone kółko na rysunku 5). Zakres deformacji jest od
-120 µm w polu ciemno niebieskim do 170 µm w polu czerwonym.
The objective here is to evaluate the thickness reduction of the
sheet by using the following values: forces F1 to F6 50N, slope 30°, z-
increment (ap) 0.6mm, tool radius 10mm and sheet thickness 1mm.
During the simulation, forces Fi are applied after each other to finally
obtain a formed sheet.
This experiment highlights that the thickness remains
homogene along the sheet. No singularity appears at the tool path
points. Indeed, the thickness variation is localized near the sheet
fastening (see red circle on Figure 5). The deformation range is from
-120µm in dark blue to 170µm in red.
Experimental validation
Walidacja doświadczalna
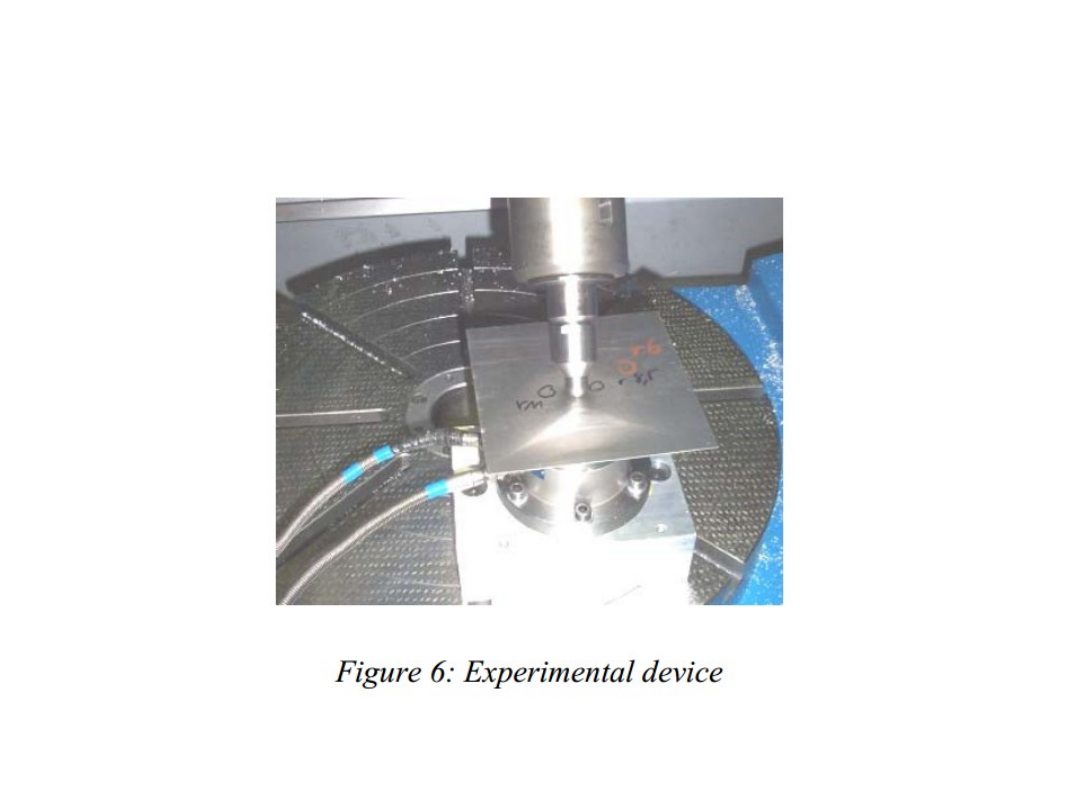
Rysunek 6: Urządzenie eksperymentalne

An hemispherical tool is fastened into the NC machine spindle.
A 5086 H111 sheet metal is fixed on a stress acquisition platform on
the machine tool tilting table. While the tool warps the sheet metal, the
stresses are recorded. The five axis capacities of the machine are used
to avoid working with the complete end of the tool.
Półkuliste narzędzie mocowane jest we wrzecionie maszyny NC.
Blacha 5086 H111 jest zamocowana na dociskanej platformie
ruchomego stołu obrabiarki. Podczas gdy narzędzie wygina blachę
rejestrowane są naprężenia. Zdolność maszyny do poruszania się w
pięciu osiach jest używana po to, by uniknąć pracy końcem narzędzia.

In order to compare the results with simulations, different tool radius
(6, 8.5, 11mm) and sheet thicknesses (0.6, 1.2mm) were used. Contrary to
FEM analysis, load was not imposed but measured and related to the
displacement of the tool. Repeatability tests were performed on the machine
and were conclusive with an error of 4%.
These experiments lead to the following conclusions: sheet thickness
influence raises with the tool radius. For the 6mm tool, the stresses are the
same for both thicknesses but for the 11mm tool there is a difference (25%).
In parallel, for the same deformation value, the corresponding force is higher
with a larger tool radius, as the surface in contact is larger.
W celu porównania wyników z symulacji, używane są różne
promienie narzędzia (6, 8.5, 11mm) oraz grubości blachy (0.6, 1.2mm). W
przeciwieństwie do analizy MES, obciążenie nie zostało nałożone, ale
mierzone i związane z przesunięciem narzędzia. Powtarzalne testy zostały
przeprowadzone na urządzeniu i były miarodajne z błędem 4%.
Eksperymenty te prowadzą do następujących wniosków: grubość
blachy ma wpływ na wzrost wartości promienia narzędzia. Dla narzędzia
6mm naprężenia są takie same dla obu grubości, ale dla narzędzia 11mm
występuje różnica (25%). Równolegle do tej samej wartości deformacji
odpowiadająca siła jest większa dla narzędzia o większym promieniu, tak jak
większa jest powierzchnia kontaktu.

Results
In case of negative forming, simulations show that the tool
does not create any local thickness variation. On the opposite
deformations are located on the points corresponding to the tool
trajectory, so that the deformation flow can be controlled by a proper
mapping of the tool paths. In positive forming, the sheet metal is
gripped between the tool and the die, both deformation and thickness
reduction can be high. If the stress is too high, cracks can appears and
the sheet can be damaged.
Wyniki
W przypadku negatywnego formowania, symulacje pokazują, że narzędzie nie
tworzy żadnych miejscowych zmian grubości. Na przeciwnej stronie deformacje
znajdują się w punktach odpowiadających trajektorii narzędzia, tak, aby przepływ
deformacji mógł być kontrolowany przez prawidłowe odwzorowanie ścieżki narzędzia.
W formowaniu pozytywnym, blacha jest uchwycona pomiędzy narzędziem a matrycą,
zarówno zniekształcenie jak i redukcja grubości mogą być wysokie. Jeżeli naprężenia
są za duże mogą pojawić się pęknięcia i arkusz może zostać uszkodzony.
4 Experimentental study of the process
parameters
Eksperymentalne badanie
parametrów procesu
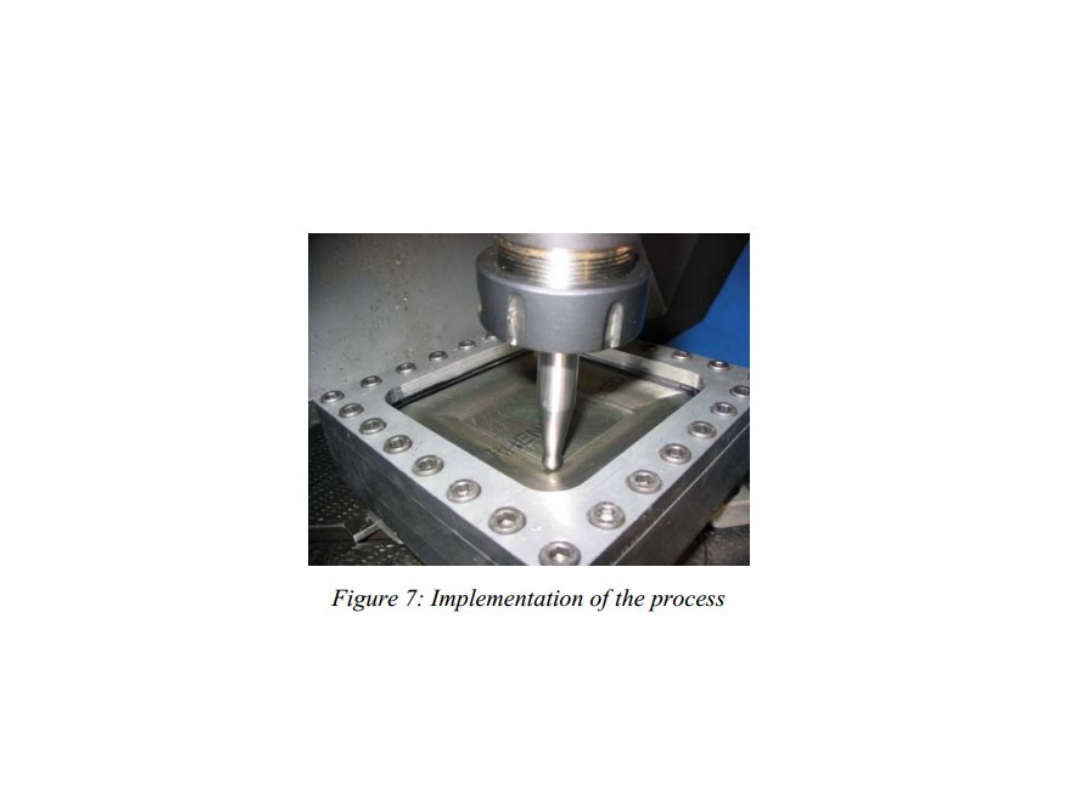
Rysunek 7: Wdrażenie procesu

In parallel of the Finite Element Analysis, an experimental study was
performed to evaluate the effects of the process parameters when forming
an entire shape (Figure 7). The 6 IDMME 2006 Grenoble, France, May 17-19,
2006
objective was first to determine the main difficulties that appear when
implementingthe
process and second to estimate the influence of the forming parameters on:
the tolerance of the formed part (especially the deepness), the forming
time, the forming force. For practical reasons, three parameters were
studied: feed rate (0.5-1m/min), type of trajectory (1-2-3) and axial
increment (0.5-1.5mm).
Równolegle z Analizą Elementów Skończonych, badania
eksperymentalne przeprowadzono w celu oceny wpływu parametrów
procesu przy tworzeniu całego kształtu (Rysunek 7). Zadaniem było
najpierw ustalenie głównych trudności, które pojawiają się przy
wdrażaniu procesu, po drugie oszacowanie wpływu parametrów
formowania na: tolerancję formowanej części (zwłaszcza głębokości),
czas formowania, siły formowania. Z powodów praktycznych badano
trzy parametry: posuw (0.5-1m/min), rodzaj trajektorii (1-2-3) i osiowy
przyrost (0.5-1.5mm).
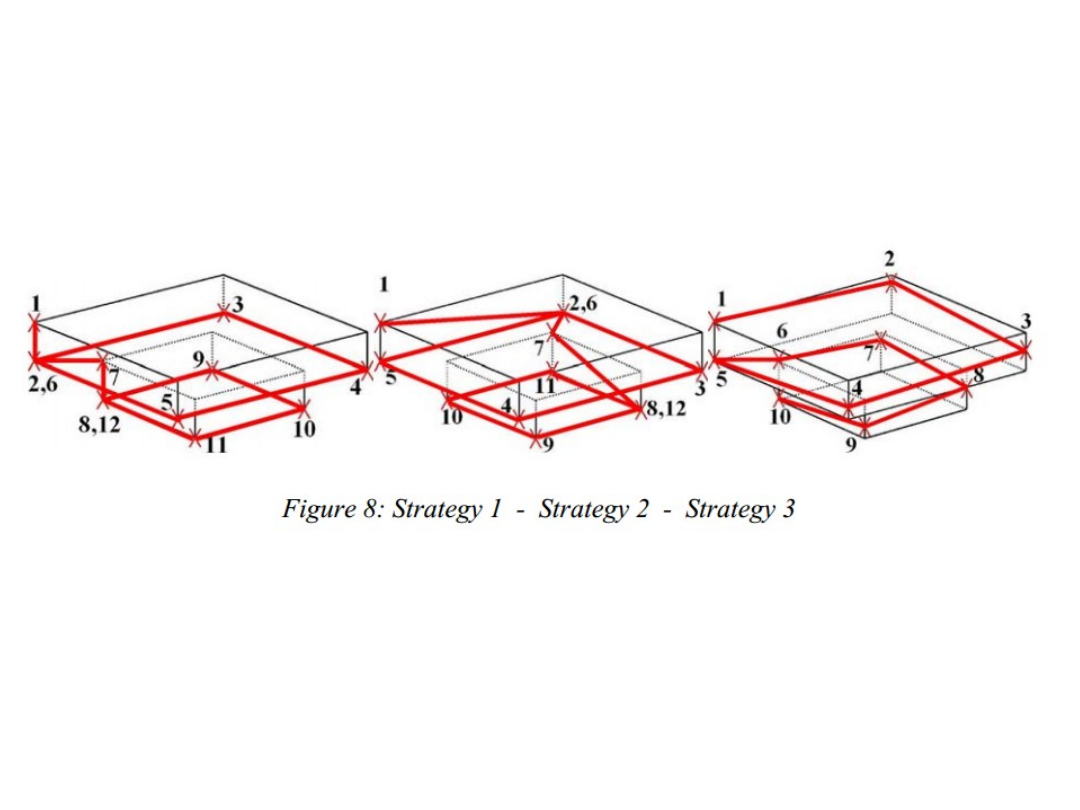
Rysunek 8: Strategia 1 – Strategia 2 – Strategia 3

Strategies 1, 2 and 3 are given on Figure 8. Strategy 1 consists
in z-level contouring; after each level the axial increment is taken
plainly by a vertical movement. In Strategy 2, the axial increment is
obtained gradually along one side of the square shape. In Strategy 3, a
quarter of axial increment is taken along each side of the square. The
metal sheets were made of aluminium alloy (5086 H111), their
thickness was 0.6 mm. An hemispherical head tool with a 10 mm
diameter was used. The part which has been formed is on Figure 9.
Strategie 1, 2 i 3 podane są na rysunku 8. Strategia 1 składa się z
z-poziomu modelowania; po każdym poziomie osiowy przyrost przechodzi
wyraźnie przez pionowy ruch. W strategii 2 osiowy przyrost uzyskuje się
stopniowo, wzdłuż jednego boku kwadratowego kształtu. W strategii 3
ćwierć osiowego przyrostu przechodzi wzdłuż każdego boku kwadratu.
Blachy zostały wykonane ze stopu aluminium (5086 H111), ich grubość
wynosiła 0.6mm. Użyte zostało półkuliste narzędzie o głowicy średnicy
10mm. Część, która została utworzona przedstawiona jest na rysunku 9.
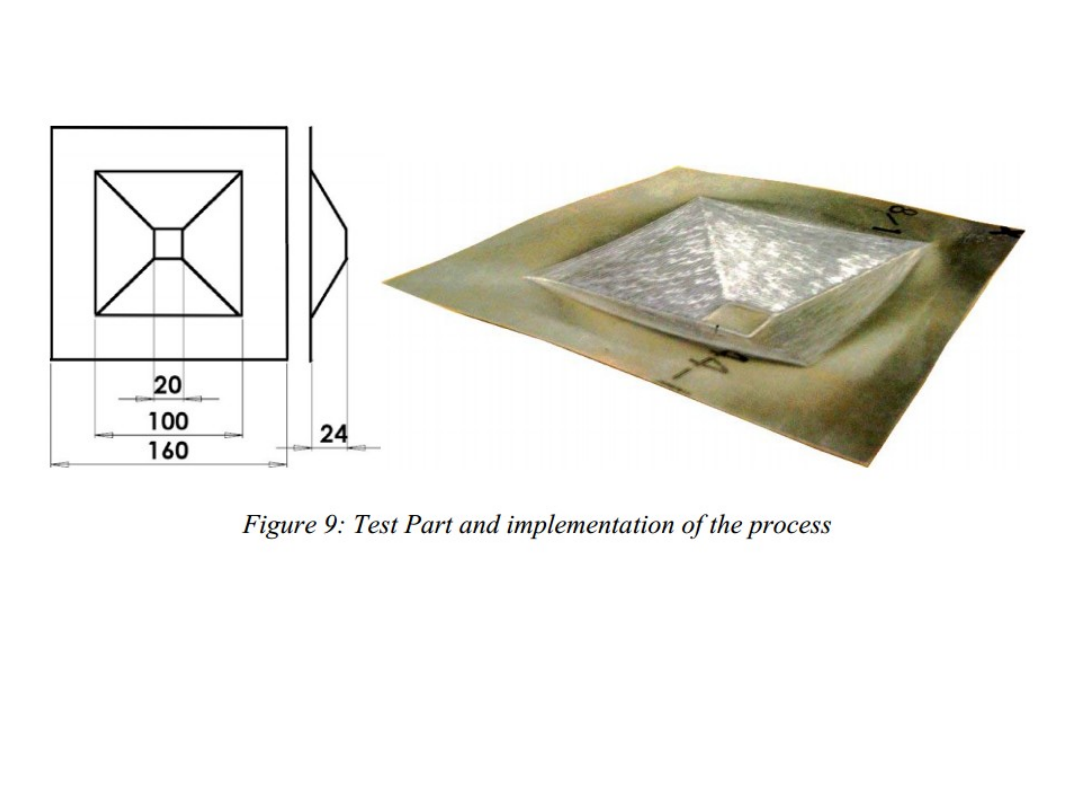
Rysunek 9: Część testowa i wdrożenie procesu
Experimental results
Wyniki eksperymentu
Forming force
Siła formowania
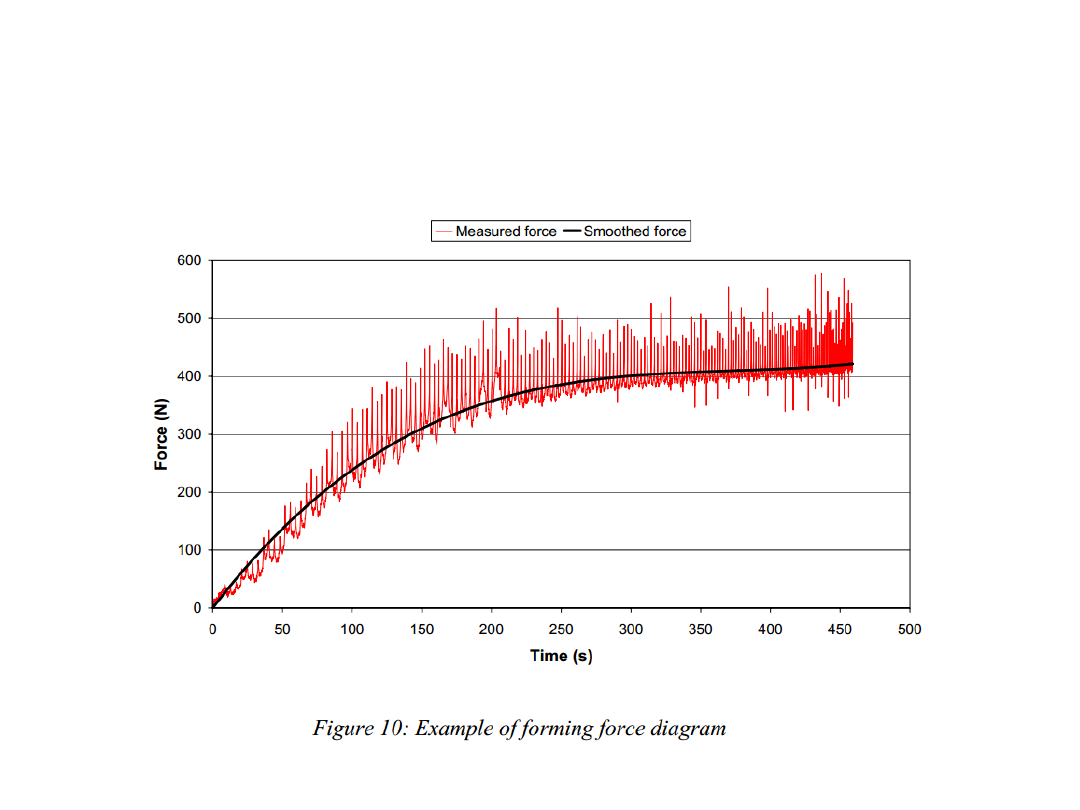
Rysunek 10: Przykład tworzenia wykresu siły

Two types of forces were studied: Maximal Measured Force,
which is the highest value measured during the experiment and
Maximal Smoothed Force, which is calculated from a trend curve
inferred from the measured curve (Figure 10). Maximal Smoothed Force
is the maximum of the trend curve. Although it does not give any
information of the maximal force needed, it is a good image of the
mean forming force
Badano dwa rodzaje sił: maksymalna siła mierzona, która jest
najwyższą wartością mierzoną podczas eksperymentu i maksymalna
siła wyrównana, która jest punktem maksymalnym na krzywej trendu.
Chociaż nie daje to żadnych informacji o maksymalnej potrzebnej sile,
jest to dobry widok średniej siły kształtowania.
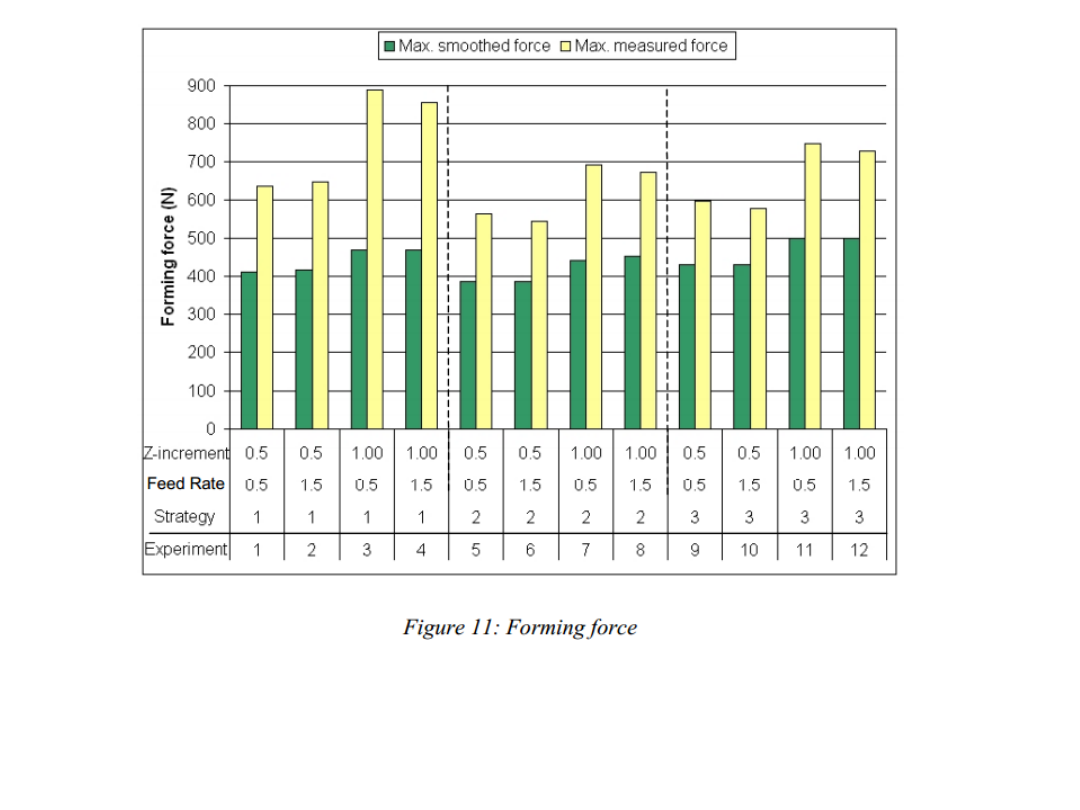
Rysunek 11: Siła kształtowania(z-przyrost, posuw, strategia,
eksperyment)

According to the results on Figure 11, the smoothed force stays
under 500N for each experiment. This value is wide under the
capacities of an usual milling machine. The measured force peaks are
higher in Strategy 1 than in Strategy 3 (the axial increment is obtained
by a single z-movement, which generates an impact).
Zgodnie z wynikami na rysunku 11, wyrównana siła pozostaje
poniżej 500N dla każdego eksperymentu. Ta wartość jest bardzo
szeroka jak na możliwości zwykłej frezarki. Mierzone wartości
maksymalne siły są wyższe w strategii 1 niż w strategii 3 (osiowy
przyrost jest uzyskany przed pojedyncze z-przemieszczenie, które
generuje uderzenie).

Eventually, feed rate has no significative effect of the forming
force. To support this hypothesis, others experiments were conducted,
using the same parameters except feed rate, which was 3m/min and
5m/min. Both measured and smoothed forces stay in a 4% zone and no
tendency is observed.
Repeatability tests were also conducted to evaluate the margin
of error of our results. The values present a dispersion of 0.4% for the
maximal smoothed force and 2.7% for the maximal measured force. As
a consequence, the process has a very high repeatability about the
forming force.
Ostatecznie, posuw ma znaczny wpływ na siłę formowania. Aby
wesprzeć tą
hipotezę, przeprowadzono inne eksperymenty stosując te same parametry z
wyjątkiem posuwu, który miał
wartość 3m/min i 5m/min. Obie mierzone i wyrównane siły pozostały w sferze
4% i nie zaobserwowano żadnych zmian.
Badania powtarzalności zostały przeprowadzone w celu
oceny marginesu błędu z
naszych wyników. Wartości przedstawiają rozproszenie 0,4% dla maksymalnej
siły wyrównanej i 2,7% dla maksymalnej mierzonej mocy. W
rezultacie, proces ma bardzo wysoką powtarzalność jeśli chodzi o siłę
formowania.

Forming Time
As the feed rate is quite low compared to the dynamic capacities of
the machine tool used, the measured times are very close to theoretical
times, calculated from the path length and the feed rate. For example,
the difference between theoretical time and measured time for
experiment 1 which took 23 minutes, was less than 20 seconds.
Czas formowania
Tak długo jak posuw jest niski w porównaniu do możliwości
używanego narzędzia, czasy pomiarowe są bardzo podobne do
teortycznych czasów, wyliczonych z długości toru i posuwu. Na przykład,
różnica między czasem teoretycznym i praktycznym z próby 1, która
zajęła 23 minuty, była niższa niż 20 sekund.
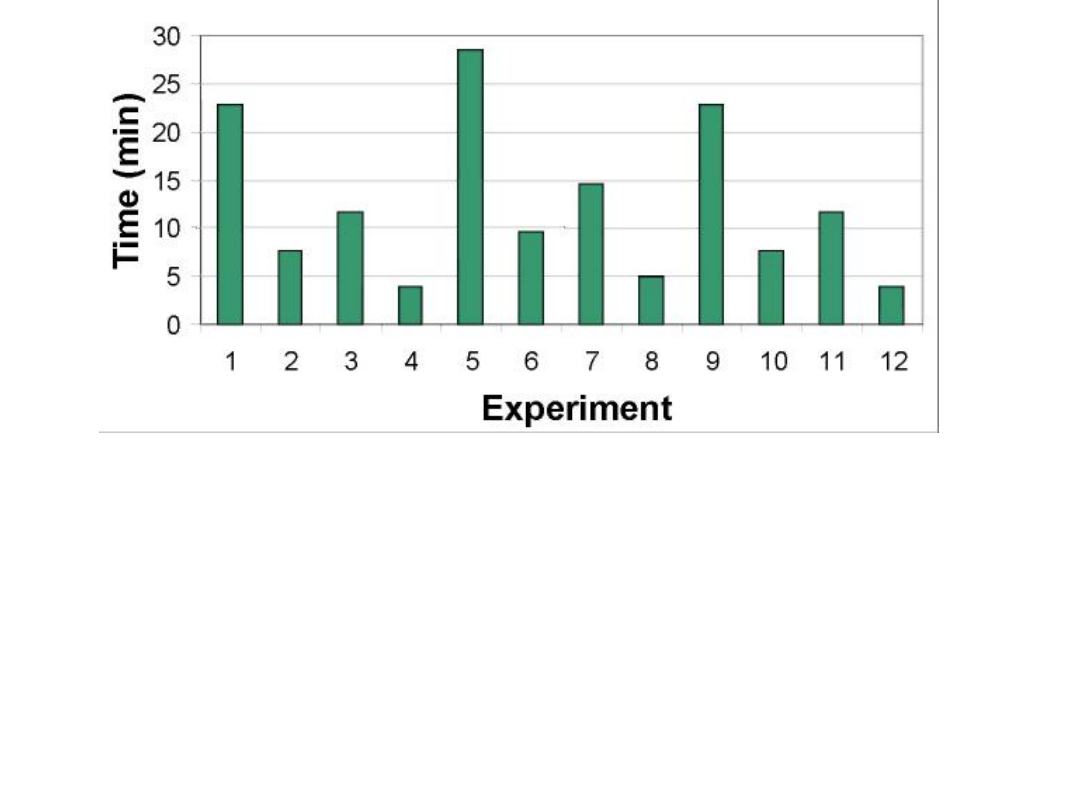
Figure 12: Forming time
Time -
czas pracy narzędzia
Experiment
-
numer próby
Figure 12: Forming time
-
Rysunek 12: Czas
formowania
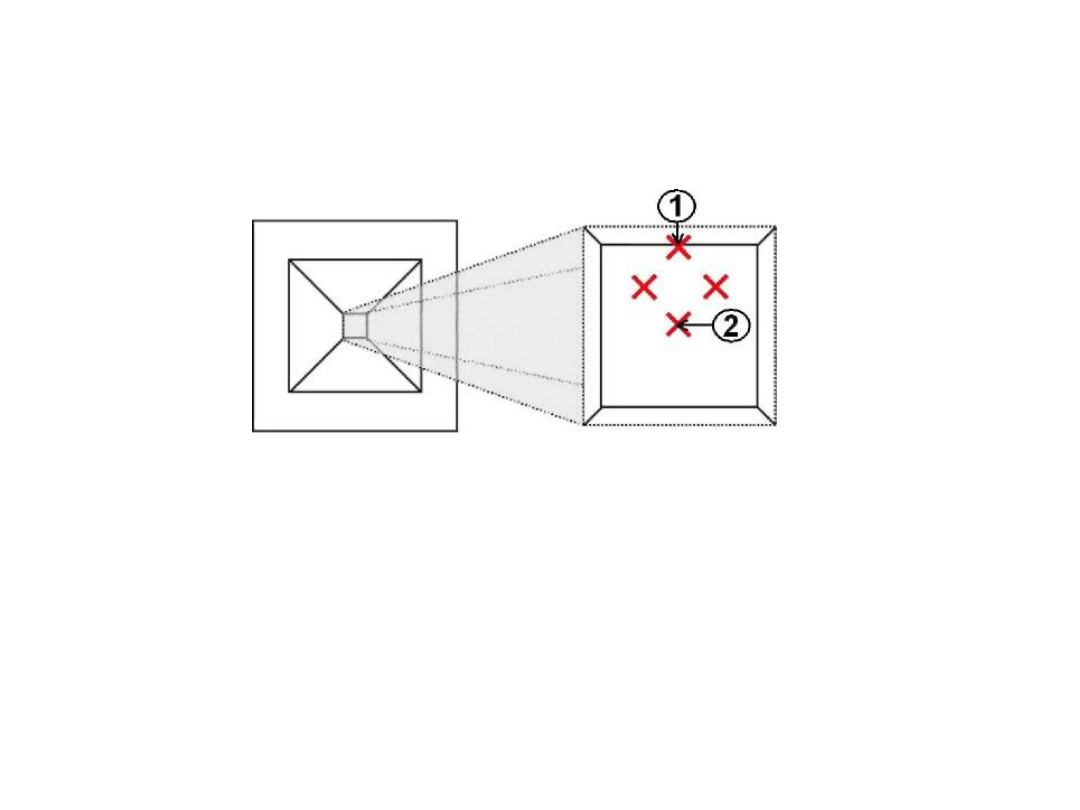
Quality of the formed part
After each experiment, the depth of the part was
measured in order to evaluate the quality of the piece
obtained by this process. Measured points are on Figure 13.
Jakość uzyskanej części
Po każdej próbie, dno części było mierzone w celu
oszacowania jakości uzyskanej w tym procesie. Punkty
pomiarowe znajduja się na rysunku 13.
Figure 13: Measured points for controlling the depth
Rysunek 13: Punkty pomiarowe do kontrolowania
głębokości.
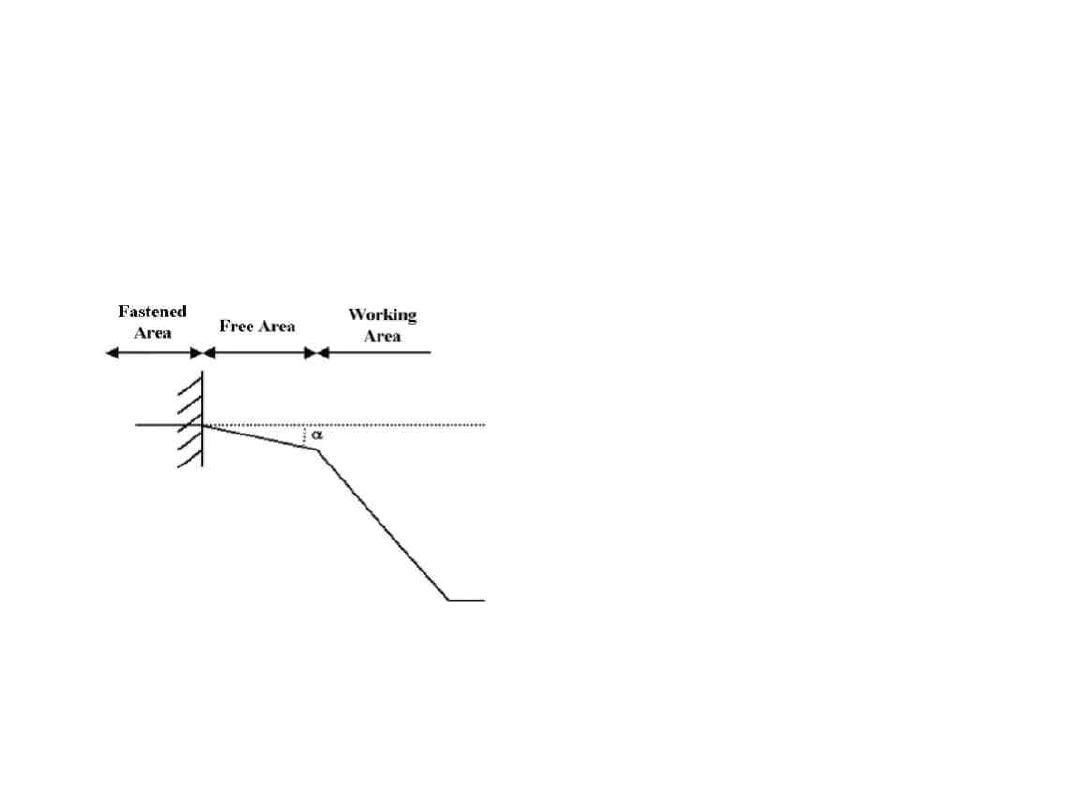
The final depth measured on the part is always lower than the
programmed value. This can be explained by a combination of the
elasticity of the aluminum alloy and the shape of our sheet fastening
system. Indeed the available surface on the fastening system is larger
than the working area. It remains a free area which only works in the
elastic domain and generates the depth error when returning to its initial
position after the forming operations (Figure 14).
Ostateczna zmierzona głębokość części zawsze znajdowała się poniżej
zaprogramowanej głebokości. Można to wyjaśnić sprężystością stopu
aluminium i systemem mocowania arkusza. Tak naprawdę dostepna
powierzchnia w systemie mocowania jest wieksza niż powierzchnia
formowana. To pozostawia wolny obszar, który pracuje tylko
sprężyście i generuje wady kiedy powraca do początkowej formy po
procesie formowania (rysunek 14).
Figure 14: Distribution of the
areas on the fastening system
Rysunek 14: Rozkład obszarów
w systemie mocowania.
Obszar Wolny
Obszar
mocowania obszar
pracy

The results for each experiment (Figure 15) lead us to the
following conclusions. Strategy 3 is the worst strategy regarding to
the depth error: although the imperfect shape is smaller, the location
error of the tool trajectory point is three times higher. The feed rate
has no influence on the quality of the part for these values.
Nevertheless, other tests performed at 5 m/min showed that a too
high feed rate harms the quality of the part. The axial increment (a
p
)
has a major effect on the tolerance of the final part. For example, the
only difference between experiments 1 and 3 is z-increment.
Rezultaty dla każdej próby (Rysunek 15) prowadzą nas do
nastepujących wniosków. Strategia nr 3 jest najgorszą nawiązując
do błędu w dnie: aczkolwiek niedokładność kształtu jest mniejsza,
błąd lokalizacji punktu trajektorii narzędzia jest trzy razy wyższy.
Posuw nie ma wpływu na jakość części dla tych wartości. Pomimo
to, inne testy wykonane przy 5m/min pokazuja, że wysokie
wartości posuwu pogarszają jakośc przedmiotu. Osiowy przyrost
(a
p
) ma duży wpływ na tolerancję końcowej części. Na przykład,
jedyną różnica miedzy próbami 1 i 3 jest przyrost wartości z.

Figure 15: Results of depth measures
Figure 15: Results of depth measures
- Rysunek 15: Rezultat w pomiarze
dna
Error of the point 1
– błąd w punkcie 1
Imperfect shape at point 2
– niedoskonałości kształtu w punkcie
2

Synthesis and further results
Experimental results show that incremental sheet forming has a very
good repeatability in terms of effort and quality. Concerning the
influence of feed rate, no effect has been detected on the forming force;
under 2 m/min, it does not affect the quality of the part. For any
parameter combination, the required loads stay far under the machine
tool capacities.
Eventually, there is no relation between the forming time and the quality
obtained. We managed to form parts which error remains under 0.1mm
without any trajectory optimisation. Because of the springback, the
points that have the best position accuracy are on the tool trajectory. As
a consequence a dedicated fastening system should be used.
Synteza i dalsze rezultaty
Wyniki eksperymentu pokazują, że formowanie z arkuszy ma bardzo
wysoką powtarzalność pod względem nakładów i jakości. Biorąc pod
uwagę wpływ posuwu, nie wykryto żadnych zmian podczas tłoczenia;
ponizej 2m/min, nie wpływa na jakość części. Dla jakiejkolwiek kombinacji
parametrów, wymagane obciążenia znajdowały się dużo poniżej zdolności
maszyn.
Ostatecznie, nie ma zależności pomiedzy czasem formowania, a uzyskaną
jakością. Udało nam się tworzyć części w których bład wynosi poniżej
0.1mm bez optymalizacji trajektorii ruchu narzędzia. Ze względu
na sprężynowania, punkty, które mają najlepszą dokładność położenia są
na trajektorii narzędzia. System ten może może zostać zastosowany.
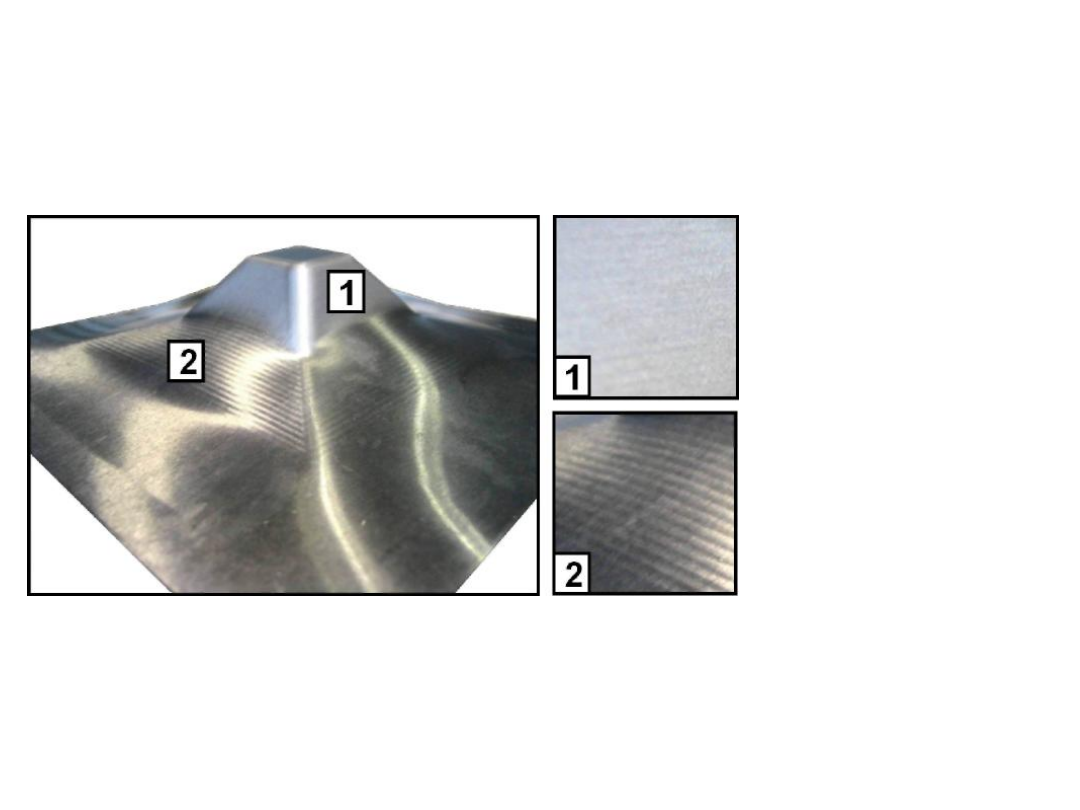
Others shapes were formed without any difficulty: sphere
portions, two slopes-pyramids (Figure 16). They showed that the
surface roughness is better for 50° slopes than for 30° slopes,
which does not match the numerical simulations.
Inne ksztalty były wykonane bez żadnych trudności: części
kuli, dwa stoki-piramidy (Rysunek 16). Te przykłady pokazały, że
chropowatość powierzchni jest mniejsza dla 50° nachyleń niż dla
nachyleń 30°, które nie pasują do symulacji numerycznych.
Figure 16: Example of a
two slopes-pyramid
Rysunek 16: Przykład
dwóch boków piramidy
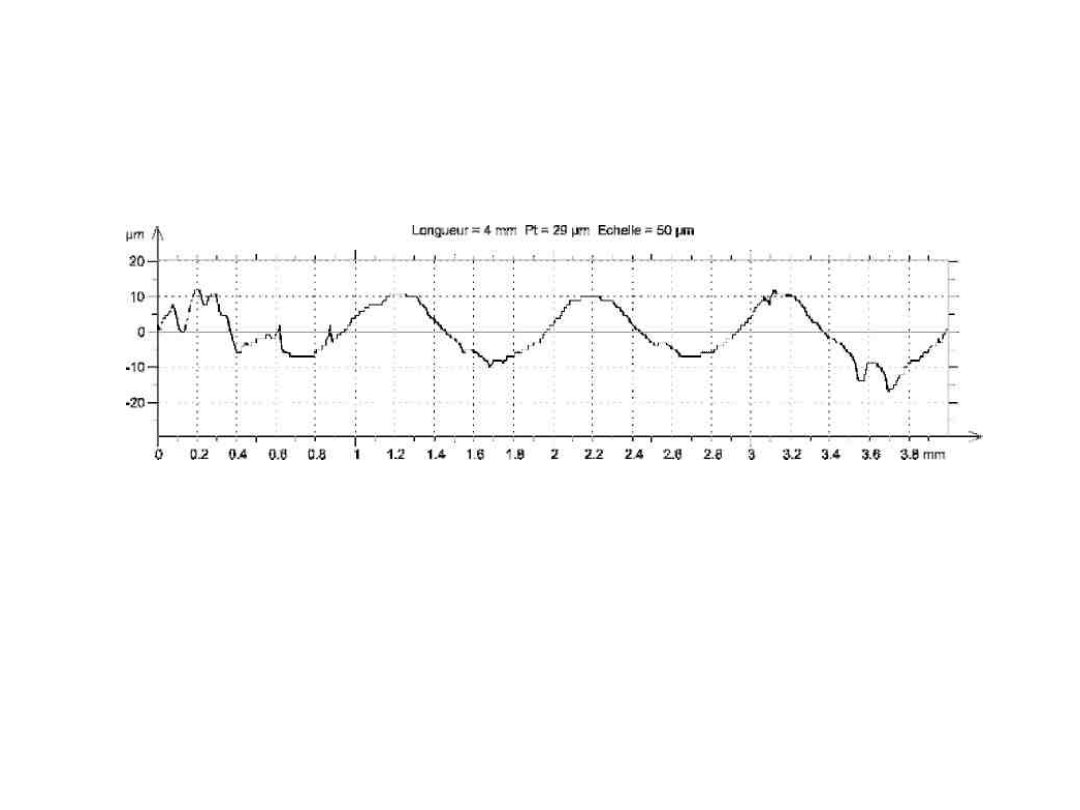
On Figure 17, which shows the surface roughness obtained for a 30°
slope, the oscillation period corresponds to the z-increment used to form
the part. However, when performing negative forming, it is also be
better to stay under a slope of 70°; from this value, this sheet metal
often breaks.
Na Rysunku 17, który pokazuje chropowatość powierzchni otrzymanej dla
nachylenia
30°,
okres drgań odpowiada
przyrostowi-
z wykorzystywanemu do tworzenia części. Jednak, przy formowaniu
negatywowym, także lepiej zostac przy nachyleniu poniżej 70°; powyżej
tej wartości arkusz blachy często ulega zniszczeniu.
Figure 17: 30° slope surface roughness
Rysunek 17: chropowatość przy 30° nachyleniu

Conclusion
Incremental sheet forming is a new process for obtaining sheet
metal parts. Compared to deep drawing, it offers high flexibility and
enables agile production, as it is not necessary to modify the punch
or the mould to manufacture a new part geometry. Only toolpaths
have to be changed. This process is also very promising in case of
prototypes or short runs.
Wnioski
Przyrostowe formowanie blach to nowy proces otrzymywania
części z blach. W porównaniu do głębokiego tłoczenia, oferuję dużą
elastyczność i pozwala na sprawną produkcję, ponieważ nie jest
konieczna zmiana stempla lub formy do produkcji nowej geometrii
części. Tylko ścieżki prowadzenia narzędzia muszą być zmienione.
Proces ten jest również bardzo obiecujący w przypadku prototypów
lub produktów nisko seryjnych.

In this paper, a finite elements simulation of the deformation
phenomenon in incremental sheet forming has been developed. Its
results, confronted with experimental validation, prove that no local
deformation is generated by the tool in case of negative forming,
except near the fastening system. When implementing positive
forming, stresses can raise rapidly as the sheet metal is gripped
between the tool and the die. As a consequence, tool trajectories have
to be generated with precision in order to avoid any damage. A relation
between force imposed and resulting deformation has also been set up.
W niniejszej pracy, została opracowana analiza elementów
skończonych zjawisk deformacji. Wyniki analizy w porównaniu z
eksperymentem dowodzą, że żadna deformacja nie jest generowana
przez narzędzie podczas formowania negatywne, z wyjątkiem obszaru
blisko mocowania. Przy formowaniu pozytywnym, naprężenia mogą
szybko wzrosnąć gdy arkusz blachy jest zaciśnięty między narzędziem,
a matrycą. W konsekwencji, trajektoria narzędzia musi być precyzyjnie
ustawione by uniknąć uszkodzeń. Relacja między przyłożoną siła, a
uzyskana deformacją także musi być ustawiona.

In parallel, an experimental study was conducted about the
impact of the process parameters on the quality of an entire part.
Forming force and time were also recorded. It appears that feed
rate has no effect under 2m/min. Z-increment can be taken along z-
axis without any loss of quality or spindle damage. But its value
affects the global precision of the part: with a small increment, the
gap between two consecutive tool paths is smaller and the final
shape is better.
Jednocześnie,
zostały
przeprowadzone
badania
eksperymentalne na temat wpływu parametrów procesu na jakość
całej części. Siła kształtowania i czas zostały również zarejestrowane.
Wydaje się, że posuw nie ma wpływu przy wartości poniżej 2m/min.
Przyrost-z może być znajdować się wzdłuż osi bez utraty jakości lub
uszkodzenia wrzeciona. Ale jego wartość ma wpływ na ogólną
jakość części: z małego przyrostu, różnica między dwoma kolejnymi
ścieżkami narzędzi jest mniejsza i ostateczny kształt jest lepszy.

This work was carried out within the context of the working
group Manufacturing 21 which gathers 11 French research
laboratories. The topics approached are: the modeling of the
manufacturing process, the virtual machining, the emerging of new
manufacturing methods.
Praca ta została przeprowadzona w ramach grupy roboczej
„Manufacturing 21,
która
gromadzi 11 francuskich laboratoriów badawczych.
Tematy dotyczą: modelowanie procesu produkcji, wirtualne obróbka
skrawaniem, nowych metod produkcji.
Document Outline
- Slide 1
- Slide 2
- Slide 3
- Slide 4
- Slide 5
- Slide 6
- Slide 7
- Slide 8
- Slide 9
- Slide 10
- Slide 11
- Slide 12
- Slide 13
- Slide 14
- Slide 15
- Slide 16
- Slide 17
- Slide 18
- Slide 19
- Slide 20
- Slide 21
- Slide 22
- Slide 23
- Slide 24
- Slide 25
- Slide 26
- Slide 27
- Slide 28
- Slide 29
- Slide 30
- Slide 31
- Slide 32
- Slide 33
- Slide 34
- Slide 35
- Slide 36
- Slide 37
- Slide 38
- Slide 39
- Slide 40
- Slide 41
- Slide 42
Wyszukiwarka
Podobne podstrony:
OveLeichenring robot automation in manufacturing industries
Antibody manufacture in transgenic animals and comparisons
Six Sigma In Non Manufacturing
Fregni A study of the manufacture of copper spearheads in the old copper complex
Education in Poland
Participation in international trade
in w4
Metaphor Examples in Literature
Die Baudenkmale in Deutschland
Han, Z H & Odlin, T Studies of Fossilization in Second Language Acquisition
2002 4 JUL Topics in feline surgery
Midi IN OUT
Neural networks in non Euclidean metric spaces
Marsz żałobny, Marsz żałobny Clarinet in Bb 2
więcej podobnych podstron