
D
EAN
L. S
ICKING
C
ODY
S. S
TOLLE
Univ. Nebraska-Lincoln, Lincoln, NE, USA
FACTORS LEADING TO CABLE MEDIAN BARRIER FAILURES
PRZYCZYNY AWARII KABLOWYCH BARIER DROGOWYCH
ROZDZIELAJĄCYCH KIERUNKI RUCHU
Abstract Cable median barriers are used across the globe to separate opposing lanes of travel on high-
speed and high-volume facilities. In the United States (US) these barriers are frequently used in
depressed medians where cross slopes preclude the implementation of most guardrails and all concrete
barriers. The ability to install cable barriers on moderate slopes makes them much less costly than other
types of barriers. In fact, the simple cost of filling in a median to reduce cross slopes is often more costly
than the entire cable barrier system.
Streszczenie Kablowe bariery używane są na całym świecie do rozdzielenia pasm ruchu w przeciwnych
kierunkach na drogach o szybkim ruchu i dużym nasileniu. W USA takie bariery są często stosowane
w zagłębieniach, gdy spadek zbocza wyklucza zastosowanie większości innych barier a zwłaszcza
betonowych. Możliwość zainstalowania kablowych barier na średnio stromych zboczach pozwala
na obniżenie kosztów. Praktycznie koszt wypełnienia rowu żeby zmniejszyć kąt nachylenia zbocza jest
często dużo większy od całego kosztu bariery kablowej.
General
Cable median barriers have been shown to reduce median related fatal crashes by as
much as 90%. Further, accident analysis has shown that for most rural freeways, cable
median barriers are the only cost-effective method for controlling cross median crashes.
Practical guidelines for the implementation of these barriers in rural areas have been
developed and are now beginning to gain acceptance across the US.
However, high speeds and high-traffic volumes commonly found on rural interstate
highways across the US produce large numbers of cross median and barrier related fatalities
even when a cable barrier is present. It is estimated that more than 250 cross median and
cable barrier related fatal crashes occur annually where cable median barrier is installed.
Further, industry experts estimate that the installed base of cable median barriers in the US
will double over the next 10 years. Such an increase in cable barrier installations could be
expected to produce 500 barrier related fatal crashes per year. Unfortunately there currently
is no information available that indicates why some vehicles penetrate through or rollover
during cable barrier crashes. Thus, there is a need to identify factors that lead to serious
injury and fatal crashes involving cable median barriers. Identifying the characteristics
of these costly crashes is the first step in the process of improving barrier designs to mini-
mize the overall accident costs associated with these barriers.
In recognition of the need to improve the safety performance of cable median barriers,
the Mid-America Transportation Center funded a study of cable median barrier failures.

882
Sicking D. L. i inni: Factors leading to cable median barrier failures
The study focused on serious injury and fatal crashes involving cable median barriers
and started with the collection of more than 20,000 cable barrier related accident records.
This database was reduced to approximately 500 crashes (2.5%) that involved either serious
or fatal injuries to one of the vehicle occupants. The data set was further restricted by lack
of adequate trajectory data to approximately 1900 crashes. Vehicle types, impact angles,
vehicle orientation, and median configuration were compiled for each of the serious injury
and fatal crashes. A similar database was developed under a separate study that provided
detailed information regarding impact conditions for serious injury and fatal ran-off-road
crashes on high-speed freeways.
Comparison of the two distributions of vehicle types and crash conditions has identified
a number of critical impact conditions and median configurations that were significantly
overrepresented in the cable barrier crash database. These crash parameters can now be utili-
zed by barrier designers to isolate common causes for vehicle penetration of cable barriers
and/or vehicle rollovers associated with cable barrier crashes. Based on an evaluation of the
common crash conditions associated with barrier penetrations it is anticipated that serious
injury and fatal crashes involving cable median barriers can be reduced by as much as 30%
by redesigning cable barriers to eliminate this problem. Even this modest level of improved
safety performance could eventually eliminate as many as 150 fatal crashes each year across
the United States.
Many roadways with divided medians and high traffic volumes are subject to a high risk
of crossover crashes. Cable median barriers are a safe, effective, and inexpensive method
of preventing these crossover crashes. Cable median barriers have been shown to reduce
median related fatal crashes by as much as 90% (1). Further, accident analysis has shown that
for most rural freeways, cable median barriers are the only cost-effective method for contro-
lling cross median crashes (2). Practical guidelines for the implementation of these barriers in
rural areas have been developed and are now beginning to gain acceptance across the US (2).
Although cable median barriers generally show exceptional crashworthiness behavior and
have exceeded the design capacity in many crash events, cable median barriers are still
subject to vehicular penetration and rollovers, frequently resulting in incapacitating injury or
fatality. At the same time, cable median barrier construction continues to increase, and many
industry experts predict that the installed base of cable median barrier will double
in the United States in the next decade. Researchers are at a unique position to identify
potential problems and causes of cable median barrier failures before the barriers are
installed, and may therefore prevent as many as 250 fatalities resulting from crashes with
cable median barriers every year
Introduction
Much of the US freeway system was designed and constructed in the 1950s and ‘60s.
During this time it was common to build high-speed facilities with 9 m (30 ft) and 12 m
(40 ft) wide open medians. However, with low traffic volumes found on those freeways
during this period, frequency of tragic cross median crashes was still relatively low.
The California Department of Transportation, (Caltrans), conducted a study on the benefits
of using cable barrier in these relatively narrow medians (4). This study indicated that
barriers could not be justified in medians wider than 15 m (50 feet). Caltrans repeated this
study several times between 1973 and 1993. Each time the authors arrived at the same
conclusion, barriers were not cost-effective when installed in medians wider than 50 feet.
However, findings from the 1997 version of this study were quite different and reco-
mmended barriers be placed in medians as wide as 22 m (75 ft) (5).

Konstrukcje stalowe
883
Cable barriers have long been recognized as an effective way of preventing vehicles from
encountering dangerous side slopes and embankments and separating traffic on high-speed
facilities. Accident data analysis has indicated that cable barriers provide the highest overall
level of safety when compared to concrete safety shapes and steel beam guardrails (6, 7).
Further, study of guardrail performance on slopes indicated that cable median barriers can
perform effectively when installed on slopes as steep as 5:1 (8) while metal beam guardrails
demonstrated unsafe performance on 6:1 slopes. Finally, cable barriers offer the lowest cost
barrier option for use in medians of high-speed freeways. In view of the positive safety
performance, capability of performing when installed on sloping medians, and low constru-
ction costs, is not surprising that most highway agencies in the US have decided to imple-
ment cable barriers whenever it is necessary to retrofit an existing depressed median
to prevent cross median crashes. As of today more than 30 states departments of transporta-
tion has adopted this policy with many of them having installed more than 100 miles barrier.
As a result, industry experts begun to predict that the installed base of cable median barrier
in the US will more than double over the next 10 years.
Even though cable median barrier has compiled positive performance record, the high
number of crashes that occur in narrow medians on high-speed high-volume freeways still
produce significant numbers of serious injury and fatal crashes involving cable barrier.
A study of more than 5000 cable barrier crashes over a two-year period found 12 fatal and 25
serious injury crashes (1). Surprisingly only half of the fatal crashes involved vehicles
penetrating through the barrier and entering opposing traffic lanes. The remaining fatalities
appeared to be related impact with the cable barrier. Although, the rate of six fatal crashes
per year represented a 90% reduction in fatal crash rates when compared to the time prior
to installation of cable barrier, these six fatal crashes per year would indicate that as many
as 500 fatal crashes will occur annually in the US when the installed base of cable median
barriers doubles over the next decade. This level of fatal crashes associated with any safety
feature is unacceptable. If this situation is to be avoided, improved cable barrier designs and
deployment guidelines must be developed immediately in order to be implemented during
the current wave barrier construction. The first step in developing better barrier designs
and placement guidelines is to discover the primary causes associated with cable barrier
crashes adducing fatalities and serious injuries.
In recognition of the critical need for better understanding of the causes of cable barrier
penetrations and serious injury and fatal crashes, the Mid-America transportation center,
in collaboration with Safence Incorporated, funded the study described herein. The goal
of this study was to take the first step toward improving cable median barrier performance by
determining the factors, such as impact conditions, vehicle type, median slope, and barrier
placement that tend to produce cable barrier penetrations and serious injury and fatal crashes.
Safence, Mid-America Transportation Center and the Midwest Roadside Safety Facility will
utilize the findings from this study to develop a better barrier design and guidelines
for barrier implementation that can significantly reduce serious injury and fatal crash rates
involving cable median barrier.
Accident Data
The primary source of accident data used in the current study was a collection of crash
reports and investigations involving serious injury and fatal crashes on cable median barrier
in the State of Missouri. Between 2007 and 2009, 7093 cable median barrier crashes were
reported in Missouri, and of those crashes, 174 were recorded as involving serious injury
or fatality. Hence the combined serious injury and fatal crash rate for cable barrier

884
Sicking D. L. i inni: Factors leading to cable median barrier failures
in Missouri was found to be 2.5%. This finding is consistent with prior accident studies
of cable barriers that indicated low crash severities for cable barriers when compared to other
types of barriers. For example, the combined serious and fatal injury rates for guardrail and
bridge rail crashes in Kansas were found to be 4.9% and 3.6% respectively (3).
Accident reports were obtained for all 174 crashes involving serious or fatal injury
in the Missouri database. Fortunately, 169 of the accident reports included detailed drawings
of the accident scene, including measurements of vehicle position near points of departure
and impact, and vehicle tire marks laid down as the vehicle approached the barrier. A careful
examination of these crashes revealed that the cable barrier had a significant contribution to
occupant injury in 128 of the crashes. The remaining 47 crashes involved other mechanisms
for occupant injury, including vehicle rollover prior to the barrier impact, impacts with
another vehicle before leaving the travelway, and acute health problems unrelated to the
crash. When crashes involving injuries produced prior to striking a barrier are eliminated
from the database, the combined serious and fatal injury crash rate was reduced to 1.7%.
Note that it is possible that a number of critical injury and fatal crashes involving cable
median barriers were incorrectly coded and therefore excluded from the database. However,
prior experience with accident reports associated with barrier crashes would indicate that it is
not common that a police officer fails to indicate the barrier was struck for an accident
involving serious injuries and fatalities. Therefore, the authors assume that the numbers
of these crashes missing from the database would be relatively low. Further, even if a signi-
ficant number of these cases do occur, there is no reason to believe that omitted cases would
have a bias in any characteristic other than injury severity. Because police officers likely to
spend more time investigating serious injury and fatal crashes, the bias would reduce the risk
of case omission as the severity increased.
Using reported length and width measurements taken by investigating officers at points
of vehicle departure from the road and impact with the cable median barrier, accident scene
diagrams were scaled to account for varying longitudinal and lateral scale factors.
Approximate scaled crash scenes were thereby used to generate vehicle trajectory infor-
mation up to the point of impact with the barrier system. Trajectory data included the vehicle
velocity vector angle as well as sideslip angle and the angle between the vehicle's
longitudinal axis and the barrier. This information was used to build a database of crash
impact conditions to evaluate vehicle/barrier interaction. Unfortunately, the 22 North
Carolina crashes utilized different selection criteria than the Missouri cases. Evaluation
of the distribution of trajectory angles and heading angles at impact showed that these two
datasets were statistically dissimilar. The following two sections of the paper were therefore
limited to analysis of the larger Missouri dataset. A subsequent section of the paper
compared the two data sets.
Barrier Related Rollovers and Penetrations
As shown in Table 1, rollovers caused by impact with a cable barrier were frequently
observed in sedan, pickup, and SUV crashes, which combined for more than 65% of all
rollovers observed. By contrast, penetration events commonly involved sedan and coupe
impacts. Conventional automobiles accounted for approximately 57% of all cable barrier
penetrations. Tractor semi-trailers comprised 13% of the penetration crashes resulting
in critical injuries and fatalities. This finding indicates that in order to truly minimize
the number of injuries and fatalities associated with cable median barriers and cross median
crashes, hardware designers need to develop barriers that can consistently contain large
tractor-trailer vehicles.

Konstrukcje stalowe
885
Table 1. Rollover and Penetration Distributions
Rollover
Penetration
Rollover and Penetration
Vehicle Type
Number
Percent
Number
Percent
Number
Percent
Coupe
5
10%
10
20%
4
18%
Hatchback
0
–
2
4%
0
–
Sedan
12
23%
19
37%
7
32%
Wagon
5
10%
3
6%
3
14%
SUV
14
27%
2
4%
2
9%
Pickup
8
15%
7
14%
3
14%
Van
3
6%
1
2%
0
–
Tractor-Trailer
5
10%
7
14%
3
14%
Sum
52
100%
51
100%
22
100%
When impact conditions were examined for crashes involving rollovers or barrier
penetration, shown in Table 2, the average angle of impact with the cable barrier was found
to be 22°. When tractor-trailer units were excluded from the analysis, the average impact
angle for passenger vehicles was found to be 26 degrees. This average impact angle
for crashes involving cable barrier failure is much higher than the 16 degree average impact
angle associated with serious injury and fatal guardrail crashes that were reported in NCHRP
Report 665.
Table 2. Velocity Vector at Impact by Vehicle Class
Rollover-Only
Penetration-Only
Rollover Plus Penetration
Vehicle Body Type
Crashes Average Max Min Crashes Average Max Min Crashes Average Max Min
Passenger Car
8
26
42
5
20
25
86
4
14
26
54
7
Coupe
1
30
30
30
6
22
35
6
4
27
50
11
Hatchback
0
–
–
–
2
61
86
37
0
–
–
–
Sedan
5
32
42
5
12
21
46
4
7
25
39
7
Wagon
2
10
10
9
0
–
–
–
3
28
54
10
Light Truck/Utility
20
22
56
5
5
47
90
5
5
17
39
8
SUV
12
17
26
5
0
–
–
–
2
12
17
8
Pickup
5
36
56
15
4
58
90
39
3
20
39
8
Van
3
23
34
12
1
5
5
5
0
–
–
–
Tractor-Trailer
2
4
7
1
4
18
29
8
3
10
20
5
Summary
30
22
–
–
29
28
–
–
22
22
–
–
Clearly the safety performance of cable median barriers is more sensitive to impact angle
then are other barrier systems. The 26° average impact angle for cable barrier penetration and
rollover crashes is particularly significant because current crashworthiness evaluation criteria
found in the Manual for Assessing Safety Hardware (MASH) require barrier systems to be
tested at no more than 25 degrees (9). European crash testing standards, published under
EN-1317, utilize a maximum impact angle of only 20 degrees (10). Thus, roughly half
of the cable barrier crashes that could be classified as a barrier failure involved impact angles
greater than any crash test contained in the US or EU safety performance guidelines. Based
upon the impact angles associated with cable barrier penetration and rollover crashes, it is
clear that, if the safety performance of cable barriers is to be materially improved, they must
be subjected to higher impact angles during the evaluation process.
However, it should be noted that roughly half of the cable barrier crashes that could be
considered a failure involved impact angles within the normal range for crash testing.
The effects of vehicle heading angle at impact with the barrier may be an explanation

886
Sicking D. L. i inni: Factors leading to cable median barrier failures
for these failures. As summarized in Table 3, the average vehicle heading angle at impact
for crashes involving rollover and penetration was found to be 42 and 36° respectively. In
both cases, vehicles were steered into the barrier, meaning the drivers lose control as they
steer toward the median. This situation can arise from avoidance maneuvers in the travelway
or oversteering in an attempt to recover from an excursion onto outside shoulder.
Table 3. Velocity Vector, Heading, and Sideslip Angles by Vehicle Type
All Rollover Crashes
All Penetration Crashes
Rollover+Penetration Crashes
Vehicle Body
Type
Velocity
Vector
Heading Sideslip
Velocity
Vector
Heading Sideslip
Velocity
Vector
Heading Sideslip
Coupe
28
89
48
24
40
37
27
107
57
Hatchback
–
–
–
61
104
44
–
–
–
Sedan
28
37
25
23
21
21
25
32
21
Wagon
21
30
12
28
45
17
28
45
17
SUV
16
22
19
12
27
17
12
27
17
Pickup
29
64
34
41
67
29
20
57
37
Van
23
107
55
–
–
–
–
–
–
Tractor-Trailer
8
9
8
13
19
6
10
17
7
Average
22
42
25
26
36
24
23
30
20
Vehicle impact conditions in which the heading angle is not the same as the trajectory
angle involve nontracking vehicles. Nontracking refers to a situation wherein the rear wheels
do not follow behind the vehicle's front tires. An overall evaluation of the highest severity
crash types revealed that the most common impact conditions involved moderately high
trajectory angles (between 20 and 30 degrees) but sliding such that the vehicle contacted
the barrier with a much more head-on orientation. This type of impact condition was most
commonly associated with vehicles having a shallower frontal profile such as sedans,
coupes, and hatchbacks. It is theorized that the sloped frontal structure on these vehicles
produces a vertical prying action that forces the cables apart and allows the vehicle
to penetrate through the system. Vehicles with a deeper front profile such as pickups, and
SUVs appear to be more likely to override cable system. However, this behavior is observed
most often with cable barrier systems that are 27 inches tall or less. Although raising the top
cable seems to be effective at preventing barrier overrides, the accident data still indicates
that these barriers can cause higher CG vehicles such as light trucks to roll over.
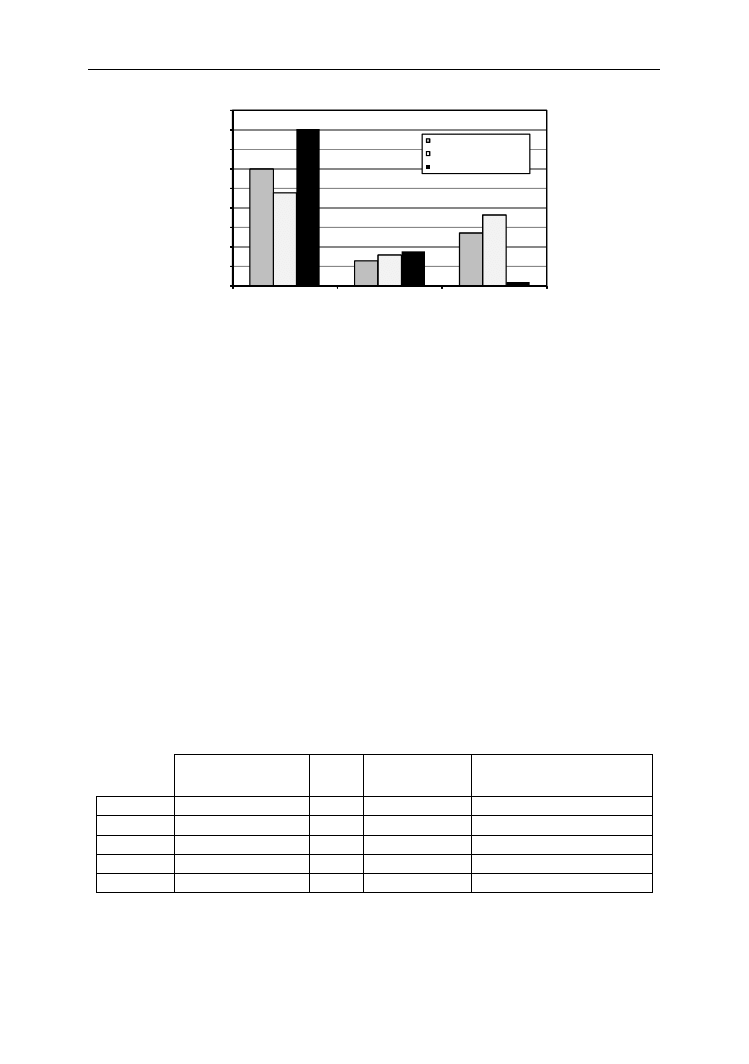
Findings from a study of median barrier warrants in Kansas was compared to accident
data in this study to determine if the rate of barrier penetration was related to the surface
condition of the roadway. As shown in Fig. 22, distributions of cross-median excursions and
crashes in Kansas and the distribution of cable median barrier penetrations in Missouri were
plotted. Roadways were wet when cable median barriers failed to retain vehicles on
the traffic side in Missouri in 18% of crashes, which is comparable to the rate of cross-
median excursions and crashes in Kansas. However, barrier penetrations occurred much less
frequently in icy conditions than in dry conditions in Missouri, while 27% of all cross-me-
dian excursions and 37% of all cross-median crashes occurred in icy conditions in Kansas.
Roadway surface conditions affect both vehicle steering capacity and average travel
speed on roadways. During rainy conditions, vehicles tend to drive more slowly; but when
weather conditions are not inclement but roadways are still wet, travel speeds quickly resume
to npormal. However, on wet roadways, tire-surface friction is decreased. This leads
to the slight increase in the number of wet roadway-related median barrier penetrations
in Missouri.
Konstrukcje stalowe
887
60%
13%
27%
48%
16%
37%
80%
18%
2%
0%
10%
20%
30%
40%
50%
60%
70%
80%
90%
Dry
Wet
Icy
P
e
r
c
e
n
t
o
f
C
r
a
sh
e
s
Roadway Surface Condition
Kansa s Cross-Median Events
Kansa s Cross-Median Crashes
Missouri Ba rrier Penetra tions
Fig. 22. Roadway Surface Condition Dependence on Roadway Departure
However, when snow or ice was present on the roads, the frequency of cross-median
crashes in Missouri was reduced, despite the fact the total number of cable median barrier
crashes increased. Because Kansas and Missouri are adjacent states at nearly the same
latitude, weather conditions in the states are typically very similar. These findings reinforce
the assertions that cable barrier performance is heavily dependent on a combination of vehi-
cle impact speed, velocity vector angle, and vehicle impact orientation. As a result, cable
median barrier penetrations would be more likely in states with lower snowfall and higher
travel speeds, while penetrations may be less likely in states with colder, icy winters and
lower travel speeds.
Crash Severity
Table 4 shows the distribution of crash severity by crash outcome. The most important
observation from this table is that the cable barrier itself was responsible for many
of the serious injury and fatal crashes. In fact, 64.9% of all serious and fatal injury crashes
were associated with vehicles that did not penetrate the barrier. Further, 38% of the fatal and
serious injury crashes involved more or less successful barrier behavior wherein the vehicle
was contained and remained upright during the crash event. Further, the average and 85
th
percentile impact angle for these crashes was found to be 16.5 and 25 degrees respectively,
both of which are similar to crash data for all ran-off-road crashes (3). A review of accident
forms did not identify any common causes of these serious injuries. A more thorough
investigation of these crashes is warranted to determine the causes of injury.
Table 4. Distribution of Serious Injury and Fatality Crashes
Incapacitating Injury Fatality Percent Fatality
% of All Incapacitating Injury
and Fatal
Rollover
46
7
13.2%
46%
Penetration
46
7
13.2%
46%
Both
20
3
13.0%
20%
Neither
44
0
0.0%
38%
Rollover only
26
4
15.4%
25.9%
888
Sicking D. L. i inni: Factors leading to cable median barrier failures
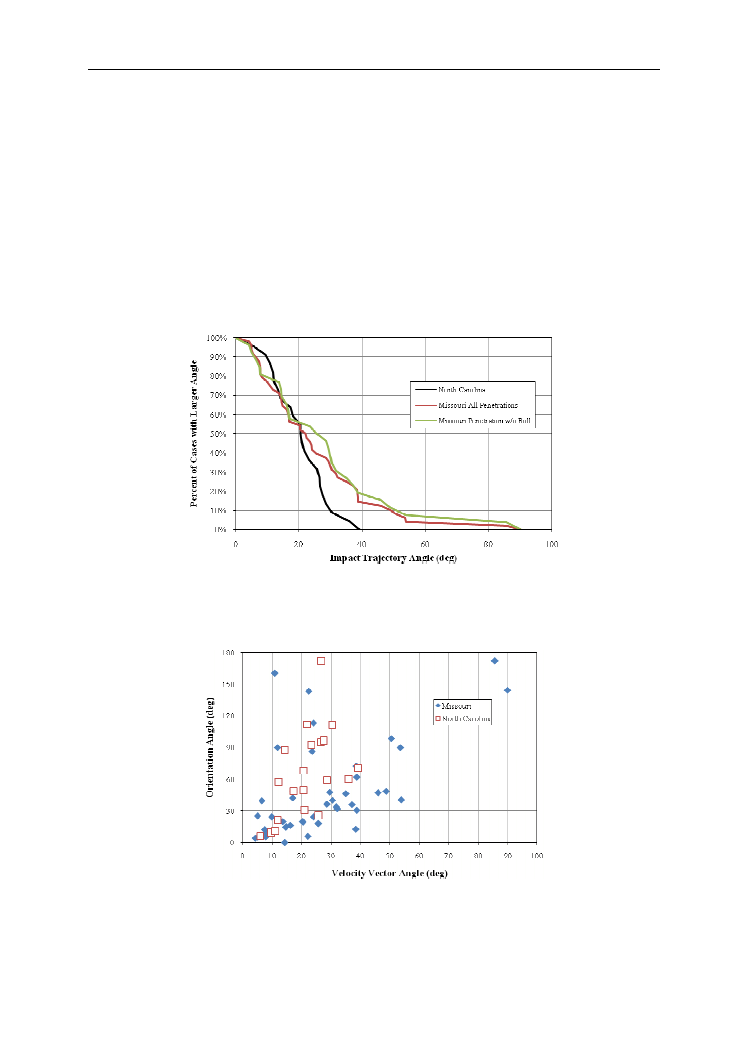
Impact Angle Distributions
Fig. 23 shows vehicle trajectory angle at impact for crashes involving barrier penetration
for both the Missouri and North Carolina data. Note that all of the data shown on this figure
are skewed toward higher impact angles. This is especially true for the Missouri data which
is limited to serious and fatal injury crashes. The 85
th
percentile trajectory angles for all
penetrations were found to be 39 and 28 degrees for Missouri and North Carolina data
respectively. Further, when vehicles rolling over the barrier are eliminated from the MO
data, the 85
th
percentile impact angle for penetration crashes increased to 46 degrees. Note
that the NC data includes many minor injury and PDO crashes that are believed to be
associated with lower speed penetrations that do not reach opposing traffic lanes. When these
cases are removed from the data set its size is reduced below minimum numbers required
to establish an accurate distribution.
Fig. 23. Distribution of impact trajectory angles observed in North Carolina and Missouri data
Velocity vector angles and vehicle orientation angles at impact were plotted simultaneously
to observe trends, and are shown in Fig. 24.
Fig. 24. Velocity vector and orientation angles, penetration impacts
Although there is no clear relationship present, of the 22 penetration crashes in North
Carolina and 51 penetration incapacitating injury or fatality crashes in Missouri, only two
Konstrukcje stalowe
889
crashes in each set had orientation angles less than zero degrees. Furthermore, while
approximately 30% of the data is had a sideslip angle within 5 degrees, an additional 40%
had a sideslip angle more than twice as large as the velocity vector angle.
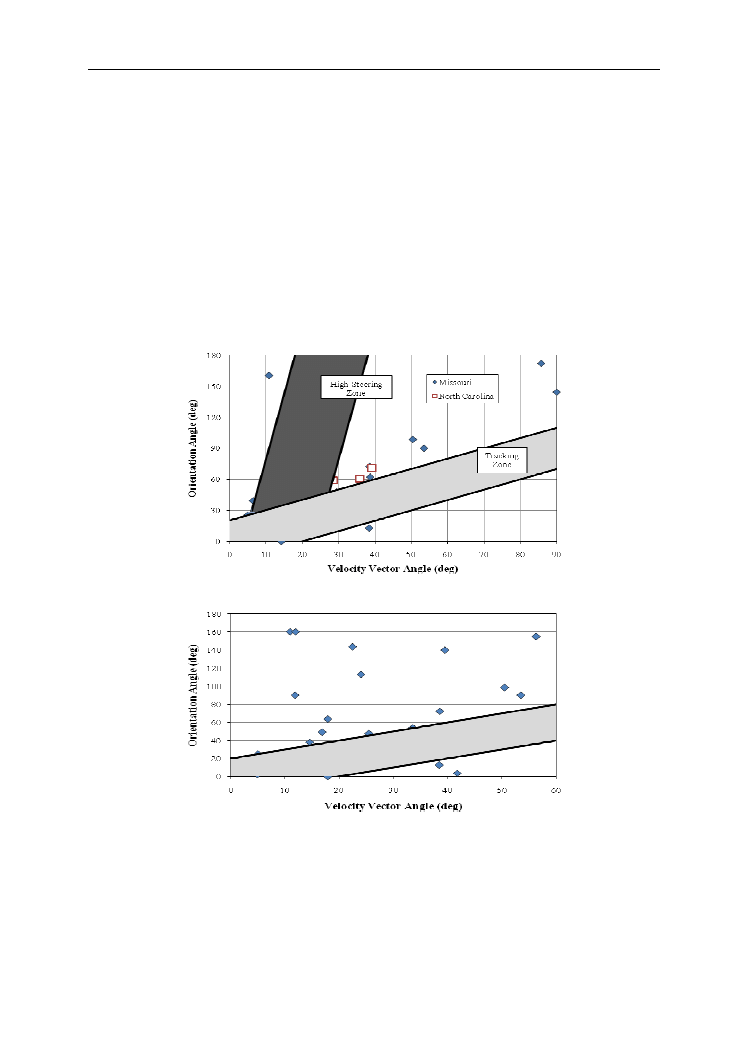
Upon closer investigation, it was observed that a significant portion of the penetration
events could be consolidated into tracking and high-steering zones. The tracking zone was
defined by drawing a line with unit slope and encapsulating all of the data points within the
tracking margin. Vehicles with sideslip angles less than or equal to 20 degrees were
determined to be tracking, based on a variety of control and occupant risk criteria (11).
A total of 57% of the penetration crashes in the North Carolina and Missouri databases were
tracking at impact. Of the non-tracking impacts, 25% were classified as “high-steering”
impacts, based on the vehicle orientation angle at impact with respect to the velocity vector.
In these impacts, vehicles steered into the barrier and were involved in pre-crash high yaw-
rate maneuvers causing the vehicle to “lead” into the barrier with the front end. The remain-
ning 18% of the crashes had varying impact conditions, not described by either distribution.
Fig. 25. Zone partition of velocity vector and orientation angles in penetration crashes
Fig. 26. Velocity vector and orientation angles, rollover crashes
The other high-severity crash type, rollover crashes, was also cross-plotted between
orientation and velocity vector angles. Approximately 54% of all incapacitating injury and
fatality crashes with cable median barriers resulting in rollover in Missouri occurred with
tracking impact conditions. However, of the remaining non-tracking crashes, a pattern
of crash conditions could not be identified. Rollover crashes demonstrated a significantly
larger variation in crash conditions than the penetration crashes.

890
Sicking D. L. i inni: Factors leading to cable median barrier failures
Summary and Conclusions
In summary it was found that cable barrier penetrations and rollover crashes typically
involve high impact angles and high heading angles with the vehicle contacting the barrier
in a more frontal orientation. These findings represent the first objective and statistically signi-
ficant data that can be used by barrier designers to develop more effective median barrier sys-
tems. Further, the accident data indicates that roughly half of the crashes involving barrier fai-
lure have impact angles above normal test conditions and many more of these failures are
related to high heading angle impacts that are also outside of the normal test or evaluation
conditions.
By raising the impact angles for full-scale crash testing to 40°, developers can be assured that
their barrier designs are capable of safely accommodating roughly 85% of the crashes currently
associated with barrier failure. Further, computer modeling can also be used to evaluate barrier
performance during high heading angle impact conditions. The combination of crash testing at
higher angles and evaluating high heading angle impacts through computer simulation should
allow barrier developers to reduce the frequency of barrier failure, measured in terms
of rollovers and penetrations, by at least 50%. As mentioned above, this degree of improvement
in barrier performance could save as many as 250 lives per year by the end of this decade.
References
1. Evaluation of Cable Median Barrier Performance in Missouri. Missouri Department of Transpor-
tation (in progress).
2. Sicking, D.L., F.D.B. Albuquerque, K.A. Lechtenberg, and C.S. Stolle. "Guidelines for Implemen-
tation of Cable Median Barrier". Transportation Research Record No. 2120, Transportation
Research Board, Washington, D.C., 2009, p. 82÷90.
3. Mak, K.K., D.L. Sicking, and B.A. Coon. Identification of Vehicle Impact Conditions Associated
with Serious Ran-off-Road Crashes. National Cooperative Highway Research Report No. 665,
Transportation Research Board, Washington, D.C., 2010.
4. Graf, V.D., and N.C. Wingerd, Median Barrier Warrants. California Department of Public Works,
Sacremento, 1968.
5. Nystron, K. Median Barrier Study Warrant Review – 1997. Report CALTRANS-TE-97-02.
California Department of Transportation, Sacremento, 1997.
6. Hiss, J.G.F. Jr., and J.E. Bryden. Traffic Barrier Performance. New York Department
of Transportation, May 1992.
7. Ray, M.H. and J.A. Weir. In-Service Performance Evaluation of Post-And-Beam Guardrails
in Connecticut, Iowa, and North Carolina. Worcester Polytechnic Institute, February 28, 1999.
8. Ross, H.E. Jr., D.G. Smith, D.L. Sicking, and P.R. Hall. Development of Guidelines for Placement
of Longitudinal Barriers on Slopes. Transportation Research Report No. 3659-2, Texas
Transportation Institute, May 1983.
9. Sicking, D.L., K.K. Mak, J.R. Rohde, and J.D. Reid. Manual for Assessing Safety Hardware.
American Association of State Highway Transportation Officials, Washington, D.C., 2009.
10. European Standard EN 1317-1, Road Restraint systems – Part 1: Terminology and general criteria
for test methods. European Committee for Standardization EN 1317-1:1998 E, Swedish Standards
Institution, March 1998.
11. Stolle, C.S., Bohlken, J.C., Lechtenberg, K.A., and Sicking, D.L., „Recommended Impact
Conditions for Side-Impact and Non-Tracking Testing”, Presented at the 90th Annual Meeting
of the Transportation Research Board, January 25, 2011.
Wyszukiwarka
Podobne podstrony:
Mankiewicz Boczek, J i inni Bacteria homologus to Aeromonas capable of microcystin degradation (201
scenariusz 5 wydawnictwo 16, szkolne, Język polski metodyka, To lubię, To lubię - scenariusze
Events Leading To the American Revolution
kłopotliwe, o grzechu inaczej, Czy muszę się spowiadać z czegoś, czego nie uważam za grzech, a inni
edc 16 ECU 100ps converter Nm to IQ
edc 16 ECU 100ps converter Nm to IQ
Mechanisms Leading to a Fall From an Induced Trip
16 clutch system cable
prawo cywilne, 16. Uzytkowanie wieczyste, Nieruchomość to jeden z rodzajów rzeczy w rozumieniu prawa
Radosna Niepodległości, teksty 16. Jak to na wojence ładnie (tekst)
16 Jak to na wojence ładnie (tekst)
V rok egzamin psychiatria 2011 termin I, V rok, Psychiatria, 2015-16, psychiatria giełdy zrobione, p
scenariusz nr 16 wydawnictwo 34, szkolne, Język polski metodyka, To lubię, To lubię - scenariusze
Jak TO robią inni, smieszne teksty
Konspekt prezentacji #16 Neurolinguistic Factors
Radosna Niepodległości, nuty 16. Jak to na wojence ładnie (nuty)
lecture 16 from SPC to APC
The Temperance Movement Steps Leading up to Prohibition
MIKROPRO, Mikroprocesory 8086 i 8088 nale˙˙ do jednych z pierwszych 16-to bitowych procesor˙w. Ich l
więcej podobnych podstron